Article

Environmental Risk Assessment for PM2.5 Pollution from Non-Point Sources in the Mining Area Based on Multi-Source Superposition and Diffusion

1
Energy and Environmental Engineering College, University of Science and Technology Beijing, Beijing 100083, China
2
Beijing Key Laboratory of Resource-Oriented Treatment of Industrial Pollutants, Beijing 100083, China
3
Technical Centre for Soil, Agriculture and Rural Ecology and Environment, Ministry of Ecology and Environment, Beijing 100012, China
*
Author to whom correspondence should be addressed.
Sustainability 2021, 13(12), 6619; https://doi.org/10.3390/su13126619
Submission received: 8 March 2021 / Revised: 20 May 2021 / Accepted: 1 June 2021 / Published: 10 June 2021
(This article belongs to the Special Issue Monitoring and Control of Environmental Hazards)

Abstract

:
To identify high-concentration contributing sources and highly dispersive pollution sources of fine particulate matter, analyze the relationship between the location and distribution shape of emission sources and the concentration contribution and dispersion of particulate matter, and realize the atmospheric environment risk simulation and the differential control of non-point sources in the mining area, taking a large mining area in Inner Mongolia as an example, we classified the emission sources of PM2.5 (particulate matter less than 2.5 μm) and complied with the emission inventory. A CALPUFF model was used to simulate the contribution for the PM2.5 concentration of six types of emission sources and a multi-source superposition. Through scenario simulation, we analyzed the relationship between the spatial distribution of emission sources and the emission concentration and diffusion in a large mining area. We analyzed the relative risks of six types of sources under the influence of other superimposed sources and the change of emission concentration during transmission. We established a three-dimensional evaluation model to assess the atmospheric environmental risk of PM2.5 non-point sources in the mining area, considering the change rate of PM2.5 concentration with migration, the relative contribution ratio of superimposed sources, and the equal contribution index of the standard concentration. The results show that the maximum equal contribution index of standard concentration of multi-source superposition was 4.40. Among them, non-paved roads, exposed surface sources of coal piles, and exposed surface sources of mine pits and dumps were the top three pollution contributors, and their maximum equal contribution indexes of standard concentration were 2.40, 2.21, and 2.10, respectively. The effect of superimposed pollution sources was affected by the wind field and the spatial distribution density of emission sources, while the dispersion was affected by the wind direction and the distribution direction of pollution sources. In the case of the same source intensity and emission area, the denser the source distribution was, the higher the emission concentration was, the smaller the contribution ratio of superimposed sources was, and the greater the relative pollution risk was. When the angle between the direction of dispersed linear pollution sources and the dominant wind direction was smaller, the emission concentration was higher, but the diffusion surface was smaller. When the angle with the direction of wind direction was larger, the emission concentration was lower, but the diffusion surface was larger. Concentrated pollution sources had the highest concentration and the diffusion surface was in the middle. Non-paved roads had the highest environmental risk, with an average risk of 5.61 × 10⁻², followed by coal piles with an average value of 2.06 × 10⁻², followed by pits and dumps with an average value of 1.89 × 10⁻²; the environmental risk of loading and unloading sources was the lowest. Unpaved roads were pollution sources with high relative pollution risk and diffusion risk, and their average relative pollution risk and diffusion risk were 2.34 × 10⁻² and 3.28 × 10⁻², respectively. In the case of multi-source superposition, the high-risk areas were mainly heavily polluted areas with intensive emission sources, while the medium-risk areas were moderately polluted areas with scattered pollution sources, and the diffusion risk was high. This research concludes that the dispersed distribution of pollution sources can reduce pollution risk, and the smaller the angle is between the linear distribution direction of pollution sources and the dominant wind direction, the smaller the diffusion risk is. Therefore, differentiated control can be carried out according to the characteristics of pollution sources. The conclusions can provide methods and theoretical support for the control of atmospheric environment risk, pollution prevention, and control planning in mining areas.

1. Introduction

There are many large-scale mining areas in northern China, and the emissions of various sources of particulate matter in open-pit mining areas has a complex impact on the formation of haze and dust in Beijing, Tianjin, Hebei, and other central regions [1,2]. In particular, non-point sources are difficult to control, with low control efficiency, high pollution risk, and great health hazard [3,4,5]. At present, a “one-size-fits-all” control approach is mostly adopted. The existing particulate matter risk assessment mostly takes the particulate matter concentration as the risk source and the population as the risk receptor to evaluate the exposure health risks [6,7,8,9,10]. In traditional risk assessments, all types of non-point sources in the study area have been used as a whole for simulation, which fails to consider the differences in the migration and diffusion rules of particles emitted by different non-point sources [11,12,13], or only the pollution sources within the study area are taken as the object, ignoring the overlapping risks that are caused by scattered and non-point sources around the research object. Therefore, calculating the relative contribution and dispersion of PM2.5 (particulate matter less than 2.5 μm) among multiple types and quantities of emission sources, and analyzing the relationship between the spatial distribution of pollution sources and the emission concentration and dispersion of PM2.5 will improve the accuracy of atmospheric environmental risk assessments, and provide a basis for differentiated management of pollution sources.
In addition, there has been no unified standard for emission inventory of particulate matter in mining areas. Currently, the AP-42 formula recommended by the US Environmental Protection Agency (EPA) is widely used [14,15], or the empirical formula obtained through field wind tunnel experiments is [16,17,18,19], the accuracies of which are varying [20,21,22]. In 2014, the Ministry of Environmental Protection of the People’s Republic of China compiled the “Technical Guideline for the Preparation of Emission Inventory of Particulate Matter from Dust Sources (Trial) (Technical Guideline for short)”, which is more suitable for China’s reality [23,24,25]. Therefore, taking a large mining area in Inner Mongolia as the research object, and regarding the Technical Guideline, we classified the emission sources of PM2.5 into paved roads, non-paved roads, loading and unloading, coal piles, quarries, and wind erosion on the exposed surface of mine pits and dumps, and then compiled PM2.5 emission inventory. Based on the CALPUFF model [26,27,28,29], we performed a superposition of six sources in the simulation (multi-source superposition) and six types of single-source simulations, respectively. By constructing three indices, namely, the equal contribution index of standard concentration, the relative contribution ratio of superimposed sources, and the change rate of PM2.5 concentration with migration, we calculated and evaluated the relative pollution risk and diffusion risk of the PM2.5 of various pollution sources, as well as the overall environmental risk of multi-source superposition to identify the high-risk sources and get the spatial distribution of PM2.5 environmental risk. Based on this, we divided the environmental risks into zones and proposed control schemes to avoid a one-size-fits-all control and achieve differentiated management.

2. Methodology

2.1. The Research Area

The research area is located in Etoke Banner, Ordos City, Inner Mongolia, and has the characteristics of a large mining area in the west. The research scope is shown in Figure 1. The mining area is located in arid and semi-arid areas, which have a typical temperate continental climate, with the characteristics of sharp changes of cold and heat on the plateau, long sunshine hours, and intense solar radiation. Precipitation is low and concentrated, evaporation is extensive, the wind is strong, sand is abundant, natural vegetation is sparse, and ecological regulation ability is weak. Specific meteorological conditions are shown in Table S1. Meteorology contributes to the dust formation and diffusion of particulate matter and is not conducive to environmental governance. Moreover, frequent development activities can easily cause severe particulate pollution. Thus, it is necessary to control the emission sources of particulate matter in mining areas. The locations of the ground weather station (WS) and three monitoring points (MS1, MS2, and MS3) are shown in Figure 1. The three monitoring points observed the PM2.5 concentration in the mining area.

2.2. Compilation of Particulate Matter Emission Inventory

For this paper, we selected the emission factor method, modified the calculation formulas and parameters according to the Technical Guideline, and combined it with the survey data to obtain the emission factors and activity levels of particulate matter from each pollution source in the mining area, and realize the localization of emission inventory. The calculation is shown in Equation (1).
W i = E i × A i × 1 - η W t = i = 1 n W i
In the formula, Wi is the dust emission of emission source i; Ei is the emission coefficient of the unit activity level corresponding to emission source i; Ai is the activity level factor of dust source i; η is the removal efficiency of the pollution control technology on the dust; n is the number of emission source types; Wt is the total particulate emissions from dust sources.
Based on various literature studies [6,14,16,30,31] and field investigations, there are many dust emission sources in mining areas. Their characteristics are generalized into 3 categories: road transport dust sources, exposed surface dust sources, and material loading and unloading dust sources (see Table 1). The short-term particulate matter emission sources, such as drilling and blasting, topsoil removal, and material transfer, were uniformly classified as the material loading and unloading dust sources, and the particulate matter emissions were converted into the corresponding material loading and unloading volumes. The parameter values [23,24,32] are shown in Tables S2 and S3. We allocated the inventory to a specific space according to land use types and field operations based on remote sensing interpretation and positioning [33,34,35].

2.3. Model

2.3.1. Model Setup and Simulation

The CALPUFF is an unsteady Lagrangian puff model that simulates pollutant migration, transformation, and removal in three-dimensional spatially and temporally variable meteorological conditions. The basic concentration equation of a single puff at a certain acceptance point is shown in Equation (2).
C = Q 2 π σ x σ y g exp d a 2 / ( 2 σ x 2 ) exp d c 2 / ( 2 σ y 2 ) g = 2 σ z 2 π n = exp ( H e + 2 n h ) 2 / ( 2 σ z 2 )
where C is ground concentration, g/m2; Q is the source intensity; σx, σy, and σz are diffusion coefficients; da is the downwind distance; dc is the transverse distance; He is the effective height; h is the height of the mixing layer; g is the vertical term of the Gaussian equation, which solves the problem of multiple reflections between the mixing layer and the ground. The model consists of a weather processor (CALMET), a dispersion model (CALPUFF), and a post-processor (CALPOST). The CALMET model is a weather model that generates a three-dimensional hourly wind field within a three-dimensional grid modeling domain. The CALPUFF model was used to simulate the PM2.5 concentration emitted from pollution sources in 2018, from 1 January to 31 December. The data sources and parameter settings are shown in Table S4.
For the CALMET simulations, the vertical discretization consisted of 11 layers that were 0 m, 20 m, 40 m, 80 m, 160 m, 320 m, 640 m, 1200 m, 2000 m, 3000 m, and 4000 m above the land surface. The model parameters BIAS, RMAX1, RMAX2, TERRAD, R1, and R2 were selected according to the specific site. The BIAS parameter assigns weights to the ground and upper air station data for each vertical layer. The surface data gives 100% weight (BIAS = 1) in the first layer and 0 weight (BIAS = 1) in the last 2 vertical layers. Equal weight was assigned to the fourth layer (BIAS = 0) with a gradation of weights between the lower and upper for the remaining layers. The TERRAD parameter defines the influence radius of the terrain features and is set to 10 km. The parameters RMAX1 and RMAX2 define the maximum influence radii for the surface and upper data over the land surfaces, and were set to 50 km and 100 km, respectively. The parameters R1 and R2 are the distances from the observation, where the weight of the observation and the initial prediction field to the surface and upper layer is equal. R1 and R2 were set to 18 km and 54 km, respectively. For the remaining parameters, we used the CALMET default values.
MS1, MS2, and MS3 monitor the average daily concentration of PM2.5. The monitoring periods are shown in Table 2. The model was simulated 5 times and was verified by the daily mean concentration data of PM2.5 monitored by MS1, MS2, and MS3 (for a total of 12 days). Then, we screened out the meteorological conditions for the maximum probability of pollution in the mining area and used the CALPUFF to simulate the PM2.5 concentration emitted by 6 types of dust sources and multi-source superposition.

2.3.2. Verification of Simulation

The accuracy of the model was evaluated by 6 indices [20,36,37], namely FB (fractional bias), MG (geometric mean bias), VG (geometric variance), R2 (coefficient of determination), NMSE (normalized mean square error), and FAC2 (fraction of two). The calculation formulas and evaluation criteria are shown in Table 3. FB is a measure of the average deviation. A FB of 0.6 is equal to 2 times that of the under-prediction of the model, and a negative value indicates over-prediction of the model. The MG reflects the deviation degree of the geometric mean, and the values of 0.5 and 2.0 represent a factor of 2 over-prediction and under-prediction, respectively. The NMSE is a measure of the opposite difference, and a value of 1.0 indicates that the typical difference between the prediction and observation is approximately equal to the mean. The NMSE and FB are appropriate when the typical difference between the prediction and observation is about a factor of 2 and the range of prediction and observation in the data set is small (a factor less than 2). A VG value of 1.6 indicates a difference of 2 values between the predicted data and the observed data. The FB and MG are measures of mean relative deviation and represent only systematic errors, while the NMSE and VG are measures of mean relative scattering and reflect systematic and non-systematic (random) errors. The FAC2 is the most reliable measurement, reflecting the percentage of the predicted concentration within the range of the two observation factors.

2.4. Analysis of Dust Particle Distribution and Spatial Transport Laws from Pollution Sources in Multi-Scale Mining Areas

Based on the simulation, we first analyzed the spatial distribution law of PM2.5 from each single source, and examined the spatial distribution law of PM2.5 from multi-source superposition. Then, we analyzed the risk value changes of each single source before and after superimposed by multiple sources. We calculated the PM2.5 concentration change rate from each single source with the increase of transport distance. There were 3 indices, namely the equal contribution index of standard concentration Iij, the relative contribution ratio of superimposed sources rij, and the change rate of PM2.5 migration concentration kij, that were used to characterize the contribution of PM2.5 concentration, the increasing/reducing effect of superimposed sources on air pollution risk, and the spatial variation of PM2.5 concentration. The calculation formulas are shown in Table 4.
When Iij > 1, the higher the equal contribution index of standard concentration is, and the more the PM2.5 concentration exceeds the standard. The larger the rij is, the smaller the pollution risk of this single source i is compared with other pollution sources. When the rij is smaller, the relative pollution risk of the single source i pollution source is larger. Considering the relative contribution ratio of superimposed sources can identify the sources with a high contribution ratio of concentration. The change rate of PM2.5 concentration will be affected by the surrounding pollution source distribution, terrain, wind direction, and other factors. kij’ represents the change rate of PM2.5 concentration emitted from the pollutant source i with migration at position j. When kij’ > 0, for the same pollution sources, the larger kij’ is, the faster PM2.5 concentration decays with diffusion distance, the smaller the transmission distance is, and the diffusibility decreases accordingly.

2.5. Air Pollution Risk Assessment and Management

Taking into account the concentration emitted from pollution sources, the relative contribution ratio of superimposed sources, and the change rate of PM2.5 concentration emitted from the pollutant source, the PM2.5 environmental risk assessment was carried out using the following methods:
R ( E i j ) = R ( P i j ) + R ( D i j ) R ( P i j ) = I i j ( 1 r i j ) R ( D i j ) = I i j ( 1 k i j )
R(Eij) represents the PM2.5 environmental risk at the location j caused by pollution source i. R(Pij) represents the relative PM2.5 pollution risk at the location j caused by pollution source i. When the Iij is larger, the rij is smaller, and the contribution proportion of concentration is larger, so the relative pollution risk is higher. R(Dij) represents the PM2.5 diffusion risk at the location j caused by pollution source i, and it depends on the emission concentration and the change rate of PM2.5 concentration with migration. When Iij is fixed, kij’(h) > 0, the smaller kij’(h) is, the larger the migration and diffusion distance is, and the higher the diffusion risk is.
The risk values were graded, the risk areas were divided, and the corresponding control methods were proposed.

3. Results and Discussion

3.1. PM2.5 Emission Inventory Calculation and Spatial Distribution

The PM2.5 emission inventory is shown in Table 5. According to the proportion of PM2.5 emission intensity, the emission sources were sorted as non-paved roads > coal piles > mine pits and dumps > paved roads > quarries > loading and unloading. Among them, the proportion of non-paved roads was 64.64%. According to the coal mine operation sites, the pollution sources were distributed in strips, concentrated in the west and southwest of Zhuozishan Mountain. There were 38 area sources and 6 linear sources (Figure 2). The highest contribution came from non-paved roads, which is similar to previous studies. Huertas et al. [14,38,39] all showed that unpaved roads were the primary source of emissions, with PM2.5 emissions accounting for 78.4%, 34%, and 60% of the total emissions, respectively, followed by transmission, loading and unloading, wind erosion, and other activities. The second major contribution source in this study was wind erosion on the surface of the coal piles. Due to different mining properties, geological conditions, management, mining technologies, and climatic conditions, the PM2.5 emissions emitted from the same activity will vary; still, on the whole, unpaved transportation was the main emission source.

3.2. PM2.5 Concentration Distribution Simulation

The linear relationship between the daily mean concentration of PM2.5 at the monitoring points and the simulated values is shown in Figure 3. The calculations of the evaluation indexes are shown in Table 6. Since the average daily PM2.5 concentration monitored occurred in discrete discontinuous days, the index calculations were aggregated. The data of the three monitoring points all showed good consistency, and the average FVC2 value reached 100%. The FB ranged from 0.08 to 0.31, with an average of 0.19; the MG ranged from 1.09 to 1.29, with an average of 1.2. The FB and MG showed that the difference between the predicted value and the monitored value was within the acceptable range, but the predicted value was underestimated. The slope of the scatter plot also proved this. This is most likely because the emission inventory did not include all pollution sources. Among them, MS2 had the largest deviation, probably because it was near the road and had a large traffic flow, leading to secondary dust emergence, which was not taken into account in the emission inventory. The VG and NMSE were also within the acceptable range. The VG of MS2 was 1.11, and the NMSE was 0.1, both of which were the highest values. This may be because the emission inventory did not consider the changes in a time series. However, in practice, the emission intensity of PM2.5 sources was constantly changing in the heating season and non-heating season and in different periods of the day. MS2 was located near the road sources, and the emission intensity of the pollution source fluctuated at a high frequency, so the deviation was large. MS3 was located near the quarries, with fewer pollution sources and stable emission intensity, so there was little interference. MS1 was located in an area with dense pollution sources, and the intensity variation of surrounding pollution sources could cause deviation of the simulation, so the R2 was low. In addition, errors in the model itself could also lead to bias. Overall, the inventory and the model apply to the PM2.5 concentration simulation of the non-point sources in the study area, and the simulation can be used for a pollution risk assessment.
We selected the typical meteorological day to simulate the daily mean concentration and make an environmental risk assessment. The typical meteorological day is the one with the heaviest pollution under the most common weather conditions. The statistics of regional meteorological data in 2018 showed that the dominant wind direction was WNW and the average wind speed was 3.39 m/s (Table S5). The most serious PM2.5 pollution period was concentrated in December, and the maximum concentration occurred in the condition of atmospheric stability D. We selected December 3 as the typical meteorological day (Table 7), and the atmospheric stability grade of this day is D.

3.3. Concentration Contribution of Pollution Sources and Analysis of PM2.5 Spatial Distribution Law

3.3.1. Concentration Contribution of Single Pollution Sources

The equal contribution indexes of standard concentration of six types of emission sources are shown in Figure 4. The PM2.5 concentration distribution is significantly affected by the wind direction and spreads to the southeast, and the concentration contributions of six sources mainly depend on the emission intensities and the total emissions. The non-paved road source was the primary contribution source, followed by the exposed surface source of coal piles, and then the exposed surface source of mine pits and dumps, the maximum equal contribution indexes of which were 2.40, 2.21, and 2.10, respectively. The areas exceeding the standard were mainly concentrated near the emission sources, and the maximum equal contribution indexes of the other emission sources were all less than 1. The maximum equal contribution index of the multi-source superposition was 4.40.
Combined with the distribution of pollution sources, we found that the PM2.5 concentration emitted by some dispersed high-intensity sources was lower than that of dense low-intensity sources. Ghannam [40] also mentioned that the difference in geometric shape and spatial distribution of pollution sources do not allow for correlation between emission magnitudes and contribution to ambient pollutant concentrations. In order to further clarify the relationship between the spatial distribution of pollution sources and emission concentration, we selected one of the coal piles and set three scenarios. Among them, the total area, emission intensity, altitude, emission height, and other conditions of pollution sources were all the same (Table S6), but the distribution of pollution sources ranged from dense to sparse (see Figure 5). The simulation showed that in terms of the maximum equal contribution index of standard concentration, Scenario 1, Scenario 2, and Scenario 3 were 3.68, 1.18, and 0.63 respectively, and the over standard areas of Scenario 1 and Scenario 2 were 8km2 and 6km2, respectively. It shows that the more concentrated the pollution sources are, the higher the maximum ground concentration will be, and the larger the area exceeding the standard will be under the same source intensity and emissions. This is because the overlapping degree of the diffusion surface from each sub-pollution source becomes higher. Dispersed pollution sources can reduce pollution levels.
In addition, we found that when the concentration contributions of the six types of sources were summed on the spatial grid chart, the result was basically equal to the emission concentration in the multi-source superposition scenario. Unlike CFD (Computational Fluid Dynamics) [41,42], CALPUFF is not a model based on particle simulations and does not take into account particle interference from different sources [43], so in a scenario with the same source intensity and source distribution, the simulations at the same point have a linear superposition law [40]. However, in the actual situation, fine particles emitted from multiple non-point sources will collide or agglomerate in the diffusion process due to turbulent diffusion, molecular diffusion, electrostatic attraction, chemical transformation, and other reasons, and interfere with each other, so the particle diffusion path is different from that of single-source emissions [44,45,46,47]. The emission concentration after the multi-source superposition may be smaller than the direct arithmetic summation of single sources. Therefore, when the equal contribution index of the standard concentration of the multi-source superposition is larger, the actual risk may be smaller than the calculation.

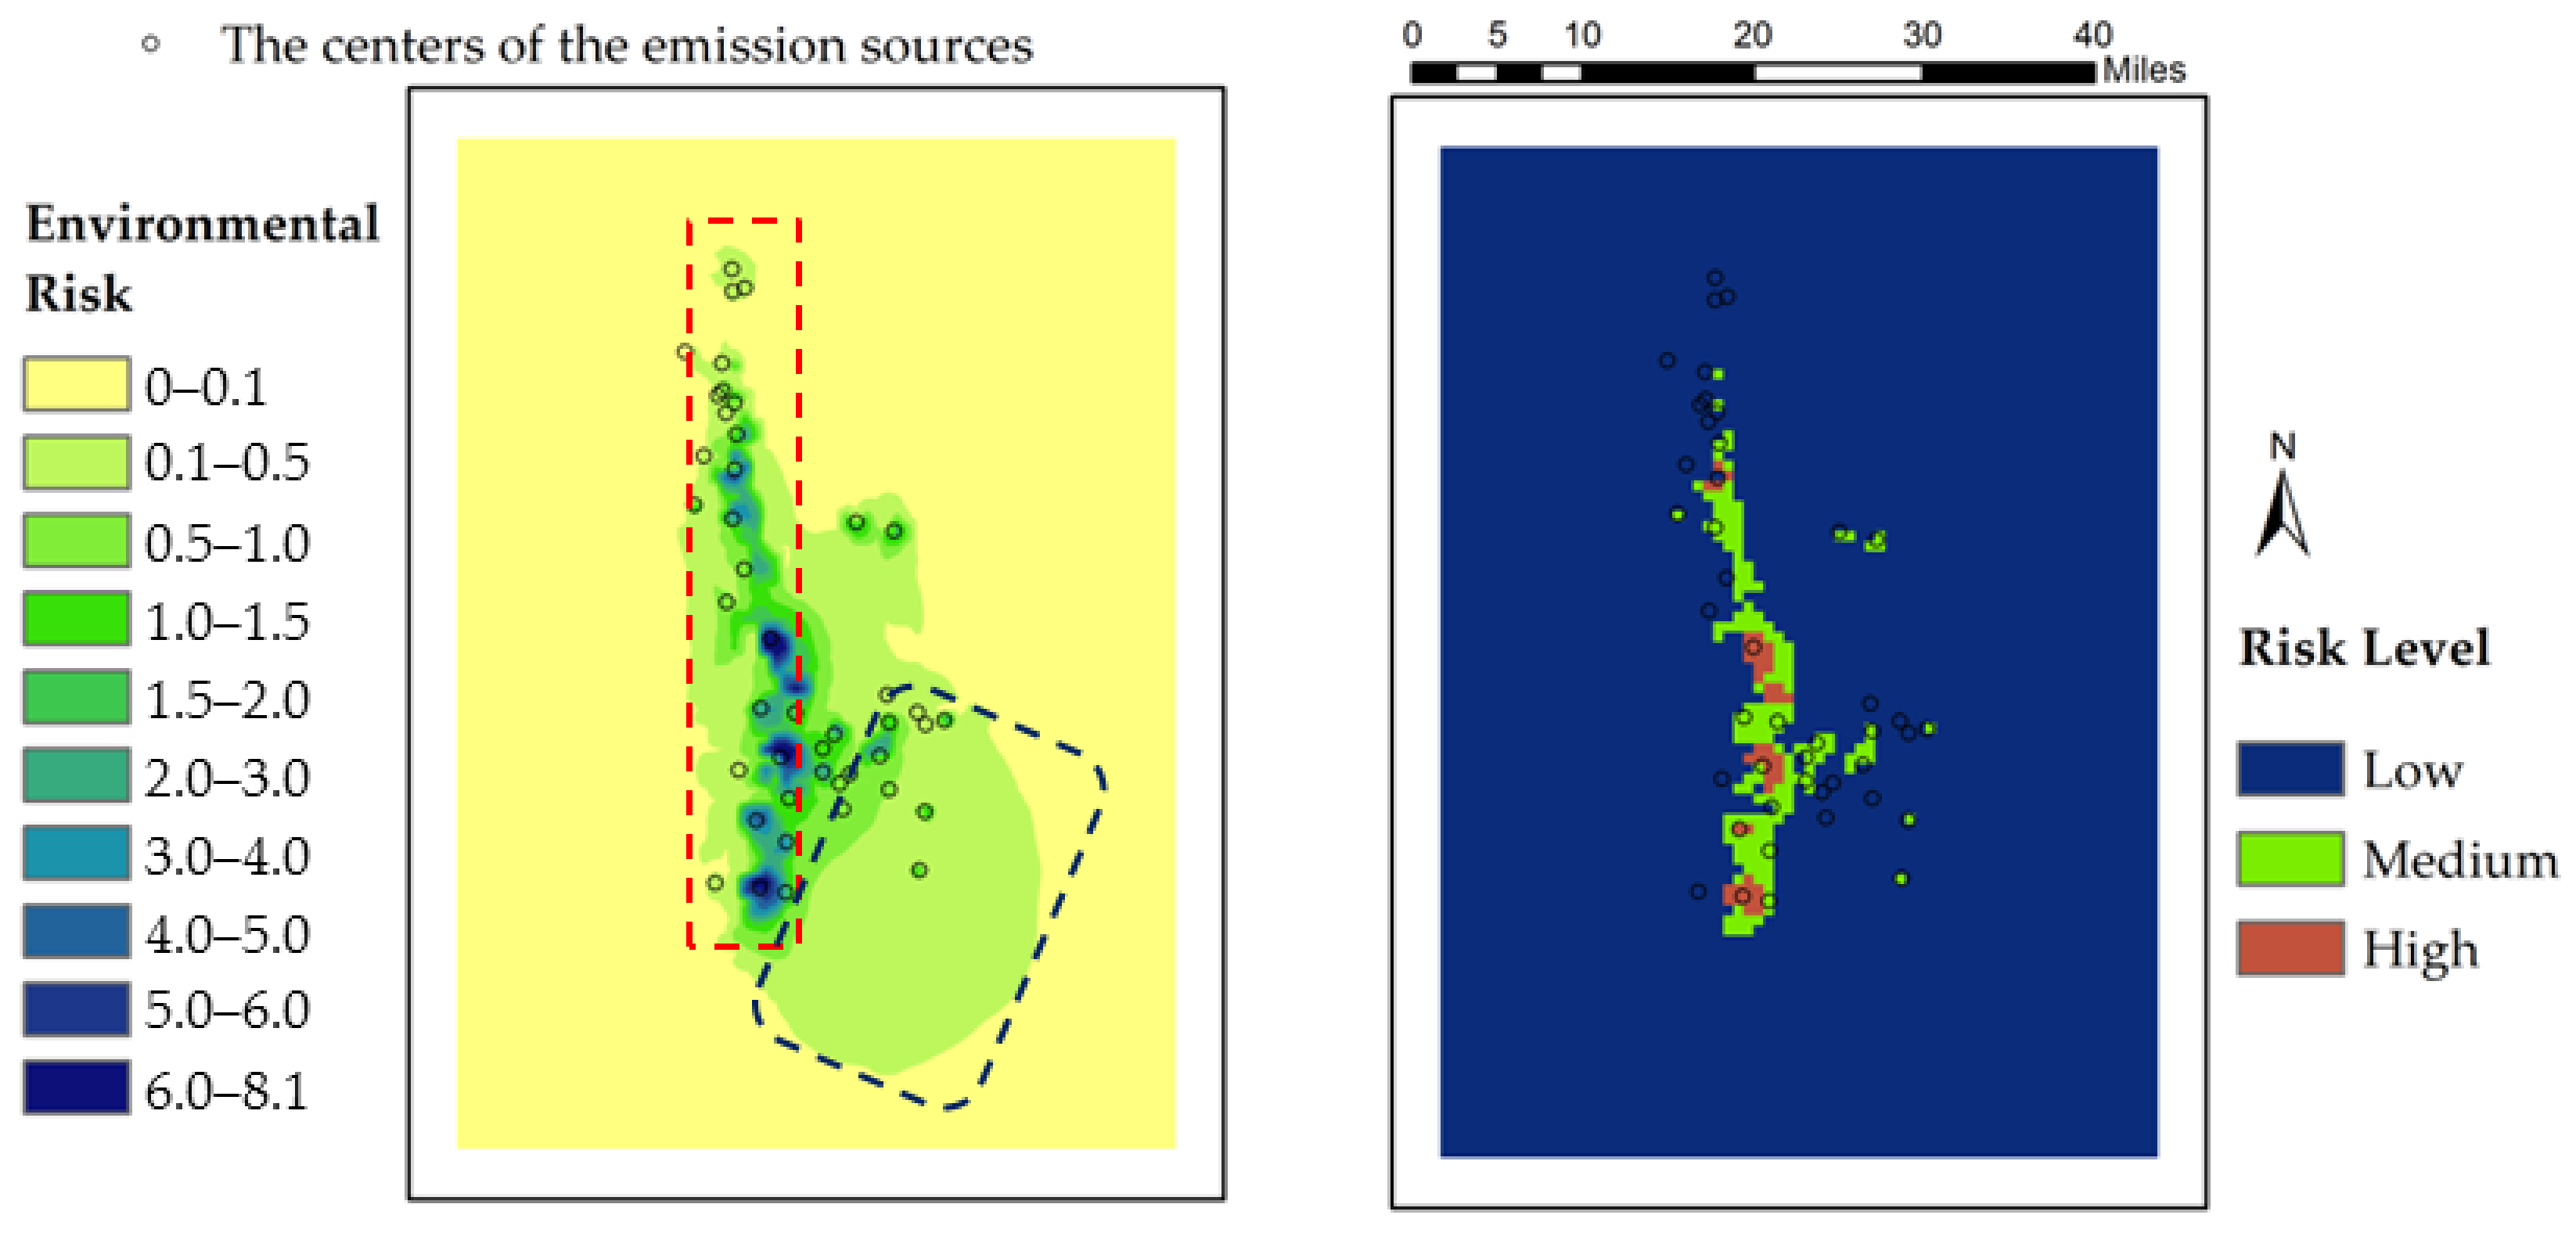
3.3.2. Relative Pollution Risk after the Multi-Source Superposition

The relative contribution ratios of superimposed sources for six types of sources are shown in Figure 6. The primary relative pollution risk contribution source was non-paved road sources, with an average value of 2.34 × 10⁻² and a maximum value of 1.46. The least was the loading and unloading source, with an average value of 2.86 × 10⁻⁶ and a maximum value of 1.92 × 10⁻⁴. Concentrated sources with the same source intensity and emissions are more likely to have high pollutant concentrations, so the pollution risk is higher than that of dispersed sources. On the whole, the order of the relative risk of the six sources was consistent with the order of concentration contribution. However, for the proportion of the relative pollution risk of the single sources, unpaved roads and quarries increased by 15.5% and 1.0%, while the other sources decreased, compared with the absolute pollution risks without superimposed sources. This is because the source intensity and emission area of non-paved roads were the largest among the six types of pollution sources, so the concentration contribution ratio was the highest. Although the overall concentration level of the quarries was low, it was in the upwind direction, and there were few other disturbing pollution sources in the region. Therefore, the relative contribution ratio of the quarries to PM2.5 concentration in the region was higher than that of other pollution sources, and the risk increases accordingly. For multiple sources, it is more practical to calculate the relative pollution risk in a certain meteorological condition than the absolute pollution risk of a single source. When the influence of other superimposed sources is considered in the relative pollution risk assessment, the risk of high contribution sources in the low-concentration pollution area is increased, and the risk of low-contribution sources in the high-concentration pollution area is reduced.

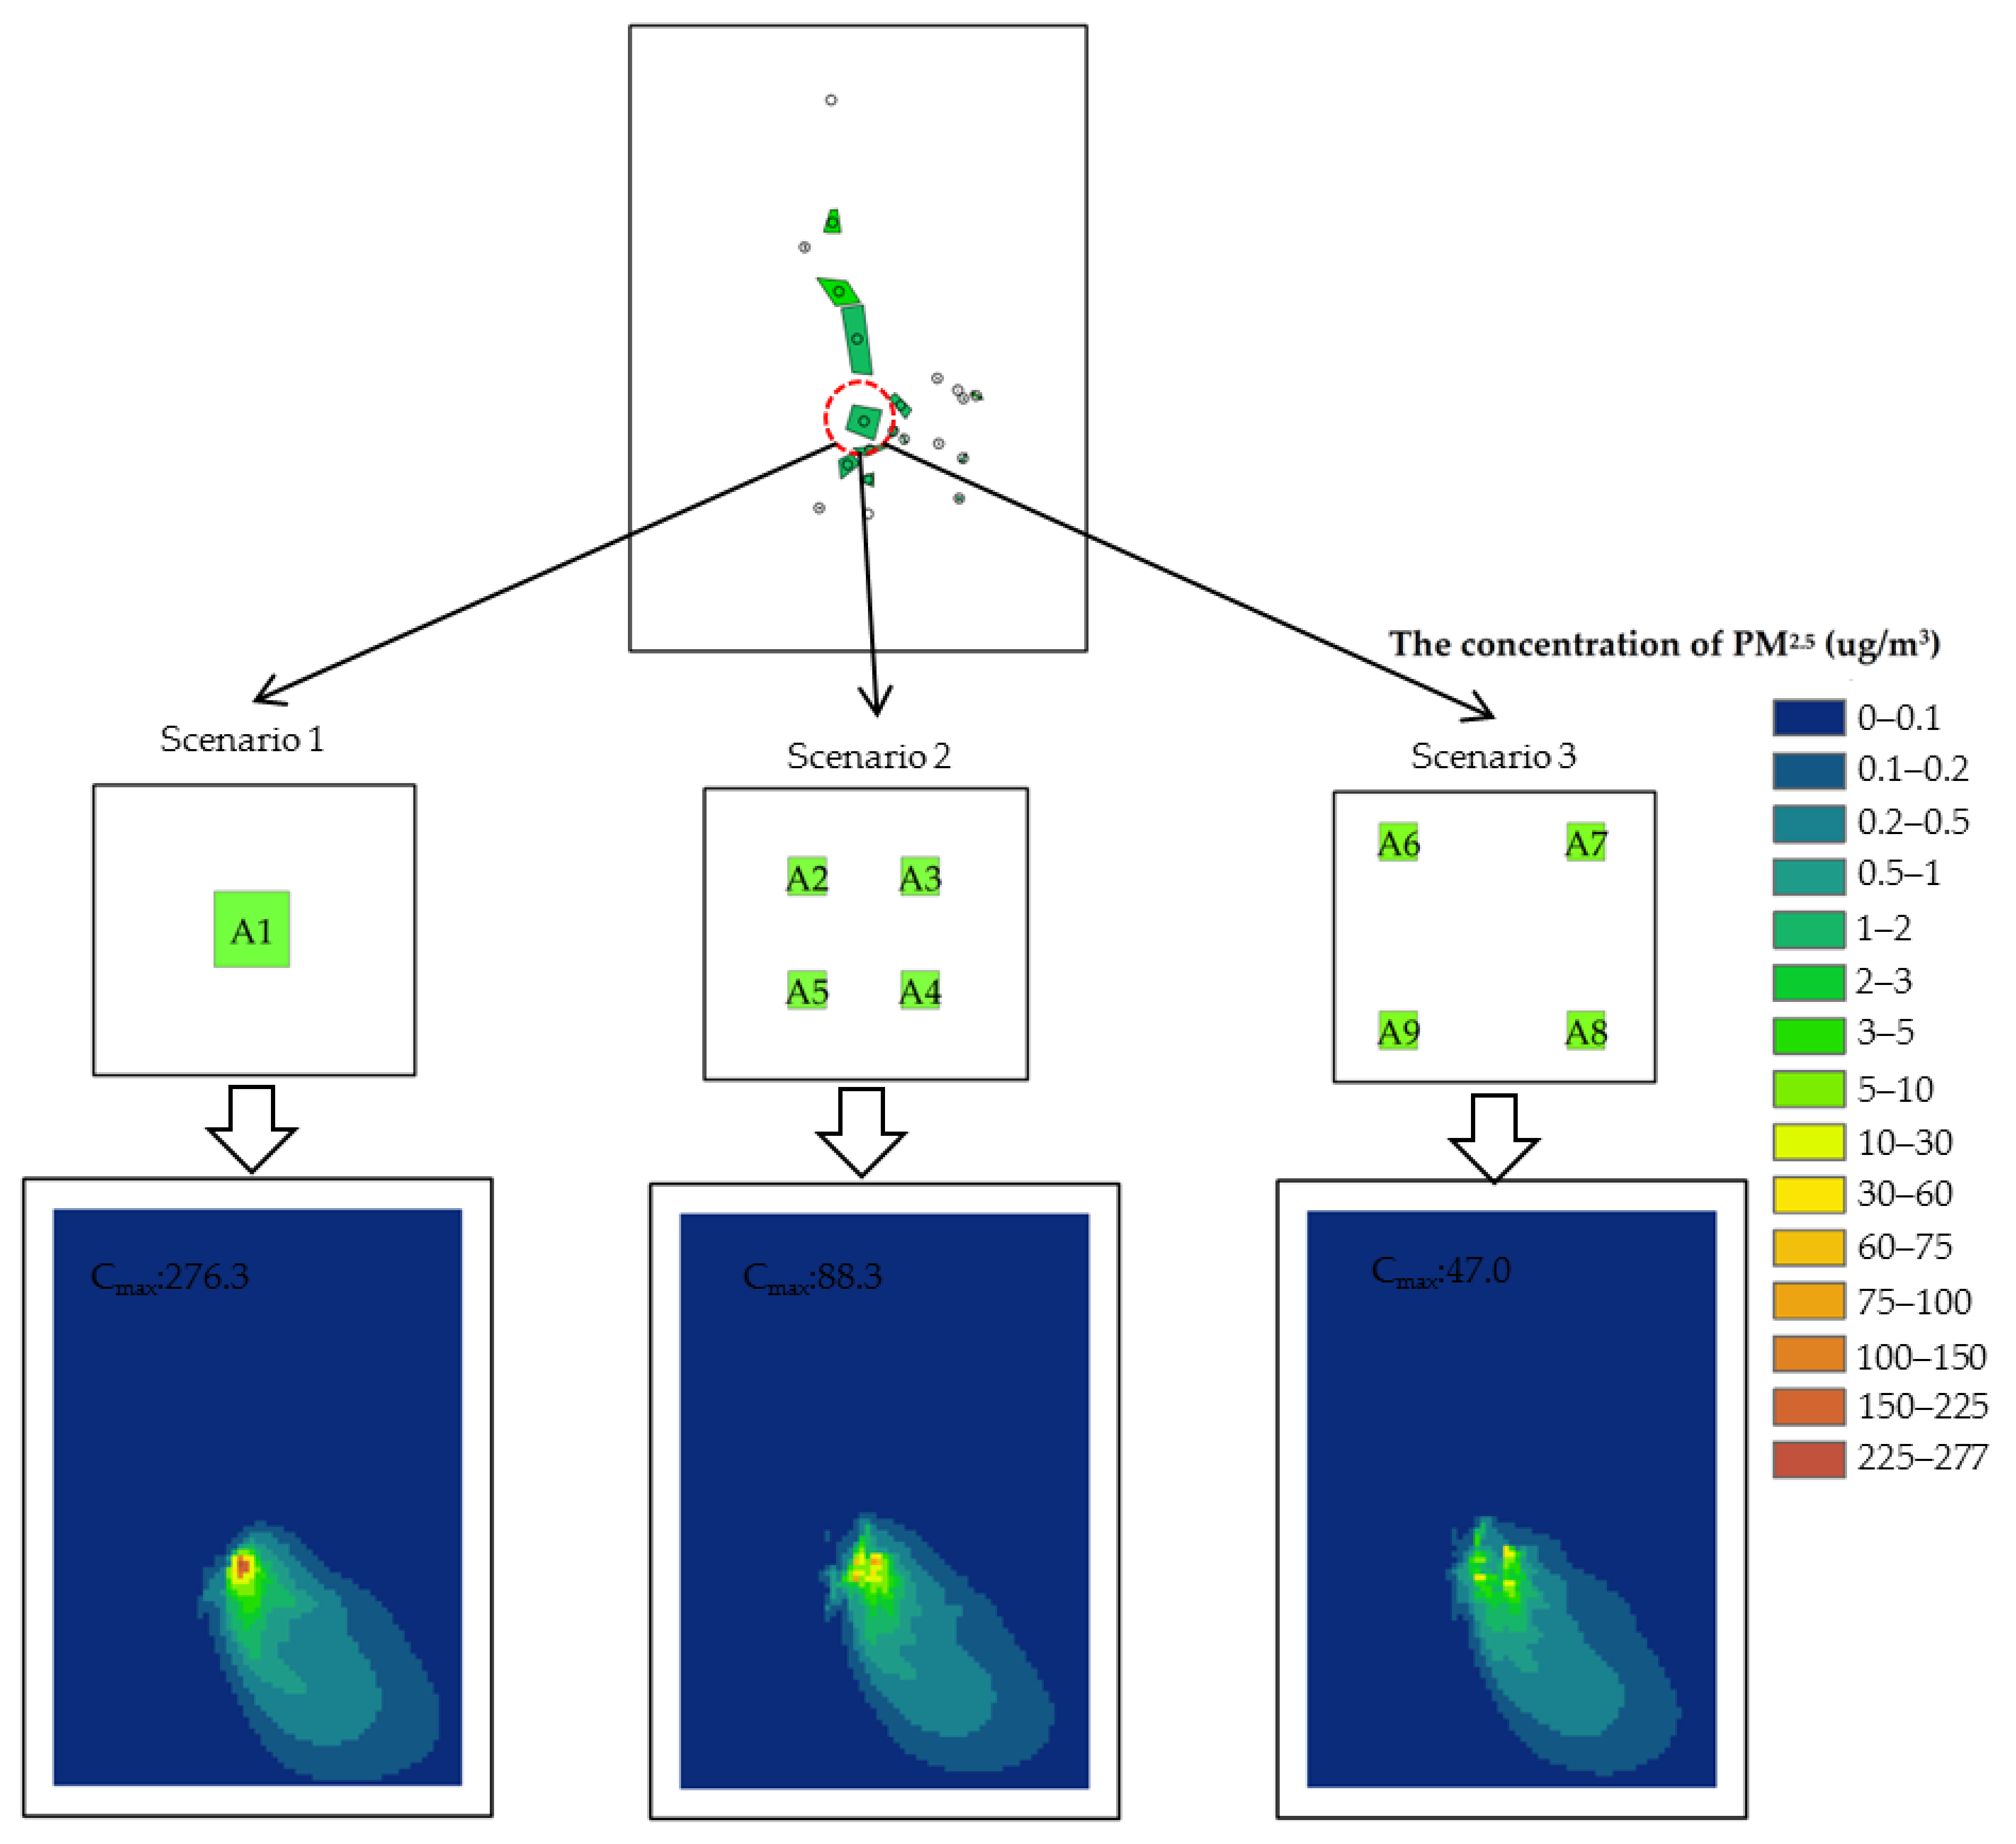
3.3.3. Spatial Transport Law of Dust Particles in Multi-Scale Mining Areas

The diffusion of pollutants is affected by wind direction, wind speed, temperature, terrain, source intensity, and other factors [48,49], among which the meteorological and terrain factors have the most significant influence, but they are difficult to control artificially. Feng Liu’s study [50] mentioned that the concentration distribution of pollutants is not only related to meteorological factors but is also largely affected by the relative position between sources, and this effect is caused by the change of wind direction. In order to clarify the relationship between the distribution shape of pollution sources and emission concentration and diffusion distance, we set up three comparative scenarios. In the three scenarios, the emission intensity, area, altitude, effective height, and other conditions of pollution sources were all the same (Table S6), but the distribution direction of pollution sources was different (Figure 7). The pollution source in Scenario 1 was most concentrated. In Scenario 4, the pollution source was distributed laterally, and the angle with the dominant wind direction was the largest, and the windward side was the largest. In Scenario 5, the pollution source was distributed longitudinally, and the angle with the dominant wind direction was the smallest, and the windward side was the smallest. The simulation showed that for the pollution sources with the same emission intensity and source area, in terms of the maximum ground concentration, Scenario 1 > Scenario 5 > Scenario 4; in terms of the area exceeding the pollution standard, Scenario 4 > Scenario 1 > Scenario 5, which were 9 km2, 8 km2, and 6 km2 respectively. When the angle between the distribution direction of the linear pollution sources and the dominant wind direction is smaller, the emission concentration is higher, but the diffusion surface is smaller. This is because the particles diffuse along the wind direction; the particles emitted by the upstream pollution sources and the particles emitted by the downstream pollution sources accumulate and superposition continuously, resulting in the increase of the maximum ground concentration, and the diffusion surface is closer to the arrangement direction of the pollution sources. However, when the angle between the direction of the linear pollution source distribution and the dominant wind direction is larger, the maximum ground concentration is lower, but the diffusion surface is larger because the diffusion directions of particles emitted by each sub-pollution source are almost parallel to each other and the superposition interference is weaker. A concentrated distribution of pollution sources spread in the middle, but the emission concentration is the highest, so the area of excessive pollution is more than that of Scenario 5. On the whole, the influence of pollution source distribution direction on concentration and diffusion is not as obvious as that of the meteorological factors.
Figure 8 shows the change rates of PM2.5 concentration with migration in six types of sources and multi-source superposition scenarios under the meteorological conditions of a typical day. On the whole, the change rate of PM2.5 concentration with migration was the highest in the multi-source superposition scenario, with an average value of 6.62 × 10⁻² and a maximum value of 3.92. Among the six types of sources, the change rate of PM2.5 concentration of unpaved roads with migration was the largest, and the change rate of PM2.5 concentration of the quarries with migration was the smallest. The transport distance of particulate matter is determined by the emission concentration and the change rate of PM2.5 concentration with migration. Therefore, the calculations of diffusion risk showed that among the six types of sources, non-paved roads had the largest diffusion risk, with an average risk value of 3.28 × 10⁻² and a maximum value of 2.37; second, coal piles, with an average of 1.42 × 10⁻² and maximum of 1.85; the diffusion risk of the mine pits and dumps was close to that of the coal pile sources, with an average value of 1.27 × 10⁻² and a maximum value of 1.65; loading and unloading sources had the lowest diffusion risk, and the maximum value was 0.02. Combined with the emission intensity, emission area, and distribution, we found that the six types of pollution sources were in a north-south linear arrangement macroscopically. For the non-paved road sources, a large number of large-scale sources with moderate emission intensity were concentrated in the north-south direction, while a small number of small-scale sources with high emission intensity were scattered in the southeast corner. The non-paved road sources were distributed in a wide range, and the particulate matter emitted by the pollution sources in the upwind direction overlapped with the particulate matter emitted by the pollution sources in the downwind direction, increasing the pollution concentration and the diffusion area, so the diffusion risk was the highest. The distribution of loading and unloading sources was the same as that of the non-paved roads, but the source intensity was the smallest, so the transmission distance of particles was also the smallest, and the diffusion risk was the lowest. The distribution of coal piles was similar to that of non-paved roads. There were both concentrated linear sources and scattered sources of high emission intensity. However, the source intensity and total pollution source area were smaller than those of the non-paved roads, so the diffusion risk was the second. For mine pits and dumps, the distribution was relatively dispersed macroscopically, while, locally, it was densely distributed. Although the diffusion surface was large, the concentration exceeded the standard only in the vicinity of the area with dense pollution sources, so there was a greater diffusion risk only in the downwind direction of the area with dense pollution sources.

3.4. Air Pollution Risk Assessment and Management

Taking the relative pollution risk and the diffusion risk of emission sources into consideration, based on Equation (14), the environmental risks of the six types of emission sources are shown in Figure 9. The order of the environmental risk contribution of the six types of emission sources from large to small is the following: non-paved road > coal piles > coal pits and dump > paved road > quarries > load and unloading. The average environmental risks of the top three pollution sources are 5.61 × 10⁻², 2.06 × 10⁻², and 1.89 × 10⁻², respectively, and the average environmental risks of loading and unloading sources are 3.66 × 10⁻⁴. In the multi-source superposition scenario, emission sources in the red frame area (see Figure 10) were densely distributed and arranged in a north-south linear manner. Due to the high PM2.5 concentration and the angle between the distribution direction of sources and the dominant wind direction, both pollution risk and diffusion risk were higher, so the environmental risk was higher. In particular, the downstream pollution sources along the linear alignment direction, due to the PM2.5 concentration accumulation of upstream pollution sources, the pollution risk would continue to increase. In the blue frame area (see Figure 10), the emission sources were distributed sparsely and irregularly. The pollution risk was lower, but the diffusion risk was higher, which decreased with the increase of the diffusion distance, and the overall environmental risk is lower.
Regarding previous studies [51,52], we formulated the risk classification standard of the mining area (Table 8) and divided the mining area into three categories (Figure 10). High-risk areas are mainly concentrated areas of emission sources, which are heavily polluted areas. Therefore, it is necessary to significantly reduce the intensity of high-emission sources in this area, reduce the density of pollution sources and adjust the layout of pollution sources. The medium-risk areas belong to the moderate and light pollution areas where the pollution sources are dispersed with high diffusion risk. Appropriate reductions in the intensity of emissions sources are needed, and the diffusion risk can be reduced by installing wind-proof and dust-suppressing nets upstream and downstream of the dominant wind direction (west, northwest, and north), or by distributing the easily mobile pollution sources, such as unpaved roads, along the dominant wind direction. Low-risk areas are mainly those with low pollution contribution and low dispersion, where PM2.5 concentration is within the safety standard and its impact on the environment is acceptable. Conventional management can be implemented. According to the concentration distribution of the multi-source superposition, it can be seen that the middle and high-risk areas can completely cover the areas exceeding the PM2.5 standard, and we can avoid the one-size-fits-all control. It is not necessary to reduce the intensity of the source altogether. Instead, we can reduce the risk and the management cost by reducing the distribution density of pollution sources and adjusting the layout of pollution sources.

3.5. Significance and Limitations

In the current research on the environmental risk assessment of particulate matter, when mathematical models are used to simulate the diffusion of particulate matter of pollution sources, the various assumed ideal conditions will bring some practical deviations. Therefore, in this study, with the concentration of simulation model for environmental risk assessment, we constructed an index system based on different scenarios, highlighted the environmental risks of sources with high pollution concentration contribution and high diffusibility to more easily and accurately assess and control the risks of non-point sources in mining areas.
However, in the compilation of the fine particulate matter emission inventory in the mining area, due to the limitation of conditions, the pollution sources such as coal spontaneous combustion and secondary dust emissions were not counted. Moreover, meteorological conditions were not fixed. The emission calculation formulae were adjusted for different meteorological conditions, and the emission inventory had not been allocated in a more detailed time series. These factors could lead to the uncertainty of the inventory. In addition, the particle interference from different sources is not considered in the model CALPUFF simulation, so when we use this model for environmental risk assessment, we need to further consider the particle interference of multiple sources in the future and incorporate more comprehensive risk factors, which is expected to improve a more scientific, standardized, and accurate risk assessment system.

4. Conclusions

The PM2.5 emission inventory was obtained from the study, which indicated that among the key control types of non-point sources in the mining area, unpaved road transport was the primary emission source, followed by the wind erosion on the exposed surface of coal piles, and the third was the wind erosion on the exposed surface of mine pits and dumps. The simulation and calculations showed that the maximum equal contribution index of the standard concentration of these three pollution sources were 2.40, 2.21, and 2.10, respectively. The maximum equal contribution index of the standard concentration of the multi-source superposition was 4.40. The simulation showed that the wind field and the spatial distribution of emission sources could affect the effect of superimposed pollution sources, thus affecting the risk. The denser the distribution of pollution sources, the higher the emission concentration, the smaller the relative contribution ratio of superimposed sources for a single source, and the greater the relative pollution risk. Dispersed pollution sources can reduce the pollution risk by reducing the concentration level. The relative pollution risk ranking of the six types of sources was consistent with the ranking of the concentration contribution level. Among them, non-paved road sources had the largest relative pollution risk, with an average risk value of 2.34 × 10⁻² and a maximum risk value of 1.46. However, for the proportion of the relative pollution risk of single sources, unpaved roads and quarries increased by 15.5% and 1.0%, while other sources decreased, compared with the absolute pollution risks without superimposed sources. When the influence of superimposed sources is considered in the relative pollution risk, the risk of high contribution sources in the low-concentration pollution area is increased, and the risk of low-contribution sources in the high-concentration pollution area is reduced.
In the case of the same source intensity and emission area, the smaller the angle between the linear pollution source arrangement direction and the dominant wind direction, the higher the cumulative emission concentration, but the smaller the diffusion surface. The transport distance of particulate matter is determined by the emission concentration and the change rates of PM2.5 concentration with migration. In the multi-source superposition scenario, the change rate of PM2.5 concentration with migration was the highest, with an average value of 6.62 × 10⁻² and a maximum value of 3.92. Among the six types of sources, the change rate of PM2.5 concentration with migration of the unpaved roads was the least, and that of the quarries was the largest. Considering the influence of concentration, the diffusion risk of unpaved roads was the highest, coal piles were the second, mine pits and dumps were the third, and loading and unloading sources were the lowest; the average risks are 3.28 × 10⁻², 1.42 × 10⁻², 1.27 × 10⁻², and 3.63 × 10⁻⁴, respectively. Diffusion risk could better evaluate the potential of pollution risk and realize a more accurate classified control.
Combined with the relative pollution risk and diffusion risk of emission sources, the environmental risk of non-paved roads was the highest, followed by coal piles; the third is mine pits and dumps, and that of loading and unloading sources is the lowest, and their average environmental risks are 5.61 × 10⁻², 2.06 × 10⁻², 1.89 × 10⁻² and 3.66 × 10⁻⁴, respectively. At the same time, different control measures were proposed to realize the risk control by zoning and classification.

Supplementary Materials

The following are available online at https://www.mdpi.com/article/10.3390/su13126619/s1, Table S1: Multiyear meteorological conditions in Qipanjing town (1988–2018); Table S2: The formulas, parameter values, and significances of emission factors and total emissions of particulate matter emission sources in the mining area; Table S3: Data of production and operation in the mining area; Table S4: The sources of the model data and Settings; Table S5: Regional wind speed and wind frequency statistics in 2018; Table S6: Parameters of pollution sources in different scenarios for simulation.

Author Contributions

Conceptualization, T.L. and L.Z.; methodology, L.Z. and T.L.; software, Z.L.; validation, T.L., L.Z. and Z.L.; formal analysis, L.Z.; investigation, L.Z. and Z.L.; resources, Z.L. and L.M.; data curation, Z.L.; writing—original draft preparation, L.Z.; writing—review and editing, T.L. and N.D.R.L.; visualization, L.Z. and Z.L.; supervision, T.L. and L.M.; project administration, T.L. All authors have read and agreed to the published version of the manuscript.

Funding

This research received no external funding.

Institutional Review Board Statement

Not applicable.

Informed Consent Statement

Not applicable.

Data Availability Statement

The data presented in this study are available in the Supplementary Materials.

Conflicts of Interest

The authors declare no conflict of interest.

References

  1. Gao, J.; Zhang, Y.C.; Wang, S.L.; Chai, F.H.; Chen, Y.Z. Study on the characteristics and formation of a multi-day haze in October 2011 in Beijing. Res. Environ. Sci. 2012, 25, 1201–1207. [Google Scholar] [CrossRef]
  2. Chen, Y.B.; Xu, J.; He, Y.J.; Du, X.H.; Tang, W.; Meng, F. Model analytic research of typical heavy PM2.5 pollution periods in winter in Beijing. Res. Environ. Sci. 2016, 29, 627–636. [Google Scholar] [CrossRef]
  3. Gautam, S.; Patra, A.K.; Sahu, S.P.; Hitch, M. Particulate matter pollution in opencast coal mining areas: A threat to human health and environment. Int. J. Min. Reclam. Environ. 2016, 32, 75–92. [Google Scholar] [CrossRef] [Green Version]
  4. Pokorná, P.; Hovorka, J.; Brejcha, J. Impact of Mining Activities on the Air Quality in the Village nearby a Coal Strip Mine. Iop Conf. Ser. Earth Environ. Sci. 2016, 44. [Google Scholar] [CrossRef] [Green Version]
  5. Soltani, N.; Keshavarzi, B.; Moore, F.; Cave, M.; Sorooshian, A.; Mahmoudi, M.R.; Ahmadi, M.R.; Golshani, R. In vitro bioaccessibility, phase partitioning, and health risk of potentially toxic elements in dust of an iron mining and industrial complex. Ecotoxicol. Environ. Saf. 2021, 212, 111972. [Google Scholar] [CrossRef]
  6. Patra, A.K.; Gautam, S.; Kumar, P. Emissions and human health impact of particulate matter from surface mining operation—A review. Environ. Technol. Innov. 2016, 5, 233–249. [Google Scholar] [CrossRef]
  7. Zhou, W.; Liu, H.; Xiang, J.; Zheng, J.; Yao, R.; Liu, S.; Liu, T.; Zhang, J.; Zhan, C.; Xiao, W.; et al. Assessment of Elemental Components in Atmospheric Particulate Matter from a Typical Mining City, Central China: Size Distribution, Source Characterization and Health Risk. Bull. Environ. Contam. Toxicol. 2020, 105, 941–950. [Google Scholar] [CrossRef]
  8. Zhang, W.; Wang, P.; Zhu, Y.; Wang, D.; Yang, R.; Li, Y.; Matsiko, J.; Zuo, P.; Qin, L.; Yang, X.; et al. Occurrence and human exposure assessment of organophosphate esters in atmospheric PM2.5 in the Beijing-Tianjin-Hebei region, China. Ecotoxicol. Environ. Saf. 2020, 206, 111399. [Google Scholar] [CrossRef] [PubMed]
  9. Khamraev, K.; Cheriyan, D.; Choi, J.-H. A review on health risk assessment of PM in the construction industry Current situation and future directions. Sci. Total Environ. 2021, 758. [Google Scholar] [CrossRef]
  10. Zhi, M.; Zhang, X.; Zhang, K.; Ussher, S.J.; Lv, W.; Li, J.; Gao, J.; Luo, Y.; Meng, F. The characteristics of atmospheric particles and metal elements during winter in Beijing: Size distribution, source analysis, and environmental risk assessment. Ecotoxicol. Environ. Saf. 2021, 211, 111937. [Google Scholar] [CrossRef]
  11. Guo, J.; Zhuang, T.; Liu, S.J.; Huang, X.J. Numerical Simulation Study on the Effect of Fugitive Emissions of Particulate Matter on Air Quality in Industrial Area. Environ. Sci. Technol. 2018, 31, 56–61. [Google Scholar]
  12. Huertas, J.I.; Huertas, M.E.; Izquierdo, S.; Gonzalez, E.D. Air quality impact assessment of multiple open pit coal mines in northern Colombia. J. Env. Manag. 2012, 93, 121–129. [Google Scholar] [CrossRef] [PubMed]
  13. Arregocés, H.; Rojano, R.; Restrepo, G.; Angulo, L. Using CALPUFF to Determine the Environmental Impact of a Coal Mine Open Pit. In Proceedings of the Air Pollution Xxiv, 24th International Conference on Modelling, Monitoring and Management of Air Pollution, Crete, Greece, 20–22 June 2016; Longhurst, J.W.S., Brebbia, C.A., Barnes, J., Eds.; WIT Transactions on Ecology and the Environment. Wit Press: Southampton, UK, 2016; Volume 207, pp. 55–66. [Google Scholar] [CrossRef] [Green Version]
  14. Huertas, J.I.; Camacho, D.A.; Huertas, M.E. Standardized emissions inventory methodology for open-pit mining areas. Environ. Sci. Pollut. Res. Int. 2011, 19, 2784–2794. [Google Scholar] [CrossRef] [PubMed]
  15. Huertas, J.I.; Huertas, M.E.; Cervantes, G.; Diaz, J. Assessment of the natural sources of particulate matter on the opencast mines air quality. Sci. Total Environ. 2014, 493, 1047–1055. [Google Scholar] [CrossRef]
  16. Chakraborty, M.K.; Ahmad, M.; Singh, R.S.; Pal, D.; Bandopadhyay, C.; Chaulya, S.K. Determination of the emission rate from various opencast mining operations. Environ. Model. Softw. 2002, 17, 467–480. [Google Scholar] [CrossRef]
  17. Richardson, C.; Rutherford, S.; Agranovski, I. Particulate emission rates for open surfaces in Australian open cut black coal mines. J. Environ. Manag. 2019, 232, 537–544. [Google Scholar] [CrossRef]
  18. Zhang, X.; Chen, W.; Ma, C.; Zhan, S. Modeling particulate matter emissions during mineral loading process under weak wind simulation. Sci. Total Environ. 2013, 449, 168–173. [Google Scholar] [CrossRef]
  19. Li, S.W.; Li, W.S.; Lei, P.; Peng, S.T. Research on dust emission of iron ore for bulk-cargo yard of ore terminal by using wind tunnel test. J. Waterw. Harb. 2016, 37, 558–562. [Google Scholar]
  20. Huertas, J.I.; Huertas, M.E.; Díaz, J. Assessing precision and accuracy of atmospheric emission inventories. Int. J. Environ. Sci. Technol. 2012, 9, 195–202. [Google Scholar] [CrossRef] [Green Version]
  21. Huang, C.; Li, S.J. Contrast of two calculation methods of wind erosion dust sources in coal storage yard. China Harb. Eng. 2015, 35, 48–52. [Google Scholar] [CrossRef]
  22. Romeo, A.; Capelli, L.; Sironi, S.; Nano, G.; Rota, R.; Busini, V. Dust emission and dispersion from mineral storage piles. Environ. Sci. Pollut. Res. 2017, 24, 22663–22672. [Google Scholar] [CrossRef] [PubMed] [Green Version]
  23. Cui, K.Q.; Wang, X.Z.; He, Y.J.; Meng, F. Surface mine dump dust emissions and pollution in Xilinhot[J]. J. Arid Land Resour. Environ. 2017, 31, 160–165. [Google Scholar] [CrossRef]
  24. Ouyang, M.; Zhang, J.J.; Hu, S.M. Estimation of dust emission coefficient from mine transportation and storage yard and analysis of prevention and control measures. Pioneer. Sci. Technol. Mon. 2016, 29, 122–125. [Google Scholar] [CrossRef]
  25. Qin, J.X.; Zhu, K.Y.; Wu, T.; Shen, H.Q. Study on Spatial and Temporal Characteristics of Construction Dust and Soil Dust Pollution Sources in Urban Areas of Changsha. Environ. Monit. China 2020, 36, 69–79. [Google Scholar] [CrossRef]
  26. Asif, Z.; Chen, Z.; Han, Y. Air quality modeling for effective environmental management in the mining region. J. Air Waste Manag Assoc. 2018, 68, 1001–1014. [Google Scholar] [CrossRef]
  27. Holmes, N.S.; Morawska, L. A review of dispersion modelling and its application to the dispersion of particles: An overview of different dispersion models available. Atmos. Environ. 2006, 40, 5902–5928. [Google Scholar] [CrossRef] [Green Version]
  28. Rood, A.S. Performance evaluation of AERMOD, CALPUFF, and legacy air dispersion models using the Winter Validation Tracer Study dataset. Atmos. Environ. 2014, 89, 707–720. [Google Scholar] [CrossRef] [Green Version]
  29. Tartakovsky, D.; Broday, D.M.; Stern, E. Evaluation of AERMOD and CALPUFF for predicting ambient concentrations of total suspended particulate matter (TSP) emissions from a quarry in complex terrain. Environ. Pollut. 2013, 179, 138–145. [Google Scholar] [CrossRef]
  30. Lal, B.; Tripathy, S.S. Prediction of dust concentration in open cast coal mine using artificial neural network. Atmos. Pollut. Res. 2012, 3, 211–218. [Google Scholar] [CrossRef] [Green Version]
  31. Petavratzi, E.; Kingman, S.; Lowndes, I. Particulates from mining operations: A review of sources, effects and regulations. Miner. Eng. 2005, 18, 1183–1199. [Google Scholar] [CrossRef]
  32. Lei, P. Research on Dusting Rules for Bulk-Cargo Yard of Iron Ore and Coal Terminal. Master’s Thesis, Tianjin University, Tianjin, China, 2014. [Google Scholar]
  33. Zhou, Y.; Zhao, Y.; Mao, P.; Zhang, Q.; Zhang, J.; Qiu, L.; Yang, Y. Development of a high-resolution emission inventory and its evaluation and application through air quality modeling for Jiangsu Province, China. Atmos. Chem. Phys. 2017, 17, 211–233. [Google Scholar] [CrossRef] [Green Version]
  34. Liu, C.L.; Xie, F.J.; Zheng, X.M.; Wang, Y. Optimizations of Spatial Allocation of Air Pollutant Emission Inventory in Nanjing. J. Green Sci. Technol. 2019, 97–99. [Google Scholar] [CrossRef]
  35. Shen, Y.; Jiang, C.; Chan, K.L.; Hu, C.; Yao, L. Estimation of Field-Level NOx Emissions from Crop Residue Burning Using Remote Sensing Data: A Case Study in Hubei, China. Remote Sens. 2021, 13, 404. [Google Scholar] [CrossRef]
  36. Hadlocon, L.S.; Zhao, L.Y.; Bohrer, G.; Kenny, W.; Garrity, S.R.; Wang, J.; Wyslouzil, B.; Upadhyay, J. Modeling of particulate matter dispersion from a poultry facility using AERMOD. J. Air Waste Manag Assoc. 2015, 65, 206–217. [Google Scholar] [CrossRef]
  37. Chang, J.C.; Hanna, S.R. Air quality model performance evaluation. Meteorol. Atmos. Phys. 2004, 87, 167–196. [Google Scholar] [CrossRef]
  38. Rojano, R.; Arregocés, H.; Angulo, L.; Restrepo, G. PM10 emissions due to storage in coal piles in a mining industrial area. In Proceedings of the Air Pollution Xxiv, 24th International Conference on Modelling, Monitoring and Management of Air Pollution, Crete, Greece, 20–22 June 2016; Longhurst, J.W.S., Brebbia, C.A., Barnes, J., Eds.; WIT Transactions on Ecology and the Environment. WIT Press: Santiago de Compostella, Spain; Volume 207, pp. 87–97. [Google Scholar] [CrossRef] [Green Version]
  39. Arregoces, H.A.; Rojano, R.E.; Ângulo, L.C.; Restrepo, G.M. Predicción y Análisis de la Contribución de PM10 desde Pilas de Carbón en una Mina a Cielo Abierto. Inf. Technol. 2016, 27, 93–102. [Google Scholar] [CrossRef] [Green Version]
  40. Ghannam, K.; El-Fadel, M. A framework for emissions source apportionment in industrial areas: MM5/CALPUFF in a near-field application. J. Air Waste Manag Assoc. 2013, 63, 190–204. [Google Scholar] [CrossRef] [Green Version]
  41. Diego, I.; Pelegry, A.; Torno, S.; Toraño, J.; Menendez, M. Simultaneous CFD evaluation of wind flow and dust emission in open storage piles. Appl. Math. Model. 2009, 33, 3197–3207. [Google Scholar] [CrossRef]
  42. Hilton, J.E.; Cleary, P.W. Dust modelling using a combined CFD and discrete element formulation. Int. J. Numer. Methods Fluids 2013, 72, 528–549. [Google Scholar] [CrossRef]
  43. Zhu, J.; Zhu, J.; Lin, H.; Lin, W.S.; Xu, B.L. Study on Virtual Geographic Environment for Simulation of Air Pollution Dispersion. J. Syst. Simul. 2008, 20, 176–179, 186. [Google Scholar]
  44. Hong, Y.F.; Liu, F.; Dou, Y.S.; Shen, S.L.; Hu, G.H. Application of Gaussian superposition model to multi-source pollution in regional atmospheric environmental impact assessment. Chongqing Environ. Sci. 1996, 18, 9–13. [Google Scholar]
  45. Ping, C. Application of Atmospheric Pollutant Long-Term Diffusion Model. Master’s Thesis, Tianjin University, Tianjin, China, 2006. [Google Scholar]
  46. He, G.X.; Feng, H.; Zhang, H.R. Diffusion and attenuation models of PM2.5 in the atmosphere. Math. Pract. Theory 2014, 44, 28–36. [Google Scholar]
  47. Wade, D.; Senocak, I. Stochastic reconstruction of multiple source atmospheric contaminant dispersion events. Atmos. Environ. 2013, 74, 45–51. [Google Scholar] [CrossRef] [Green Version]
  48. Duijm, N.J. Dispersion over complex terrain: Wind-tunnel modelling and analysis techniques. Atmos. Environ. 1996, 30, 2839–2852. [Google Scholar] [CrossRef]
  49. Sorte, S.; Arunachalam, S.; Naess, B.; Seppanen, C.; Rodrigues, V.; Valencia, A.; Borrego, C.; Monteiro, A. Assessment of source contribution to air quality in an urban area close to a harbor: Case-study in Porto, Portugal. Sci. Total Environ. 2019, 662, 347–360. [Google Scholar] [CrossRef]
  50. Liu, F.; Jia, W.L. Computer simulation of multi-source atmospheric diffusion. Environ. Prot. Oil Gas. Fields 1993, 3, 21–24. [Google Scholar]
  51. Liu, L. Identifying Regional Atmospheric Risks of Industrial Park Planning: Methodology and Case Study. Master’s Thesis, Tsinghua University, Beijing, China, 2014. [Google Scholar]
  52. Wambebe, N.M.; Duan, X. Air Quality Levels and Health Risk Assessment of Particulate Matters in Abuja Municipal Area, Nigeria. Atmosphere 2020, 11, 817. [Google Scholar] [CrossRef]
Figure 1. Location of the study area, the meteorological station, and the monitoring points.
Sustainability 13 06619 g001
Figure 2. Spatial distribution of PM2.5 (particulate matter less than 2.5 μm) emission inventory (a) non-paved roads; (b) paved roads; (c) loading and unloading; (d) wind erosion on the surface of the coal piles; (e) wind erosion on the surface of the mine pits and dumps; (f) wind erosion on the surface of the quarries; (g) the multi-source superposition.
Sustainability 13 06619 g002
Figure 3. The linear relationship between the measured mean daily concentration of PM2.5 at the monitoring points and the predicted values of CALPUFF. (a) MS1; (b) MS2; (c) MS3.
Sustainability 13 06619 g003
Figure 4. The PM2.5 equal contribution indexes of standard concentration of six types of sources and the multi-source superposition (a) non-paved roads; (b) paved roads; (c) loading and unloading; (d) wind erosion on the surface of the coal piles; (e) wind erosion on the surface of the mine pits and dumps; (f) wind erosion on the surface of the quarries; (g) the multi-source superposition.
Sustainability 13 06619 g004
Figure 5. PM2.5 emission concentrations in simulated scenarios of pollution sources with different distribution densities.
Sustainability 13 06619 g005
Figure 6. The relative contribution ratios of superimposed sources for six types of pollutant sources and the relative pollution risks of six types of pollutant sources after the multi-source superposition (a) non-paved roads; (b) paved roads; (c) loading and unloading; (d) wind erosion on the surface of the coal piles; (e) wind erosion on the surface of the mine pits and dumps; (f) wind erosion on the surface of the quarries.
Sustainability 13 06619 g006
Figure 7. PM2.5 emission concentrations in simulated scenarios of pollution sources with different distribution trends.
Sustainability 13 06619 g007
Figure 8. The change rates of PM2.5 concentration with migration and the diffusion risks. (a) Non-paved roads; (b) paved road; (c) loading and unloading; (d) wind erosion on the surface of the coal piles; (e) wind erosion on the surface of the mine pits and dumps; (f) wind erosion on the surface of the quarries; (g) the multi-source superposition.
Sustainability 13 06619 g008
Figure 9. The environmental risks of six types of sources. (a) Non-paved roads; (b) paved roads; (c) loading and unloading; (d) wind erosion on the surface of coal piles; (e) the wind erosion on the surface of coal pits and dump; (f) the wind erosion on the surface of quarries.
Sustainability 13 06619 g009
Figure 10. The environmental risk and zoning of PM2.5 environmental risk from non-point sources in the mining area.
Sustainability 13 06619 g010
Table 1. Generalized classification of dust emission sources in the mining area.
Source Type GeneralizationSecondary Classification of Emission SourcesEmission Source Statistics [6,14,16,30,31]
Road transport dust sourcesPaved roadOverburden transport, surface soil transport, coal transport, material transport
Non-paved roadOverburden transport, surface soil transport, coal transport, material transport
Exposed surface dust sourcesCoal pilesWind erosion on the surface of the coal piles
Mine pits and dumpsWind erosion on the surface of the dumps and mine pits
QuarriesWind erosion on the exposed surface of stone piles and stone mining sites
Material loading and unloading dust sourcesLoading and unloadingCoal loading and unloading, topsoil removal, bulldozing, topsoil loading and Unloading, drilling and blasting operation, coal mining, stone loading and unloading, material transfer, coal processing workshop
Table 2. Locations of monitoring points and monitoring periods.
Monitoring PointPosition CoordinatesMonitoring Period
MS1672,281.2 E, 4,359,904.6 N8 January, 10 February, 21 March, 21 April, 14 May, 13 June, 22 July, 26 August, 13 September, 21 October, 18 November, 18 December (12 days in total)
MS2663,517.4 E, 4,368,254.7 N
MS3659,339.3 E, 4,394,614.5 N
Table 3. The parameters, formulas, and evaluation criteria of the model applicability validation.
IndexFormulaCriterion [20,36]Optimum Value [28]Number
FB (fractional bias) F B = 2 × ( C O ¯ C P ¯ ) C O ¯ + C P ¯ ∣FB∣ < 0.50(3)
MG (geometric mean bias) M G = exp ( ln C O ¯ ln C P ¯ ) 0.75–1.31(4)
VG (geometric variance) V G = exp ( ln C O ln C P ) 2 ¯ 1–1.31(5)
R2(coefficient of determination) R 2 = 1 ( C P C O ) 2 ( C P C O ¯ ) 2 >0.81(6)
NMSE (normalized mean square error) N M S E = ( C O C P ) 2 ¯ C O ¯ C P ¯ <0.50(7)
FAC2 (fraction of two)The ratio of CP/CO data 1 in the interval of (0.5, 2)>0.51(8)
1 CO, measured PM2.5 (particulate matter less than 2.5 μm) concentration; CP, simulated PM2.5 concentration.
Table 4. The parameters and formulas of the particulate matter distribution and spatial transport law in the mining area.
NumberFormula/ParameterSignificance
(9) I i j = C i j C s ( i = 1 , 2 , , n ) Equal contribution index of standard concentration of pollutant source i at the location j
CijThe PM2.5 concentration contribution of single pollutant source i at the location j
CsThe standard concentration limit for PM2.5
iThe serial number of the pollution source
nTotal number of pollution sources
jA place at some distance from the pollutant source
(10) r i j = i = 1 n C i j C i j i = 1 n C i j The relative contribution ratio of superimposed sources for pollutant source i at the location j
i = 1 n C i j The PM2.5 concentration contribution of the multi-source superposition at the location j
(11) C i x = ( ( ( C i 0 k i 1 Δ h ) k i 2 Δ h ) k i 3 Δ h ) k i x Δ h = C i 0 ( k i 1 + k i 2 + k i 3 + + k i x ) Δ h = C i 0 0 h k i j ( h ) d h
( j = 1 x Δ h = h x )
The PM2.5 concentration at a location that is hx meters away from the center of the source i
Ci0The PM2.5 concentration at the center of the source i
(12) k i j ( h ) = C i j 1 C i j Δ h The PM2.5 concentration change at the location that is h meters away from the center of the source i
CijThe PM2.5 concentration at the location that is h meters away from the center of the source i
Cij-1The PM2.5 concentration at the location that is h-Δh meters away from the center of the source i
(13) k i j = C i j 1 C i j C i j 1 The change rate of PM2.5 concentration emitted from the pollutant source i at the position j
Table 5. The calculation of PM2.5 emission inventory in the mining area.
Emission SourceWeight of the Dust (t/a)
Non-paved roads892.74
Coal piles176.77
Mine pits and dumps148.10
Paved road132.69
Quarries21.42
Loading and unloading sources9.33
Total (t/a)1381.05
Table 6. Results of the indices to evaluate the accuracy of the air quality model.
StationMS1MS2MS3
FB0.190.310.08
MG1.221.291.09
VG1.061.111.01
NMSE0.050.100.01
R20.790.850.82
FVC2 (%)100.00100.00100.00
Table 7. The conditions of the typical meteorological day (December 3).
ParameterPeriod
0:003:006:009:0012:0015:0018:0021:00
Wind directionNNWSWWNWNWWNWNWNWNW
Wind speed (m/s)1.12.33.73.03.83.21.91.1
Table 8. The classification standard of PM2.5 environmental risk from non-point sources in the mining area.
Risk LevelClassification Standard
Low0 < R ≤ 1.2
Medium1.2 < R ≤ 4.0
High4.0 < R ≤ 8.0
Publisher’s Note: MDPI stays neutral with regard to jurisdictional claims in published maps and institutional affiliations.

