Article

Pyrolysis of Solid Digestate from Sewage Sludge and Lignocellulosic Biomass: Kinetic and Thermodynamic Analysis, Characterization of Biochar

1
Faculty of Chemistry and Chemical Engineering, University of Maribor, Smetanova ul. 17, 2000 Maribor, Slovenia
2
IKEMA d.o.o., Institute for Chemistry, Ecology, Measurements and Analytics, Lovrenc na Dravskem polju 4, 2324 Ptuj, Slovenia
3
Faculty of Mechanical Engineering and Naval Architecture, University of Zagreb, Ul. Ivana Lučića 5, 10000 Zagreb, Croatia
*
Author to whom correspondence should be addressed.
Sustainability 2021, 13(17), 9642; https://doi.org/10.3390/su13179642
Submission received: 21 July 2021 / Revised: 24 August 2021 / Accepted: 24 August 2021 / Published: 27 August 2021
(This article belongs to the Topic Actions for Bioenergy and Biofuels: A Sustainable Shift)

Abstract

:
This study investigates the pyrolysis behavior and reaction kinetics of two different types of solid digestates from: (i) sewage sludge and (ii) a mixture of sewage sludge and lignocellulosic biomass—Typha latifolia plant. Thermogravimetric data in the temperature range 25–800 °C were analyzed using Flynn–Wall–Ozawa and Kissinger–Akahira–Sunose kinetic methods, and the thermodynamic parameters ( Δ H , Δ G , and Δ S ) were also determined. Biochars were characterized using different chemical methods (FTIR, SEM–EDS, XRD, heavy metal, and nutrient analysis) and tested as soil enhancers using a germination test. Finally, their potential for biosorption of NH4+, PO43−, Cu2+, and Cd2+ ions was studied. Kinetic and thermodynamic parameters revealed a complex degradation mechanism of digestates, as they showed higher activation energies than undigested materials. Values for sewage sludge digestate were between 57 and 351 kJ/mol, and for digestate composed of sewage sludge and T. latifolia between 62 and 401 kJ/mol. Characterizations of biochars revealed high nutrient content and promising potential for further use. The advantage of biochar obtained from a digestate mixture of sewage sludge and lignocellulosic biomass is the lower content of heavy metals. Biosorption tests showed low biosorption capacity of digestate-derived biochars and their modifications for NH4+ and PO43− ions, but high biosorption capacity for Cu2+ and Cd2+ ions. Modification with KOH was more efficient than modification with HCl. The digestate-derived biochars exhibited excellent performance in germination tests, especially at concentrations between 6 and 10 wt.%.

1. Introduction

The continuous growth of the human population is correlated with an increase in primary energy consumption, where the main sources of energy are (still) of fossil origin, and are responsible for the majority of greenhouse gas (GHG) emissions into the atmosphere [1]. Renewable energy sources, such as solar [2], wind, geothermal, hydropower energy, and energy recovered from biomass and different wastes [3], are promising alternatives to fossil fuels, offering solutions to the above challenges. Renewable energy is environmentally friendly [4] and more sustainable than non-renewable energy [5].
Many researchers address issues related to energy resources and energy recovery in their studies. Some deal with waste-to-energy recovery and sustainable waste management [6], others attempt to find the right programming approach, with an optimal mix of power generation for socioeconomic sustainability [7]. Others aim for progress towards circular economy models that optimize the use of renewable energy (e.g., biomethane from waste) [8]. Promoting the production of renewable resources and converting them into valuable products and bioenergy to satisfy sustainable development is also the goal of the European Bioeconomy Strategy, which was accepted by the European Commission [9]. The bioeconomy aims to replace non-renewable resources with bio-based alternatives, emphasizing the introduction of bio-based energy and material to reduce environmental risks [10].
One of the biggest environmental challenges, in addition to increasing energy consumption, is the problem of large quantities of sewage sludge generated during the operation of wastewater treatment plants as a result of increasing demand for clean water [11]. The most common disposal processes for sewage sludge are landfills, agricultural applications, and incineration [1]. Alternative, more environmentally friendly processes should be developed, due to stricter regulations and the environmental impacts associated with sewage sludge. Since sewage sludge has a relatively high calorific value and organic matter content, its waste-to-energy valorization technologies, such as anaerobic digestion [12], hydrothermal carbonization [13] and pyrolysis, are gaining attention [14].
Lignocellulosic biomass is recognized as one of the most sustainable alternative energy sources that contributes considerably to the reduction of GHG emissions [15]. Different types of lignocellulosic biomass can be used for energy recovery. The plant Typha latifolia (cattail) is one of the lignocellulosic feedstocks with high potential for energy recovery due to its special characteristics, such as high carbon content, high C:N ratio, and high yield due to rapid growth [16]. The T. latifolia plant grows on marginal lands and wetlands around the world, making it a low-cost biomass resource. Despite the significance of T. latifolia, there are not many studies related to energy recovery from it. Ciria et al. made an assessment of its potential as a biomass fuel by thermochemical characterization of a wetland produced biomass [17], while Grosshans studied the compression of cattail into compacted fuel products, wherein the combustion experiments showed that its calorific value is comparable to that of commercial wood pellets [18]. Hu et al. studied the potential of T. latifolia for methane production by anaerobic mono-digestion [19], and its performance in biogas production when co-digested with sewage sludge, including nutrient recovery from the obtained digestate, has also been investigated in an earlier study by the authors of the current work [20]. The efficiency of hydrothermal carbonization to produce hydrochar from cattail [21] and cattail digestate [22], and liquefaction processes to produce bio-oil [23] were also examined. Ahmad et al. studied the pyrolytic behavior of cattail and its thermal degradation process [24].
Various processes have been applied to convert biomass into energy, such as thermochemical processes including incineration, pyrolysis, torrefaction, hydrothermal carbonization and liquefaction [4], and biological processes, such as anaerobic digestion [19]. Of these technologies, pyrolysis and anaerobic digestion are among the most promising methods for conversion of sewage sludge [11], as well as lignocellulosic biomass into valuable products [15]. The coupling of anaerobic digestion and pyrolysis in an integrated process provides an opportunity to obtain higher bioenergy recovery compared to single processes [25], especially when using lignocellulosic biomass [15].
Anaerobic digestion is the process in which biomass, with the help of anaerobic microorganisms, is converted into biogas, mostly methane, which can be used for heat and/or electricity generation [11] or upgraded to biomethane [26]. The enormous potential biomethane production represents a sustainable way towards the decarbonization of the transport sector [27]. Anaerobic digestion and methane production can be enhanced by pre-treatment of feedstocks or the addition of natural enzymes and microorganisms, such are those in cattle rumen fluid [19]. A by-product of anaerobic digestion is digestate, which can be applied as fertilizer as it contains valuable nutrients, such as nitrogen, phosphorus and potassium for plant growth, although the possible presence of pathogens and heavy metals could limit such application [28]. The separation of digestate into solid and liquid parts is also possible, where the solid part can be used in the pyrolysis process [25]. Pyrolysis is an endothermic process that occurs in an inert atmosphere, during which biomass is converted into three fractions: char, oil, and a gaseous fraction that is represented mainly by CO2, H2 and CO [15]. During the degradation process, the organic matter undergoes a series of complex reactions, generating volatile products and condensed molecules, which finally leads to char formation [29]. The pyrolysis process and the characteristic of the products depend on various factors, especially the pyrolysis temperature, and the type and composition of biomass used [30]. Cellulose and hemicellulose in the lignocellulosic materials mostly contribute to bio-oil production, while lignin mainly contributes to biochar formation [31]. Lignocellulosic feedstocks usually require pre-treatment to enhance the pyrolysis efficiency, where chemical, thermal, or biological methods can be applied [15]. Pyrolysis is a particularly promising technology for sewage sludge management due to the reduction of sewage sludge volume, stabilization of heavy metals in the solid residue [32], and elimination of pathogens [33]. Compared to combustion, pyrolysis appears to be less polluting as most hazardous trace elements are retained in the biochar [34].
Thermogravimetric analysis (TGA) is widely employed to investigate the behavior of biomass during pyrolysis and the related degradation mechanisms [35]. The pyrolysis behavior of various biomasses and waste materials has been explored in detail using TGA, such as that of sewage sludge, animal manure [36], rice husks [33], miscanthus [37], and others. To determine the kinetic and thermodynamic parameters of the pyrolysis reaction, iso-conversional methods, such as the Flynn–Wall–Ozawa (FWO), Kissinger–Akahira–Sunose (KAS), and Friedman methods could be applied, besides model-fitting methods, such as the Coats–Redfern method [38]. The advantage of iso-conversional methods is that they do not require prior knowledge of the reaction mechanism [4]. Various studies have attempted to describe the kinetic and thermodynamic behavior of sewage sludge pyrolysis [39,40,41], while only a few were dedicated to the pyrolysis kinetics of sewage sludge digestates [34,42,43]. The FWO and Vyazovkin kinetic models have been used to determine the activation energy of pyrolysis of sewage sludge digestate or co-digestate of sewage sludge and grease waste, although the thermodynamic parameters have not been determined [42]. In another study, a FWO model was applied to describe the combustion of sewage sludge digestate [43]. The nth-order reaction model was used to calculate the activation energy and pre-exponential factor for sewage sludge digestate pyrolysis and combustion [34]. In contrast to sewage sludge digestates, kinetic studies dedicated to lignocellulosic digestates [25,44] and swine manure digestate [45] are more widely available.
Although pyrolysis is primarily intended for energy valorization, it has the added benefit of char production as a valuable carbon product. In recent years, a number of studies have been published on the characterization of biochars [46], the impact of feedstock type [47,48,49], and the operation conditions [50], including the pyrolysis temperature [51,52] on the properties and quality of the resulting biochars. Special attention was paid to the study of the impact of pyrolysis conditions on the toxicity and environmental safety of potentially toxic elements (heavy metals and others) in the biochars [53]. Sewage sludge and its solid digestate are promising feedstocks for the production of low-cost biochar that can be applied for various purposes, such as adsorbent or soil enhancer [46]. To improve the quality of biochar, sewage sludge can be co-pyrolyzed with other organic biomass, for example manure [36], rice husks [54], or any other biomass.
Biochar can be used for a variety of purposes, such as carbon sequestration [55], soil improvement as a fertilizer, pollution remediation, and with proper modification it can be used as a catalyst or supercapacitor [56]. Regarding the biosorption potential of biochars, studies reveal that sewage sludge derived biochars are effective in adsorption of phosphorus [57], ammonium and heavy metals [52], polycyclic aromatic hydrocarbons (PAHs), emerging organic pollutants (EOPs) [56], and other micropollutants from wastewater [35]. Since the sorption ability of sewage sludge-derived biochars may be relatively low compared to that of other biochars, modifications, such as chemical treatment can be applied to improve their sorption capacity. Modification with KOH improved the biosorption of heavy metals by sewage sludge digestate-derived biochar [58], HCl, and FeCl3 were effective in modification of wheat straw biochar tested for ammonium biosorption [59], while the impregnation of sewage sludge biochar with Mg, Ca, Al, Cu, and Fe demonstrated the better sorption ability of phosphorus [60]. N-doped biochars proved to be successful in removing emerging organic pollutants [56].
Biochar also contains significant amounts of micro- and macro-nutrients, which makes it valuable as a soil amender. Several researchers have studied the potential of sewage sludge biochars as soil amenders, and obtained quite diverse results, from a negative influence on plant growth due to heavy metal toxicity [61], to a positive impact due to nutrient enrichment of the soil [62,63]. Therefore, each biochar should be carefully evaluated for its own specific characteristics before being used for a particular purpose.

Research Motivation and Paper Organization

Several factors motivated us to conduct the research reported on in this paper; the literature review revealed that there are knowledge gaps in many of the areas mentioned above. For example, there are no studies on the pyrolysis of T. latifolia digestate or its co-digestate with other biomass, such as sewage sludge, and no studies on the co-pyrolysis of this plant with other biomass. The data for kinetic and thermodynamic parameters are also lacking. In addition, there is limited information about the potential of sewage sludge digestate derived biochars for soil improvement and their impact on seed germination, and none about biochar derived from T. latifolia. Furthermore, biosorption studies with sewage sludge biochars are usually performed with only one ion species, while studies with different types of ions and different biochar modifications are less common. In order to fill the knowledge gaps mentioned above, this study investigated the thermogravimetric behavior of two solid fractions of digestates obtained from anaerobic digestion. The first digestate was obtained from mono-digestion of sewage sludge, while the second digestate was obtained from co-digestion of sewage sludge and Typha latifolia (1:1 ratio). For comparison, the analysis of undigested feedstocks was carried out. Kinetic analysis was performed by applying two iso-conversional methods, KAS and FWO. The obtained biochars were characterized by several analytical methods, wherein elemental, heavy metal, and nutrient analysis, FTIR, SEM–EDS, and XRD analyses were performed. Moreover, experiments were conducted on the further applicability of the digestate derived biochars. The fertility potential of cress seeds exposed to different biochar concentrations was studied, and the adsorption potential for biosorption of NH4+, PO43−, Cu2+, and Cd2+ ions by unmodified and chemically modified biochars was evaluated.
Several novelties are introduced by this work. To the best of the authors’ knowledge, the pyrolysis kinetics of digestate composed of sewage sludge and the lignocellulosic plant T. latifolia were investigated for the first time. Thermodynamic parameters, such as Δ H , Δ G , and Δ S were determined as well, which cannot be found in the literature for this kind of digestate. A significant novelty is represented by the data obtained in the germination and biosorption tests, especially those from biochar modification, which bring valuable information on the possible use of the obtained biochars in agriculture, water treatment, and for other purposes.
The paper is organized as follows: Section 1 presents the study background and motivation for the research. The materials and methods used in the experiments and the kinetic models used in the kinetic analysis are presented in Section 2. In Section 3, the results of the characterization of feedstocks and products (including the results of biosorption and germination tests), as well as the results of thermogravimetric, kinetic, and thermodynamic analyses are discussed. Section 4 summarizes the main conclusions of the work and presents some directions for future research.

2. Materials and Methods

In this section, first, the methods for sample preparation and characterization methods are presented; further, the procedure for TGA is presented, and the models used in kinetic and thermodynamic analyses are introduced. Finally, the procedures for the biosorption and cress seed germination tests using digestate-derived biochars are described.

2.1. Preparation and Characterization of Feedstocks and Products

TGA experiments were conducted on two different solid fractions of digestates, digestate from mono-digestion of sewage sludge and from co-digestion of sewage sludge and the T. latifolia plant. In addition, raw sewage sludge and T. latifolia were analyzed for comparison.

2.1.1. Feedstocks Preparation

The solid fractions of digestates were obtained from anaerobic digestion experiments performed in 1 L batch reactors under mesophilic conditions (42 °C) with a retention time of 50 days. Digestate D1 was obtained from mono-digestion of sewage sludge, while digestate D2 was from co-digestion of sewage sludge and Typha latifolia plant (cattail). The composition of the samples on a dry matter basis (d.m.) used in the anaerobic digestion from which digestates D1 and D2 were obtained is shown in Table S1 in the supplementary material.
The ratio between substrate and inoculum was 1:1 (15:15 g on a dry matter basis). To both samples, 50 mL of cattle rumen fluid was added to promote fermentation and degradation of the lignocellulosic components. The mixtures were diluted with a buffer solution [64] to achieve a dry matter content of 6 wt.% in each reactor. The dewatered sewage sludge sample was collected from a local municipal wastewater treatment plant with tertiary biological treatment of wastewater with the capacity of 68,000 PE. Typha latifolia was gathered near a small river in the eastern part of Slovenia and cut into small pieces (0.5 cm × 0.5 cm). The inoculum was obtained from a biogas plant producing biogas from poultry manure. Cattle rumen fluid was acquired from a nearby slaughterhouse. The results of biogas production by anaerobic digestion are presented in our previous work [20]. After the anaerobic digestion process was stopped, the obtained digestates were separated into two parts, liquid and solid fractions, by centrifugation (Eppendorf 5804 R centrifuge, 7500 rpm, 8 min). The solid fractions of digestates D1 and D2 were dried at 105 °C in a laboratory dryer until constant weight, then ground and stored in a desiccator until further use in the thermogravimetric study. Undigested sewage sludge (SS) and T. latifolia were likewise dried and ground before being used in TGA.

2.1.2. Characterization of Feedstocks and Biochars

The basic characteristics of the feedstocks (digestates D1 and D2, raw sewage sludge, and T. latifolia plant) and their biochars were determined, such as proximate, ultimate, and heavy metal analyses. Moisture and dry matter content were determined according to the corresponding standard [65]. Ash content was determined as mass percentage of residues after combustion of the samples at 800 °C in a furnace for 4 h. Volatile matter (VM) was determined by measuring the weight loss after combustion of the samples in a furnace at 900 °C for 1 h. The fixed carbon (FC) was calculated as:
FC   ( wt . % ) = 100   VM     Ash
Higher heating value (HHV) was determined experimentally by combustion of the samples in a bomb calorimeter calibrated by combustion of certified benzoic acid [66]. Besides experimental values, the theoretical HHV values were also calculated. Several correlation models were established to estimate the HHV of biomass using the proximate values of biomass. The following equation was used in this study [67]:
H H V ( MJ kg ) = 0.3491 · C + 1.1783 · H + 0.1005 · S 0.1034 · O 0.0151 · N 0.0211 · Ash
where C, H, N, O, S, and Ash are the dry basis weight percentages of carbon, hydrogen, nitrogen, oxygen, sulfur, and ash in the solid samples.
The Elemental Analyzer PerkinElmer Series II 2400 was used to determine the carbon, hydrogen, nitrogen, and sulfur contents. The oxygen content was calculated as:
O   = 100   C     H     N     S     Ash   ( all   in   wt . % )
Before and after TGA, the content of heavy metals and elements K+, Ca2+, and Mg2+ was measured in the samples by inductively coupled plasma–optical emission spectrometry, ICP–OES [68]. The pH value of the biochars was determined as the pH value of the solution containing biochar at the mixing ratio biochar/deionized water = 1:20 (w/v).
The feedstocks and biochars were characterized using Fourier-transform infrared spectroscopy (FTIR) to study the functional groups present on the sample surface. For FTIR analysis, each dry sample was mixed with KBr (at a ratio of 1:30) and pressed into tablet form. The FTIR spectra were then recorded using a Shimadzu IRAffinity FTIR spectrophotometer (Japan). Scanning Electron Microscopy (SEM) analysis and X-ray powder diffraction (XRD) analysis were additionally used to characterize the biochars. XRD analysis was performed at room temperature with parameters of 2Theta from 10° to 70° and a scan rate of 0.033° s−1 (XRD, D-5005 diffractometer of Bruker Siemens manufacturer, Karlsruhe, Germany). SEM combined with Energy Dispersive X-ray Spectroscopy (EDS) analysis was used to identify the surface morphology and composition of the biochars. The specimens were observed using a Sirion 400 FEI scanning electron microscope equipped with an energy dispersive microanalysis system (EDS Oxford INCA 350). The surface area of biochars and the pore size were determined using N2 adsorption by means of a Micromeritics Tristar II 3020 porosimeter. The Brunauer–Emmett–Teller (BET) method was used for surface area determination and the Barrett, Joyner, and Halenda (BJH) model for pore size distribution.

2.2. Thermogravimetric Analysis (TGA) and Pyrolysis of Feedstocks

TGA was performed on the following feedstocks: digestates D1 and D2, undigested sewage sludge (SS) and T. latifolia plant (TLP). Biochar derived from undigested sewage sludge was designated as “B-SS”, biochar from T. latifolia plant as “B-TLP”, biochar from digestate D1 as “B-D1”, and biochar from digestate D2 as “B-D2” (see Table 1).
The TGA studies were carried out using the TGA/SDTA851e thermogravimetric analyzer (Mettler Toledo) in the temperature range from 25 to 800 °C under an inert atmosphere, ensured by a constant nitrogen flow of 100 mL/min. Samples weighing about 25 ± 1 mg, were exposed to the slow pyrolysis process at the following heating rates β : 15, 30, and 100 °C/min. These heating rates were chosen to cover as wide a range of the “slow pyrolysis” area as possible and promote the formation of solid biochar as the main product, rather than the liquid product normally formed at higher heating rates. From the results of TGA the TG curves (mass weights vs. temperatures) and derivative (DTG) curves were constructed using the MS Excel software tool.
For the germination and biosorption tests and characterization studies (XRD, FTIR, and SEM–EDS analyses), the biochar samples were obtained by pyrolysis of feedstocks at 800 °C in a tube furnace under an inert atmosphere at a heating rate of 15 °C/min. The biochars, after achieving the desired temperature, were kept in a furnace for another 30 min under the same conditions. After cooling to room temperature, the biochars were stored in a desiccator until further use.

2.3. Kinetic and Thermodynamic Analysis

The kinetic study was performed using the Kissinger–Akahira–Sunose (KAS) and Flynn–Wall–Ozawa (FWO) models. The thermodynamic analysis was further carried out based on the obtained kinetic parameters from the KAS and FWO models.

2.3.1. Kinetic Models

For the kinetic analysis of the thermogravimetric data obtained in this study, the KAS and FWO models were used, since they are less susceptible to errors than differential iso-conversional methods, such as the Friedman method [69]. Since both models have been explained in detail in the literature, only the final expression of the temperature integral is presented here. The FWO kinetic model, which uses the Doyle equation to approximate the temperature integral, is described by Equation (4) [70]:
ln [ β ] = ln [ A · E α R · g ( α ) ] 5.331 1.052 E α R · T
The KAS kinetic model [37] is given by Equation (5):
ln [ β T 2 ] = ln [ R · A E α · g ( α ) ] E α R · T
To determine the kinetic parameters for the selected conversion point (α), the left sides of Equations (4) and (5) were plotted on the y-axis against the ( 1 / R T ) on the x-axis. The activation energy E α was then calculated from the value of the slope of the linear plots using the KAS and FWO methods.
Since iso-conversional methods are often limited to estimate the pre-exponential factor A and predict the reaction model, Kissinger developed a model-free non-isothermal equation to determine the pre-exponential factor [41], described by Equation (6):
A = [ β · E α · exp   ( E α RT p   ) ] / ( RT p 2 )

2.3.2. Thermodynamic Parameters

The thermodynamic parameters of biomass decomposition such as the change in enthalpy Δ H (kJ/mol), Gibbs free energy Δ G (kJ/mol), and entropy Δ S (kJ/mol·K), can be calculated based on the previously obtained kinetic parameters using Equations (7)–(9) [54]:
Δ H = E α R T  
Δ G = E α + R T p ln ( K B T p h A )
Δ S = Δ H Δ G T p
where K B represents Boltzmann constant (1.381 × 10⁻²³ J/K), T p represents peak temperature of the DTG curve (K) at a given heating rate, and h represents the Planck constant (6.626 × 10⁻³⁴ Js) [71].

2.4. Cress Seed Germination Test

Since seed germination is a critical step in a plant’s life cycle [72], the cress seed germination test was conducted to investigate the potential of digestate-derived biochars (B-D1 and B-D2) for use as soil enhancers and to evaluate their toxicity to plants. To examine the response of plants to the obtained biochars according to the corresponding standard [73], 10 cress seeds (Lepidium sativum L.) were placed in each petri dish containing peat and then exposed to different concentrations of biochars for 72 h under controlled conditions (25 °C, absence of light). The following concentrations of biochars B-D1 and B-D2 were tested: 2, 6, 10, and 15 wt.%. Experiments were performed in triplicate for each concentration. A control sample containing water-soluble fertilizer with essential macronutrients (N:P2O5:K2O = 15:10:20, concentration of 1.5 g/L) was also prepared to compare the results. Based on the results of the growth test, the root length ( R L ) index was calculated using the equation described by Chemetova et al. [74] and Munoo-Liisa vitality ( M L V ) index, using the equation given by Maunuksela et al. [75].

2.5. Adsorption Tests

The biosorption potential of the digestate-derived biochars (B-D1 and B-D2) was evaluated by an adsorption test. The adsorption of NH4+, PO43−, Cd2+, and Cu2+ ions was studied at pH 7 and at constant temperature (22 °C). The pH 7 was chosen because the pH of aquatic solutions or wastewater is usually close to the neutral value. Experiments were conducted in 100 mL conical flasks containing 0.05 g of biochar and 50 mL of water solution with the initial ion concentration of 50 mg/L. The flasks were placed on an orbital shaker and shaken at 200 rpm for 24 h. The Cd2+ and Cu2+ contents in the solution were determined by ICP–OES, while the NH4+ and PO43− contents were determined spectrophotometrically using the standards DIN 38 406-E5-1 [76] and SIST EN ISO 6878:2004 [77]. Before analyses, samples were filtered through 0.45 μm filters.
To enhance biosorption capacity, the biochars were chemically modified with 2 mol/L KOH or HCl solution. For this purpose, 2 g of biochar was exposed to 50 mL of modification solution, which was shaken for 2 h. After modification, the biochar was rinsed several times with distilled water and dried at 105 °C before being used in the adsorption tests. Three different types of each biochar (each in two parallel runs) were tested for adsorption: unmodified, HCl modified, and KOH modified biochar. The removal efficiency of particulate ion species from the aqueous solution and the amount of ion adsorbed on the biochar (biosorption capacity) were calculated from the reduction of ion concentration in the solution using standard equations described in Tang et al. [78].

3. Results and Discussion

In this section, the proximate and ultimate analyses of the feedstock materials are presented and the results of the TGA are introduced. Further, the results of the kinetic analysis by applying KAS and FWO kinetic models are presented, and the thermodynamic parameters are noted. Finally, the results of the characterization of the pyrolysis products are described.

3.1. Characterization of Feedstock Materials

The results of proximate and ultimate analyses, heavy metals, and other parameters for the feedstocks used in this study (sewage sludge, T. latifolia plant, and digestates D1 and D2) are shown in Table 2.
In general, the digestates have higher ash content and lower volatile matter, carbon, and hydrogen content than undigested SS and TLP. Solid digestates D1 and D2 contained 58% and 60% volatiles, while undigested SS contained 71% and TLP 79%. The lower percentage of volatiles is a consequence of pre-treatment with the anaerobic digestion. Ash content was highest in the digestates (D1–36%, D2–31%), lower in SS (18%) and lowest in TLP (7%). On the other hand, TLP contained the highest content of fixed carbon (13%), followed by SS (11%) and both digestates (D1–7%, D2–9%).
Elemental analysis revealed higher content of C in raw SS and TLP (42 and 46%) than in digestates (D1-32%, D2-35%). Undigested SS contained around 8% N, while TLP and digestates contained about half of this. The content of sulfur in the samples was low. The content of heavy metals was highest in the case of undigested SS, while digestates D1 and D2 contained slightly lower content of heavy metals. Among the heavy metals detected, the highest concentrations belonged to Zn and Cu, with Ni, Pb, Cr, and Cd also detected. Otherwise, the raw SS satisfies the limit values of heavy metals set in the Slovenian decree on the use of sewage sludge in agriculture [79] and, thus, could be used for agricultural purposes. TLP exhibited low content of heavy metals, and a high content of K+ ions. The SS and digestates were rich in nitrogen as well as other nutrients, such as P, Mg, and Ca. Therefore, they could potentially be used as alternative sources for nutrient recovery or as soil enhancers. Further comparison of the digestates D1 and D2 revealed that digestate D2 contained lower content of H, N, and S elements, a lower amount of ash and heavy metals, and higher content of carbon, fixed carbon, and volatile matter.
The calorific value, i.e., higher heating value (HHV) reflects the amount of energy that can be released from a form of biomass when it is subjected to combustion, therefore, the determination of HHV is important as it provides valuable information regarding the bioenergy potential of the biomass [80]. The experimental HHV of both digestates was ~13 MJ/kg, which is lower than the HHV of sewage sludge (20 MJ/kg) and TLP (17 MJ/kg). Both sewage sludge and TLP show similar calorific values as reported in the literature. Values between 11 and 22 were reported for SS [81], and the value of 18 MJ/kg was found for TLP [24]. The values are comparable with the values of other energy crops such as miscanthus (19 MJ/kg) and wheat straw (16 MJ/kg) [81]. Regarding the HHV of SS digestates, different values were found, from relatively high, 17 MJ/kg (Aragon-Briceno 2017), 18 MJ/kg [34] and 16 MJ/kg [43], to relatively low, 13 MJ/kg [42]. The theoretical HHV were also calculated using Equation (2) developed by Channiwala and Parikh [67]. The agreement between the experimental and theoretical values for SS and the digestate samples was good, while for TLP, the difference between the values was more significant.
However, based on their properties, the tested feedstocks have promising potential to be applied in further thermal degradation processes for energy recovery. Since they have quite diverse compositions, the characteristics and quality of the final products can vary greatly.

3.2. Thermogravimetric Analysis

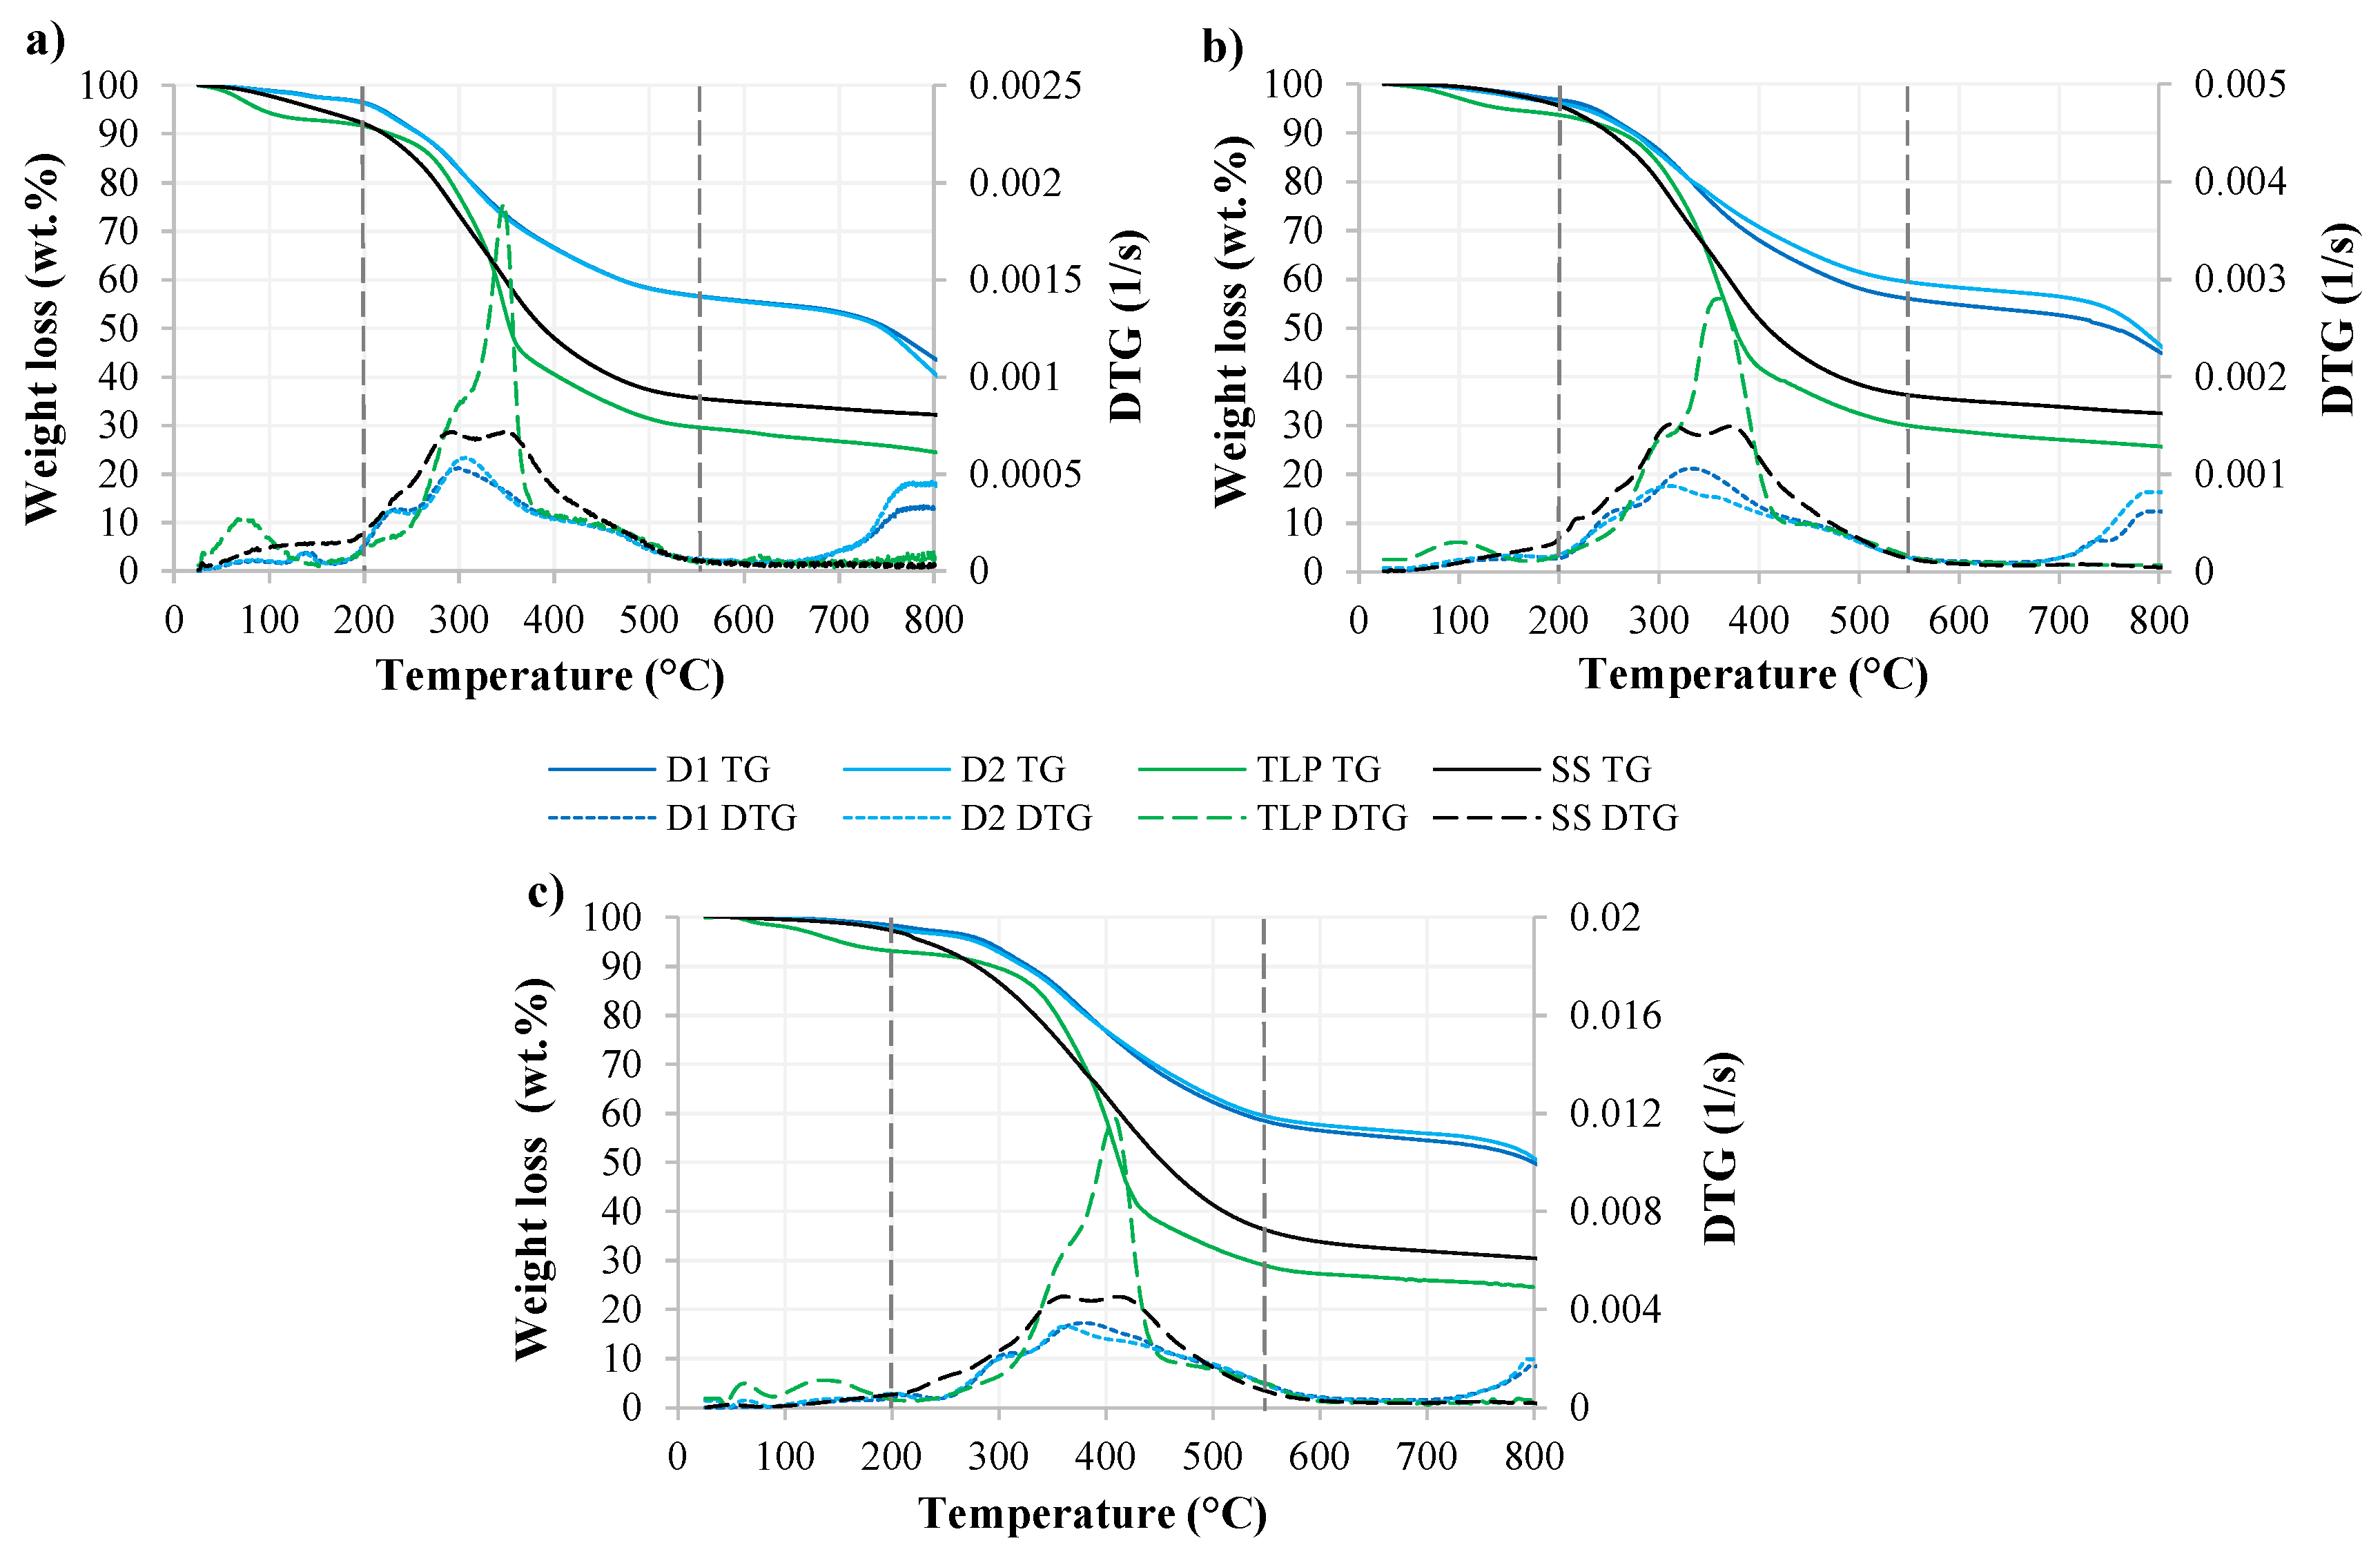
3.2.1. Analysis of TG and DTG Curves

Figure 1 shows TG and DTG curves for the analyzed feedstocks: digestates D1 and D2, raw sewage sludge and lignocellulosic T. latifolia. The curves for three different heating rates are shown: 15, 30, and 100 °C/min. The curve of TG represents the mass loss with respect to temperature and the curve of DTG represents the rate of mass loss with respect to temperature at a chosen heating rate.
Generally, the TG and DTG curves of the selected samples show similar characteristics at all three heating rates. The degradation of SS and TLP starts at lower temperatures (~150 °C) than the degradation of digestates (~200 °C), and it also ends earlier, at around 650 °C. The digestate samples show lower weight loss than the raw SS or TLP, implying that the AD pre-treatment has a significant effect on the thermal degradation of the biomass. The overall weight loss was highest for the TLP (75.1 wt.% on average), lower for SS (68.4 wt.%), and lowest for digestates (D1–54.1 wt.% and D2–54.6 wt.%). As TLP loses more weight than SS or digestates, more volatile matter is decomposed, so higher oil and gas yields than biochar yields are expected for this feedstock. The digestates gave the highest residue (45 wt.%) and showed quite similar TG and DTG profiles despite different feedstock compositions.
The thermogravimetric data revealed that the decomposition of the tested feedstocks occurred in three main stages (see Figure 1 and Table 3). The first stage (stage I) is attributed to mass loss due to dehydration of the low boiling fractions, mainly evaporation of intracellular water from the samples [82]. This occurred at a temperature interval between 25 and 200 °C. In this stage, the digestates lose approximately 3 wt.% of weight, while undigested SS and TLP around 4.5 wt.% and 6.5 wt.%. The main decomposition step, active pyrolysis (stage II), takes place in the temperature range of 200–550 °C, with most organic matter volatilized in this step. The greatest weight loss for all samples was observed in this stage (on average 40 wt.% for digestates, 59.7 wt.% for SS and 54.6 wt.% for TLP). The weight loss of SS and TLP was faster than the weight loss of digestates. The weight loss at this stage can be ascribed to the degradation of carbohydrates, hemicellulose and cellulose [80]. In the case of SS feedstock, thermal degradation of amino acids and proteins also occurred, which originates mainly from the bacteria present in the SS [14]. According to Hung et al. [28], the remaining solid residue at the end of the second stage could contain large amounts of inorganic minerals, such as calcite (CaCO3) and calcium phosphates (Ca3(PO4)2, Ca5(PO4)3(OH), and others). This could also apply to this study, as the presence of these components in biochars was later confirmed by XRD analysis. The last stage, passive pyrolysis (stage III), occurred at temperatures between 550 and 800 °C, where the degradation of high-temperature thermally stable components, such as lignin components happened. In contrast to SS and TLP, the digestates in this stage showed significant weight loss even at the highest temperatures (700–800 °C), which was associated with the deep decomposition of digestates, such as refractory organic matter, inorganic matter and char residues [12]. Decomposition of calcium carbonate and other minerals has been reported to occur in this temperature range as well [36].
The differences in the degradation mechanisms of the studied feedstocks are more evident from the DTG profiles. Their shape indicates that biomass decomposition incorporates more than one step. The DTG curves of the SS revealed two main overlapping peaks, the first (~300 °C) being associated with lipid degradation, while the second (~380 °C) is related to carbohydrate decomposition. The DTG curves of the TLP exhibited typical patterns of thermal degradation of lignocellulosic materials, as also observed in the case of camel grass [82], sawdust [14], or rice straw [29]. Lignocellulosic biomass usually consists of cellulose, hemicellulose, lignin, extractives, and a small portion of inorganic mineral matter [83]. The highest peak (~380 °C) corresponds to cellulose decomposition, which occurs between 325 and 400 °C with levoglucosan as the main pyrolysis product [83]. The shoulder before that peak (at ~300 °C) is related to hemicellulose pyrolysis, which takes place between 250 and 350 °C and is represented by xylan [84]. The long tail at higher temperatures is attributed to the decomposition of lignin, which is the most difficult to degrade because it consists of aromatic rings, e.g., benzene rings, connected with ether bonds, which are more stable and degrade in a wider temperature range, between 160 and 900 °C [5]. In the DTG profiles of the digestates, the peaks of cellulose and hemicellulose are less emphasized, indicating the lower content of these compounds in the digestates, which is due to their degradation during the AD process.
Detailed characteristics of the DTG curves, including the pyrolysis peak temperatures ( T p ) and the maximum values of the DTG curves (DTGmax) for the analyzed samples are presented in Table 3. The pyrolysis peak temperatures and DTGmax values were highest for TLP, while the other three SS-based feedstocks showed lower, but comparable values. For all feedstocks, a shift in T p for about 60 °C was observed when the heating rate was increased from 15 to 100 °C, reflecting that the heating rate affects the T p , and the pyrolysis process. The maximal value of DTG at a heating rate of 100 °C/min for the chosen sample was higher than that at 15 °C/min, suggesting that the heating rate enhances the thermal decomposition rate of the sample. This applies to all samples. Comparison of SS and digested SS (sample D1) showed that AD caused an increase in T p and DTGmax values. Similar observations regarding the effect of AD on these two parameters were found in one of the previous studies [12].
The findings associated with the degradation of the feedstocks used in this study are in agreement with the findings on the thermal degradation of sewage sludge [14,40], SS digestate [43], T. latifolia [24], as well as grass and its digestate [85].

3.2.2. The Influence of the Heating Rate

The heating rate plays an important role in the pyrolysis process, since the rate of change of heat affects the characteristics of pyrolysis products, especially biochar characteristics, such as porosity, surface area, volatile compound content, and biochar yield [31]. Therefore, the optimum heating rate for each material should be determined to obtain the products with desired properties.
Increasing the heating rate from 15 °C/min to 100 °C/min resulted in an absolute decrease in the weight loss of the digestates, by about 10 wt.% for digestate D2 and 6 wt.% for digestate D1. On the other hand, the heating rate has little effect on the weight loss of TLP and SS, as the differences in weight loss were almost negligible (~1%). Thus, the biochar yield increases at higher heating rates for the digested samples, but remains almost the same for the raw samples, which could be attributed to the AD pre-treatment affecting the composition of the materials. During AD pre-treatment, components, such as cellulose and hemicellulose, were degraded; therefore, the digestates lost less weight during pyrolysis than the raw samples, which is reflected in a higher biochar yield for these samples. However, the heating rates used in this study represent a slow pyrolysis process that yields less gases and produce more biochar [83].

3.3. Kinetic Analysis

The knowledge of reaction dynamics and kinetic parameters is essential for the design of a pyrolysis process [82]. In this study, two iso-conversional methods were applied in the kinetic analysis, the Kissinger–Akahira–Sunose (KAS) and Flynn–Wall–Ozawa (FWO) models. To determine the kinetic parameters, activation energy ( E α ), and pre-exponential factor ( A ), the linear fit plots were first constructed for all tested samples (digestates D1 and D2, sewage sludge and T. latifolia) using the KAS and FWO kinetic models, as shown on Figure S1 in the supplementary material. For TLP and SS, data for conversion values (α) between 0.1 and 0.9 were considered in the calculations, while for digestates D1 and D2, the data in the conversion range of 0.1–0.8 were applied. The data below or above these conversion degrees were excluded due to high fluctuations and low correlation coefficients. The correlation coefficients R2 were slightly higher when the FWO kinetic model was used, but in general the values for both models were quite close. The correlation coefficients for linear plots of the T. latifolia plant were >0.92, for sewage sludge >0.98, for digestate D1 > 0.88 and for digestate D2 > 0.79. Both models showed good agreement with the data representing SS or the TLP sample, while in the case of digestates the correlations were high up to a conversion level 0.5, afterwards they apparently decreased.

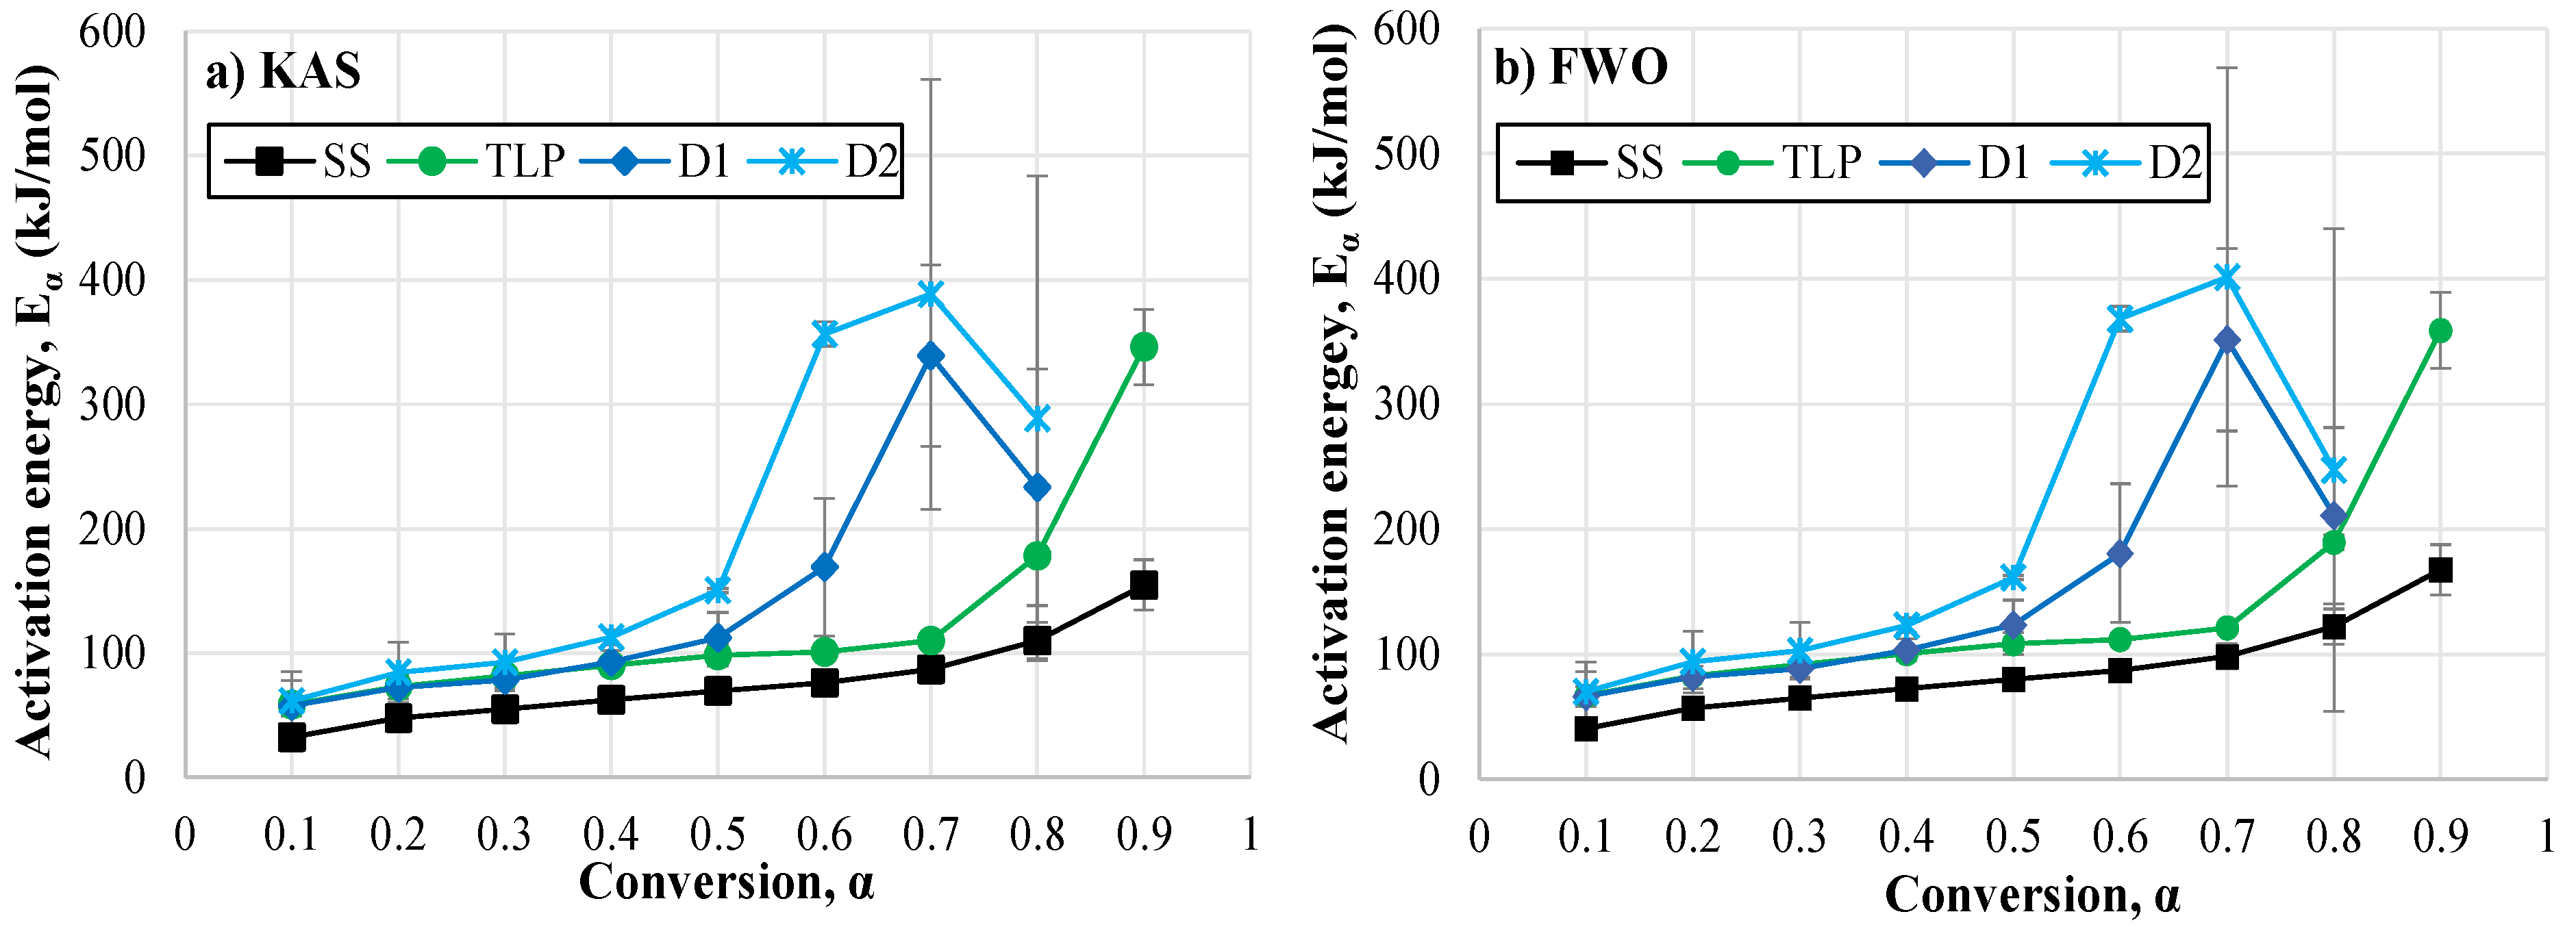
3.3.1. Activation Energy ( E α )

Activation energy is a barrier that must be overcome before a chemical reaction is occurred. It determines the reactivity of a material, sensitivity of a reaction rate, and is proportional to material stability [29]. The values of the activation energies E α calculated from the slopes of the linear plots at each degree of conversion are presented in Figure 2. The error bars represent confidence intervals with a confidence level of 95%.
The activation energy E α determined with the KAS and FWO kinetic models varied strongly with the conversion level, with significant differences found between digestate and raw samples.
In both kinetic models, E α for SS and TLP samples increased gradually with increasing conversion level. Above the conversion level of 0.7 (stage III), a more significant increase was noticed, corresponding to the decomposition of lignin and proteins in the biomass. High E α values at higher conversion degrees were also reported for pyrolysis of SS and its co-pyrolysis with rice husks [33]. The maximum value of 167 kJ/mol for SS and 359 kJ/mol for TLP was calculated at a conversion level of 0.9 by the FWO model. The KAS model gave lower values (SS–154 kJ/mol, TLP–346 kJ/mol). The differences in activation energies between the models comes from the different approximations used to solve the temperature integral. For the digestates D1 and D2, the E α values increased slowly up to the conversion level of 0.4, after which a huge increase was observed, and the highest E α values for both digestates were calculated at a conversion level of 0.7. From this point on, the values declined. The increase in E α indicates endothermic reactions while the decrease is associated with exothermic reactions [86]. The decrease in E α at a higher degree of conversion may be ascribed to the porous structure of the intermediate formed, which increases diffusion, the release of volatiles, and further decomposition with metal, thus catalyzing the degradation process [69]. Besides, the formation of biochar is also reflected in a decrease of activation energy [82]. The E α for digestate D1 varied in the range of 66–351 kJ/mol for the KAS model and from 57 to 339 kJ/mol for the FWO model. The E α for digestate D2, with a more complex composition, were generally higher (FWO model: 70–401 kJ/mol, KAS model: 62–388 kJ/mol). The higher values of E α in the case of digested compared to undigested biomass were most likely the consequence of stabilization of biomass during the AD process. Anaerobic digestion promotes several biochemical reactions in the biomass in which the organic material is converted into methane and carbon dioxide [3], therefore digestates after AD contained less organic material and higher content of inorganic material, e.g., minerals, which impacts thermal degradation and causes an increase in E α at higher conversion levels. It seems that minerals and inorganic matter originated from SS act as a barrier and hinder the diffusion of heat and the release of degraded volatiles, causing E α to increase. Similar results were observed in one of the previous studies where minerals in manure feedstock also caused the increase of E α [29]. Different E α at different conversions illustrate the multi-step complex reaction mechanism of thermal decomposition of the analysed samples, depicted by the progressive change of E α with conversion [87]. In particular, digestates are composed of various constituents with different reactivities resulting from the differences in chemical nature and inherent structure of the constituent components and, therefore, each constituent contributes to the overall E α [69].
The higher E α values in the case of TLP compared to SS may arise from higher content of cellulose and lignin in this sample. The same is true for digestate D2, which likewise contained TLP, which is reflected in the higher E α due to the more complex structure of the sample due to the presence of lignocellulosic components.
Higher E α values were reported for cellulose than for hemicellulose in previous studies [5], while lignin was characterized by both lower and higher values than cellulose, depending strongly on the feedstock type. Thus, the strong increase in E α values at conversion levels above 0.7 for TLP could be related to lignin degradation. The E α values of both digestates and TLP were very close to each other up to conversion point 0.5, from that point on, the differences become larger. According to the results, pyrolysis of SS is the reaction that proceeds most easily, followed by pyrolysis of TLP, while the highest barrier has to be overcome in the pyrolysis of digestates, particularly digestate D2.
The literature review regarding E α revealed that the E α values for the feedstocks analysed in this study are comparable to those reported for similar feedstocks. A detailed comparison of activation energies and other kinetic and thermodynamic parameters, which will be discussed in detail in the following sections, is presented in Table 4. For SS, the E α values in a wider range were reported, between 46 and 232 kJ/mol [69], while for T. latifolia a narrow area was stated, 135–204 kJ/mol [24]. For SS digestate, the values ranged between 49 and 198 kJ/mol in one of the studies [34], and from 90–227 kJ/mol in another [42]. The upper limit of E α values for SS digestate obtained in this study is higher than in the case of other digestates, but it must be considered that the conversion range for reported E α could be different. No data for E α of digestates composed of SS and lignocellulosic biomass can be found in the literature. Nevertheless, some correlations could be made with swine manure digestate [45], corn stover digestate [88], roadside grass digestate [85], and other lignocellulosic rich digestates [25,44]. As shown in Table 4, the E α varied greatly with the type of feedstock. A comparison for some other lignocellulosic materials (para grass, camel grass, castor residue, canola residue, etc.) is also carried out.

3.3.2. The Pre-Exponential Factor ( A )

The values of pre-exponential factors ( A ) for the analyzed feedstocks, calculated by the KAS and FWO models, are presented in Table 5. The pre-exponential factor describes the solid phase reaction dynamics and reaction chemistry, which is an essential factor for the optimization of biomass pyrolysis and is directly related to the material structure [69]. In general, the pre-exponential factors showed the same variational trend as E α . For example if E α increases with the conversion level, then A increases as well. The values of A calculated with the FWO model ranged between 12 × 101–4.85 × 10¹³ 1/s for SS and between 2.18 × 10³–4.83 × 1028 1/s for TLP. For these two samples, the values were in almost the whole conversion range, except for the highest conversions below 109 1/s, which could mainly indicate a surface reaction. On the other hand, if the reactions are not surface dependent, low A values may also indicate a closed complex [86]. The pre-exponential factors for SS and TLP are comparable to the pre-exponential factors of similar feedstocks reported in the literature, while a much wider range for the A values was calculated for digestates D1 and D2, as for the digestates from other studies (see Table 4). The explanations could be found in the presence of SS in the digestate samples and the more complex composition of digestates, since digestates contain both organic and inorganic material. The A values calculated with the FWO model ranged for digestate D1 between 6.73 × 10³–3.80 × 1030 1/s and for digestate D2 between 1.37 × 10⁴–5.43 × 1034 1/s. The KAS model gave similar results. The A values for digestates D1 and D2 were at lower conversion levels <109 1/s, while at conversion levels above 0.4 they were >109 1/s. This behavior indicates a multi-phase reaction due to the complex nature of these feedstocks, where degradation is slower and the reactions require more energy and a higher rate of molecular collisions [45]. Therefore, higher values of A indicate a simple complex [86].

3.3.3. Kinetic Compensation Effect

To characterize the dependence of E α and l n A on the conversion degree, the kinetic compensation effect is frequently used [70]. The relation between the pre-exponential factors ( l n A ) and activation energy ( E α ) for the tested feedstocks is presented in the supplementary material, in Figure S2. For all samples, the linear relationship between Arrhenius parameters was observed in the case of both kinetic models (KAS and FWO), which can be expressed as follows: l n A = a E α + b . This reflects that there exists a compensation effect between E α and l n A during pyrolysis, where the constants a and b refer to the compensation coefficients [90]. The correlation coefficients R2 for the linear fit plots for digestate D1 were >0.97 and for digestate D2 > 0.93. For SS and T. latifolia, the R2 were >0.99. High correlation coefficients indicate that the KAS and FWO kinetic models are suitable for describing the pyrolysis data of the tested feedstocks in the chosen conversion range.

3.4. Thermodynamic Analysis

The values of thermodynamic parameters (enthalpy Δ H , Gibbs free energy Δ G , and entropy Δ S ) for sewage sludge, T. latifolia and solid digestates D1 and D2, calculated at DTG peak temperatures (heating rate of 15 °C/min) using the KAS and FWO methods, are shown in Table 5.

3.4.1. Enthalpy ( Δ H )

The enthalpy Δ H for all feedstocks changed significantly with the conversion level and followed a similar trend as the activation energy E α (Table 5). The Δ H for SS ranged between 36 and 163 kJ/mol for the FWO and 27–150 kJ/mol for the KAS methods, while for TLP it ranged from 62–354 kJ/mol for the FWO and 53–341 kJ/mol for the KAS methods. The KAS model gave lower values in all cases. Positive values of Δ H indicated an endothermic process, implying that an external source of energy needs to be provided to convert the biomass to its transition state [4]. The Δ H for TLP in the literature ranged from 130–199 kJ/mol [24], while for SS it ranged from 11 kJ/mol [89] to 318 kJ/mol [41] depending on the conversion level. As shown in Table 5, the lowest Δ H values at the specific conversion point were calculated in the case of SS, followed by TLP and digestate D1. The feedstock with the highest Δ H was digestate D2 (65–397 kJ/mol, calculated by the FWO method). For comparison, the Δ H of the swine manure digestate in one of the earlier studies ranged between 179 and 219 kJ/mol [45]. Otherwise, Δ H represents the total energy required for pyrolysis of biomass and its conversion into final products such as biogas, bio-oil and biochar [41]. Therefore, digestate D2 requires the highest amount of energy to be provided for the formation of the final products compared to other samples. The Δ H differed from E α at each conversion point by 4.70 kJ/mol for SS, 5.15 kJ/mol for TLP, 4.76 kJ/mol for digestate D1, and 4.82 kJ/mol for digestate D2. The difference between E α and Δ H indicates the possibility of the pyrolysis reaction occurring (Rasam et al., 2020). Small differences indicate that only a small amount of additional energy (~5 kJ/mol) is required to form the final product.

3.4.2. Gibbs Free Energy ( Δ G )

The Gibbs free energy Δ G , also called free enthalpy, reflects the total energy increase of the system for the formation of the activated complex and thus shows bioenergy potential of the biomass [86]. The Δ G calculated by the FWO method for SS, digestate D1 and digestate D2 were in the range of 161–167 kJ/mol, 160–168 kJ/mol, and 161–170 kJ/mol, respectively. According to the results presented in Table 5, these three feedstocks have very similar bioenergy potential. The T. latifolia plant showed the highest Δ G values among all feedstocks (174–183 kJ/mol) and had the highest bioenergy potential. In contrast to the enthalpy Δ H , the Gibbs free energy Δ G was quite stable and showed only little variation with the conversion degree. The values calculated with the KAS model were very similar. The Gibbs free energies of the tested feedstocks are comparable to those for SS, TLP and other lignocellulosic materials in the literature (see Table 4).

3.4.3. Entropy ( Δ S )

The entropy Δ S of a system represents the degree of disorder in a reaction system, and in the context of pyrolysis it reflects the degree of arrangement of carbon layers in biochar samples [38]. The Δ S for digestate D1 ranged from −185 to 327 J/(mol·K) and for digestate D2 from −180 to 406 J/(mol·K). These values are in agreement with the Δ S values of swine manure digestate, sewage sludge, canola residue and para grass (Table 4). Values were mostly negative at lower conversion levels and positive at higher levels (Table 5). The occurrence of both negative and positive values reflects that the thermal conversion of the digestates D1 and D2 is more complex than the conversion of SS and TLP, both of which had negative Δ S throughout the conversion range (with one exception at the highest conversion point of 0.9 for TLP). At the conversion points with negative Δ S , the Δ G values were higher than Δ H , suggesting that a significant fraction of heat energy provided to the system is excess or free energy [38]. The occurrence of negative Δ S and positive Δ G values implies that thermal decomposition of biomass is a non-spontaneous process [91]. Negative Δ S values illustrate a more organized structure of the activated complex (product) compared to the feedstock and that the degree of disorder of the activated complex is lower compared to the feedstock, therefore the reactivity is low with long reaction times [29]. On the other hand, a positive Δ S indicates that the material is far from its thermodynamic equilibrium and the reactivity is high with short reaction times [54].

3.5. Characterization of Biochars

The properties of biochar have great influence on its further use and depend on various parameters, such as type of feedstock, temperature [55], heating rate [53], and residence time [31]. The obtained biochars were characterized by chemical analysis, elemental analysis, XRD, FTIR, and SEM–EDS analyses, the results of which are presented below. The results of the cress seed germination test and biosorption experiments performed on digestate derived biochars are also presented.

3.5.1. Chemical Characteristics of Biochars

The pyrolysis temperature significantly affects the distribution and properties of the final products [30]. Therefore, the chemical composition of the produced biochars was determined, focusing on elemental, heavy metal and nutrient analysis. The parameters varied depending on the type of feedstock. Comparison of the parameters between the biochars (Table 6) and feedstocks (Table 2) showed that the content of elements H, N, O and S in the biochars decreased due to the degradation of organic material. The content of C decreased in all biochars except TLP biochar, where it increased. The opposite trend in carbon content suggests that the pyrolysis mechanisms of TLP and the other three feedstocks that contained sewage sludge differed. Yin et al. [92] found a similar trend in the pyrolysis of SS and walnut shell. The decrease of C content in SS biochars was also noticed by other researchers [32]. The decrease in N content in TLP biochar was lower than that in biochars derived from SS and SS digestate. The explanation could be found in the chemistry of nitrogen in the feedstocks, as nitrogen is more volatile than the other nutrients and the concentrations may change differently depending on the biomass type and the chemistry of its binding [83]. Total nitrogen decreased mainly due to the loss of volatile nitrogen species (NH4 and/or NO3), which tend to convert to stable pyridine compounds at high pyrolysis temperatures [78].
Along with the decrease of C, H, N, and O, the molar ratios of H/C, O/C, and N/C also decreased in biochars. The H/C ratio together with volatile organic matter (VOM) content could be used as a parameter for the carbonization degree of biochar [32], because lower H/C ratio and VOM content indicate greater carbonization. In this study, digestate derived biochars showed the lowest H/C ratios. The lower ratios of H/C and O/C also indicated higher aromaticity and a less hydrophilic biochar surface [78]. Biochars with higher aromaticity are more resistant to decomposition and could be retained in the soil longer [93]. The O/C ratio of digestate derived biochars was higher than that of undigested SS and TLP, implying that digestate biochars contained more oxygen-containing functional groups. Digestate derived biochars showed very similar ratios, although the composition of their feedstocks differed. The changes in H/C and O/C also indicate the occurrence of dehydrogenative polymerization and dehydration polycondensation during pyrolysis, with significant loss of oxygen and aliphatic hydrogen [94]. The H/C and O/C ratios of the biochars from this study are consistent with the ratios of the sludge-based biochars obtained in other studies [51,78]. The decrease in N/C ratio in biochar mainly resulted from the reduction of N-related functional groups [94]. The biochar yield was highest for pyrolysis of digestates (44.8% for B-D1 and 45.5% for B-D2), lower for SS (32.5%), and lowest for TLP pyrolysis (25.6%). Biochar yields and higher heating values listed in Table 6 are comparable with the data for SS [95], and other bio-waste [50] given in the literature. The ash content in the biochars increased compared to the feedstocks. Digestate derived biochars contained more ash and had higher pH than biochars obtained from raw biomass. Ash content data are important because the ash plays an important role in biochar properties, such as surface area, pore volume, aromaticity, carbon stability, and sorption capacity [51]. The higher heating value of biochars was lower compared to that of the feedstocks.
The biochars showed alkaline characteristics as their pH value ranged from 9.4 to 11.2. The alkaline characteristics come from the release of alkali salts from the pyrolytic structure and organic nitrogen present as amine functionalities, which transforms into pyridine-like compounds [93]. The presence of metal oxides and minerals also leads to higher pH of the biochar, and high pH of the biochar ensures the safety of heavy metal leaching [52]. Biochars obtained from SS in other studies also showed alkaline properties, especially those obtained at higher pyrolysis temperatures, as pH increases with increasing temperature [96]. The content of heavy metals and macronutrients (P, Ca, Mg, K) in the biochars increased due to mass loss because of thermal degradation. Similar observations were also noted by Liu et al. [96]. However, potentially toxic elements in biochar, such as heavy metals, are usually transformed from bioavailable fraction into a more stable form during thermal conversion [53].
The content of heavy metals in biochar D2 was lower than that in biochar D1. This is most likely due to the co-digestion of SS with TLP, which caused the reduction of total heavy metal content in biochar D2. Co-digestion also improved the content of C and reduced the ash content in the biochar. The higher organic matter content and lower heavy metal content in biochar D2 indicated the higher quality of this biochar. Since biochar obtained from SS or other lignocellulosic biomass has been extensively studied, while there is a lack of knowledge on biochar derived from various digestates, the digestate derived biochars in this study were subjected to further characterization studies, biosorption experiments, and fertility tests.

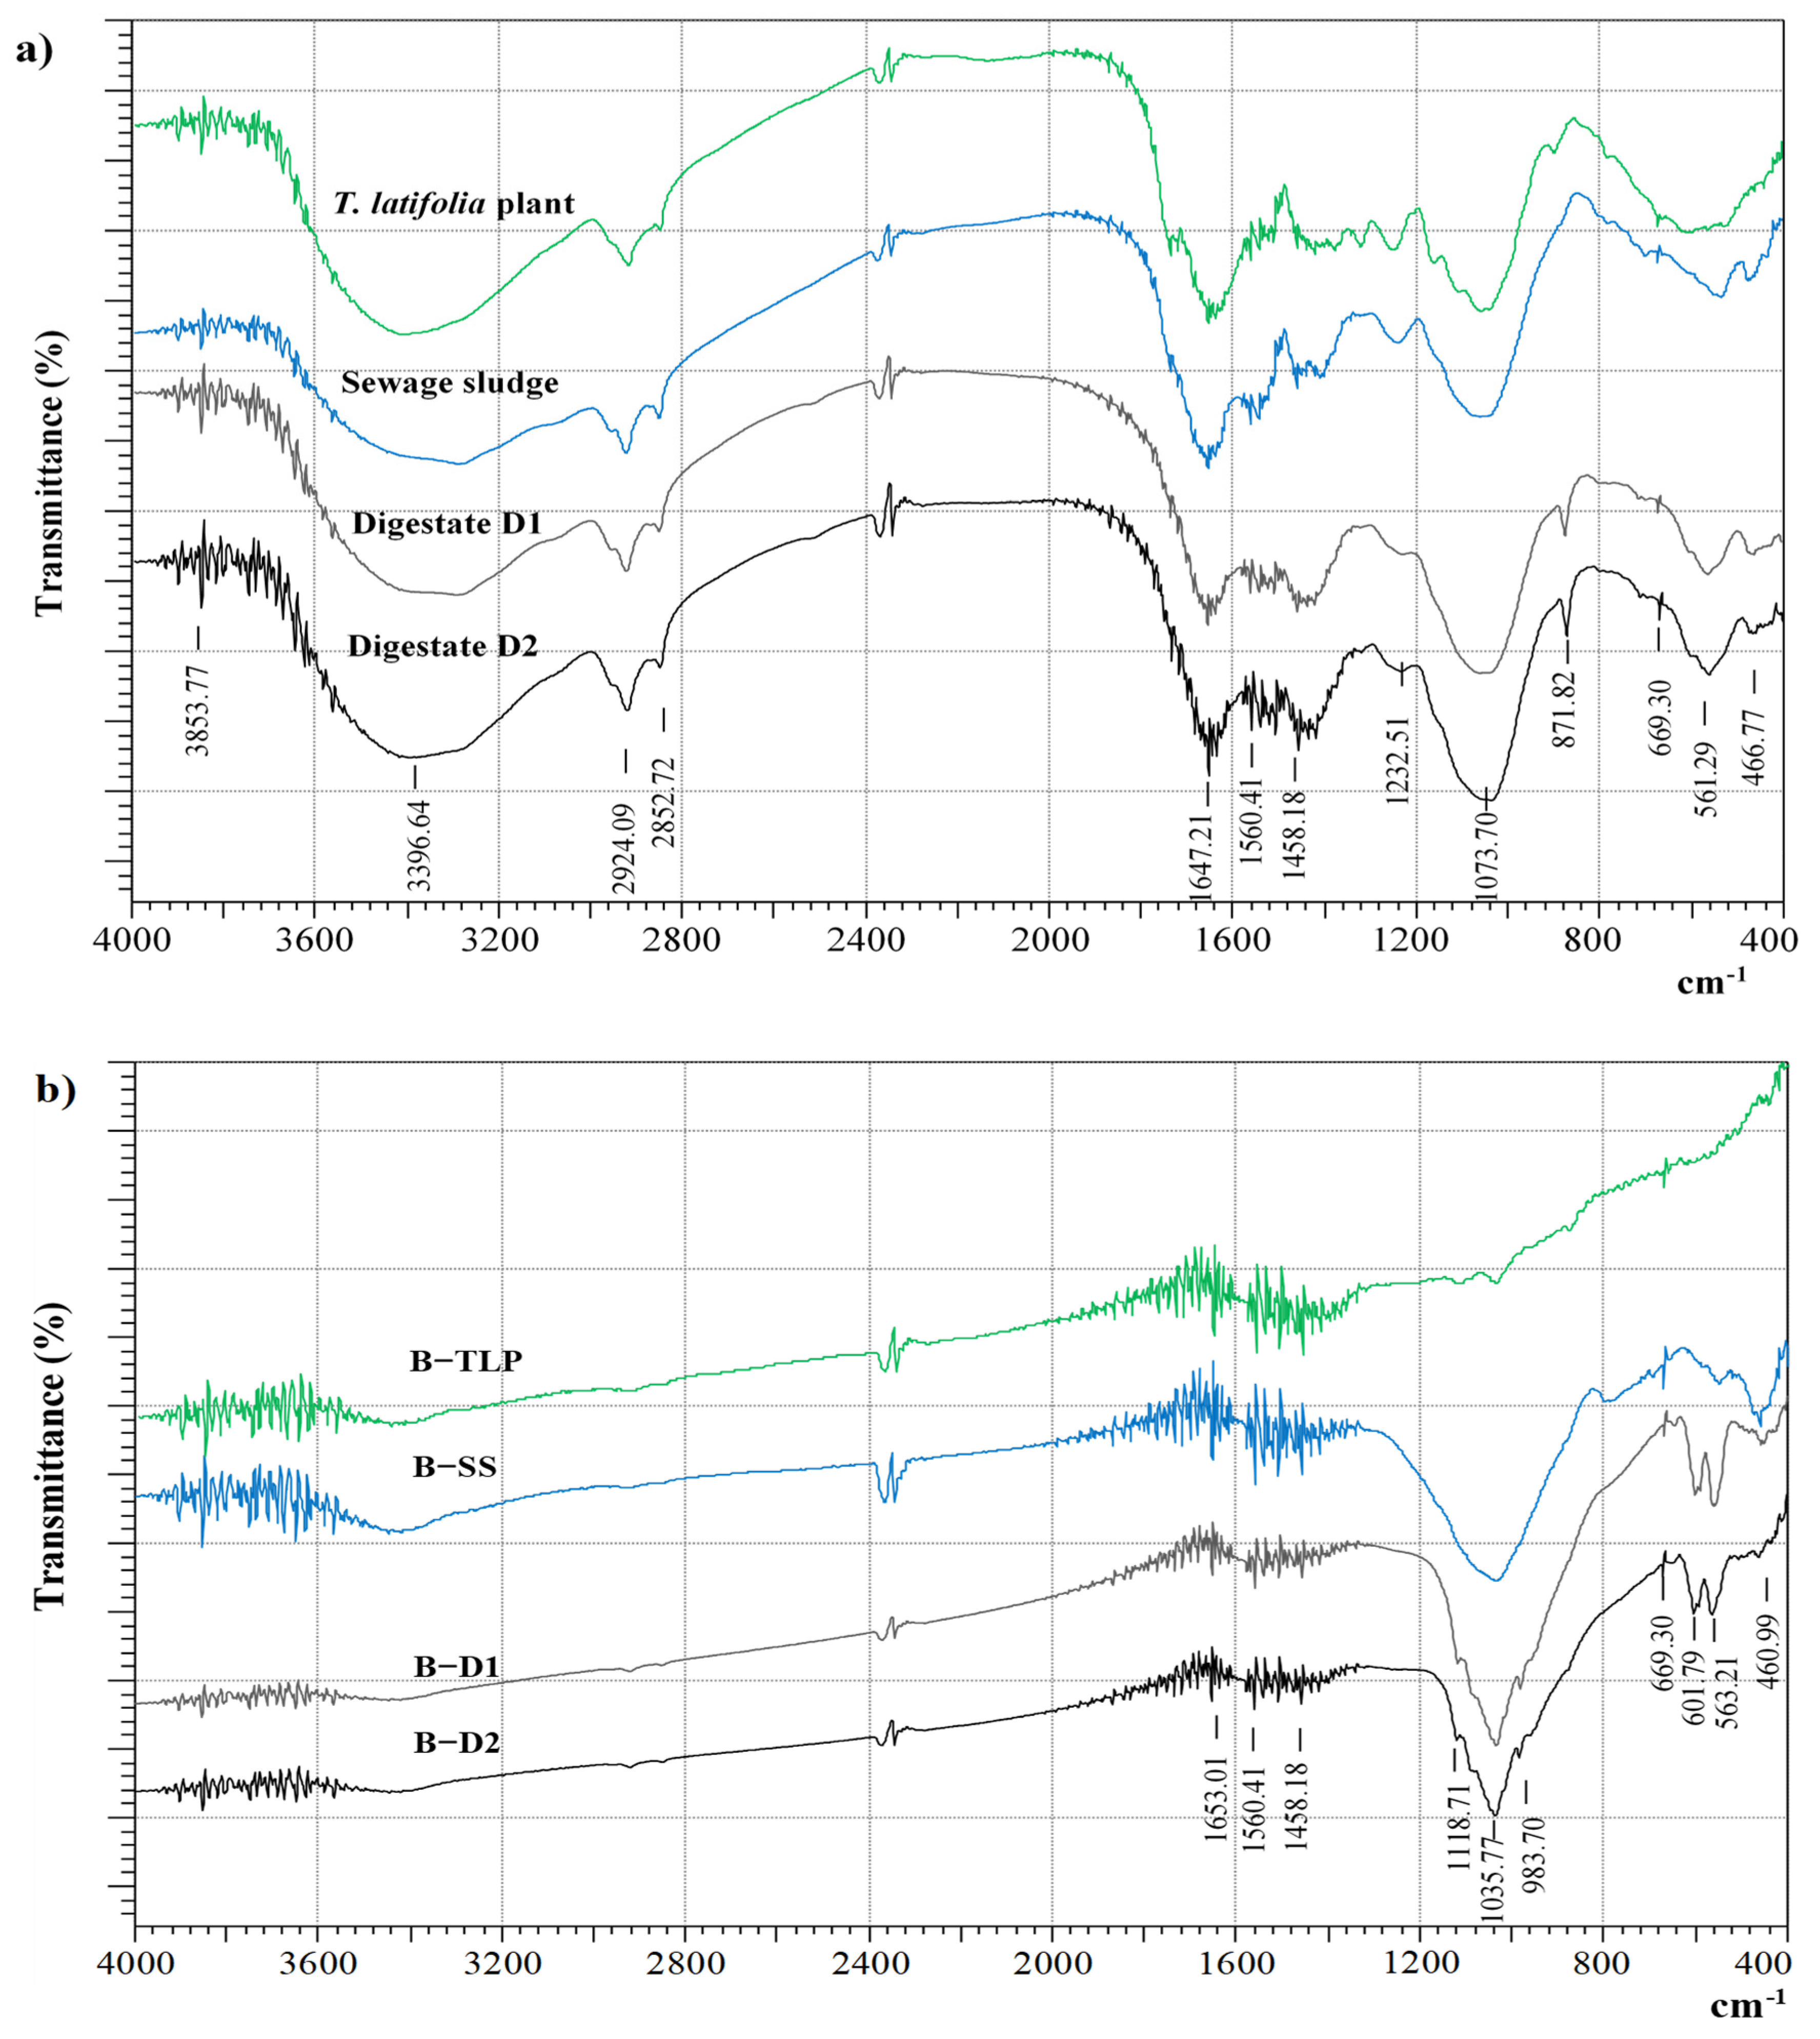
3.5.2. FTIR Analysis

The FTIR spectra of the feedstocks (sewage sludge, T. latifolia, and digestates D1 and D2) and the corresponding biochars (B-SS, B-TLP, B-D1, B-D2) obtained after pyrolysis of the feedstocks at 800 °C, are presented in Figure 3a,b, respectively. Before pyrolysis, several peaks were common for the tested feedstocks (Figure 3a). A broad peak in the range 3500–3100 cm−1 corresponds to the vibrations of hydroxyl groups (–OH) of water molecules and carbohydrates [97]. The vibrations of N-H groups also appear in this area due to presence of amines and amides. Peaks between 3000 and 2800 cm−1 indicate the aliphatic (–CHx) vibrations. The peak at 1647 cm−1 represents aromatic C=C vibrations and peaks at around 1400 cm−1 are attributed to aliphatic groups –CH2 and –CH3 [87]. The peak at 1073 cm−1 represents C–O and P-O bonds [30]. Lignin in the raw T. latifolia plant is represented by C=C aromatic vibrations (1653 cm−1), while hemicellulose and cellulose are represented by C=O (1765 cm−1), C-H (1375 cm−1), C-O-C (1240 and 1160 cm−1), C–O (1056 cm−1) and C-H vibrations (896 cm−1) [14]. Peaks at 777 cm−1 and 669 cm−1 are associated with aromatic hydrogen. SS and digestates shown the common peak at 1560 cm−1 associated with amide (-CO-NH-) originated from sewage sludge proteins [78]. The bands between 1550 and 1400 cm−1 are related to nitrogen compounds (N-H and N-O), while the peaks in the 400–600 cm−1 range are from metal-oxygen bonding [98]. The sharp peak at 871 cm−1 could correspond to calcium carbonate. The main differences between digested and undigested feedstocks are related to the AD pre-treatment that destroys the complex lignocellulose structure, which is reflected in the reduction of the intensity of some peaks. For example, the peak representing the C-O-C group (1240 cm−1) of hemicellulose and the linkages between hemicelluloses and lignin [87] is lower in the digestates. The results are in agreement with the findings of previous studies, where AD likewise caused a decrease in carbohydrates, protein (amide) compounds, fats, and lipids on the one hand, and an increase in aromatic compounds and polysaccharide groups (C-O) in the digestates on the other [12].
The FTIR spectra of the biochars (Figure 3b) reflect significant changes in chemical bonds and functional groups after pyrolysis of the feedstocks. The basic functional groups representing organic components, such as hydroxyl (-OH), amine (-NH) and aliphatic groups (-CHx), have almost disappeared, while the intensity of aromatic C=C ring stretching vibrations increases slightly. The disappearance of aliphatic groups in the biochars proved that the alkane groups were involved in the carbonization process [97], revealing that organic fatty hydrocarbons were converted into aromatic structures or decomposed into methane, carbon dioxide, and other gases during pyrolysis [51]. The disappearance of the majority of peaks in the case of TLP biochar illustrated deep decomposition of this sample due to the high pyrolysis temperature. The FTIR spectra of the SS biochar and digestate derived biochars were very similar. They showed a sharp peak at 1036 cm−1, which besides Si-O-Si vibrations also represents the vibrations of the PO43− group [47]. The absorption peak at 984 cm−1 refers to Al–O bonds [98]. Significant peaks were also detected between 400 and 600 cm1 reflecting vibrations of different oxides and silicates, such as Fe-O, Mg-O, Si-O-Si, and Si-O-Al vibrations [99]. Small peaks between 600 and 800 cm1 could be assigned to aromatic and hetero-aromatic compounds [93]. The differences in the composition of digestates did not essentially affect the functional groups of the biochars, as the FTIR spectra of biochars B-D1 and B-D2 are very similar. According to the FTIR analysis, the SS-based biochars contain functional groups that could cooperate in the adsorption process, and therefore could potentially be used as adsorbents for various ions from wastewater.

3.5.3. SEM–EDS Analysis

SEM images of digestate derived biochars (B-D1 and B-D2) are shown in the supplementary material in Figure S3a,b, respectively. The biochars consisted of irregular grains of various compositions and had a rough surface with porous structure containing small holes and pits on the surface. Differences in the composition of digestates had no special effect on the morphology of the biochars. The structure was consistent with the data regarding the specific surface area. The EDS spectra of biochars B-D1 (Figure S3c) and B-D2 (Figure S3d) revealed high contents of C, O, Si, P, K, Ca, and Mg in the samples, and Cl, Na, Al, and Fe were also detected. However, the contents of these elements varied among the samples. For example, biochar B-D2 contained a higher amount of C and lower amounts of heavy metals, while in biochar B-D1 Cu was also found. The results of the EDS analysis mainly agree with the results of the elemental and chemical analysis.

3.5.4. XRD Analysis

X-ray diffraction (XRD) analysis was performed to identify the crystalline phases in the digestate derived biochars. The XRD diffractograms of biochars B-D1 and B-D2 are presented in the supplementary material (Figure S4a,b). The XRD analysis revealed that the biochars have similar mineral compositions despite differences in the composition of feedstocks. Nevertheless, some differences in the contents of mineral phases were found. The main crystalline phases in biochar samples B-D1 and B-D2 were attributed to calcium phosphates, with hydroxyapatite (with variable Cl content) and whitlockite (with possible presence of Na) as the main representatives. Silicates were present in the form of mineral quartz (SiO2) and Al silicates (with variable Mg content). Ca-Mg-carbonates (Mg calcite) were also identified in the biochars, although Mg ions could be substituted by Fe ions, which were likewise present in biochars. Traces of other phases, such as iron oxides (hematite—Fe2O3, magnetite—Fe3O4), aluminum oxide, and pure carbon phases were detected as well. The obtained biochars have similar mineral characteristics as biochars obtained from sewage sludge [39] or sewage sludge digestate [58] in other studies.

3.5.5. The Potential of Digestate-Derived Biochars for Use as a Soil Enhancer

Biochars contain a range of macro- and micro-nutrients, making them valuable as soil amenders to enhance plant growth and to sustain and increase crop yield [83]. The potential of the digestate derived biochars (B-D1 and B-D2) for use as a soil enhancer was evaluated by performing a cress seed germination test. The results of the root length (RL) index and Munoo-Liisa vitality (MLV) index obtained after cress seeds (Lepidium sativum L.) were exposed to different concentrations of biochars B-D1 and B-D2 (2%, 6%, 10% and 15%) for 72 h, are shown in Figure 4.
The RL and MLV indexes of the control sample are given for comparison. The best results of RL and MLV indexes for both biochars were achieved when using 10 wt.% concentration of biochar. RL is expressed as the percentage difference of the root length of the tested material compared to the root length of the control sample. The highest RL index for biochar B-D1 was 206% and for biochar B-D2 182%. Both significantly exceeded the RL index of the control sample (100%). The highest MLV index, that compares the germination rate and the average lengths of roots in the test and control samples, was 206% for biochar B-D1, while for biochar D2 it was 195% (at 10 wt.% concentration). The concentration of 2 wt.% gave the worst results in both cases, even lower than the control sample, and therefore it is too low. At 15 wt.% concentration, the RL and MLV indexes of both biochars decreased, especially those of biochar B-D1. This could be connected with the phytotoxic effect of the biochars on the cress seeds. Nevertheless, the values of the RL and MLV indexes were still higher than in the case of the control sample. The phytotoxicity could occur due to the higher content of heavy metals in the biochars, especially Zn and Cu. High heavy metal concentrations negatively affect plant growth and biomass yield, and the toxic effect of heavy metals and their bioaccumulation in the plants is one of the major problems in the application of SS biochars as a soil amenders [63]. For example, Song et al. reported the problem of accumulation of Zn and Cu in garlic root and bulb [62]. The content of bioavailable heavy metals in the biochars can be efficiently reduced by selecting higher pyrolysis temperatures [100]. In addition, biochars derived at higher pyrolysis temperatures were reported to promote wheat growth more than biochars derived at lower temperatures [72]. Since the biochars in this study were obtained at relatively high temperature, this could be one of the reasons for their good performance and low toxicity.
Biochar B-D1 generally gave better results than biochar B-D2, which is a consequence of the different compositions of these two samples. Biochar B-D1 contained more P and Mg, while biochar B-D2 contained more N, K, and Ca. The advantage of using biochar B-D2 instead of biochar B-D1, despite lower RL and MLV indexes, is the lower content of heavy metals in this biochar. According to the results, the biochars obtained from digestates D1 and D2 have good potential to be used in agriculture as alternative sources of nutrients for plant growth. The optimum concentration for both biochars is around 10 wt.%.
The results of the germination test are comparable to the results of similar tests performed for SS biochars in previous studies, while the results cannot be compared with those for SS-digestate derived biochars, as these studies are quite rare. The concentrations of SS biochars of up to 5 wt.% were found to be efficient in a wheat seed germination test [72]. The same concentration was used in the cultivation of cucumber seeds [61]. In another study, 10 wt.% of SS biochar was optimal for improving cucumber growth, with cucumbers absorbing small proportions of potentially toxic elements from the biochar [101]. The positive effects of biochar addition to soil were likewise observed by Rehman et al. [63].
The soil pH values at the tested biochar concentrations ranged from 4.7 to 6.4 for biochar B-D1 and from 4.8 to 6.7 for biochar B-D2. The soil containing biochar B-D2 had a higher pH due to the higher pH of this biochar (the pH of B-D1 was 11.05 and that of B-D2 was 11.22, at biochar/water ratio of 1:20). Since the biochars have alkaline characteristics, no additional chemicals were added to the soil to ensure optimum pH for plant growth, i.e., between 5.5 and 6.5, according to the standard [73]. Besides improved soil fertility due to pH amendment, there are also some other benefits of using biochar in agriculture; it can increase the amount of bacterial biomass in the soil [102], improve the quality of nutrient-deficient soils, retain nutrients (especially N in permeable soils), improve carbon sequestration, supplement nitrogen fixation, and reduce bioaccumulation of heavy metals and polycyclic aromatic hydrocarbons (PAHs), which improves crop productivity [103]. However, since each biochar has unique characteristics, its fertility potential and phytotoxic effects should be carefully evaluated. Although digestate-derived biochars shows promising potential for use as a soil enhancer, further studies on the leaching of heavy metals and their accumulation in plants should be conducted to evaluate the possibility of their actual use for this purpose.

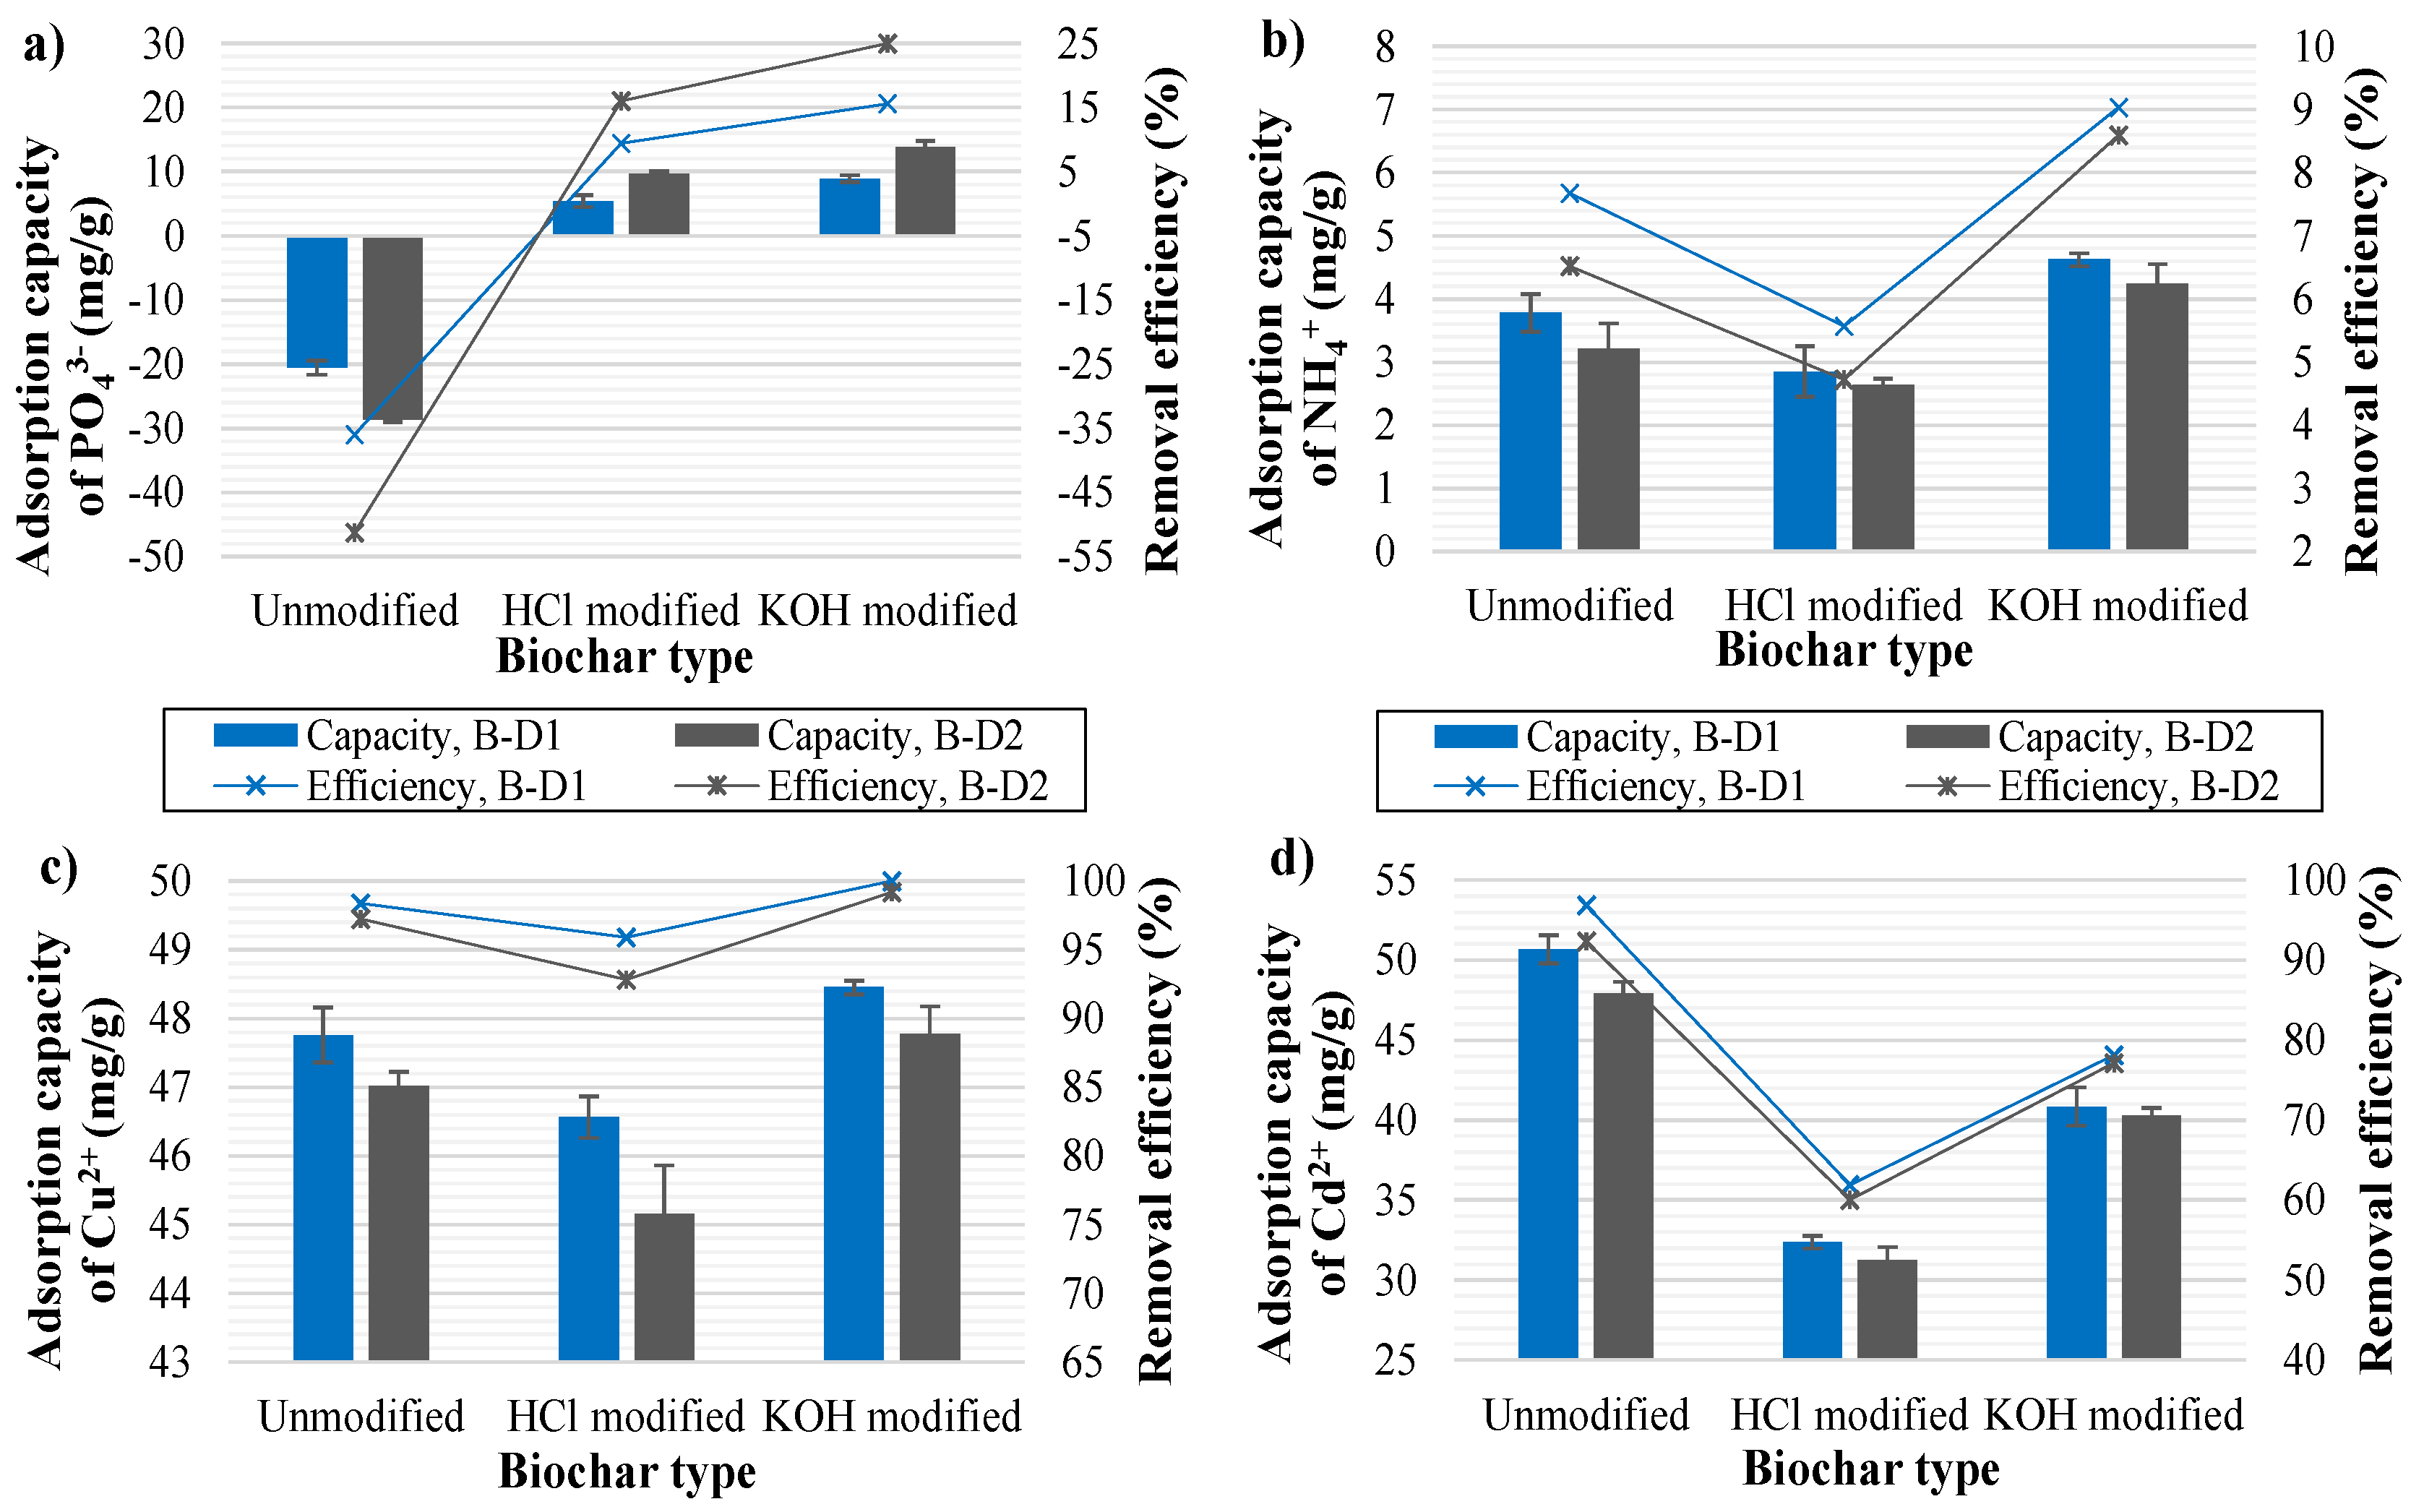
3.5.6. Biosorption Potential of Digestate-Derived Biochars

Biochars have specific properties such as large specific surface area, porous structure, and enriched functional groups which make them suitable as adsorbents for the removal of various pollutants from wastewater [103]. They can also be physically or chemically modified to produce so-called activated carbons, which have higher surface area and lower ash content [35]. Chemical activation also reduces mineral matter, activates carbonaceous materials, and increases the number of surface functional groups, which provides better cation and anion exchange properties [31]. In this study, digestate-derived biochars (B-D1 and B-D2) and their modifications were tested as biosorbents for the adsorption of NH4+, PO43−, Cd2+ and Cu2+ ions from a water solution at an initial concentration of 50 mg/L (pH 7). To enhance the biosorption capacity, the biochars were chemically modified by KOH or. HCl. The results of the biosorption experiments performed with HCl modified, KOH modified or unmodified biochars B-D1 and B-D2 are shown in Figure 5.
Both biochars showed relatively low adsorption capacities for NH4+ and PO43− ions, although PO43− adsorption was slightly better. In general, biochar B-D1 showed higher affinity for NH4+ ions, while biochar B-D2 for PO43− ions. The best results for PO43− adsorption were achieved with KOH modified biochars, then with HCl modified biochars, while unmodified biochar even gave negative biosorption capacities (Figure 5a). This could be explained by the leaching effect of PO43− ions from biochars [104]. In the case of the modified biochars, leaching was not possible because PO43− ions were already leached during modification with HCl or KOH. However, the highest biosorption capacities for PO43− ions were obtained in the case of KOH modified biochar, 8.91 mg/g for biochar B-D1 and 13.89 mg/g for biochar B-D2. The corresponding removal efficiencies were 15.6% (B-D1) and 24.9% (B-D2). The binding of ions on the biochar surface can take place in several ways, via physical adsorption, chemical adsorption, electrostatic interaction, precipitation, complexation of ions and ion exchange process [103]. Lewis acid-base interactions, electrostatic interactions, and ligand exchange are mentioned as among the most common controlling mechanisms for PO43− removal with SS biochars [105], which could also be applicable to this study.
Regarding the adsorption capacities of biochars for PO43− ions, the values in the literature vary considerably, as the removal efficiency is closely related to the biochar type, modification and pH of the solution. Yin et al. [92] reported capacities of around 50 mg/g for SS biochar at a PO43− conc. of 50 mg/L, while Xu et al. [106] achieved an adsorption capacity of 15.2 mg/g at an initial conc. of 80 mg/L. The PO43−-P adsorption capacity of the dolomite-modified SS biochar was 19.9 mg/g (conc. of 50 mg/L) [57], while Ca-rich SS biochar showed a capacity of 27.4 mg/g at a PO43− conc. of 40 mg/L [60]. A much lower P uptake was reported in another study, less than 1 mg/g was adsorbed at an initial concentration of 50 mg/L, but it must be considered that the biochar was not modified [49]. On the other hand, the adsorption capacity on pyrolusite-activated SS biochar was 10.8 mg/g, (conc. of 50 mg/L) [97].
The adsorption of NH4+ ions was likewise most efficient when KOH-modified biochars were used (Figure 5b). Capacities of 4.62 mg/g (9.1% removal efficiency) for biochar B-D1 and 4.25 mg/g (8.6%) for biochar B-D2 were achieved. Modification with HCl negatively affected the biosorption capacity of NH4+ ions, as the removal efficiencies were lower than in the case of unmodified biochars. Interestingly, in contrast to this study, the modification of wheat straw biochar using a combination of HCl and FeCl3 increased the efficacy of the biochar in treating ammonium-contaminated wastewater [59]. Otherwise, the biosorption capacities for NH4+ ions achieved here were slightly higher than in other studies due to the KOH modification of the biochar. The NH4+ adsorption capacity of unmodified biochars is generally low, <20 mg/g [107]. In addition, sewage sludge biochars generally have a lower biosorption capacity for NH4+ ions than biochars derived from other organic materials. The biosorption capacity of 1.4 mg/g was achieved when SS biochar was used for the adsorption of NH4+ ions at a conc. of 80 mg/L [78]. Yin et al. [92] reported even lower capacities, 0.6 mg/g (at a conc. of 50 mg/L), while co-pyrolysis of SS with walnut shells improved the biosorption capacity up to 3 mg/g. The results of NH4+ biosorption capacity from this study are much closer to the biosorption capacities obtained by biochars derived from different wetland plant species, which have capacities between 0.8 and 5.5 mg/g at the same conc. of NH4+ ions (50 mg/L) [104].
However, there are several factors that affect the biosorption potential of biochar and its affinity for certain ionic species. It has been reported that the specific surface area of the adsorbent is one of the factors that significantly affects NH4+ adsorption, while it does not affect PO43− adsorption [92], because the surface area of biochar is mostly negatively charged. The specific surface area, average pore size, and pore volume of biochar B-D1 were equal to 32.9290 m2/g, 7.4885 nm, and 0.0563 cm3/g, respectively, while biochar B-D2 had higher surface area of 60.0527 ± 0.5038 m2/g, lower pore size (6.6904 nm), and higher pore volume (0.0788 cm3/g). Although the surface area of biochar B-D2 was higher than that of biochar B-D1, its adsorption capacity for NH4+ ions was lower. However, the specific surface area of the tested biochars is comparable to the specific surface areas reported in the literature. For example, a specific surface area of 101.9 m2/g was measured for biochar derived from manure digestate (at 800 °C) [28], while a specific surface area between 15 and 89 m2/g was reported for sewage sludge biochars derived at high temperatures (600–900 °C) [48,51,100]. Higher pyrolysis temperatures (>700 °C) generated more pores and higher surface area due to high aromaticity caused by thermal decomposition of lignocelluloses and volatilization of inorganic minerals [28]. The surface area values of lignocellulose derived biochars are generally in a larger range of 2–500 m2/g than those of SS, because the compact nature of sewage sludge restrict the formation of developed porosity structures [100].
Besides the surface area, the oxygen-containing surface functional groups have a great influence on the adsorption capacity of NH4+ ions, especially alkyl and carboxyl groups form chemical or electrostatic interactions with NH4+ ions [92]. Therefore, biochars with higher O/C ratios could have a higher NH4+adsorption capacity [104]. The O/C ratio of unmodified biochars B-D1 and B-D2 was almost the same (0.09 and 0.10), therefore, it could not significantly impact the adsorption capacity. On the other hand, the coexistence of P, Mg and different metal elements on the biochar surface also contributes to NH4+ removal. Since biochar B-D1 contained higher amounts of metals, as well as P and Mg, than biochar B-D2, this could explain its better performance in NH4+ biosorption. The presence of surface functional groups and metals on the biochar surface is likewise crucial for the adsorption efficiency of PO43− ions, as ligand exchange could occur between metal oxides and PO43− ions [97]. Furthermore, elements such as Ca, Si, Al, Fe, Ca, and Mg could serve as active sites and react with PO43− through complexation or formation of precipitates, with Mg and Ca in particular significantly promoting PO43− adsorption due to strong divalent cation bridging [107]. A higher Ca/P ratio of biochar B-D2 compared to biochar B-D1 reflects the higher adsorption capacity of biochar B-D2 for PO43− ions. Both biochars had a similar Mg/P ratio, so its influence was less significant.
The binding between functional groups and selected ions is also highly affected by the pH of the solution. The optimal pH value for NH4+ adsorption was reported in the range of 7–9, while PO43− could be adsorbed in a wider pH range, between 4 and 9 [92]. Lower pH values cause the protonation of functional groups on the biochar surface and the removal efficiency of NH4+ could therefore be lower [107]. This could explain the lower capacities achieved when HCl modified biochar was used, as it lowered the pH of the solution (despite initial adjustment) compared to KOH modified biochar, which increased the pH of the solution. Another reason for the better performance of KOH modified biochar compared to HCl modified biochar is most likely due to the higher increase in the specific surface area of the biochar, as alkali treatment could significantly increase the specific surface area [108], which is one of the major factors affecting NH4+ adsorption.
The results of adsorption of heavy metals (Cu2+ and Cd2+) performed at the same experimental conditions as adsorption of NH4+ and PO43− ions are presented in Figure 5c,d. KOH modified biochars were found to be the most efficient for the biosorption of Cu2+ ions, followed by unmodified biochars. The highest biosorption capacity for Cu2+ ions was achieved with biochar B-D1, 48.45 mg/g (removal efficiency >99%). Biochar B-D2 showed very similar biosorption capacities. Modification of biochars with HCl has a negative effect on Cu2+ biosorption, as well as on Cd2+ biosorption. The explanation for the better performance of the KOH modified and unmodified biochars over the HCl modified biochars could be connected with the alkalinity properties of these biochars. However, it is interesting to note that the KOH modification decreases the pH of the biochars. For biochar B-D1, the decrease from pH 11.05 (unmodified biochar) to pH 9.87, and for biochar B-D2 from 11.22 to 9.79 was observed. In the case of HCl treatment, the pH value decreased to 4.60 for biochar B-D1 and 4.22 for biochar B-D2. Modification of biochars by KOH also brings several advantages, it increases the number of hydroxyl groups on the surface, dissolves ash, condenses organic matter in the biochar [58] and produces a larger surface area with higher H/C, N/C, and lower O/C ratios [31]. Modification with KOH was also found to be successful in other studies. Wongrod et al. [58] reported enhanced Pb2+ sorption when SS digestate biochar was treated with KOH solution. On the other hand, acid modification removes impurities, such as heavy metals, and introduces the acidic functional groups on the surface of the biochars, but in some cases, it may also decrease the surface area [102], which could be one of the explanations for the lower performance of HCl modified biochars in adsorbing heavy metals in this study.
In contrast to Cu2+ ions, the highest biosorption capacities for Cd2+ ions were achieved with unmodified biochars, followed by KOH modified biochars. The maximum biosorption capacity of 50.67 mg/g was calculated for biochar B-D1 (97% removal efficiency) and 47.92 mg/g (92%) for biochar B-D2. The differences in biosorption capacities of unmodified and modified biochars were higher in the case of Cd2+ ions than Cu2+ ions. Biochar B-D1 generally has a better affinity for heavy metals than biochar B-D2. However, the tested biochars exhibit higher biosorption capacity for biosorption of heavy metals than for NH4+ or PO43− ions. This could be related to the presence of mineral phases such as aluminosilicate, quartz, calcite and metal oxides on the biochar surface, which promote the sorption of metals [108]. The main mechanisms responsible for the heavy metal adsorption on biochar include complexation with oxygen-containing functional groups (-OH, -COOH), coordination of heavy metals with π electrons in unsaturated bonds (-CH, C=O and C=N), precipitation with different minerals such as PO43 and ion exchange with positively charged ions such as K+, Ca2+, Na+ and Mg2+ [48]. In particular, π-electrons in biochars with the aromatic structure have been reported to have a strong potential to bind heavy metals [93].
The adsorption capacities for Cu2+ and Cd2+ ions obtained in this study were slightly higher than those reported in other works, but the comparison is difficult because the biosorption properties of biochars depend highly on the pyrolysis temperature and type of modification, while the initial ion concentrations also varied. For Cu2+ adsorption by SS biochar, one of the studies reported a capacity of 5.3 mg/g (initial conc. of Cu2+ 100 mg/L) [109], while another reported 11 mg/g [110]. Biosorption capacities of up to 89 mg/g for Cu2+ and 93 mg/g for Cd2+ were achieved with hydroxyapatite-modified sewage sludge biochar, and the capacity lower than 15 mg/g with unmodified biochar at initial conc. of 100 mg/L [111]. Similar removal capacities for SS biochar of around 20 mg/g were obtained at a Cd2+ concentration of 50 mg/L in studies performed by Chen et al. [52] and Gao et al. [48]. When SS biochar obtained by an electromagnetic induction heating method was used, a biosorption capacity of 32.3 mg/g for Cd2+ ions (100 mg/L) was achieved [32]. Compared with the above results, the biochars from this study showed good adsorption performance for Cu2+ and Cd2+ ions, so their application as biosorbents for the removal of heavy metals from wastewater could be possible. Further experiments on multi-metal biosorption or biosorption of multiple pollutants need to be performed in addition to the experiments with real wastewater.

4. Conclusions

In this work, kinetic and thermodynamic analyses of two types of solid digestate subjected to pyrolysis process were presented: (i) sewage sludge digestate and (ii) digestate obtained from co-digestion of sewage sludge and lignocellulosic biomass—specifically the plant T. latifolia. Pyrolysis of raw SS and TLP was performed as well for the comparison. Based on the experimental results, the following conclusions were made:
  • Thermogravimetric analysis revealed that the digestate samples had lower weight loss than raw SS or TLP due to pre-treatment with AD and gave higher biochar yield. E α values were higher for digestate than for raw samples. The maximum values were obtained for digestate composed of a mixture of SS and TLP. The KAS and FWO models showed excellent matching for raw materials, while for digestates, lower correlations were observed, most likely because of heterogeneous constitution, which influenced the pyrolysis process. Variation of the thermodynamic parameters ( Δ H , Δ G and Δ S ) indicated that the degradation of digestates is more complex than degradation of SS or TLP. TLP with the highest Δ G values exhibited the highest bioenergy potential.
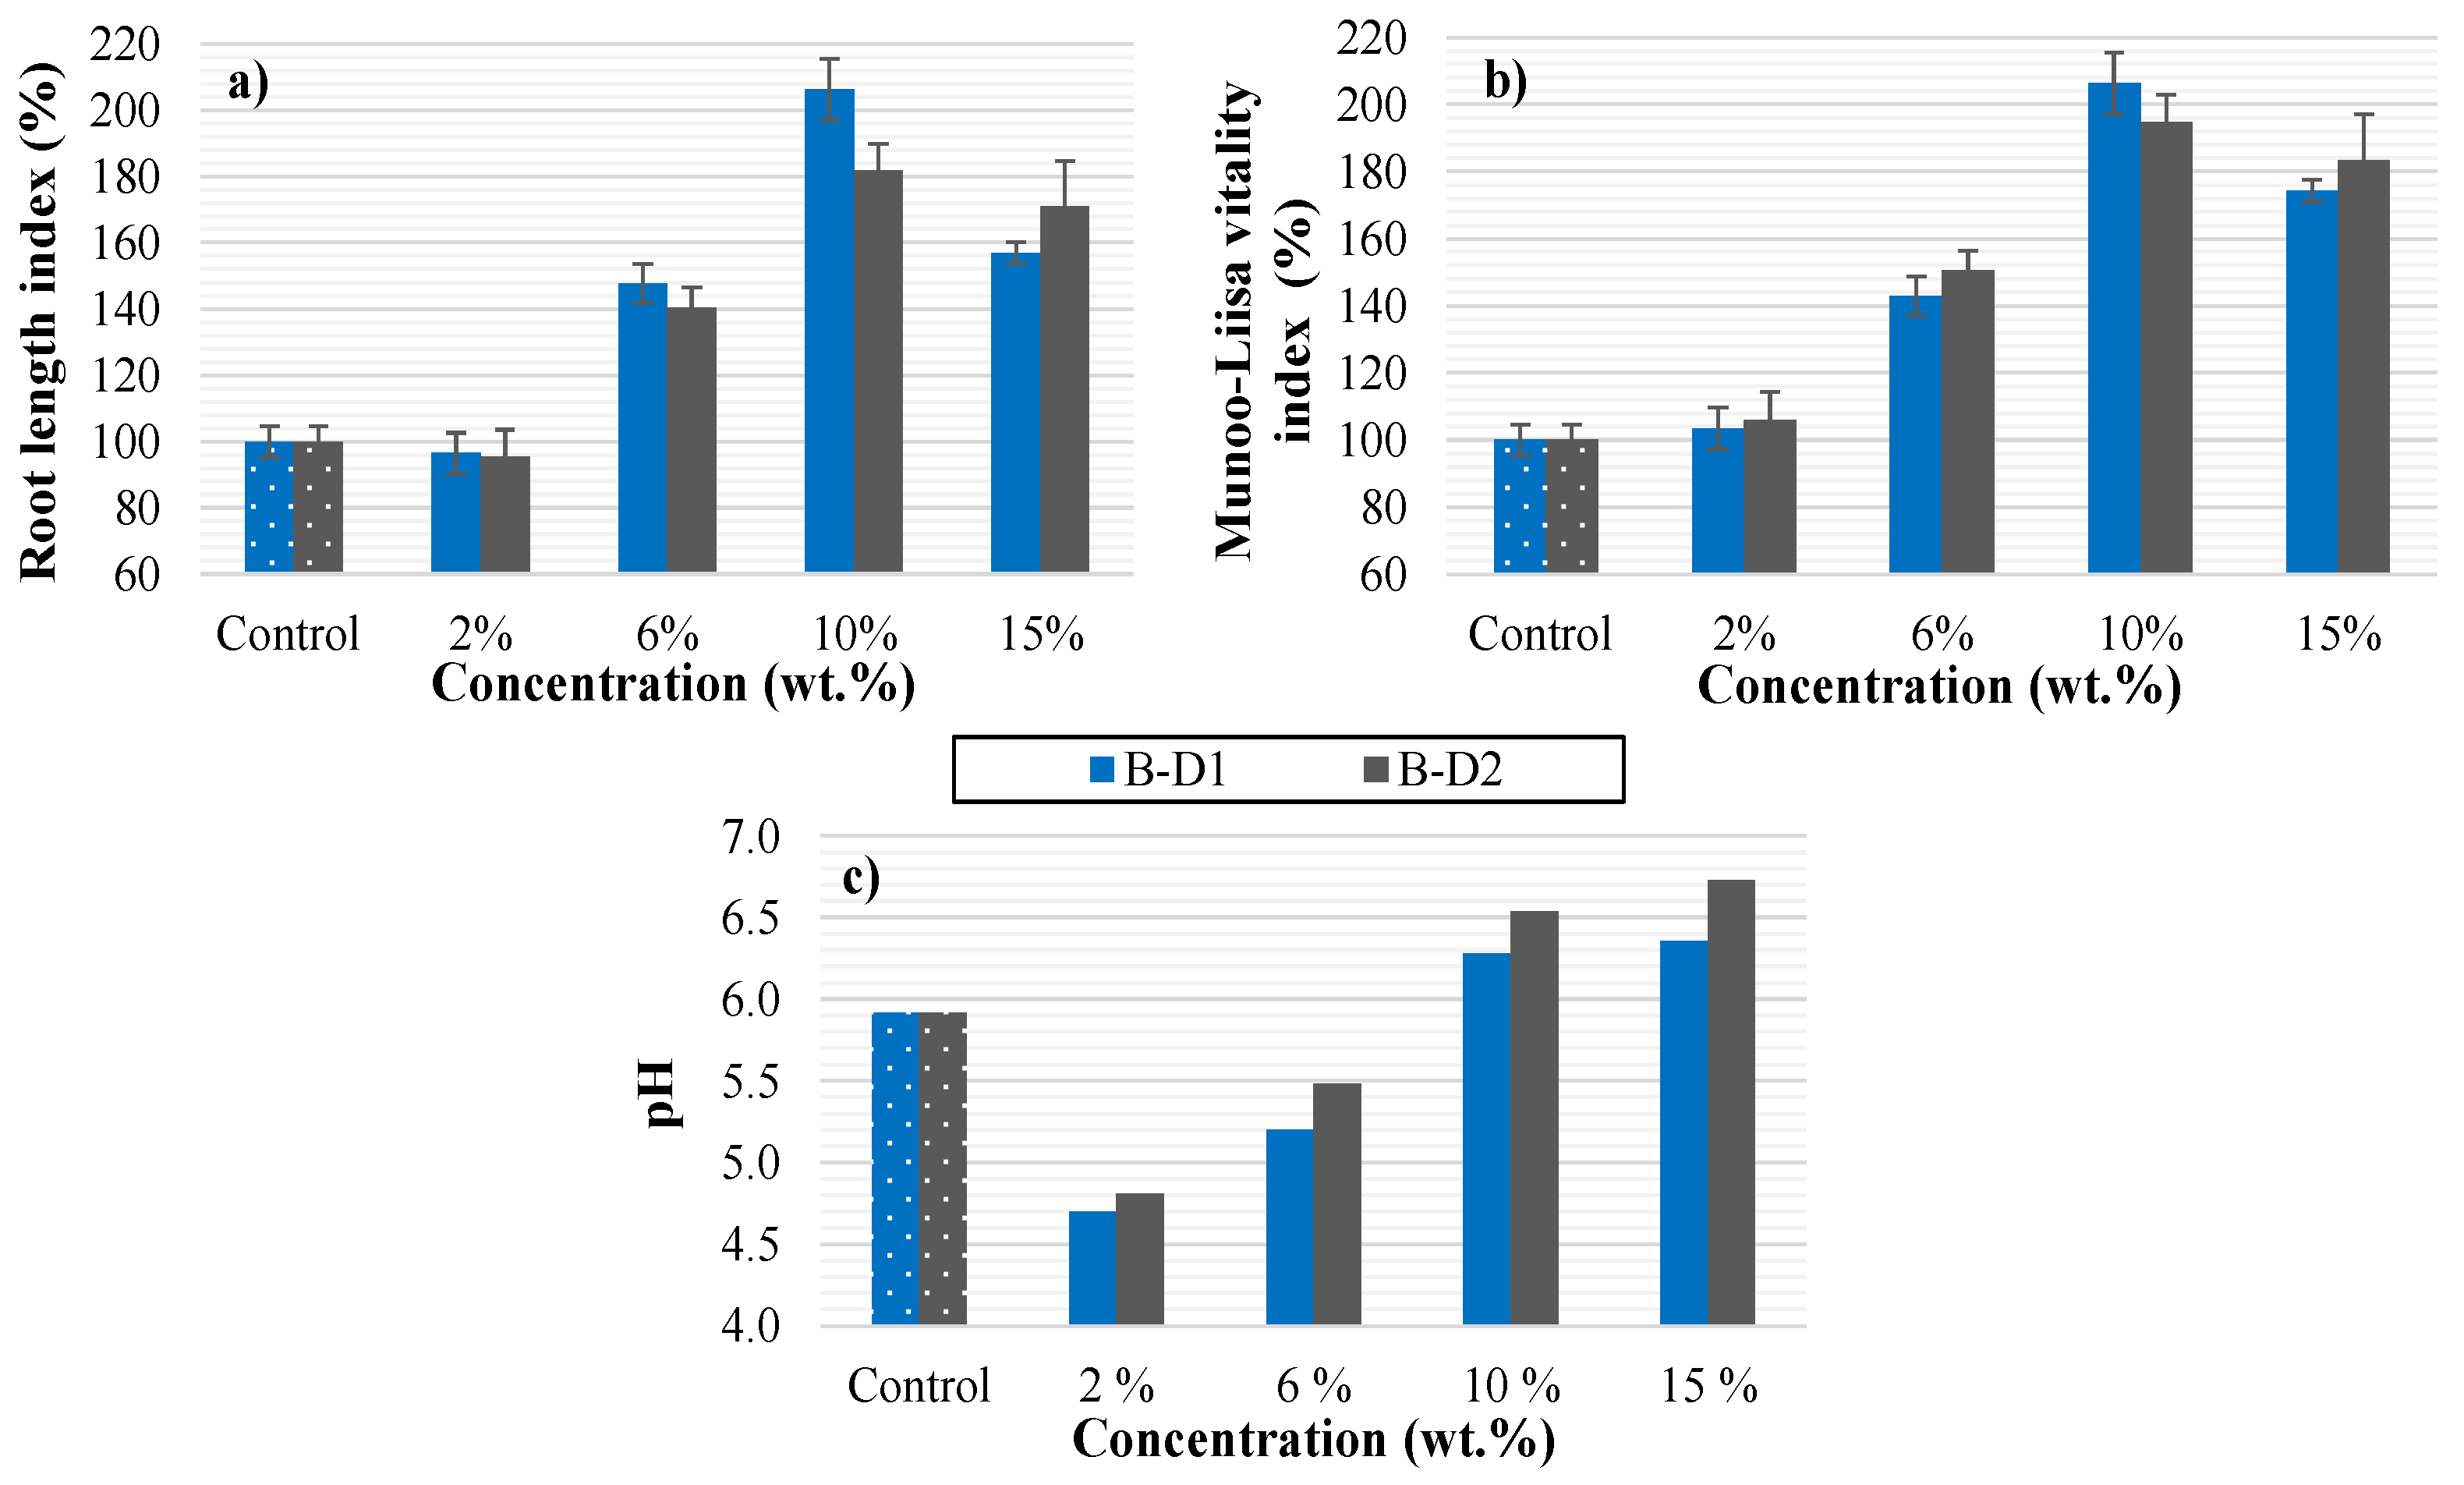
  • Chemical characterization of the biochars revealed high nutrient content and, thus, good prospects for their further utilization. Biochars performed very well with regard to biosorption of heavy metals (Cu and Cd), while biosorption of NH4+ and PO43− ions was less efficient. Modification of biochars with KOH significantly improved their biosorption ability for all ionic species, whereas HCl modification was found to be efficient only in the case of PO43− adsorption. Germination tests with cress seeds showed that digestate-derived biochars can be used as soil amenders at a concentration of up to 10 wt.%. SS digestate-derived biochar showed better performance than the biochar derived from a digestate mixture of SS and TLP, the advantage of the latter being its lower heavy metal content.
Depending on biochar properties and the results obtained, the digestate-derived biochars can be used in various fields, such as soil conditioning and agriculture, pollution remediation, and in modified form for other purposes. This work contributes to sustainability by promoting the circularity of bioresources by using a by-product of anaerobic digestion (digestate of sewage sludge and T. latifolia biomass) to synthesize biochar, a valuable product that can be used as a biofuel. The use of biochars for various other purposes also follows the bioeconomy approach and represents a major step towards sustainability.

Limitations and Directions for Future Studies

Despite the extensive work done in this study, there are some limitations and knowledge gaps that open a new path for future research.
For example, only basic thermogravimetric experiments and kinetic analysis were performed in this study, the results of which cannot provide all the information needed for a complete understanding of the pyrolysis process of the selected feedstocks and, thus, experiments at a larger, pilot scale should be performed. The operating conditions, the changes in the biochar characteristics and its yield, the formation of other phases, such as the gas and liquid phases, and other parameters, should also be studied in more detail. The effects of various pollutants, including heavy metals, and the addition of various catalysts on the pyrolysis process and biochar quality could be studied. Due to the global shortage of phosphorus fertilizers, the possibility of phosphorus recovery should also be investigated.
This study does not address the economic aspects of biochar production from T. latifolia and its digestate; thus, the assessment of operating costs, economic viability, and other risks of using this plant in the pyrolysis process could be investigated. The environmental impact is also an important issue in the pyrolysis of T. latifolia in combination with SS. A study on the biosorption of pollutants from real wastewater by the obtained biochars would also be interesting, as the behavior of biochars in real wastewater and the biosorption efficiency are likely to be significantly different from the results obtained using the model water in this study. Before the actual use of the obtained biochars for agricultural purposes, germination experiments with other plant species, such as potato or cabbage, would be necessary to evaluate the possible accumulation of heavy metals from biochar in the plants and their fruits, and other changes in plant growth. Another interesting area for further study is the modification of biochar to improve its adsorption and catalytic ability, and to produce biochar-based catalysts or supercapacitors.

Supplementary Materials

The following are available online at https://www.mdpi.com/article/10.3390/su13179642/s1, Table S1: Composition of the digestate mixtures D1 and D2, Figure S1: Linear fit plots for FWO (a–d) and KAS method (e–h) to determine activation energy values for digestate D1 (a,e), digestate D2 (b,f), sewage sludge (c,g), and T. latifolia (d,h), Figure S2: Linear fit plots for the compensation effects between the pre-exponential factors l n ( A / f ( α ) ) and the activation energy E α for: (a) digestate D1, (b) digestate D2, (c) sewage sludge, and (d) T. Latifolia, Figure S3: SEM images of biochars B-D1 (a) and B-D2 (b), and EDS spectra of biochars B-D1, (c) and B-D2 (d), Figure S4: The XRD diffractograms of biochars B-D1 (a) and B-D2 (b).

Author Contributions

Conceptualization, A.P.; data curation, S.V. and R.B.; formal analysis, S.V. and R.B.; investigation, A.P., S.V., and T.C.P.; methodology, A.P.; resources, M.S. and I.B.; software, R.B.; supervision, L.Č.; validation, T.C.P.; visualization, A.P.; writing—original draft, A.P.; writing—review and editing, M.S., I.B., and L.Č. All authors have read and agreed to the published version of the manuscript.

Funding

The authors would like to acknowledge the Slovenian Ministry of Education, Science, and Sport (project no. C3330-19-952041, OP20.04349), Slovenian Research Agency (research core funding no. P2-0412 and P2-0032) and the Slovenia-Croatia bilateral project Interdisciplinary Research on Variable Renewable Energy Source and Biomass in Clean and Circular Economy (BIOVARES) for financial support.

Institutional Review Board Statement

Not applicable.

Informed Consent Statement

Not applicable.

Data Availability Statement

The data presented in this study are available in supplementary material.

Acknowledgments

The authors acknowledge the IKEMA d.o.o. Institute for their support in chemical analytics and sewage sludge management, and Muzafera Paljevac and Peter Krajnc from the Laboratory of Organic and Polymer Chemistry and Technology from the Faculty of Chemistry and Chemical Engineering, University of Maribor, Slovenia, for providing help in chemical analyses.

Conflicts of Interest

The authors declare no conflict of interest.

References

  1. Soria-Verdugo, A.; Goos, E.; Morato-Godino, A.; García-Hernando, N.; Riedel, U. Pyrolysis of biofuels of the future: Sewage sludge and microalgae—Thermogravimetric analysis and modelling of the pyrolysis under different temperature conditions. Energy Convers. Manag. 2017, 138, 261–272. [Google Scholar] [CrossRef] [Green Version]
  2. Zainol Abidin, M.A.; Mahyuddin, M.N.; Mohd Zainuri, M.A.A. Solar Photovoltaic Architecture and Agronomic Management in Agrivoltaic System: A Review. Sustainability 2021, 13, 7846. [Google Scholar] [CrossRef]
  3. Mehariya, S.; Patel, A.K.; Obulisamy, P.K.; Punniyakotti, E.; Wong, J.W.C. Co-digestion of food waste and sewage sludge for methane production: Current status and perspective. Bioresour. Technol. 2018, 265, 519–531. [Google Scholar] [CrossRef]
  4. Rasam, S.; Moshfegh Haghighi, A.; Azizi, K.; Soria-Verdugo, A.; Keshavarz Moraveji, M. Thermal behavior, thermodynamics and kinetics of co-pyrolysis of binary and ternary mixtures of biomass through thermogravimetric analysis. Fuel 2020, 280, 118665. [Google Scholar] [CrossRef]
  5. Sobek, S.; Werle, S. Kinetic modelling of waste wood devolatilization during pyrolysis based on thermogravimetric data and solar pyrolysis reactor performance. Fuel 2020, 261, 116459. [Google Scholar] [CrossRef]
  6. Cucchiella, F.; D’Adamo, I.; Gastaldi, M. Sustainable waste management: Waste to energy plant as an alternative to landfill. Energy Convers. Manag. 2017, 131, 18–31. [Google Scholar] [CrossRef]
  7. Khan, M.F.; Pervez, A.; Modibbo, U.M.; Chauhan, J.; Ali, I. Flexible Fuzzy Goal Programming Approach in Optimal Mix of Power Generation for Socio-Economic Sustainability: A Case Study. Sustainability 2021, 13, 8256. [Google Scholar] [CrossRef]
  8. D’Adamo, I.; Falcone, P.M.; Huisingh, D.; Morone, P. A circular economy model based on biomethane: What are the opportunities for the municipality of Rome and beyond? Renew. Energy 2021, 163, 1660–1672. [Google Scholar] [CrossRef]
  9. European Commission. A New Bioeconomy Strategy for a Sustainable Europe; European Comission: Brussels, Belgium, 2018.
  10. D’Adamo, I.; Falcone, P.M.; Morone, P. A New Socio-economic Indicator to Measure the Performance of Bioeconomy Sectors in Europe. Ecol. Econ. 2020, 176, 106724. [Google Scholar] [CrossRef]
  11. Cao, Y.; Pawłowski, A. Sewage sludge-to-energy approaches based on anaerobic digestion and pyrolysis: Brief overview and energy efficiency assessment. Renew. Sustain. Energy Rev. 2012, 16, 1657–1665. [Google Scholar] [CrossRef]
  12. Li, X.; Chen, L.; Dai, X.; Mei, Q.; Ding, G. Thermogravimetry–Fourier transform infrared spectrometry–mass spectrometry technique to evaluate the effect of anaerobic digestion on gaseous products of sewage sludge sequential pyrolysis. J. Anal. Appl. Pyrolysis 2017, 126, 288–297. [Google Scholar] [CrossRef]
  13. Ahmed, M.; Andreottola, G.; Elagroudy, S.; Negm, M.S.; Fiori, L. Coupling hydrothermal carbonization and anaerobic digestion for sewage digestate management: Influence of hydrothermal treatment time on dewaterability and bio-methane production. J. Environ. Manag. 2021, 281, 111910. [Google Scholar] [CrossRef] [PubMed]
  14. Alvarez, J.; Amutio, M.; Lopez, G.; Bilbao, J.; Olazar, M. Fast co-pyrolysis of sewage sludge and lignocellulosic biomass in a conical spouted bed reactor. Fuel 2015, 159, 810–818. [Google Scholar] [CrossRef]
  15. Feng, Q.; Lin, Y. Integrated processes of anaerobic digestion and pyrolysis for higher bioenergy recovery from lignocellulosic biomass: A brief review. Renew. Sustain. Energy Rev. 2017, 77, 1272–1287. [Google Scholar] [CrossRef]
  16. Hu, Z.-H.; Yu, H.-Q.; Yue, Z.-B.; Harada, H.; Li, Y.-Y. Kinetic analysis of anaerobic digestion of cattail by rumen microbes in a modified UASB reactor. Biochem. Eng. J. 2007, 37, 219–225. [Google Scholar] [CrossRef]
  17. Ciria, P.; Solano, M.; Soriano, P. Role of Macrophyte Typha latifolia in a Constructed Wetland for Wastewater Treatment and Assessment of Its Potential as a Biomass Fuel. Biosyst. Eng. BIOSYST ENG 2005, 92, 535–544. [Google Scholar] [CrossRef]
  18. Grosshans, R. Cattail (Typha spp.) Biomass Harvesting for Nutrient Capture and Sustainable Bioenergy for Integrated Watershed Management. Ph.D. Thesis, University of Manitoba, Winnipeg, MB, Canada, 2014. [Google Scholar]
  19. Hu, Z.-H.; Yue, Z.-B.; Yu, H.-Q.; Liu, S.-Y.; Harada, H.; Li, Y.-Y. Mechanisms of microwave irradiation pretreatment for enhancing anaerobic digestion of cattail by rumen microorganisms. Appl. Energy 2012, 93, 229–236. [Google Scholar] [CrossRef]
  20. Petrovič, A.; Simonič, M.; Čuček, L. Nutrient recovery from the digestate obtained by rumen fluid enhanced anaerobic co-digestion of sewage sludge and cattail: Precipitation by MgCl2 and ion exchange using zeolite. J. Environ. Manag. 2021, 290, 112593. [Google Scholar] [CrossRef]
  21. Jaruwat, D.; Udomsap, P.; Chollacoop, N.; Eiad-ua, A. Preparation of carbon supported catalyst from cattail leaves for biodiesel fuel upgrading application. Mater. Today Proc. 2019, 17, 1319–1325. [Google Scholar] [CrossRef]
  22. Zhang, B.; Joseph, G.; Wang, L.; Li, X.; Shahbazi, A. Thermophilic anaerobic digestion of cattail and hydrothermal carbonization of the digestate for co-production of biomethane and hydrochar. J. Environ. Sci. Health Part A 2020, 55, 230–238. [Google Scholar] [CrossRef]
  23. Arun, J.; Gopinath, K.P.; Sivaramakrishnan, R.; Madhav, N.V.; Abhishek, K.; Ramanan, V.G.K.; Pugazhendhi, A. Bioenergy perspectives of cattails biomass cultivated from municipal wastewater via hydrothermal liquefaction and hydro-deoxygenation. Fuel 2021, 284, 118963. [Google Scholar] [CrossRef]
  24. Ahmad, M.S.; Mehmood, M.A.; Taqvi, S.T.H.; Elkamel, A.; Liu, C.-G.; Xu, J.; Rahimuddin, S.A.; Gull, M. Pyrolysis, kinetics analysis, thermodynamics parameters and reaction mechanism of Typha latifolia to evaluate its bioenergy potential. Bioresour. Technol. 2017, 245, 491–501. [Google Scholar] [CrossRef] [Green Version]
  25. Bartocci, P.; Tschentscher, R.; Stensrød, R.; Barbanera, M.; Fantozzi, F. Kinetic Analysis of Digestate Slow Pyrolysis with the Application of the Master-Plots Method and Independent Parallel Reactions Scheme. Molecules 2019, 24, 1657. [Google Scholar] [CrossRef] [PubMed] [Green Version]
  26. Bedoić, R.; Jurić, F.; Ćosić, B.; Pukšec, T.; Čuček, L.; Duić, N. Beyond energy crops and subsidised electricity—A study on sustainable biogas production and utilisation in advanced energy markets. Energy 2020, 201, 117651. [Google Scholar] [CrossRef]
  27. D’Adamo, I.; Falcone, P.M.; Gastaldi, M.; Morone, P. RES-T trajectories and an integrated SWOT-AHP analysis for biomethane. Policy implications to support a green revolution in European transport. Energy Policy 2020, 138, 111220. [Google Scholar] [CrossRef]
  28. Hung, C.-Y.; Tsai, W.-T.; Chen, J.-W.; Lin, Y.-Q.; Chang, Y.-M. Characterization of biochar prepared from biogas digestate. Waste Manag. 2017, 66, 53–60. [Google Scholar] [CrossRef]
  29. Xu, Y.; Chen, B. Investigation of thermodynamic parameters in the pyrolysis conversion of biomass and manure to biochars using thermogravimetric analysis. Bioresour. Technol. 2013, 146, 485–493. [Google Scholar] [CrossRef] [PubMed]
  30. Jin, J.; Li, Y.; Zhang, J.; Wu, S.; Cao, Y.; Liang, P.; Zhang, J.; Wong, M.H.; Wang, M.; Shan, S.; et al. Influence of pyrolysis temperature on properties and environmental safety of heavy metals in biochars derived from municipal sewage sludge. J. Hazard. Mater. 2016, 320, 417–426. [Google Scholar] [CrossRef] [PubMed]
  31. Rangabhashiyam, S.; Balasubramanian, P. The potential of lignocellulosic biomass precursors for biochar production: Performance, mechanism and wastewater application—A review. Ind. Crop. Prod. 2019, 128, 405–423. [Google Scholar]
  32. Xue, Y.; Wang, C.; Hu, Z.; Zhou, Y.; Xiao, Y.; Wang, T. Pyrolysis of sewage sludge by electromagnetic induction: Biochar properties and application in adsorption removal of Pb(II), Cd(II) from aqueous solution. Waste Manag. 2019, 89, 48–56. [Google Scholar] [CrossRef]
  33. Wang, C.; Bi, H.; Lin, Q.; Jiang, X.; Jiang, C. Co-pyrolysis of sewage sludge and rice husk by TG–FTIR–MS: Pyrolysis behavior, kinetics, and condensable/non-condensable gases characteristics. Renew. Energy 2020, 160, 1048–1066. [Google Scholar] [CrossRef]
  34. Folgueras, M.B.; Alonso, M.; Díaz, R.M. Influence of sewage sludge treatment on pyrolysis and combustion of dry sludge. Energy 2013, 55, 426–435. [Google Scholar] [CrossRef]
  35. Gao, N.; Kamran, K.; Quan, C.; Williams, P.T. Thermochemical conversion of sewage sludge: A critical review. Prog. Energy Combust. Sci. 2020, 79, 100843. [Google Scholar] [CrossRef]
  36. Ruiz-Gómez, N.; Quispe, V.; Ábrego, J.; Atienza-Martínez, M.; Murillo, M.B.; Gea, G. Co-pyrolysis of sewage sludge and manure. Waste Manag. 2017, 59, 211–221. [Google Scholar] [CrossRef] [PubMed] [Green Version]
  37. Cortés, A.M.; Bridgwater, A.V. Kinetic study of the pyrolysis of miscanthus and its acid hydrolysis residue by thermogravimetric analysis. Fuel Process. Technol. 2015, 138, 184–193. [Google Scholar] [CrossRef] [Green Version]
  38. Mallick, D.; Poddar, M.K.; Mahanta, P.; Moholkar, V.S. Discernment of synergism in pyrolysis of biomass blends using thermogravimetric analysis. Bioresour. Technol. 2018, 261, 294–305. [Google Scholar] [CrossRef]
  39. Tang, S.; Zheng, C.; Yan, F.; Shao, N.; Tang, Y.; Zhang, Z. Product characteristics and kinetics of sewage sludge pyrolysis driven by alkaline earth metals. Energy 2018, 153, 921–932. [Google Scholar] [CrossRef]
  40. Magdziarz, A.; Werle, S. Analysis of the combustion and pyrolysis of dried sewage sludge by TGA and MS. Waste Manag. 2014, 34, 174–179. [Google Scholar] [CrossRef] [PubMed]
  41. Zaker, A.; Chen, Z.; Zaheer-Uddin, M.; Guo, J. Co-pyrolysis of sewage sludge and low-density polyethylene—A thermogravimetric study of thermo-kinetics and thermodynamic parameters. J. Environ. Chem. Eng. 2020, 9, 104554. [Google Scholar] [CrossRef]
  42. González Arias, J.; Gil, M.; Fernández, R.; Martinez, J.; Fernández, C.; Papaharalabos, G.; Gómez, X. Integrating anaerobic digestion and pyrolysis for treating digestates derived from sewage sludge and fat wastes. Environ. Sci. Pollut. Res. 2020, 27, 32603–32614. [Google Scholar] [CrossRef]
  43. Sanchez, M.E.; Otero, M.; Gómez, X.; Morán, A. Thermogravimetric kinetic analysis of the combustion of biowastes. Renew. Energy 2009, 34, 1622–1627. [Google Scholar] [CrossRef]
  44. Akor, C.I.; Osman, A.I.; Farrell, C.; McCallum, C.S.; John Doran, W.; Morgan, K.; Harrison, J.; Walsh, P.J.; Sheldrake, G.N. Thermokinetic study of residual solid digestate from anaerobic digestion. Chem. Eng. J. 2021, 406, 127039. [Google Scholar] [CrossRef]
  45. Vuppaladadiyam, A.K.; Liu, H.; Zhao, M.; Soomro, A.F.; Memon, M.Z.; Dupont, V. Thermogravimetric and kinetic analysis to discern synergy during the co-pyrolysis of microalgae and swine manure digestate. Biotechnol. Biofuels 2019, 12, 170. [Google Scholar] [CrossRef] [PubMed] [Green Version]
  46. Chen, Y.; Wang, R.; Duan, X.; Wang, S.; Ren, N.; Ho, S.-H. Production, properties, and catalytic applications of sludge derived biochar for environmental remediation. Water Res. 2020, 187, 116390. [Google Scholar] [CrossRef] [PubMed]
  47. Xu, X.; Cao, X.; Zhao, L.; Sun, T. Comparison of sewage sludge- and pig manure-derived biochars for hydrogen sulfide removal. Chemosphere 2014, 111, 296–303. [Google Scholar] [CrossRef] [PubMed]
  48. Gao, L.-Y.; Deng, J.-H.; Huang, G.-F.; Li, K.; Cai, K.-Z.; Liu, Y.; Huang, F. Relative distribution of Cd2+ adsorption mechanisms on biochars derived from rice straw and sewage sludge. Bioresour. Technol. 2019, 272, 114–122. [Google Scholar] [CrossRef]
  49. Melia, P.M.; Busquets, R.; Hooda, P.S.; Cundy, A.B.; Sohi, S.P. Driving forces and barriers in the removal of phosphorus from water using crop residue, wood and sewage sludge derived biochars. Sci. Total Environ. 2019, 675, 623–631. [Google Scholar] [CrossRef] [Green Version]
  50. Yousaf, B.; Liu, G.; Ubaid Ali, M.; Abbas, Q.; Liu, Y.; Ullah, H.; Imtiyaz Cheema, A. Decisive role of vacuum-assisted carbonization in valorization of lignin-enriched (Juglans regia-shell) biowaste. Bioresour. Technol. 2021, 323, 124541. [Google Scholar] [CrossRef]
  51. Fan, J.; Li, Y.; Yu, H.; Li, Y.; Yuan, Q.; Xiao, H.; Li, F.; Pan, B. Using sewage sludge with high ash content for biochar production and Cu(II) sorption. Sci. Total Environ. 2020, 713, 136663. [Google Scholar] [CrossRef]
  52. Chen, T.; Zhang, Y.; Wang, H.; Lu, W.; Zhou, Z.; Zhang, Y.; Ren, L. Influence of pyrolysis temperature on characteristics and heavy metal adsorptive performance of biochar derived from municipal sewage sludge. Bioresour. Technol. 2014, 164, 47–54. [Google Scholar] [CrossRef]
  53. Yousaf, B.; Liu, G.; Abbas, Q.; Ali, M.U.; Wang, R.; Ahmed, R.; Wang, C.; Al-Wabel, M.I.; Usman, A.R.A. Operational control on environmental safety of potentially toxic elements during thermal conversion of metal-accumulator invasive ragweed to biochar. J. Clean. Prod. 2018, 195, 458–469. [Google Scholar] [CrossRef]
  54. Naqvi, S.R.; Hameed, Z.; Tariq, R.; Taqvi, S.A.; Ali, I.; Niazi, M.B.K.; Noor, T.; Hussain, A.; Iqbal, N.; Shahbaz, M. Synergistic effect on co-pyrolysis of rice husk and sewage sludge by thermal behavior, kinetics, thermodynamic parameters and artificial neural network. Waste Manag. 2019, 85, 131–140. [Google Scholar] [CrossRef] [PubMed]
  55. Ullah, H.; Abbas, Q.; Ali, M.U.; Amina; Cheema, A.I.; Yousaf, B.; Rinklebe, J. Synergistic effects of low-/medium-vacuum carbonization on physico-chemical properties and stability characteristics of biochars. Chem. Eng. J. 2019, 373, 44–57. [Google Scholar] [CrossRef]
  56. Başer, B.; Yousaf, B.; Yetis, U.; Abbas, Q.; Kwon, E.E.; Wang, S.; Bolan, N.S.; Rinklebe, J. Formation of nitrogen functionalities in biochar materials and their role in the mitigation of hazardous emerging organic pollutants from wastewater. J. Hazard. Mater. 2021, 416, 126131. [Google Scholar] [CrossRef]
  57. Li, J.; Li, B.; Huang, H.; Lv, X.; Zhao, N.; Guo, G.; Zhang, D. Removal of phosphate from aqueous solution by dolomite-modified biochar derived from urban dewatered sewage sludge. Sci. Total Environ. 2019, 687, 460–469. [Google Scholar] [CrossRef] [PubMed]
  58. Wongrod, S.; Simon, S.; Guibaud, G.; Lens, P.N.L.; Pechaud, Y.; Huguenot, D.; van Hullebusch, E.D. Lead sorption by biochar produced from digestates: Consequences of chemical modification and washing. J. Environ. Manag. 2018, 219, 277–284. [Google Scholar] [CrossRef] [PubMed]
  59. Wang, S.; Ai, S.; Nzediegwu, C.; Kwak, J.-H.; Islam, M.S.; Li, Y.; Chang, S.X. Carboxyl and hydroxyl groups enhance ammonium adsorption capacity of iron (III) chloride and hydrochloric acid modified biochars. Bioresour. Technol. 2020, 309, 123390. [Google Scholar] [CrossRef] [PubMed]
  60. Saadat, S.; Raei, E.; Talebbeydokhti, N. Enhanced removal of phosphate from aqueous solutions using a modified sludge derived biochar: Comparative study of various modifying cations and RSM based optimization of pyrolysis parameters. J. Environ. Manag. 2018, 225, 75–83. [Google Scholar] [CrossRef] [PubMed]
  61. Nuagah, M.B.; Boakye, P.; Oduro-Kwarteng, S.; Sokama-Neuyam, Y.A. Valorization of faecal and sewage sludge via pyrolysis for application as crop organic fertilizer. J. Anal. Appl. Pyrolysis 2020, 151, 104903. [Google Scholar] [CrossRef]
  62. Song, X.D.; Xue, X.Y.; Chen, D.Z.; He, P.J.; Dai, X.H. Application of biochar from sewage sludge to plant cultivation: Influence of pyrolysis temperature and biochar-to-soil ratio on yield and heavy metal accumulation. Chemosphere 2014, 109, 213–220. [Google Scholar] [CrossRef]
  63. Rehman, R.A.; Rizwan, M.; Qayyum, M.F.; Ali, S.; Zia-ur-Rehman, M.; Zafar-ul-Hye, M.; Hafeez, F.; Iqbal, M.F. Efficiency of various sewage sludges and their biochars in improving selected soil properties and growth of wheat (Triticum aestivum). J. Environ. Manag. 2018, 223, 607–613. [Google Scholar] [CrossRef] [PubMed]
  64. Angelidaki, I.; Alves, M.; Bolzonella, D.; Borzacconi, L.; Campos, J.; Guwy, A.; Kalyuzhnyi, S.; Jenicek, P.; Van Lier, J. Defining the biomethane potential (BMP) of solid organic wastes and energy crops: A proposed protocol for batch assays. Water Sci. Technol. 2009, 59, 927–934. [Google Scholar] [CrossRef] [PubMed] [Green Version]
  65. SIST EN 14346:2007, Characterization of Waste—Calculation of Dry Matter by Determination of Dry Residue or Water Content; Slovenian Institute for Standardization (SIST): Ljubljana, Slovenia, 2007.
  66. SIST-TS CEN/TS 16023:2014, Characterization of Waste—Determination of Gross Calorific Value and Calculation of Net Calorific Value; Slovenian Institute for Standardization (SIST): Ljubljana, Slovenia, 2014.
  67. Channiwala, S.A.; Parikh, P.P. A unified correlation for estimating HHV of solid, liquid and gaseous fuels. Fuel 2002, 81, 1051–1063. [Google Scholar] [CrossRef]
  68. EN 16170:2016, Sludge, Treated Biowaste and Soil—Determination of Elements Using Inductively Coupled Plasma Optical Emission Spectrometry (ICP-OES); European Committee for Standardization: Brussels, Belgium, 2016.
  69. Naqvi, S.R.; Tariq, R.; Hameed, Z.; Ali, I.; Taqvi, S.A.; Naqvi, M.; Niazi, M.B.K.; Noor, T.; Farooq, W. Pyrolysis of high-ash sewage sludge: Thermo-kinetic study using TGA and artificial neural networks. Fuel 2018, 233, 529–538. [Google Scholar] [CrossRef]
  70. Yao, Z.; Yu, S.; Su, W.; Wu, W.; Tang, J.; Qi, W. Kinetic studies on the pyrolysis of plastic waste using a combination of model-fitting and model-free methods. Waste Manag. Res. 2020, 38, 77–85. [Google Scholar] [CrossRef]
  71. Tahir, M.H.; Çakman, G.; Goldfarb, J.L.; Topcu, Y.; Naqvi, S.R.; Ceylan, S. Demonstrating the suitability of canola residue biomass to biofuel conversion via pyrolysis through reaction kinetics, thermodynamics and evolved gas analyses. Bioresour. Technol. 2019, 279, 67–73. [Google Scholar] [CrossRef]
  72. Kong, L.; Liu, J.; Han, Q.; Zhou, Q.; He, J. Integrating metabolomics and physiological analysis to investigate the toxicological mechanisms of sewage sludge-derived biochars to wheat. Ecotoxicol. Environ. Saf. 2019, 185, 109664. [Google Scholar] [CrossRef]
  73. SIST EN 16086-2:2012, Soil Improvers and Growing Media—Determination of Plant Response—Part 2: Petri Dish Test Using Cress; Slovenian Institute for Standardization (SIST): Ljubljana, Slovenia, 2012.
  74. Chemetova, C.; Fabião, A.; Gominho, J.; Ribeiro, H. Range analysis of Eucalyptus globulus bark low-temperature hydrothermal treatment to produce a new component for growing media industry. Waste Manag. 2018, 79, 1–7. [Google Scholar] [CrossRef]
  75. Maunuksela, L.; Herranen, M.; Torniainen, M. Quality assessment of biogas plant end products by plant bioassays. Int. J. Environ. Sci. Dev. 2012, 3, 305. [Google Scholar] [CrossRef]
  76. DIN 38 406-E5-1, Photometric Determination of Ammonium Nitrogen by Sodium Dichloroisocyanurate and Sodium Salicylate; DIN—German Institute for Standardization: Berlin, Germany, 1983.
  77. SIST EN ISO 6878:2004, Water Quality—Determination of Phosphorus—Ammonium Molybdate Spectrometric Method; ISO: Geneva, Switzerland, 2004.
  78. Tang, Y.; Alam, M.S.; Konhauser, K.O.; Alessi, D.S.; Xu, S.; Tian, W.; Liu, Y. Influence of pyrolysis temperature on production of digested sludge biochar and its application for ammonium removal from municipal wastewater. J. Clean. Prod. 2019, 209, 927–936. [Google Scholar] [CrossRef]
  79. Government of the Republic of Slovenia. Decree on the use of sludge from municipal sewage treatment plants in agriculture. In Official Gazette of the Republic of Slovenia, No. 62/08; The Official Gazette of the Republic of Slovenia Ltd., Public Company: Ljubljana, Slovenia, 2008. [Google Scholar]
  80. Ahmad, M.S.; Mehmood, M.A.; Al Ayed, O.S.; Ye, G.; Luo, H.; Ibrahim, M.; Rashid, U.; Arbi Nehdi, I.; Qadir, G. Kinetic analyses and pyrolytic behavior of Para grass (Urochloa mutica) for its bioenergy potential. Bioresour. Technol. 2017, 224, 708–713. [Google Scholar] [CrossRef]
  81. Syed-Hassan, S.S.A.; Wang, Y.; Hu, S.; Su, S.; Xiang, J. Thermochemical processing of sewage sludge to energy and fuel: Fundamentals, challenges and considerations. Renew. Sustain. Energy Rev. 2017, 80, 888–913. [Google Scholar] [CrossRef]
  82. Mehmood, M.A.; Ye, G.; Luo, H.; Liu, C.; Malik, S.; Afzal, I.; Xu, J.; Ahmad, M.S. Pyrolysis and kinetic analyses of Camel grass (Cymbopogon schoenanthus) for bioenergy. Bioresour. Technol. 2017, 228, 18–24. [Google Scholar] [CrossRef] [PubMed]
  83. Kan, T.; Strezov, V.; Evans, T.J. Lignocellulosic biomass pyrolysis: A review of product properties and effects of pyrolysis parameters. Renew. Sustain. Energy Rev. 2016, 57, 1126–1140. [Google Scholar] [CrossRef]
  84. Shen, D.; Jin, W.; Hu, J.; Xiao, R.; Luo, K. An overview on fast pyrolysis of the main constituents in lignocellulosic biomass to valued-added chemicals: Structures, pathways and interactions. Renew. Sustain. Energy Rev. 2015, 51, 761–774. [Google Scholar] [CrossRef]
  85. Bedoić, R.; Ocelić Bulatović, V.; Čuček, L.; Ćosić, B.; Špehar, A.; Pukšec, T.; Duić, N. A kinetic study of roadside grass pyrolysis and digestate from anaerobic mono-digestion. Bioresour. Technol. 2019, 292, 121935. [Google Scholar] [CrossRef]
  86. Kaur, R.; Gera, P.; Jha, M.K.; Bhaskar, T. Pyrolysis kinetics and thermodynamic parameters of castor (Ricinus communis) residue using thermogravimetric analysis. Bioresour. Technol. 2018, 250, 422–428. [Google Scholar] [CrossRef] [PubMed]
  87. Rasool, T.; Kumar, S. Kinetic and Thermodynamic Evaluation of Pyrolysis of Plant Biomass using TGA. Mater. Today Proc. 2020, 21, 2087–2095. [Google Scholar] [CrossRef]
  88. Zhang, D.; Wang, F.; Yi, W.; Li, Z.; Shen, X.; Niu, W. Comparison study on pyrolysis characteristics and kinetics of corn stover and its digestate by TG-FTIR. BioResources 2017, 12, 8240–8254. [Google Scholar] [CrossRef]
  89. Gao, N.; Li, J.; Qi, B.; Li, A.; Duan, Y.; Wang, Z. Thermal analysis and products distribution of dried sewage sludge pyrolysis. J. Anal. Appl. Pyrolysis 2014, 105, 43–48. [Google Scholar] [CrossRef]
  90. Hu, Y.; Wang, Z.; Cheng, X.; Ma, C. Non-isothermal TGA study on the combustion reaction kinetics and mechanism of low-rank coal char. RSC Adv. 2018, 8, 22909–22916. [Google Scholar] [CrossRef] [Green Version]
  91. Naqvi, S.R.; Ali, I.; Nasir, S.; Ali Ammar Taqvi, S.; Atabani, A.E.; Chen, W.-H. Assessment of agro-industrial residues for bioenergy potential by investigating thermo-kinetic behavior in a slow pyrolysis process. Fuel 2020, 278, 118259. [Google Scholar] [CrossRef]
  92. Yin, Q.; Liu, M.; Ren, H. Biochar produced from the co-pyrolysis of sewage sludge and walnut shell for ammonium and phosphate adsorption from water. J. Environ. Manag. 2019, 249, 109410. [Google Scholar] [CrossRef]
  93. Huang, H.-j.; Yang, T.; Lai, F.-y.; Wu, G.-q. Co-pyrolysis of sewage sludge and sawdust/rice straw for the production of biochar. J. Anal. Appl. Pyrolysis 2017, 125, 61–68. [Google Scholar] [CrossRef]
  94. Xie, S.; Yu, G.; Li, C.; Li, J.; Wang, G.; Dai, S.; Wang, Y. Treatment of high-ash industrial sludge for producing improved char with low heavy metal toxicity. J. Anal. Appl. Pyrolysis 2020, 150, 104866. [Google Scholar] [CrossRef]
  95. Arauzo, P.J.; Atienza-Martínez, M.; Ábrego, J.; Olszewski, M.P.; Cao, Z.; Kruse, A. Combustion Characteristics of Hydrochar and Pyrochar Derived from Digested Sewage Sludge. Energies 2020, 13, 4164. [Google Scholar] [CrossRef]
  96. Liu, Q.; Fang, Z.; Liu, Y.; Liu, Y.; Xu, Y.; Ruan, X.; Zhang, X.; Cao, W. Phosphorus speciation and bioavailability of sewage sludge derived biochar amended with CaO. Waste Manag. 2019, 87, 71–77. [Google Scholar] [CrossRef] [PubMed]
  97. Yao, S.; Wang, M.; Liu, J.; Tang, S.; Chen, H.; Guo, T.; Yang, G.; Chen, Y. Removal of phosphate from aqueous solution by sewage sludge-based activated carbon loaded with pyrolusite. J. Water Reuse Desalination 2017, 8, 192–201. [Google Scholar] [CrossRef] [Green Version]
  98. Ren, N.; Tang, Y.; Li, M. Mineral additive enhanced carbon retention and stabilization in sewage sludge-derived biochar. Process Saf. Environ. Prot. 2018, 115, 70–78. [Google Scholar] [CrossRef]
  99. Wang, Q.; Li, J.; Poon, C.S. Using incinerated sewage sludge ash as a high-performance adsorbent for lead removal from aqueous solutions: Performances and mechanisms. Chemosphere 2019, 226, 587–596. [Google Scholar] [CrossRef]
  100. Xing, J.; Li, L.; Li, G.; Xu, G. Feasibility of sludge-based biochar for soil remediation: Characteristics and safety performance of heavy metals influenced by pyrolysis temperatures. Ecotoxicol. Environ. Saf. 2019, 180, 457–465. [Google Scholar] [CrossRef] [PubMed]
  101. Xie, S.; Yu, G.; Ma, J.; Wang, G.; Wang, Q.; You, F.; Li, J.; Wang, Y.; Li, C. Chemical speciation and distribution of potentially toxic elements in soilless cultivation of cucumber with sewage sludge biochar addition. Environ. Res. 2020, 191, 110188. [Google Scholar] [CrossRef] [PubMed]
  102. Wang, J.; Wang, S. Preparation, modification and environmental application of biochar: A review. J. Clean. Prod. 2019, 227, 1002–1022. [Google Scholar] [CrossRef]
  103. Singh, S.; Kumar, V.; Dhanjal, D.S.; Datta, S.; Bhatia, D.; Dhiman, J.; Samuel, J.; Prasad, R.; Singh, J. A sustainable paradigm of sewage sludge biochar: Valorization, opportunities, challenges and future prospects. J. Clean. Prod. 2020, 269, 122259. [Google Scholar] [CrossRef]
  104. Cui, X.; Hao, H.; He, Z.; Stoffella, P.J.; Yang, X. Pyrolysis of wetland biomass waste: Potential for carbon sequestration and water remediation. J. Environ. Manag. 2016, 173, 95–104. [Google Scholar] [CrossRef]
  105. Almanassra, I.W.; McKay, G.; Kochkodan, V.; Ali Atieh, M.; Al-Ansari, T. A state of the art review on phosphate removal from water by biochars. Chem. Eng. J. 2021, 409, 128211. [Google Scholar] [CrossRef]
  106. Xu, G.; Zhang, Z.; Deng, L. Adsorption Behaviors and Removal Efficiencies of Inorganic, Polymeric and Organic Phosphates from Aqueous Solution on Biochar Derived from Sewage Sludge of Chemically Enhanced Primary Treatment Process. Water 2018, 10, 869. [Google Scholar] [CrossRef] [Green Version]
  107. Zhang, M.; Song, G.; Gelardi, D.L.; Huang, L.; Khan, E.; Mašek, O.; Parikh, S.J.; Ok, Y.S. Evaluating biochar and its modifications for the removal of ammonium, nitrate, and phosphate in water. Water Res. 2020, 186, 116303. [Google Scholar] [CrossRef]
  108. Wongrod, S.; Simon, S.; van Hullebusch, E.D.; Lens, P.N.L.; Guibaud, G. Changes of sewage sludge digestate-derived biochar properties after chemical treatments and influence on As(III and V) and Cd(II) sorption. Int. Biodeterior. Biodegrad. 2018, 135, 96–102. [Google Scholar] [CrossRef]
  109. Zhou, D.; Liu, D.; Gao, F.; Li, M.; Luo, X. Effects of Biochar-Derived Sewage Sludge on Heavy Metal Adsorption and Immobilization in Soils. Int. J. Environ. Res Public Health 2017, 14, 681. [Google Scholar] [CrossRef]
  110. Matheri, A.N.; Eloko, N.S.; Ntuli, F.; Ngila, J.C. Influence of pyrolyzed sludge use as an adsorbent in removal of selected trace metals from wastewater treatment. Case Stud. Chem. Environ. Eng. 2020, 2, 100018. [Google Scholar] [CrossRef]
  111. Chen, Y.; Li, M.; Li, Y.; Liu, Y.; Chen, Y.; Li, H.; Li, L.; Xu, F.; Jiang, H.; Chen, L. Hydroxyapatite modified sludge-based biochar for the adsorption of Cu2+ and Cd2+: Adsorption behavior and mechanisms. Bioresour. Technol. 2021, 321, 124413. [Google Scholar] [CrossRef] [PubMed]
Figure 1. TG and DTG curves of sewage sludge (SS), T. latifolia plant (TLP) and digestate samples D1 and D2 at heating rates: (a) 15 °C/min, (b) 30 °C/min, and (c) 100 °C/min.
Sustainability 13 09642 g001
Figure 2. Activation energy E α as a function of conversion degree calculated according to: (a) the KAS and (b) FWO models.
Sustainability 13 09642 g002
Figure 3. FTIR spectra of sewage sludge, T. latifolia and solid fraction of digestates D1 and D2 before pyrolysis (a) and biochars obtained from these feedstocks after pyrolysis (b).
Sustainability 13 09642 g003
Figure 4. The results of the cress seed germination test performed with biochars B-D1 and B-D2 and dependence on the concentration of biochars: (a) the root length index, (b) Munoo-Liisa vitality index, and (c) pH of the soil.
Sustainability 13 09642 g004
Figure 5. The results of the adsorption tests with the biochars B-D1 and B-D2 for: (a) PO43− adsorption, (b) NH4+ adsorption, (c) Cu2+ adsorption, and (d) Cd2+ adsorption.
Sustainability 13 09642 g005
Table 1. Feedstocks and experimental conditions used in the thermogravimetric analysis.
FeedstockBiochar MarkPyrolysis ConditionsTested Heating Rates
Sewage sludge digestate (D1) *B-D125–800 °C,
inert atmosphere
(nitrogen flow of 100 mL/min)
15, 30, and 100 °C/min
Digestate of sewage sludge mixture with T. latifolia plant (D2) *B-D2
Sewage sludge (SS)B-SS
T. latifolia plant (TLP)B-TLP
* Solid fraction of digestate.
Table 2. Proximate, ultimate, and heavy metal analysis of the feedstocks.
ParameterSewage Sludge (SS)T. latifolia Plant (TLP)Digestate D1 aDigestate D2 a
Dry matter (wt.%)17.4219.7712.1614.38
Moisture content (wt.%)82.5880.2387.8485.62
Volatile matter (wt.%) b70.9979.4257.8760.18
Ash (wt.%) b18.487.3135.6631.08
FC (wt.%) b10.5213.276.478.74
HHV (MJ/kg)19.9117.0212.7512.64
HHVtheoretical (MJ/kg)19.9320.5013.0113.30
C (wt.%)42.3045.7931.9034.83
H (wt.%)6.757.104.153.73
N (wt.%)8.103.634.353.58
S (wt.%)1.160.491.351.09
O (wt.%)23.2135.6822.5925.69
H/C c1.911.861.561.29
O/C c0.410.580.530.55
N/C c0.160.070.120.09
P (wt.%)2.610.571.010.86
Ca (wt.%)2.041.455.354.87
Mg (wt.%)0.820.320.340.26
K (wt.%)0.823.441.151.18
Si (wt.%)0.140.040.090.05
Fe (wt.%)0.880.180.310.21
Cd (mg/kg d.m.)1.031.05<1<1
Crtotal (mg/kg d.m.)45.151.4238.5830.69
Cu (mg/kg d.m.)173.616.24165.59153.10
Ni (mg/kg d.m.)25.351.6817.1013.07
Pb (mg/kg d.m.)26.662.1015.8512.04
Zn (mg/kg d.m.)740.7926.73596.36489.40
a Solid fraction, b on a dry basis, c molar ratio.
Table 3. Weight loss during different decomposition stages and characteristics of DTG curves (peak temperature T p and maximum value of the derivative curve DTGmax) for the tested samples.
SampleHeating Rate (°C/min)Weight Loss (wt.%)Total Weight Loss (wt.%)Final Residue (wt.%) T p   ( ° C ) DTGmax (1/s)
Dehydration (Stage I)Active Pyrolysis (Stage II)Passive Pyrolysis (Stage III)
Digestate D1152.7040.4413.3356.4743.532995.31 × 10−4
303.1241.4710.6055.1844.823321.06 × 10−3
1002.0941.796.8350.7149.293803.44 × 10−3
Digestate D2152.6340.4916.7259.8540.153065.84 × 10−4
303.5137.1913.7854.4845.523128.79 × 10−4
1003.1838.477.8949.5450.463623.32 × 10−3
Sewage sludge (SS)157.0556.793.9667.8032.202927.17 × 10−4
304.2359.343.9467.5132.493111.51 × 10−3
1003.3863.013.4569.8530.153595.28 × 10−3
T. latifolia plant (TLP)157.2254.9613.3775.5524.453471.89 × 10−3
305.6055.8512.9174.3625.643592.80 × 10−3
1007.1755.4512.8175.4424.564081.18 × 10−2
Table 4. Comparison of kinetic and thermodynamic parameters calculated for the analyzed feedstocks (digestates D1 and D2, sewage sludge, and T. Latifolia) with data from the literature.
Feedstock E α (kJ/mol) A (1/s) Δ H (kJ/mol) Δ G (kJ/mol) Δ S (J/mol·K) Kinetic ModelRef.
Digestate D1 (sewage sludge)66–3516.73 × 103–3.80 × 103061–347160–168(−185)–(327)FWOThis study
Digestate D2 (sewage sludge + T. latifolia plant)70–4011.37 × 104–5.43 × 103465–397161–170(−180)–(406)FWOThis study
SS digestate90–227////FWO[42]
SS digestate49–1985.49 × 101–7.92 × 10¹⁴///nth-order reaction model[34]
Sewage sludge co-digested with grease waste (ratio 95:5)132–226////FWO[42]
Swine manure digestate179–2232.55 × 1016–1.45 × 1020179–219143–147(54)–(127)FWO[45]
Lignocellulosic biomass digestate75–1751.83 × 10−2–9.74 × 10⁹///FWO[44]
Lignocellulosic biomass digestate130–2301.05 × 102–7.83 × 10¹⁵///Starink model-free method[25]
Roadside grass digestate30–1756.74 × 10−3–1.59 × 10¹⁵///KAS[85]
Corn stover digestate99–3311012–1022///DAEM a[88]
Sewage sludge41–1672.12 × 101–4.85 × 101336–163161–167(−233)–(4)FWOThis study
63–3233.22 × 104–5.78 × 102670–31885–90(−90)–(650)FWO[41]
46–2321.02 × 109–3.97 × 101941–22753–295(−151)–(63)FWO[69]
48–821.34 × 101–5.92 × 10511–134//Coats and Redfern[89]
75–292////FWOWang 2020 [33]
200–4001015–1025///DAEM a[1]
T. latifolia plant67–3592.18 × 103–4.83 × 102862–354174–183(−195)–(290)FWOThis study
135–2047.6 × 109–7.9 × 1015130–199171–173(−70)–(45)FWO[24]
Para grass152–2423.06 × 1011–2.26 × 1019113–237169–173(−98)–(111)FWO[80]
Camel grass85–1931.77 × 105–4.70 × 101479–188174–178(−159)–(23)FWO[82]
Chicken manure149–2881.00 × 106–1.00 × 1014165–170158–175(−8)–(12)FWO[29]
Castor residue102–2163.06 × 108–6.26 × 101897–211151–154(−97)–(101)FWO[86]
Canola residue129–3916.5 × 109–3.4 × 1027136–385158–212(−51)–(284)DAEM a[71]
a Distributed activation energy model.
Table 5. Thermodynamic parameters ( A ,   Δ H ,   Δ G ,   Δ S )   of pyrolysis of sewage sludge, T. latifolia and solid digestates D1 and D2 calculated at the heating rate of 15 °C/min.
FWO MethodKAS Method
α A (1/s) R2 Δ H (kJ/mol) Δ G (kJ/mol) Δ S (J/mol·K) A (1/s) R2 Δ H (kJ/mol) Δ G (kJ/mol) Δ S (J/mol·K)
Digestate D1
0.16.73 × 1030.9961.46167.53−185.369.14 × 1020.9852.63168.21−201.97
0.22.19 × 1050.9977.03166.52−156.392.62 × 1040.9967.51167.11−174.06
0.39.87 × 1051.0083.80166.14−143.891.06 × 1050.9973.77166.72−162.42
0.42.67 × 1070.9998.76165.40−116.462.67 × 1060.9988.29165.91−135.63
0.52.09 × 1090.98118.67164.56−80.211.90 × 1080.98107.70165.01−100.14
0.65.10 × 10140.93175.86162.7522.914.17 × 10130.92164.27163.072.10
0.73.80 × 10300.93346.57159.59326.762.74 × 10290.93334.23159.76304.89
0.83.38 × 10170.92206.03162.0276.914.14 × 10190.88228.43161.54116.90
Digestate D2
0.11.37 × 1040.9265.47169.53−179.581.95 × 1030.9056.74170.17−195.76
0.22.47 × 1060.9589.12168.14−136.363.09 × 1050.9479.61168.65−153.66
0.31.66 × 1070.9697.86167.71−120.551.87 × 1060.9587.83168.20−138.71
0.41.37 × 1091.00118.25166.83−83.851.43 × 1081.00107.78167.26−102.64
0.54.92 × 10121.00156.39165.53−15.774.64 × 10111.00145.35165.88−35.42
0.65.21 × 10311.00363.45161.55348.424.38 × 10301.00351.68161.71327.85
0.75.43 × 10340.97396.52161.14406.203.63 × 10330.97383.64161.30383.71
0.84.49 × 10200.79242.63163.47136.612.79 × 10240.82283.96162.73209.22
Sewage sludge (SS)
0.12.12 × 1010.9935.80167.48−233.132.83 × 1000.9827.43168.57−249.89
0.29.99 × 1021.0052.28165.88−201.121.15 × 1021.0042.95166.72−219.12
0.36.06 × 1031.0060.14165.27−186.136.31 × 1020.9950.29166.05−204.94
0.43.43 × 1041.0067.76164.75−171.713.34 × 1030.9957.53165.46−191.09
0.51.90 × 1051.0075.32164.28−157.511.71 × 1040.9964.68164.95−177.52
0.68.76 × 1050.9982.13163.90−144.777.30 × 1040.9971.09164.54−165.44
0.71.17 × 1070.9993.72163.31−123.229.07 × 1050.9982.28163.89−144.49
0.82.24 × 1090.99117.38162.30−79.531.57 × 1080.99105.39162.79−101.61
0.94.85 × 10130.99162.77160.823.462.86 × 10120.99149.86161.19−20.07
T. latifolia plant (TLP)
0.12.18 × 1030.9461.54182.65−195.404.00 × 1020.9253.47183.32−209.49
0.25.89 × 1041.0077.43181.55−167.998.05 × 1031.0067.81182.19−184.54
0.33.72 × 1051.0086.39181.02−152.684.71 × 1041.0076.34181.62−169.86
0.42.36 × 1061.0095.44180.54−137.302.83 × 1051.0085.06181.10−154.94
0.51.24 × 1071.00103.57180.13−123.531.42 × 1060.9992.94180.66−141.53
0.62.31 × 1071.00106.65179.99−118.332.56 × 1061.0095.84180.51−136.62
0.71.48 × 1081.00115.82179.58−102.881.60 × 1071.00104.83180.08−121.40
0.81.37 × 10141.00184.27177.2711.291.39 × 10131.00172.82177.59−7.70
0.94.83 × 10280.99353.61173.98289.813.93 × 10270.99340.87174.17268.96
Table 6. Chemical characteristics of the obtained biochars.
ParameterBiochar
B-SSB-TLPB-D1B-D2
Biochar yield (wt.%)32.4925.6444.8245.52
HHV (MJ/kg)11.8412.9211.6112.15
Ash (wt.%) a56.2241.0670.2064.78
C (wt.%)37.1053.4224.3329.03
H (wt.%)0.581.470.180.31
N (wt.%)5.283.331.391.48
S (wt.%)0.050.210.920.59
O (wt.%)0.770.512.983.81
H/C b0.190.330.090.13
O/C b0.020.010.090.10
N/C b0.120.050.050.04
P (wt.%)7.941.672.111.72
Ca (wt.%)6.6011.578.6012.37
Mg (wt.%)2.341.780.740.58
K (wt.%)2.511.782.043.35
Si (wt.%)0.130.040.090.05
Fe (wt.%)1.490.280.540.52
Cd (mg/kg d.m.)<1<1<1<1
Crtotal (mg/kg d.m.)60.456.4062.3147.58
Cu (mg/kg d.m.)300.7711.00369.27283.25
Ni (mg/kg d.m.)33.783.0029.7726.64
Pb (mg/kg d.m.)51.881.4025.0920.73
Zn (mg/kg d.m.)2352.4256.901179.38939.61
pH9.3610.8911.0511.22
a On a dry basis, b Molar ratio.
Publisher’s Note: MDPI stays neutral with regard to jurisdictional claims in published maps and institutional affiliations.

