Abstract
The transport procurement process is based on criteria selected by shippers when soliciting tenders from carriers. Although sustainable transport indicators are not yet a formal selection criterion in France, some indicators are starting to be gradually considered in freight transport contracts between shippers and carriers. Dispersed information can be gathered regarding Euro 5 and Euro 6 standards compliance for trucks, their fuel consumption, the number of signatory shippers to the CO2 reduction charter, and the search for less-polluting alternative freight solutions. However, these elements are difficult to quantify, and it is often hard to formalise and evaluate their related performance. Therefore, the objective of this article is to draw up, at the request of ADEME (the French Environment and Energy Management Agency), a series of reliable, operational sustainable transport indicators that can be applied to all shippers regardless of their size or industry sector. As part of the FRET 21 charter deployment in France, this article proposes a list of measurable sustainability indicators to support transport buyers when selecting freight carriers.
1. Introduction
The social and environmental costs of transport increasingly attract the attention of researchers and politicians across the world. A study conducted by the International Energy Agency in 2018 points out that transportation is responsible for about 26% of CO2 emissions globally, which is equivalent to running more than 37 million trucks for a year (https://www.iea.org/data-and-statistics/charts/global-co2-emissions-by-sector-2018 (accessed on 3 July 2021)). Hence, businesses’ and citizens’ transportation practices need to be carefully scrutinised and accordingly reshaped. For example, road freight transport still accounts for 25% of the world’s energy consumption, with conventional diesel still being the predominant fuel used for heavy-duty trucks [1]. The increasing awareness of sustainability, as well as escalating environmental standards, have boosted organisations’ responsibility to take into account sustainability concerns when choosing their suppliers [2]. Yet, the purchase of services, which includes freight transportation, remains a difficult subject because of its intangible nature [3].
Transportation purchasing processes incorporating environmental concerns have been the subject of research carried out in Italy [4], France [5], Finland [6], Sweden [7,8] and the Netherlands [9]. All these studies examine the freight transport logistics purchasing process between the shippers (the owners of the goods) and the carriers (sometimes called transporters or logistics services providers). Therefore, various criteria based on qualitative and quantitative information seem to be taken into account when shippers deploy freight transport bidding strategies. These criteria are the cost of the service, the transportation mode proffered, and the associated social and environmental costs before selecting the carrier that best suits their requirements [10,11]. Although environmental protection does not as yet seem to be one of the selection criteria [12,13,14], some sustainable transport indicators are gradually being taken into account when choosing a carrier. A recent study reveals that the EU emissions standards Euro 5 and Euro 6, trucks’ fuel consumption and carriers’ adherence to the voluntary charter to reduce carbon dioxide emissions are being slowly adopted as “less-polluting alternative solutions” [14]. However, these elements are difficult to quantify, and it is often difficult to formalise these initiatives and assess carriers’ environmental performance. In this perspective, several studies highlight the lack of a continuous sustainability assessment capacity as well as the lack of monitoring tools that freight transporters could adopt to evaluate their sustainability practices [6,15].
In another vein, as pointed out by [16], we observed a real mismatch between shippers’ needs and current service providers’ offerings. This remains an important research gap and is also highlighted by [5] when assessing the impact of the voluntary FRET21 commitments charter in France.
Based on these observations, we decided to formulate the following research question:
Which sustainable freight transport indicators would best suit shippers when selecting their carriers?
The purpose of this qualitative study is two-fold: One objective is to evaluate the feasibility and pertinence of the indicators presented from the shippers’ point of view. A second objective is to increase the understanding by producers of future technological innovations of shippers and carriers’ needs. Hence, the results of this study are addressed to both private companies and public authorities.
Although the research gap highlighted is applicable to all countries, we decided to lead this exploratory investigation in France, as we are employed by French higher education institutions. A French report published in 2015 estimates that CO2 emissions generated by freight transport could be multiplied by a factor of four between 2010 and 2050 (Rapport de l’OCDE: Perspectives des transports 2015, Editions OCDE, Paris, France, http://www.oecd.org/fr/publications/perspectives-destransports-fit-2015-9789282107805-fr.htm (accessed on 12 July 2021)). Since 90% of freight transport is carried by road in France (Rapport du Ministère de l’Environnement, de l’Energie et de la Mer intitulé Les infrastructures linéaires de transport: évolutions depuis 25 ans, décembre 2016), the government strengthened its efforts to reverse the trend by providing innovative solutions with the adoption of a series of voluntary and mandatory measures:
The “Objectif CO2” introduced in 2008 and developed by the French Ministry of Ecology with ADEME and other freight transport professional organisations is aimed at all carriers that voluntarily agree to reduce their CO2 emissions. Their actions can be assessed in four areas: (1) vehicle standards; (2) fuel consumption; (3) driver behaviour; and (4) logistical efficiency. Compliance certification can be obtained after an independent audit if CO2 emissions have been reduced during three consecutive years.
In parallel, a mandatory measure was launched in 2013 by decree n°2011-1336. It obliges all carriers to calculate their CO2 impact according to one of four possible levels of accuracy, from level 1 based on estimations to level 4 involving accurate data collection in respect of each journey’s exact operating conditions. These two voluntary and mandatory French programmes concern essentially carriers and reveal information asymmetries, as pointed out by [14].
In addition, the French Ministry of the Environment decided on a programme to increase sustainability awareness by shippers. Since they entrust their merchandise to carriers, they should also be cognisant of the CO2 emissions generated by their freight operations. This gave rise to the FRET21 project, launched in 2015 by the French government with 10 pilot companies. The project was deployed through four main lines of action (Figure 1).
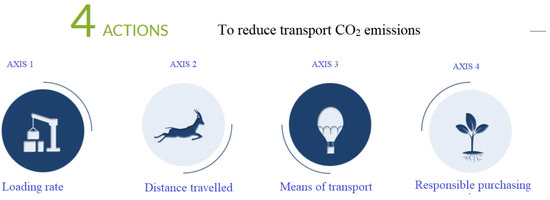
Figure 1.
The four lines of actions that constitute the FRET21 charter.
Analysing the four lines of actions deployed in the FRET21 charter, one can notice that axis n°4 is entirely dedicated to the “transport purchasers”. Accordingly, by questioning the managers in charge of the transport services procurement from the 10 pilot companies, the aim of this work is to provide them with relevant indicators that they can monitor regularly. These indicators should be transposable to all shippers regardless of their size or sector of activity, thereby promoting sustainable transport purchasing practices.
Thus, the objective of this study is to propose, at the request of ADEME, a series of reliable, operational, sustainable transport indicators that would strengthen the FRET21 charter programme. Investigating the 10 involved pilot companies allows gathering a heterogeneous data collection relating to transportation environmental assessment grids, internal freight services purchasing documents, and the results of the programme participants brainstorming activities. The set of final indicators that we have obtained through this research has been elaborated with the assistance of French transport purchasing managers from Carrefour, Coca-Cola, Saint-Gobain, Renault, Fleury Michon, Air Products, Henaff, Ferrero, SCA Hygiene Products, and Orrion Chemicals, the 10 pilot companies that signed up to the FRET21 charter. However, the authors of this paper take full responsibility for the results of the study.
The paper is organised as follows. Section 2 provides a literature review focused on decision-making levers as well as sustainable transport indicators. Section 3 presents the research design and methodological approach, based on the ECOGRAI method, a method designed to implement Performance Indicator Systems (PIS) for industrial organisations [17,18]. In Section 4, the results are presented, and open issues are discussed. The concluding section summarises the main conclusions of this paper and suggests future research avenues to be explored.
2. Literature Review
We first present the most relevant studies exploring sustainable transport indicators, emphasising the main dimensions they consider (Section 2.1). Then, we set up a list of concrete sustainable transport indicators that we can carefully draw from the extant literature (Section 2.2).
2.1. Models Proposing Sustainable Transportation Indicators
Several studies propose sustainable indicators in respect of transport services, but they are often general, encompassing both passenger and freight transport. For example, the report by the European Environment Agency (EEA, 2014, 2020) (https://www.eea.europa.eu/themes/transport/indicators#c5=all&c13=20&c10=&c7=all&b_start=0 (accessed on 6 July 2021)) proposes a set of 20 indicators. However, it does not specify how to measure them or evaluate the degree of internal and external collaboration with other stakeholders that their calculation and application requirements. It is difficult to draw up an exhaustive list of all the studies exploring sustainable transport indicators. Except for [19], who chooses to focus on only two dimensions (tactical and organisational), and Talbot [20], who focuses on three domains (organisational, commercial, governance), most of the works include between 5 and 10 dimensions. We decided to select and present five approaches that are the most congruent with our subject.
The first is the analytical model introduced by [21], which lists seven parameters influencing the level of CO2 emissions in freight transport: the spatial structure of the supply chain, freight modal split, vehicle routing, vehicle use, exposure to congestion, fuel efficiency, and the carbon intensity of the energy source. This model combines parameters related to network design, supply, technology, and management methods. The second approach refers to the work of [22,23]. Starting from the seven categories identified by [21], these authors add two substantial categories referring to management: the eighth category concerns environmental requirements with their partners when they obtain ISO 14001 certification standard; the ninth category refers essentially to collaboration with their partners and the implementation of collaborative managerial practices. Taking up the work of [24], this author insists on the role played by the top management in deploying an organisational environment with the actors integrated into the logistics chain.
The third approach introduced by [25] proposes eight indicator categories: travel-related activities (vehicles used, modes of transport), air pollution (types of emissions by mode of transport), noise, traffic (accidents), financial productivity, environmental noise, accessibility, land use, equity (accessibility for disabled or disadvantaged populations), and transport and planning policy. The effectiveness of environmental collaboration with external actors is not mentioned. However, indicators to measure the environmental performance of the route (types of vehicles, etc.), the journey (types of vehicles, engines used), or the use of alternative modes of transport seem very relevant and relatively easy to implement.
The fourth approach is based on research by [13], who classify sustainable transport indicators according to five dimensions: the reduction in energy intensity and emissions, reduction in distances travelled, the choosing of transporters according to environmental aspects, the continuous improvement in working conditions as well as the strengthening of skilled jobs. This fourth model points out the human and managerial dimensions at the heart of sustainable transport procurement. Finally, the fifth model proposed by [19] is designed to optimise and model transport services in the forestry industry by splitting the performance indicators into two dimensions: a tactical dimension (which includes the tonnage of material transported, the rate of resource use, etc.) and an organisational dimension focused on the efforts made to reduce the overall fleet mileage, thus optimising the average truck load.
Analysing these five approaches that propose transport performance measures, one can notice that vehicle optimisation, fuel consumption reduction, distance optimisation, alternative transport modes, behavioural aspects, and technical requirements towards carriers are the most cited dimensions. However, most of the indicators or methods promoted lack precision, making them difficult to implement.
2.2. Main Decision Variables Identified to Set Up Concrete Sustainable Transport Indicators
Decision variables internally set by shippers would allow them to progressively change their practices and achieve specific objectives in terms of environmental performance. Although time dimension plays a relevant role, this feature does not seem to impact the French context drastically. A study conducted by [26] examines the contract length in two countries, France and Sweden. The results point out that Swedish shippers devote more effort to develop a certain degree of stability with their carriers in comparison to French shippers. The latter seems more reluctant to sign contracts for more than 1 year [26]. Based on a broad literature review, seven decision variables are identified and can be divided into two groups: (1) the technical and operational dimension and (2) the managerial dimension (Table 1).

Table 1.
Two main dimensions linked to decision variables.
Scrutinising in depth each decision variable mentioned in Table 1, the following work is to identify a series of indicators that are measurable and can be settled in any company, regardless of its size or sector of activity.
2.2.1. Volume Optimisation
● Loading Rate of Trucks Carrying the Shipper’s Goods:
Several academic studies [19,27,28,29,30] suggest the loading rate of trucks to be the primary relevant indicator, particularly by taking volume as the basis of measurement. However, the calculation methods are not always simple or explicitly stated. [27] point out that the loading rate of trucks can be calculated by obtaining the ratio of the capacity used divided by the capacity available in the truck. In this way, we could obtain an average of the physical “loading rate” for the trucks used [19].
This indicator could be insightful for full trucks but not for small orders or partial deliveries. In this vein, companies that use partial loads will have to work more closely with upstream and downstream carriers, optimising the loading rate of trucks. This could be possible by working on delivery time and pooling with other shippers.
For shippers who work mainly with full loads, we propose, in line with the work of [27], to evaluate the average truck occupancy rate upstream as follows: the number of pallets received/the number of pallets that can be carried in the truck. The proposal for the downstream occupancy would be: the number of pallets loaded/number of pallets that can be carried in the truck. Given that a full truck can carry 33 euro-pallets or 26 (120 × 100 cm) pallets, one can propose to set a target occupancy rate of 80%. This indicator can increase progressively to 85%, 90% depending on the results obtained.
● Double-Deck Loading Rate
Based on preliminary interviews with the 10 first companies who signed the FRET21 charter, the use of double-decking would be relevant. A double-deck trailer truck has two levels for cargo, one above the other [31]. It has several advantages: up to 66 pallets can be loaded, which reduces costs (fuel, motorways, handling) and CO2 emissions per pallet transported. This indicator seems to be particularly accessible for large companies, and its implementation is very efficient in terms of environmental performance. A target rate could then be set to encourage more and more double-deck loading of trucks (30%, then 40%).
● Weight of Goods Loaded per Pallet and then per Truck
Inspired by the work of [32] proposing an indicator on the weight of goods loaded in vehicles, we propose that shippers introduce this indicator in order to obtain a significant increase in the load of products transported, internally uniting several divisions around this same objective. The supply chain division could then work with other departments on the pallet’s characteristics, the packaging, and the constraints of the goods in order to reduce the volume/weight of the packaging, optimising the space between each product.
● Number of Empty Kilometres for Trucks Carrying no Goods
Based on [19,33,34,35], it seems relevant to measure in weight, volume, the kilometres travelled empty by the trucks carrying no goods. [19] proposes an operational indicator that measures overall fleet mileage (sum of distances travelled over a period with empty and loaded truck fleets). Although this calculation seems coherent and accessible for full truckloads, it may be difficult to implement for partial truckloads. As a consequence, this additional indicator is mainly directed to large companies.
2.2.2. Distances Optimisation
● Average Number of Kilometres Travelled by Road Concerning Shippers’ Finished Goods.
The optimisation of logistics maps appears in several studies [22,25,34]. However, their guidelines are not always formalised, and the calculation methods are not explicit. While [21] highlights a real need for companies to have an indicator measuring distances travelled, [36] ways to elaborate such an indicator.
● Average Kilometres Travelled by Road Transport for Each Product Reference:
This indicator is based on the work carried out by [36], in which some shippers interviewed are equipped with a TMS (Transport Management System) able to calculate the average number of kilometres travelled per product. These results go beyond previous studies conducted by [23,25,30] since each product number could have personalised environmental information. Although it requires significant human and material resources, it would enable the shipper to measure the mileage performance of products, orientating the choice towards other transport modes or alternative routes.
2.2.3. Alternative Transport Modes
● Percentage of Volumes Managed by Transport Mode
The use of multimodal transport is addressed by several authors [23,30,37,38]. Price, reliability, or even shipment time [39] often represent a hindrance not to choose alternative modes such as rail. Conducting their study in Sweden [22] propose an indicator entitled “mode choice and intermodal transportation”, which consists of: (1) favouring intermodal transfer from road to rail, (2) favouring the least-polluting mode of transport and, (3) making greater use of intermodal solutions. However, the methods of calculation and decision-making are not explicit. In this perspective, the use of shipper’s telematics could enable evaluation of the volumes of goods transported by road, rail, and river networks, thereby setting up concrete objectives.
2.2.4. Fuel Consumption Reduction
● Fuel Consumption per Truck per Km:
Works such as [22,40,41,42] find that a fuel consumption indicator would allow the buyer to prioritise certain transporters for their environmental performance. While [42] advocates more route-based calculations, [22] advocate a more efficient transport schedule in terms of filling rate, which reduces fuel consumption per tonne/km. However, the recommendations of these two authors seem vague and difficult to implement. [21] points out that energy efficiency can be calculated by taking the ratio of vehicle consumption/kilometres travelled, regardless of the geographical area and industry sector. Weather conditions [43], as well as the seasonality, also seem to play an important role in the driver’s performance.
● Consumption per “Standard Haul”:
Since geographical constraints such as mountainous regions must be taken into account [20], another indicator measuring fuel consumption per “standard haul” could be proposed, as advocated by [42]. A 2003 report, written during the European conference of ministers of transport, highlights that the standard haul is 400 km for a 40t semi-trailer driven in its country of registration, without any specific itinerary defined (http://www.internationaltransportforum.org/europe/ecmt/pubpdf/03ReformTax.pdf (accessed on 9 July 2021)).
● Consumption Per Driver:
Based on research conducted by [25,36], an indicator can be settled to measure the amount of fuel used per driver in order to boost their awareness of the need for fuel consumption reduction. This indicator goes beyond the indicators advocated by [22] or [40] since the operational behaviours of drivers would be measured and competitive.
● Percentage of Journeys Carried out Using Alternative Energy Sources (Biofuels, Biomethane, Hybrid Vehicles, Gas)
Various studies propose auditing carriers according to the alternative energy sources they use [22,40,42,44,45]. The operational modes are not, however, stated. The implementation of a transport management system may allow shippers to detect the energy sources used per journey.
2.2.5. Technological Innovation/Tool Implementation
● Percentage of Pallets ‘Received’ and ‘Loaded’ on Euro 5 and Euro 6 Standards Vehicles
Empirical work conducted by [25,28,40,45,46] point out the importance of working with carriers using a fleet of “clean” vehicles (Euro 5 and Euro 6 standards compliant). Nevertheless, the assessment methodology is not explicit. Each pallet received or loaded could contain this information, tracked thanks to the employees who would gather the information detail on the wharf. In this way, any shipper could obtain the percentage of pallets received or loaded meeting Euro 5 or Euro 6 standards.
● Percentage of Carriers Equipped with Telematics Technology
Relevant studies advocated by [32] highlight how telematics technology is essential to obtain key performance indicators (KPIs), measuring environmental road transport efficiency. Vehicle capacity, fuel consumption, and transport plans are data that, centralised through telematics, can be communicated in real-time with great accuracy. It could then be relevant to evaluate the percentage of carriers’ trucks equipped with telematics technology, setting targets each year until this requirement becomes an obligation.
2.2.6. Internal Management Practices
● Frequency of Training for Transport Buyers
Various studies mention the need to train the carriers (especially the drivers) on sustainability concerns, whereas training on the shipper side (transport purchasers) is rarely mentioned. In this vein, [13,22,34] point out the need to change managerial practices internally by providing “environmental education to managers”. The Responsible Purchasing Observatory proposes the indicator “number of buyers trained to sustainable purchase”. However, these data are not relevant for several reasons: (1) the number does not necessarily mean that the ratio of trained buyers is taken into account, (2) buyers may be trained at a given time and then gradually forget the lessons they have learned, (3) laws, as well as technologies, are constantly changing. An indicator monitoring the training frequency and the ratio of purchasers trained could then make more sense.
● Frequency of Meetings with Other Divisions on Environmental Issues
The reference [26] highlight that respondents committed to the FRET21 charter organise regular meetings with other departments in order to unite various employees around the same environmental objective. Several topics are covered, such as product design, development, storage, packaging, and even distribution and sales channels. An indicator could then strengthen the frequency of the FRET21 internal meetings.
2.2.7. External Management Practices (Carriers)
● Percentage of Pallets Received and Loaded via Carriers with ISO 14001 Certification
Studies analysing sustainable transport indicators propose encouraging carriers to obtain ISO certification [22,41]. Furthermore, it is pointed out that ISO 14001 is the most recommended standard for three major reasons: (1) it obliges the company to adopt a global risk management policy, (2) it can be acquired independently of the size of the company, thus not disqualifying small carriers and (3) it is recognised worldwide. Therefore, in line with the private organisation TK’Blue (2021), an indicator measuring the percentage of carriers certified ISO 14 001 compliant would be, from our point of view, relevant.
● Percentage of Pallets Received and Loaded via “CO2-Chartered” Carriers
According to [22], the choice of carriers can be based on their “environmental behaviour”, which lacks precision. [14], having conducted research specifically on the French context, highlight that the CO2 charter is well recognised in that country. In this perspective, an indicator measuring in France the rate of pallets received and loaded by carriers who have voluntarily adopted the “CO2 charter” could be relevant.
● Percentage of Pallets Received and Sent via Carriers with the “CO2 Label”
In the same vein, an additional indicator could measure the rate of pallets received and loaded by carriers that have obtained the “Objective CO2” certification. The target objective could be increased each year.
● Percentage of Carriers Complying with Decree 2011-1336 (Mandatory French Programme, Calculating and Disclosing Transport CO2 Information)
The reference [26] highlight a lack of coordination between the voluntary programme FRET21 charter and the mandatory programme (decree 2011-1336). In order to encourage carrier compliance with decree 2011-1336, which, although compulsory, is not widely implemented as no sanction for offenders has been yet decided, an additional indicator could compare the carriers who actually measure their environmental impacts. Some target objectives could be settled to obtain the best level of accuracy.
● Percentage of Drivers Who Received Eco-Driving Training over the Preceding Two Years
Eco-driving training is an indicator mentioned in several studies [13,28,40,47,48]. However, the concrete implementation of this indicator remains unclear, as addressed in the EEA report (2020) (https://www.eea.europa.eu/themes/transport/indicators#c5=all&c13=20&c10=&c7=all&b_start=0 (accessed on 3 July 2021)), which highlights the importance of eco-driving campaigns in reducing CO2 emissions. No clear recommendation is provided. In this sense, it would be relevant to measure the share of drivers who have received eco-driving training. Whereas the private organisation TK’Blue recommends an indicator that allows determining the “number of drivers who have received initial eco-driving training”, this is partly subjective. Following [35], who suggests that the training should be updated every two years, an indicator measuring the share of drivers who received eco-driving training during the preceding two years would probably make more sense.
● Frequency of Meetings with Carriers
References [13,49] recommend an indicator for “cooperation with transporters on sustainable transport”. However, we have little information on its operational implementation among shippers. Therefore, we take inspiration from the Charter for Sustainable Urban Logistics, drafted by the Paris City Council, which proposes the following managerial indicator: frequency of working meetings with transporters. The purchaser could set a target rate of two meetings per year to be regularly informed of the environmental initiatives implemented by the carriers and their follow-up (See Table 2).
Table 2.
Main decision variables identified and linked to the literature exploring sustainable transport indicators.
3. Methodology
The purpose of this research is to propose sustainable transport indicators that would best suit shippers signing up for the FRET21 charter. We decided to conduct a mixed-study method, using both surveys and interviews of transport purchasing managers (through phone calls), ending up with a face-to-face brainstorming session with them.
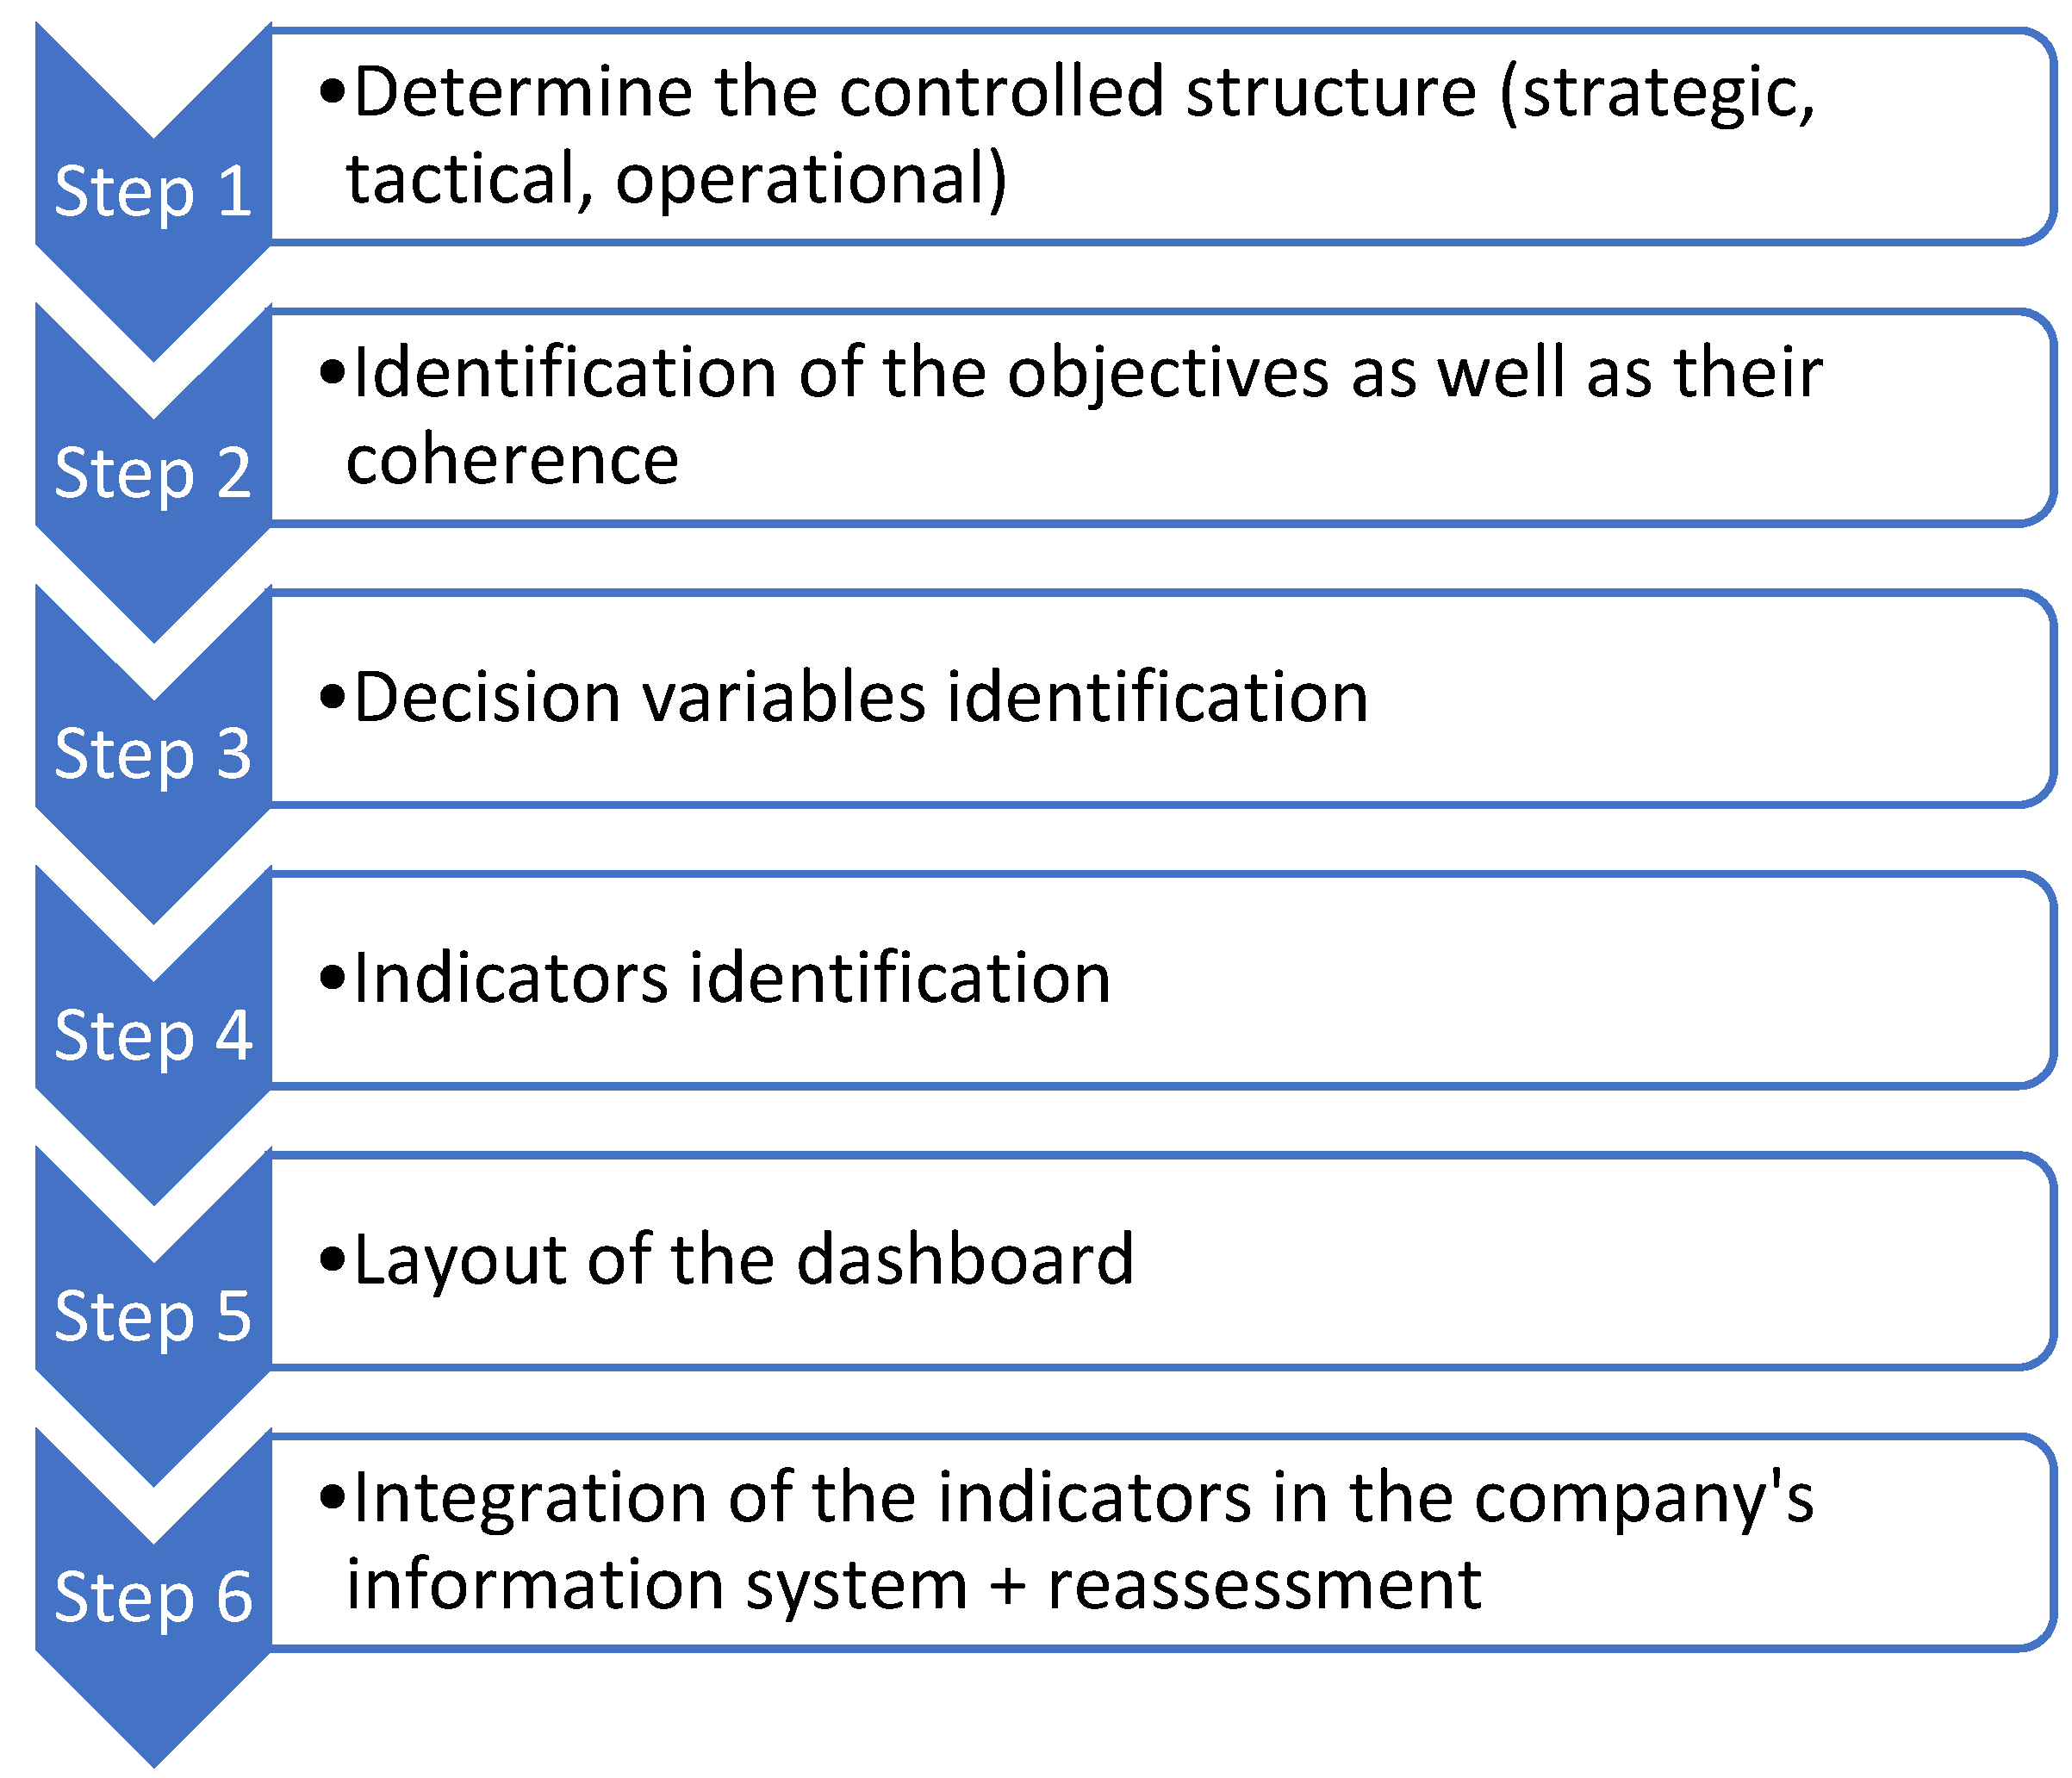
The methodology used to propose suitable indicators relies on the ECOGRAI approach. The ECOGRAI method, initiated to implement Performance Indicator Systems (PIS) for industrial organisations [17,18], can be applied to different production functions. Initially designed to boost production efficiency, the ECOGRAI method has been used in various sectors, e.g., to develop the performance evaluation of healthcare services [50] or of product design activities [51]. This methodology is also used to set up sustainable development performance indicators in the forestry industry [52]. It seems, therefore, appropriate for our research topic, helping us to lead this exploratory investigation in France. The 6 ECOGRAI steps, synthesised in the research conducted by [53,54], can be deployed to our research, as Figure 2 shows.
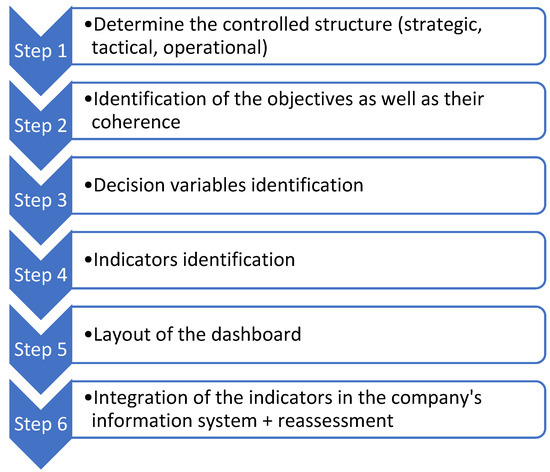
Figure 2.
The six steps of the ECOGRAI method adapted for our research.
Step 1 consists of scrutinising the grids in order to determine the principal control centres and their influence. At a strategic level, the modes of transport for the reception of raw materials and a load of finished products are determined according to market studies communicated by the sales representatives who calculate the costs, the environmental impacts, and various performance indicators via statistics and forecasts. Tactical decisions are then made on the basis of the selection criteria used in the calls for tenders addressed to carriers. Access to internal documents as well as site visits allowed the researchers to understand how the selection criteria were organised among the 10 pilot companies. As for operational decisions, these are the result of the contracts signed with transport companies.
Step 2 aims at setting the objectives and evaluating their coherence. The reference [5] point out various objectives advocated by the French companies that signed up to the FRET21 charter, such as: improve the company’s image by promoting its environmental values; uniting the teams of the various internal divisions; exchanging information on some best practices with other shippers; enhancing the value of environmental initiatives already undertaken; achieving better scheduling of transport operations; supporting carriers in their efforts to reduce CO2 emissions; adapting the practices to future new constraints; being supportive in terms of sharing information on collection tools and working methods. We retain this list of objectives for the present research.
Step 3 consists of identifying decision variables. As already mentioned, based on the previous literature review, the seven decision variables identified above can be divided into two groups: (1) the technical and operational dimension, (2) and the managerial dimension. Steps 4, 5, and 6 are discussed in the following sub-section.
3.1. Indicators Set Up through an Extensive Literature Review
Step 4 from the ECOGRAI method consists of identifying the most relevant indicators. The literature review presented in the second section allowed us to select worldwide research that has been conducted specifically on sustainable freight transport indicators. This detailed work has resulted in the establishment of 21 indicators, as outlined in Section 2.2.1, Section 2.2.2, Section 2.2.3, Section 2.2.4, Section 2.2.5, Section 2.2.6 and Section 2.2.7 above.
Step 5 aims at formatting the scoreboard in a synthetic and structured way. In addition, it is necessary to determine the person responsible for updating the indicator, what his or her function in the company is as well as its precise objectives. We partly applied step 5, synthesising the data required to construct each performance indicator and the processes required to update the information system accordingly, and this is summarised in Table 3.
Table 3.
A total of 21 indicators established are retained after an extensive literature review.
However, we did not determine which employee in every pilot company could update the indicator. We suggest that each organisation signing up to the FRET21 charter sets its own target rates according to its size, industry sector, human and material resources, and environmental ambitions. Furthermore, although the proposed indicators are intended to significantly improve the procurement of sustainable transport, they are not all applicable to all shippers regardless of their organisational features.
Step 6 consists of integrating the indicators in every company’s information system. This operational work will be carried out following the results centralised in this study.
3.2. Selection of the Respondents
The ten companies that constitute the pilot project of the FRET21 charter are a particularly appropriate sample for two main reasons: firstly, as pointed out by [5], many of them have already started to implement the tools and management methods internally in order to reduce their transport impact. Thus, although their sustainable transport purchasing practices are of recent origin, because of their expertise in this area, their critiques and advice will be more constructive than those by any other company that has never initiated such actions; secondly, as mentioned previously, the indicator table is intended to be used and deployed in many companies in the future, regardless of their size and sector of activity. Therefore, these 10 pro-active companies that voluntarily signed up to the FRET21 charter constitute an ideal sample as their sizes and sectors of activity are very diverse (Table 4).
Table 4.
The 10 pilot companies committed to the FRET21 Charter.
3.3. Modalities to Submitting the Indicator Grids
Following previous contacts and correspondence, the grid of indicators was submitted by e-mail to each of the companies’ transportation purchasing decision-makers. Each indicator was clearly explained to avoid any ambiguity. In order to gather an accurate opinion on the relevance and feasibility for each indicator, the deployment of the Likert method seemed rather intuitive [55] (p. 22). The number of possible modalities generally varies from 3 to 7, and it is common to present an odd number in order to suggest a relatively neutral or non-polarised modality in the centre of the scale. Multiple categories do not necessarily mean an increase in accuracy [56], which is why we chose to establish a scale with 5 modalities: 1—not at all, 2—little, 3—no opinion, 4—rather, and 5—very much.
For each indicator, the respondents were asked about its feasibility and its relevance.
3.4. Data Analysis
After collecting the indicator grids, the SPSS software (Statistical Package for the Social Sciences) was used to analyse the data. Using the Likert scale with 5 modalities, respondents’ answers represent a variety of numbers. These ratings are then converted to numbers and used to generate a numerical evaluation. Telephone discussions were also carried out to deepen and better interpret some of the answers.
Among the 21 indicators submitted to respondents, following the ECOGRAI methodology, only 12 are retained since a too-long list would overwhelm transport buyers.
Once the data were analysed, a face-to-face brainstorming session with the 10 participants was carried out in the premises of the French National Association of Road Transport Users (AUTF). This initiative helped to enrich our understanding of the outcome and provided external validity to this research [57].
4. Results
In this section, the main outcomes of this qualitative study are provided. The results obtained for each pilot company vary depending on its size or sector of activity. However, the overall rating, as well as the brainstorming session with the 10 pilot companies together, allow us to point out the most relevant decision variables as well as the indicators that make the most sense to shippers.
4.1. Most Relevant Decision Variables
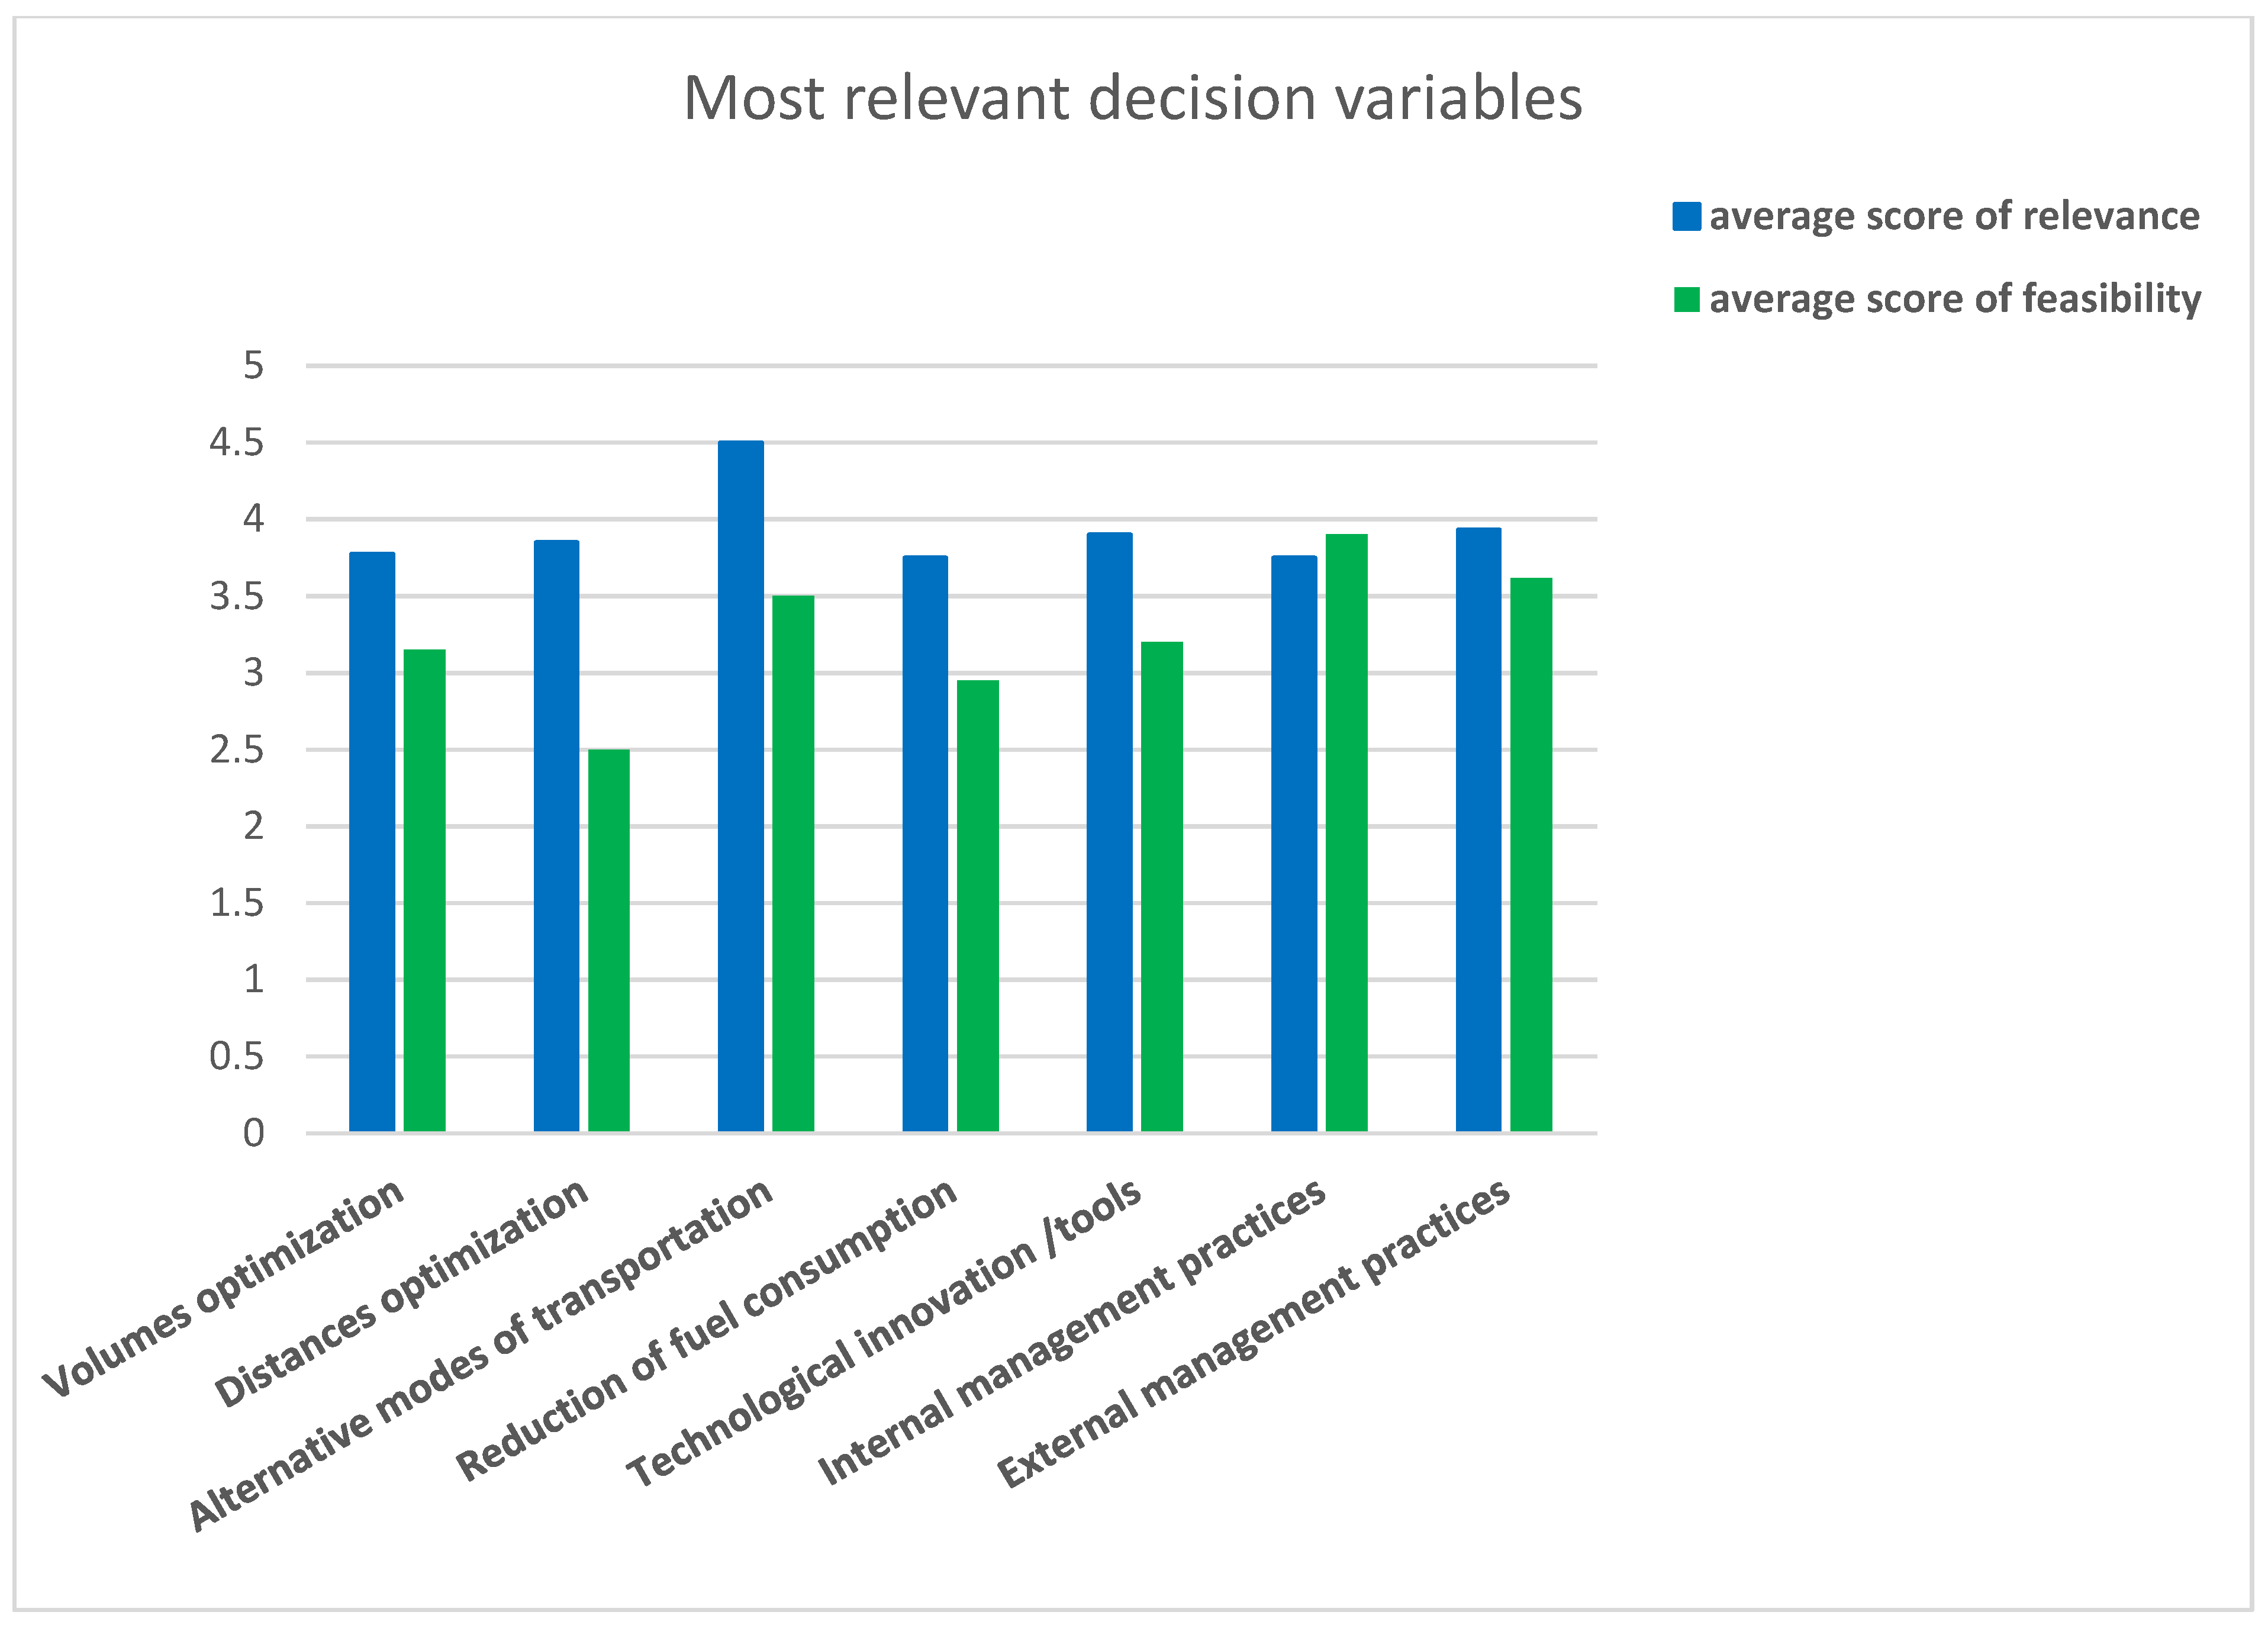
In the first instance, it seems appropriate to assess the average score of every decision variable, exploring their relevance as well as the feasibility perspectives. In general, and as can be observed in Figure 3, although most of the indicators seem relevant for the transport purchasers, they are rather difficult to implement.

Figure 3.
Average scores in terms of relevance and feasibility.
In terms of relevance, both decision variables “alternative modes of transportation” and “external management practices” have the highest score with a respective average score of 4.5/5 and 4/5 on the Likert scale. On the other side, scrutinising the feasibility score of the decision variables, the “internal management practices” and the “external management practices” seem to be the two easiest variables to implement.
In the second instance, it seems appropriate to select the 12 most relevant and feasible indicators according to the respondents. Some indicators, although very relevant for shippers, may be difficult to implement due to the lack of technical or technological means. Our results are elaborated on in the two following sub-sections.
4.2. Preferred Indicators by Order of Relevancy
The 12 “most relevant” indicators are shown in Table 5, in ascending order of relevance, with the corresponding decision variable.
Table 5.
The 12 most relevant indicators.
Of the 12 most relevant indicators, five relate to external and internal management. These include the frequency of external meetings with carriers and internal meetings with various divisions regarding environmental issues, the percentage of drivers receiving eco-driving training during the preceding two years, the percentage of pallets received and sent by “CO2-chartered” carriers, as well as the number of carriers who have obtained the “CO2 objective” certification.
The next decision variable concerns the optimisation of volume (two indicators), in particular finding out the loading ratio of the trucks carrying shippers’ goods and the number of kilometres travelled empty for trucks carrying no goods. The “fuel consumption” decision variable accounts for two of the indicators retained. The most relevant indicators for this theme aim to monitor the percentage of transport carried out using alternative energy sources, as well as knowing the fuel consumption per truck per km.
4.3. Preferred Indicators by Order of Feasibility
In interviewing the 10 companies that first signed up to the FRET 21 charter about the feasibility of the indicators, it appears that 8 of the 12 indicators cited in the “relevancy table” also appear on the “feasibility table” (Table 6).
Table 6.
The 12 indicators cited per order of feasibility.
Crossing Table 5 and Table 6, it appears that the eight most relevant indicator proposals seem fairly easy to implement from an operational point of view.
These results are in line with the work of [5], who conducted a study specifically with the 10 companies that signed up to the FRET21 charter. In addition, these operational indicators converge with the indicators set up in the private organisation TK’Blue (2021).
The four “relevant” indicators that do not appear in the list of “feasibility” indicators are:
Percentage of journeys carried out using alternative energy sources (biofuels, biomethane, hybrid vehicles, gas);
Loading ratio of the trucks transporting shippers’ goods;
Number of empty kilometres for full trucks;
Fuel consumption per truck per km.
The common features of these four indicators, which are missing in the “feasibility table”, lie in the fact that they could be implemented if the shippers had extensive access to the carriers’ telematics. Customer trends and requirements are now moving towards access to the carriers’ onboard telematics. Ref. [58], who provide a thorough analysis of Intelligent Transport Systems (ITS) for road freight transport, discuss telematics applications that may be of interest to the different actors in a transport chain (both the management of transport companies and the end customers). It is, therefore, possible to imagine the FRET21 charter signatories applying, together with their main carriers, a requirement in their transportation contracts specifications to have access to data corresponding to these four indicators. As a consequence, we will retain the 12 most relevant indicators (Table 5) as the ones to be widely transposed to all shippers regardless of their size or sector of activity.
5. Conclusions
This research proposes a specific operational framework to strengthen “sustainable transport procurement practices” in the context of the FRET21 charter deployment. We were able to implement five of the six steps of the ECOGRAI method: (1) determining the steering structure, (2) identifying the objectives, (3) identifying the decision variables, (4) identifying the indicators, and (5) identifying the layout of the dashboard.
Step 6, which consists of integrating the indicators in every company’s information system, represents a lot of fieldwork and may be the subject of future research.
Our study proposes 21 indicators to the pilot companies that signed up to the FRET21 charter. The 12 most relevant indicators, designed to assist transport buyers, were presented and discussed during the brainstorming session with the signatory companies, ADEME as well as AUFT members. These 12 indicators to be transposed to all shippers, regardless of their size or sector of activity, represent a concrete guideline to promote sustainable transport purchasing practices.
Our results underline the need for more efficient inter-organisational collaboration between shippers and carriers. Thus, several indicators require a more transparent transmission of the data, in particular through the use of truck telematics. Although carriers can access a large amount of information, a certain amount of disappointment is noticeable on the shippers’ side as they face difficulties accessing this type of information. However, transport telematics technologies are becoming more widespread, and transport buyers can prioritise carriers that can provide this type of data.
This work, although empirical and useful, presents some limitations. It would be advisable in the future to interview another representative group, comparing their responses with these initial results. Moreover, it would be relevant to scrutinise if the 12 indicators could be more easily implemented according to special features such as the size or a specific industry. One may fear that such a dashboard could be more difficult to apply for small- and medium-sized shippers.
Author Contributions
N.T.-M. was responsible for collecting and processing the data. She wrote the first draft of the manuscript and finalised it in collaboration with J.J. J.J. was responsible for the project administration, supervised the study and finalised the manuscript in collaboration with N.T.-M. All authors have read and agreed to the published version of the manuscript.
Funding
This work was supported by the ADEME (the French Environmental Protection Agency).
Informed Consent Statement
Informed consent was obtained from all subjects involved in the study.
Acknowledgments
The authors would like to thank ADEME, as well as the national transportation purchasing managers of the 10 companies that signed up to the FRET 21 charter as a pilot project for their collaboration.
Conflicts of Interest
The authors declare no conflict of interest.
References
- Teixeira, A.C.; Machado, P.G.; Mendes de Almeida Collaço, F.; Mouette, D. Alternative Fuel Technologies Emissions for Road Heavy-Duty Trucks: A Review. Environ. Sci. Pollut. Res. 2021, 28, 20954–20969. [Google Scholar] [CrossRef]
- Luthra, S.; Govindan, K.; Kannan, D.; Mangla, S.K.; Chandra Prakash, G. An Integrated Framework for Sustainable Supplier Selection and Evaluation in Supply Chains. J. Clean. Prod. 2017, 140, 1686–1698. [Google Scholar] [CrossRef]
- Jackson, R.W.; Lester, A.N.; Dale, A.L. An empirical investigation of the differences in goods and services as perceived by organizational buyers. Ind. Mark. Manag. 1995, 24, 99–108. [Google Scholar] [CrossRef]
- Evangelista, P.; Santoro, L.; Hallikas, J.; Kähkönen, A.K.; Lintukangas, K. Greening Logistics Outsourcing: Reasons, Actions and Influencing Factors. Int. J. Logist. Syst. Manag. 2019, 34, 269. [Google Scholar] [CrossRef]
- Touratier-Muller, N.; Ortas, E. Factors driving shippers’ compliance with a voluntary sustainable freight programme in France. J. Clean. Prod. 2021, 318, 128397. [Google Scholar] [CrossRef]
- Bask, A.; Rajahonka, M.; Laari, S.; Solakivi, T.; Töyli, J.; Ojala, L. Environmental Sustainability in Shipper-LSP Relationships. J. Clean. Prod. 2018, 172, 2986–2998. [Google Scholar] [CrossRef]
- Jazairy, A.; Von Haartman, R. Analysing the Institutional Pressures on Shippers and Logistics Service Providers to Implement Green Supply Chain Management Practices. Int. J. Logist. Res. Appl. 2020, 23, 44–84. [Google Scholar] [CrossRef] [Green Version]
- Rogerson, S. Influence of Freight Transport Purchasing Processes on Logistical Variables Related to CO2 Emissions: A Case Study in Sweden. Int. J. Logist. Res. Appl. 2017, 20, 604–623. [Google Scholar] [CrossRef]
- Van den Berg, R.; De Langen, P.W. Environmental Sustainability in Container Transport: The Attitudes of Shippers and Forwarders. Int. J. Logist. Res. Appl. 2017, 20, 146–162. [Google Scholar] [CrossRef]
- Lafkihi, M.; Pan, S.; Ballot, E. Freight Transportation Service Procurement: A Literature Review and Future Research Opportunities in Omnichannel E-Commerce. Transp. Res. Part E Logist. Transp. Rev. 2019, 125, 348–365. [Google Scholar] [CrossRef]
- Roy, S.A.; Ali, S.M.; Kabir, G.; Enayet, R.; Suhi, S.A.; Haque, T.; Hasan, R. A Framework for stainable Supplier Selection with Transportation Criteria. Int. J. Sustain. Eng. 2020, 13, 77–92. [Google Scholar] [CrossRef]
- Govindan, K.; Rajendran, S.; Sarkis, J.; Murugesan, P. Multi Criteria Decision Making Approaches for Green Supplier Evaluation and Selection: A Literature Review. J. Clean. Prod. 2015, 98, 66–83. [Google Scholar] [CrossRef]
- Large, R.O.; Kramer, N.; Hartmann, R.K. Procurement of logistics services and sustainable development in Europe: Fields of activity and empirical results. J. Purch. Supply Manag. 2013, 19, 122–133. [Google Scholar] [CrossRef]
- Touratier-Muller, N.; Machat, K.; Jaussaud, J. Impact of French Governmental Policies to Reduce Freight Transportation CO2 Emissions on Small- and Medium-Sized Companies. J. Clean. Prod. 2019, 215, 721–729. [Google Scholar] [CrossRef]
- Fulzele, V.; Shankar, R. Performance Measurement of Sustainable Freight Transportation: A Consensus Model and FERA Approach. Ann. Oper. Res. 2021. [Google Scholar] [CrossRef]
- Anttonen, M.; Halme, M.; Houtbeckers, E.; Nurkka, J. The Other Side of Sustainable Innovation: Is There a Demand for Innovative Services? J. Clean. Prod. 2013, 45, 89–103. [Google Scholar] [CrossRef] [Green Version]
- Bitton, M. Méthode de Conception et D’implantation de Systèmes de Mesures de Performances Pour Organisations Industrielles. Ph.D. Thesis, Université de Bordeaux I, Bordeaux, France, 1990; 220p. [Google Scholar]
- Doumeingts, G.; Clave, F.; Ducq, Y. ECOGRAI—A method to design and to implement Performance Measurement Systems for industrial organizations—Concepts and application to the Maintenance function. In Benchmarking—Theory and Practice; Rolstadås, A., Ed.; IFIP Advances in Information and Communication Technology; Springer: Boston, MA, USA, 1995. [Google Scholar]
- Moad, K. Modélisation et Optimisation Multi-Niveaux du Transport Forestier. Master’s Thesis, Gestion et management, Université de Bordeaux, Bordeaux, France, 2016. [Google Scholar]
- Talbot, D. Les Stratégies Climatiques et les Pratiques de Légitimation des Grands Émetteurs Industriels: Une Approche Qualitative; Doctorat en sciences de l’administration; Université de Laval: Quebec City, QC, Canada, 2015. [Google Scholar]
- McKinnon, A.C.; Edwards, J. The role of government in promoting green logistics. In Green Logistics: Improving the Environmental Sustainability of Logistics, 3rd ed.; McKinnon, A.C., Cullinane, A., Whiteing, A., Browne, M., Eds.; Kogan Page: London, UK, 2015. [Google Scholar]
- Martinsen, U.; Huge-Brodin, M. Greening the offerings of logistics service providers. In Proceedings of the 22th Annual NOFOMA Conference: Logistics and Supply Chain Management, Kolding, Denmark, 10–11 June 2010; pp. 959–984. [Google Scholar]
- Martinsen, U.; Huge-Brodin, M. Environmental Practices as Offerings and Requirements on the Logistics Market. Logist. Res. 2014, 7, 115. [Google Scholar] [CrossRef] [Green Version]
- Sarkis, J. A Strategic Decision Framework for Green Supply Chain Management. J. Clean. Prod. 2003, 11, 397–409. [Google Scholar] [CrossRef]
- Litman, T. Developing Indicators for Sustainable and Livable Transport Planning; Victoria Transport Policy Institute: Victoria, BC, Canada, 2016. [Google Scholar]
- Touratier-Muller, N.; Andersson, D. Environmental Considerations When Purchasing Transport Services: A Comparison of Management Approaches between Swedish and French Shipper; Cross-Cultural Challenges in International Management; Routledge: New York, NY, USA, 2020; pp. 193–208. [Google Scholar]
- Caplice, C.; Sheffi, Y. A Review and Evaluation of Logistics Metrics. Int. J. Logist. Manag. 1994, 5, 11–28. [Google Scholar] [CrossRef]
- Dobranskyte-Niskota, A.; Perujo, A.; Pregl, M. Indicators to Assess Sustainability of Transport Activities Part 1: Review of the Existing Transport Sustainability Indicators Initiatives and Development of an Indicator Set to Assess Transport Sustainability Performance; OPOCE, European Commission, Joint Research Centre: Ispra, Italy, 2007. [Google Scholar]
- McIntyre, K.; Smith, H.; Henham, A.; Pretlove, J. Environmental Performance Indicators for Integrated Supply Chains: The Case of Xerox Ltd. Supply Chain Manag. Int. J. 1998, 3, 149–156. [Google Scholar] [CrossRef]
- McKinnon, A. Performance Measurement in Freight Transport: Its Contribution to the Design, Implementation and Monitoring of Public Policy; International Transport Forum: Queretaro, Mexico, 2015. [Google Scholar]
- Garcia, I.V.; Wang, K.; Babinsky, H. Aerodynamic shape optimization of double-deck trucks. In Proceedings of the Third International Conference in Numerical and Experimental Aerodynamics of Road Vehicles and Trains, Milan, Italy, 13–15 June 2018. [Google Scholar]
- McClelland, D.; McKinnon, A. Use of Vehicle Telematics Systems for the Collection of Key Performance Indicator Data in Road Freight Transport; Heriot-Watt University: Edinburgh, UK, 2004. [Google Scholar]
- Hirsch, P. Minimizing Empty Truck Loads in Round Timber Transport with Tabu Search Strategies. Int. J. Inf. Syst. Supply Chain Manag. (IJISSCM) 2011, 4, 15–41. [Google Scholar] [CrossRef] [Green Version]
- McKinnon, A. The Potential of Economic Incentives to Reduce CO2 Emissions from Goods Transport. In Proceedings of the 1st International Transport Forum on ‘Transport and Energy: The Challenge of Climate Change’, Leipzig, Germany, 28–30 May 2008. [Google Scholar]
- Peignier, I. Gestion des Risques Reliés au Transport de Matières Dangereuses au Québec: Un Outil d’aide à la Décision Pour le Choix des Transporteurs; Université de Montréal: Montréal, QC, Canada, 2010. [Google Scholar]
- Touratier-Muller, N. Le Rôle et la Responsabilité des “Achats de Transport” dans la Prise en Compte des Critères Environnementaux et des Émissions CO2 en France. Ph.D. Thesis, Université de Pau et des Pays de l’Adour (UPPA), Pau, France, 2018. [Google Scholar]
- Bachok, S.; Ponrahono, Z.; Osman, M.M.; Jaafar, S.; Ibrahim, M.; Mohamed, M. A preliminary Study of Sustainable Transport Indicators in Malaysia: The Case Study of Klang Valley Public Transportation. Procedia Environ. Sci. 2015, 28, 464–473. [Google Scholar] [CrossRef] [Green Version]
- Forinash, C. Sustainable Transportation Performance Measures; EPA Office of Sustainable Communities: Austin, TX, USA, 2011. [Google Scholar]
- Gnap, J.; Poliak, M.; Semanova, S. The Issue of a Transport Mode Choice from the Perspective of Enterprise Logistics. Open Eng. 2019, 9, 374–383. [Google Scholar] [CrossRef]
- Rostamzadeh, R.; Govindan, K.; Esmaeili, A.; Sabaghi, M. Application of fuzzy VIKOR for evaluation of green supply chain management practices. Ecol. Indic. 2015, 49, 188–203. [Google Scholar] [CrossRef]
- Weijers, S.; Glöckner, H.H.; Pieters, R. Logistic service providers and sustainable physical distribution. In Scientific Journal of Logistics Edition; HAN University of Applied Sciences: Arnhem, The Netherlands, 2012. [Google Scholar]
- Zegras, C. Sustainable Transportation Indicators and assessment methodologies. In Proceedings of the Biannual conference and Exhibit of the Clean Air Initiative for Latin American Cities, São Paulo, Brazil, 25–27 July 2006. [Google Scholar]
- Pinchasik, D.R.; Hovi, I.B.; Bø, E.; Mjøsund, C.S. Can Active Follow-Ups and Carrots Make Eco-Driving Stick? Findings from a Controlled Experiment among Truck Drivers in Norway. Energy Res. Soc. Sci. 2021, 75, 102007. [Google Scholar] [CrossRef]
- Kumar, A. Transition Management Theory-Based Policy Framework for Analyzing Environmentally Responsible Freight Transport Practices. J. Clean. Prod. 2021, 294, 126209. [Google Scholar] [CrossRef]
- Shah, N. Green Purchasing: The Issue of Responsible Supply Chain Management for Improving the Environmental Performance; HCS Consulting: Report written from a Master thesis; Illinois Institute of Technology: Chicago, IL, USA, 2010. [Google Scholar]
- Marino, C.; Monterosso, C.; Nucara, A.; Panzera, M.F. Analysis of the Reduction of Pollutant Emissions by the Vehicle Fleet of the City of Reggio Calabria Due to the Introduction of Ecological Vehicles. Sustainability 2020, 12, 2877. [Google Scholar] [CrossRef] [Green Version]
- Aronsson, H.; Huge Brodin, M. The Environmental Impact of Changing Logistics Structures. Int. J. Logist. Manag. 2006, 17, 394–415. [Google Scholar] [CrossRef]
- Wang, Y.; Boggio-Marzet, A. Evaluation of Eco-Driving Training for Fuel Efficiency and Emissions Reduction According to Road Type. Sustainability 2018, 10, 3891. [Google Scholar] [CrossRef] [Green Version]
- Eng-Larsson, F.; Kohn, C. Modal Shift for Greener Logistics—The Shipper’s Perspective. Int. J. Phys. Distrib. Logist. Manag. 2012, 42, 36–59. [Google Scholar] [CrossRef]
- Bonvoisin, F. Evaluation de la Performance des Blocs Opératoires: Du Modèle aux Indicateurs; Discipline: Automatique Spécialité: Automatique et Génie Informatique. Master’s Thesis, Université de Valenciennes et du Hainaut-Cambresis, Valenciennes, France, 2011. [Google Scholar]
- Robin, V.; Sperandio, S.; Blanc, S.; Girard, P. Interactions Modelling between Factors Influencing Management of Design System Evolution. In Proceedings of the 15th International Conference on Engineering Design, ICED 2005, Melbourne, Australia, 15–18 August 2005. [Google Scholar]
- Achhal, Y. Cadre Méthodologique Pour la Conception D’indicateurs de Performance de Développement Durable (Maîtrise en Génie Mécanique); Université de Laval: Quebec City, QC, Canada, 2013. [Google Scholar]
- Ducq, Y.; Vallespir, B. Definition and aggregation of a Performance Measurement System in three aeronautical workshops using the ECOGRAI Method. Int. J. Prod. Plan. Control 2005, 16, 163–177. [Google Scholar] [CrossRef]
- El Mahmedi, A.; Addouche, S.A.; Dafaoui, E.M. Identification des Relations Entre Inducteurs et Indicateurs de Performance des Processus D’entreprise; Conception et Production Intégrées: Casablanca, Morocco, 2005. [Google Scholar]
- Carmines, E.G.; McIver, J.P. Analyzing models with unobserved variables. In Social Measurement: Current Issues; Bohrnstedt, G.W., Borgatta, E.F., Eds.; Sage: Beverly Hills, CA, USA, 1981. [Google Scholar]
- Demeuse, M. Introduction aux Théories et aux Méthodes de la Mesure en Sciences Psychologiques et en Sciences de L’éducation; Licence en Sciences de L’éducation: Liège, Belgique, 2004. [Google Scholar]
- Symon, G.; Cassell, C. Qualitative Methods and Analysis in Organizational Research: A Practical Guide; SAGE: London, UK, 1998. [Google Scholar]
- Baumler, I.; Kotzab, H. Intelligent transportation system development, main influences and key technologies. In Proceedings of the Nofoma Conference, Lund, Sweden, 8–9 June 2017. [Google Scholar]

Publisher’s Note: MDPI stays neutral with regard to jurisdictional claims in published maps and institutional affiliations. |
© 2021 by the authors. Licensee MDPI, Basel, Switzerland. This article is an open access article distributed under the terms and conditions of the Creative Commons Attribution (CC BY) license (https://creativecommons.org/licenses/by/4.0/).