Article

Citizen Science and the Sustainable Development Goals in Low and Middle Income Country Cities

1
Stockholm Environment Institute, Department of Environment and Geography, University of York, York YO10 5DD, UK
2
Tallinn Centre, Stockholm Environment Institute, 10416 Tallinn, Estonia
3
Faculty of Biological and Environmental Sciences, University of Helsinki, 00014 Helsinki, Finland
*
Author to whom correspondence should be addressed.
Sustainability 2021, 13(17), 9534; https://doi.org/10.3390/su13179534
Submission received: 15 July 2021 / Revised: 11 August 2021 / Accepted: 18 August 2021 / Published: 24 August 2021

Abstract

:
Progress towards the United Nations’ Sustainable Development Goals (SDGs) is monitored using a set of targets and indicators. Gaps in official datasets have led to calls for the inclusion of data generated through citizen science (CS) and allied approaches. Co-benefits of CS mean these approaches could also contribute to localising, defining, and achieving the SDGs. However, mapping of current and potential contributions is needed, as well as an understanding of the challenges these approaches present. We undertake a semi-systematic review of past and current CS projects and assess them against dimensions of CS—spatial, temporal, thematic, process, and management—and their value for the SDGs set out by Fritz et al. in 2019, focusing on low and middle income country (LMIC) cities as key environments in the battle for sustainability. We conduct interviews with project leaders to further understand the challenges for CS in these contexts. We find opportunities for projects to monitor and achieve a wide range of goals, targets, and indicators. However, we find fewer projects in low income countries when compared with middle income countries. Challenges include balancing local needs with national monitoring requirements and a lack of long-term funding. Support is needed for LMICs to achieve the potential of CS.

1. Introduction

The 17 Sustainable Development Goals (SDGs), adopted by the United Nations (UN) Member States in 2015, are a call to action for all countries to work together to end poverty, improve health and education, reduce inequalities, and protect the environment by 2030 [1]. The SDGs have 169 targets and 231 unique indicators, which provide a framework for assessing and monitoring progress towards the goals. Gaps in data required to monitor SDG indicators, particularly in low and middle income countries (LMICs) [2], have led to calls to incorporate non-traditional forms of data, including those generated through citizen science (CS), into monitoring frameworks [3,4,5]. Potential co-benefits of CS for identifying problems [6], educating participants [7], developing partnerships [8] and bringing about change through influencing individual behaviour [9], local decision-making [10,11], and policy formation [12] have led to discussions about how CS could also play a role in defining, localising and implementing the SDGs [4]. In this paper, we seek to assess the extent to which this potential for CS to contribute to the SDGs is currently being achieved as well as challenges that exist in achieving this potential. Our review focuses on urban environments, as cities are considered to be where the battle for sustainability will be won or lost [13], and LMICs as these are where some of the biggest data deficits exist [2].

1.1. CS for Monitoring the SDGs

Reporting on SDG indicators is primarily done at a national level, typically by governments, using methods agreed on by indicator custodians [14]. SDG indicators are classed as Tier I: agreed methodology and good data coverage or Tier II: agreed methodology but lacking data (as of July 2020 there are no Tier III indicators i.e., those with no established methodology) [15]. While there may, therefore, be particular opportunities for CS to support Tier II indicator monitoring, established and commonly used data collection methods for Tier I indicators are also problematic, particularly in LMICs [16], and could also be supplemented by CS data. Traditional household surveys, for example, cover around 30% of SDG indicators [17] but are expensive, repeated infrequently [3], and often exclude the most vulnerable and ‘hard to reach’, in particular those living in informal settlements [18], of which there are an estimated 1 billion people globally [19]. Similarly, coverage of official environmental datasets is often poor, with 68% of environmental indicators lacking data [20]. CS could help to address these gaps as it can generate data on wide geographic scales, at fine spatial resolutions, and from locations that are otherwise inaccessible [21]; it can engage marginalised and hard-to-reach groups in monitoring, increasing their representation in datasets [22]. Furthermore, it can generate data over long time scales [23] and at fine temporal resolutions. National statistics are also prone to political manipulation [18], and CS has been suggested as a way to “check” official data sources [24]. While there are currently only a small number of examples of CS data being used in SDG monitoring (e.g., for marine litter), the feasibility of CS data to be used for tracking international indicators has already been demonstrated within biodiversity statistics such as the European Common Bird Index and Grassland butterfly Index [25] and the UK Biodiversity Indicators, which track progress towards the Aichi Biodiversity Targets [26].

1.2. CS for Localising and Defining the SDGs

While the focus of official SDG reporting is at the national level, there has also been a drive to ‘localise’ SDGs to cities and regions, “the process of taking into account subnational contexts in the achievement of the 2030 Agenda” [27]. Reporting at the national level risks masking the social and environmental inequalities that exist within countries and the nuance of local conditions [28]. Even complementing official national datasets with citizen-generated data can risk the exclusion of some groups or regions, often the digitally invisible who are also usually from poor and vulnerable communities [17,29]. Local monitoring can, therefore, help achieve the pledge of the UN Member States “to leave no one behind” [30] and CS projects, which often have a local focus, are well placed to contribute to this. Local monitoring adds richness and contextual information around SDG indicators [31] and can “empower communities to tell their own stories with regard to the SDGs” [28]. Well-designed co-created, or community-based, CS projects provide opportunities for citizens to bring issues of importance and concern to them to the fore [32], including citizens from disadvantaged communities in commonly under reported areas [31]. As well as monitoring existing indicators, therefore, CS can also be used to set agendas [33], potentially including identifying new national or locally relevant goals, targets, and/or indicators where gaps exist [4].

1.3. CS for Implementing the SDGs

CS also has co-benefits that can help to achieve sustainable development [34]. CS can further our understanding of environmental and social problems and, consequently, the development of solutions through scientific advances [35], technological developments [33], policy-making [12], and local action and decision-making [11,32]. CS also has ‘societal value’ [36] for the individuals and communities involved in projects. The need to engage citizens with the SDGs in order for them to be achieved has been recognised since their formation; Hajer et al. [37], for example, talk of the potential for citizens to be “agents of change” for sustainable development. CS has the potential to facilitate this, for example by educating participants about sustainability [38] and developing their skills [39], itself one of the SDG targets (4.7, ‘By 2030, ensure that all learners acquire the knowledge and skills needed to promote sustainable development…’). Engaging citizens in CS can also lead to behaviour change, for example, in the implementation of societal or technological innovations to address sustainability challenges [40]. CS can build communities [41] and give members of these communities the information and skills they need to campaign on issues of importance to them and challenge or influence decision-making [42]. Partnership working across countries and sectors is considered critical for achieving the SDGs, with a dedicated goal, SDG17: Partnerships for the goals. CS provides a way to bring different stakeholders together, including citizens, to build shared understanding and co-develop solutions to sustainability challenges that aim to meet everyone’s needs [43].

1.4. Urban Citizen Science in Low- and Middle-Income Countries

The need for CS to contribute to monitoring, localising, defining, and implementing the SDGs is particularly acute in urban environments in LMICs. More than half the world’s population live in urban areas, and this is projected to increase to two thirds by 2050 [44]. Unlike the Millennium Development Goals, the SDGs have a goal focussed on tackling sustainability in urban environments, SDG11, which aims “to make cities and human settlements inclusive, safe, resilient and sustainable”. This is in recognition that pressures placed on man-made and natural systems from rapidly growing populations undermine purported benefits of urbanization [45] but also that cities have the potential to be where critical successes for sustainability can be achieved [18,46]. The complex challenges confronting city development require the inclusion of a wide cross-section of residents in identifying problems and co-designing solutions to shape more sustainable future urban spaces and their governance. Without considering the needs of a wide range of voices, city planners risk identifying sub-optimal solutions that benefit a minority. CS can provide a means of facilitating inclusion and representative decision-making, and cities have been a focal point of innovation around the use of citizen-generated data to address sustainability challenges.

1.5. Aims of the Study

While there are clearly opportunities for the use of CS approaches to contribute to the SDGs in LMIC cities, this potential is as yet largely unrealised [29]. As outlined by Fraisl et al. [47], there is a lack of systematic evidence regarding where CS currently and could potentially contribute to the SDGs. In their roadmap for CS and the SDGs, Fritz et al. [3] call for mapping of CS projects against the SDG framework and building an inventory of good practice. Existing studies have mapped alignment of CS projects to indicators to explore contributions of CS to SDG monitoring [47] or have also considered contributions of CS to implementing the SDGs but at the levels of the goals [48]. More work is needed, therefore, to map the full range of contributions CS could make to the SDGs.
There is also a need to better understand the challenges that might be faced in using CS approaches in the context of the SDGs. While there has been some discussion of this, it has largely focussed on issues around data quality, standards, and interoperability [3,31]. While this is important, as these are seen as major barriers to the use of CS data in the policy sphere [25], a better understanding of additional challenges and how these could be overcome is also needed if the potential of CS is to be realised. Challenges unique to LMIC cities also need to be explored. While the “smart cities” concept, for example, aims to capitalise on the prevalence of smart phones, low cost sensors, social media, and other big data to monitor the city environment and inform urban management [18], challenges exist to these approaches, including data privacy and participant safety; data ownership and accessibility and thus who controls, interprets, and ultimately benefits from data [18,49]. Furthermore, the focus on the use of technologies risks the digital exclusion of vulnerable groups [50], which is likely to be particularly acute in LMICs. Other challenges to the use of CS in LMICs are poorly understood but may include lack of organisational capacity and awareness of CS, literacy of participants, and language barriers [51]. Specific cultural issues may also exist [5], as well as poor infrastructures in place to support civic engagement, and a lack of history of democratic practices [52].
In this paper, we use CS projects in LMIC cities identified from a semi-systematic review of the academic and grey literature, as well as interviews with CS project leaders in LMICs, to (1) map the current and potential scope for CS to contribute to monitoring, localising, defining and implementing the SDGs in LMIC cities; (2) identify challenges for the use of CS approaches in these contexts; (3) suggest ways forward to realise the potential of CS to support the SDGs. To do this, we first assess projects identified in our semi-systematic review of the literature against the features of CS that Fritz et al. [3] identified as being of value to the SDGs, covering spatial, temporal, thematic, process, and management dimensions of CS data. We expand this framework (as detailed in Table 1) to include values of these features of CS for defining, localising, and implementing the SDGs, as well as monitoring the SDGs as focused on by Fritz et al. [3]. We use this framework to quantitatively assess the extent to which these values are realised by the portfolio of CS projects we identified in our semi-systematic review, allowing us to identify those values of CS for the SDGs which are being or have the potential to be realised, and those for which challenges remain. We follow this up with qualitative analysis of resources identified in our semi-systematic review and interviews with project leaders to further explore the potential as well as challenges of fulfilling the potential of CS for the SDGs in LMIC cities.

2. Materials and Methods

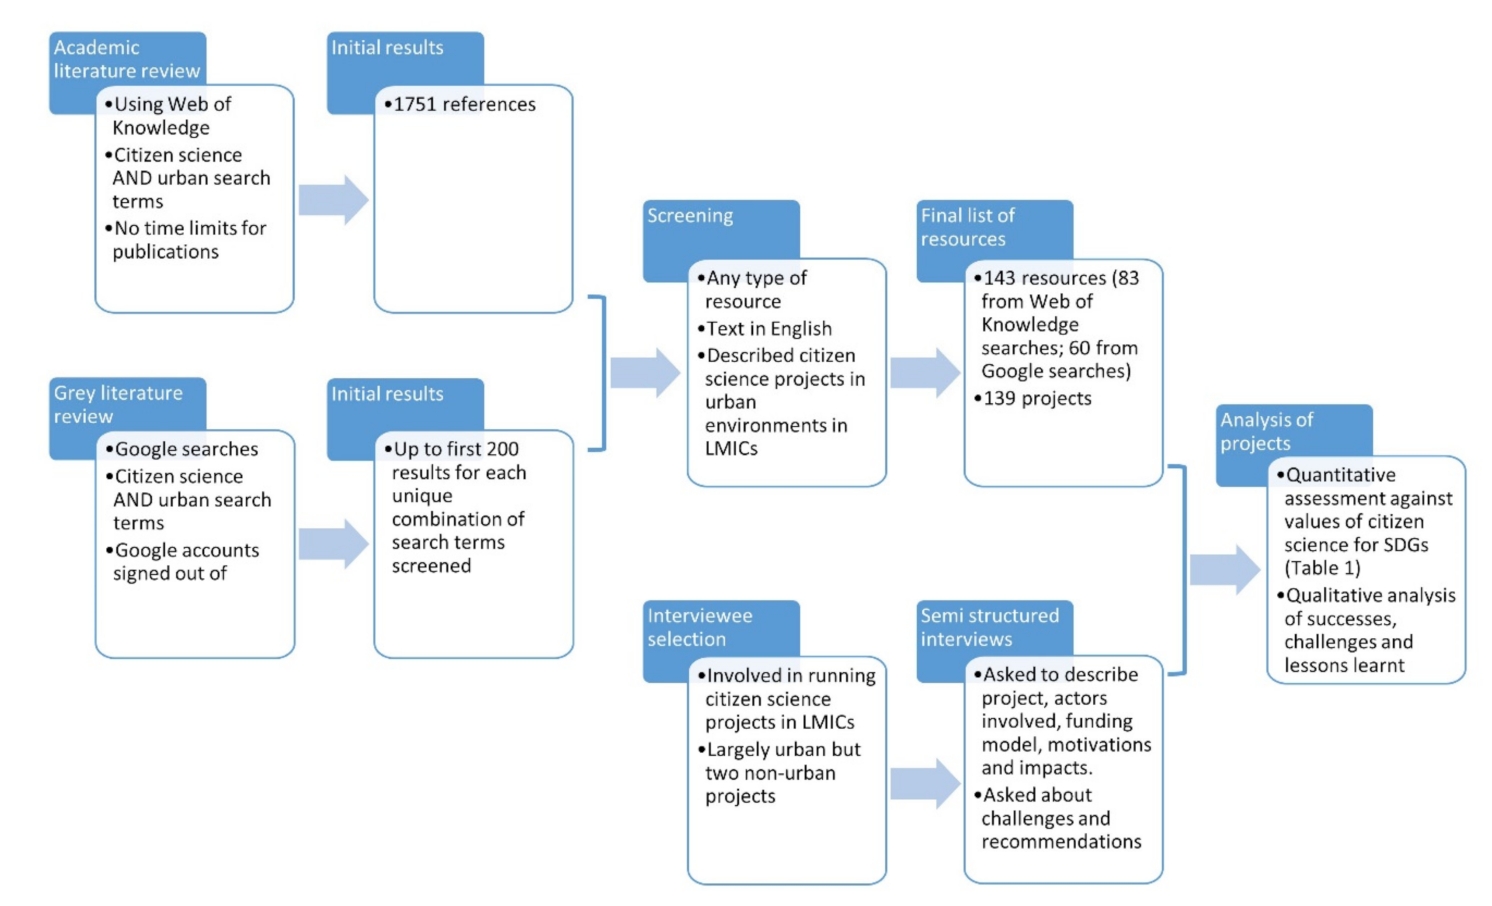
2.1. Semi-Systematic Review

Our semi-systematic review followed the principles of the PRISMA approach, which recommends steps for the collection and reporting of resources for systematic reviews [53,54]. We followed the recommended steps for the identification, screening and inclusion of resources, but only included resources were documented at each stage.

2.1.1. Identification

To identify resources, we searched the academic and grey (i.e., non-peer reviewed) literature as we aimed to include the full breadth of CS projects, some of which are likely to be described in outputs such as project reports rather than the academic literature. Web of Knowledge was used to search the academic literature from 2010 to 2018 (up to June 2018). While this period is largely prior to the adoption of the SDGs, our aim was not to identify only projects that aimed to contribute to this agenda, but instead to understand the state of play in citizen science in LMIC cities and identify from these opportunities and challenges for contributing to the SDGs.
To identify projects using CS and related approaches in urban environments, the search terms detailed in Table 2 were used. We deliberately used a broad range of search terms to capture the full spectrum of citizen science and allied approaches, recognizing that there are geographic and thematic variations in the terms used to describe citizen participation in data collection [29]. This resulted in an initial list of 1751 references. Searches of the grey literature were performed using Google. All google accounts were signed out of prior to searches being undertaken to avoid these affecting search algorithms. Each of the CS-related terms listed in Table 2 was searched for separately along with the word “urban”, which also captured resources including the word “city”. The first 200 results (sorted by most relevant first) for each search were then examined (some searches yielded fewer results than this).

2.1.2. Screening and Inclusion

For both the academic and grey literature, search results were screened and references were only included in the final analysis if the full text could be accessed and was written in English. We only included resources that discussed a specific project that had been launched or trailed in urban areas in LMICs. Data collection is a common factor in citizen science projects [55] and so we focused on projects where citizens were engaged in active (e.g., water sampling) or passive (e.g., using a mobile phone sensor) data collection, online data generation or processing and projects that used citizen generated data in a secondary analysis. We excluded projects where people were the subject of the research and not otherwise involved in the scientific process, such as household or online interviews or surveys [56]. We also excluded projects where data collection was not the primary aim, such as citizen design or participatory action research. We did, however, retain projects which involved the mining of citizen generated data, such as social media posts. While citizens are not actively involved in these projects, we felt it was useful to retain them to demonstrate the breadth of applications of citizen-generated data in the context of the SDGs.
This resulted in a final list of 143 resources from which information was extracted and analysed. Some resources detailed multiple projects and some projects were referred to in multiple resources and so, in total, we identified 139 projects. The PRISMA process flowchart can be seen below in Figure 1.

2.2. Assessment of Projects against the Values of CS for the SDGs

It was at the project level that data were analysed. We used the dimensions of CS for monitoring, localising, defining and implementing the SDGs (Table 1) as a basis for extracting information about projects. Table 1 (‘Information derived from resources’ column) shows the information we extracted from our resources to assess projects against each feature within these dimensions. For each feature, we categorised projects according to the categories shown in Table 1 (‘Categories’ column).
In the spatial dimension, we first assessed whether projects captured spatial information as this is important for monitoring, localising, and defining the SDGs. CS is said to be of value as it generates data at fine spatial resolutions so to examine this we looked at the scale of projects (neighbourhood, city, country, or global), as small-scale projects in particular are likely to generate dense coverage of data. This information also allowed us to examine the scale at which projects could contribute data (e.g., to local or national monitoring). We assessed geographic coverage (spatial extent is said to be a benefit of CS) by looking at the countries in which projects took place (projects were assigned to more than one country, if applicable) and also the spread across countries with different economic classifications (classifications were based on World Bank 2019 economies [57]; these are reviewed and updated annually). For the temporal dimension, which has implications for the value of CS to monitor and implement the SDGs, we looked at duration by examining whether projects had been trialed or were fully operationalised and, for the latter, the duration of the project (in weeks, months, or years). We also examined temporal resolution by looking at the frequency of data collection within projects.
In the thematic dimension, we first assessed the thematic breadth of projects by assessing which, if any, of the 17 SDGs projects fell within the scope of (projects could fall within multiple SDGs). We then assessed whether projects fell under the scope of any of the goals’ constituent targets. When considering whether a project was in the scope of targets, we considered the project in its current form as well as potential but as yet unrealised applications described in the resources. For example, a resource describing the potential for data, from a project to be used by decision makers to inform urban management, was assigned to target 11.3 “By 2030, enhance inclusive and sustainable urbanization and capacity for participatory, integrated and sustainable human settlement planning and management in all countries”, even if this was not implemented in the life time of the project. We then examined whether projects fell under the scope of any of the SDG indicators. Here, we assessed whether projects had the potential to contribute towards monitoring indicators; for example, if projects measured particulate matter they were considered to be under the scope of indicator 11.6.2, ‘Annual mean levels of fine particulate matter (e.g., PM2.5 and PM10) in cities (population weighted)’ regardless of the specific methods used. For these projects, we counted the number of Tier I and II indicators where we identified opportunities (we used the July 2020 version of the SDG indicators and classifications, including provisional categorisations, where applicable [15]). We also examined whether projects had the potential to help make progress on indicators. For example, in the context of indicator 1.4.1, ‘Proportion of population living in households with access to basic services’, we included projects which sought to improve access to basic services without seeking to directly monitor it. For goals, targets, and indicators, projects were assigned to as many as were relevant. Finally, we examined thematic resolution by assessing whether projects contributed to SDG targets but not any of their constituent indicators, and goals but not any of their constituent targets. This gave an indication of gaps in the existing SDG framework and the potential for CS to identify new targets and indicators.
In the process dimension, the driver, data collection, and data processing features relate to whether projects are bottom-up, community-driven and hence likely to be aligned to community interests and draw on local priorities; or top-down, science-driven projects which are likely to have stricter data collection methods and hence be more easily replicated or joined together for monitoring purposes. To assess this, we categorised projects according to the stages of the scientific process citizens were involved with (project design, data collection, data processing, using results, other). We considered those including citizens in research design more likely to be bottom-up projects. Some secondary outcomes of CS, such as changes to participants’ behaviour, are more likely to come where citizens have active and in-depth engagement. Under the cognitive attention feature, therefore, we looked at the duration of citizen involvement, the type of data generation (data mined; secondary use of data; mobile sensor data; active data collection by participants) and whether they had training in data collection methods to assess the depth of engagement. Finally, for the data management dimension, we looked for evidence that data management adhered to FAIR (findable, accessible, interoperable, reusable) principles. Adherence to these principles is likely to facilitate the use of data in SDG monitoring.
For each feature, we summed the number of projects in each of the categories described above. Not all information was available for each feature of each project and, for some features, projects could be assigned to multiple categories. As such, results for each feature do not always sum to the total number of projects (139).

2.3. Opportunities and Challenges for CS in LMIC Cities

Three key elements of project delivery—data collection, citizen engagement, and project impacts—were explored for CS projects in LMICs to add insights and identify possible solutions to the opportunities and challenges identified in the analysis described in Section 2.2. This was done, firstly, by extracting relevant information from the resources in the systematic review and, secondly, through a series of semi-structured interviews with CS project leaders. Interviewees were identified through (1) a representative of FreshWater Watch (FWW) UK, which coordinates water quality projects globally, who provided contacts related to ongoing or past projects; (2) projects identified in the systematic review; (3) projects undertaken by the organization the authors work for, the Stockholm Environment Institute, a global sustainability think tank. This resulted in nine interviews; seven were focused on urban projects, with two non-urban included to extend insights into doing CS in LMICs. Due to the limited number of interviews, the results are not generalisable, but provide insights into the running of CS projects and their outcomes, as a complement to the literature review.
Interviews were conducted during March–May 2019 via online teleconferencing facilities and lasted around 60 min. Two of the respondents preferred to answer questions in written form. Interviewees were asked to describe their project and its focus, the actors involved, the funding model, motivations, impacts, and challenges, as well as recommendations (see Supplementary Materials for details of questions asked). The responses were analysed according to these themes, highlighting recurring issues, and notable insights. The notes were sent back to the interviewee for comments and corrections and those who requested were also able to comment on the draft manuscript prior to submission.

3. Results

Results from the semi-systematic review and interviews are presented below. Where specific projects are referred to we give the project number (e.g., P1), which can be found in the full list of projects in the Table S1 in the Supplementary Materials. Project numbers do not always add up to 139 due to a lack of information about the features of some projects.

3.1. Assessment of Projects against the Values of CS for the SDGs

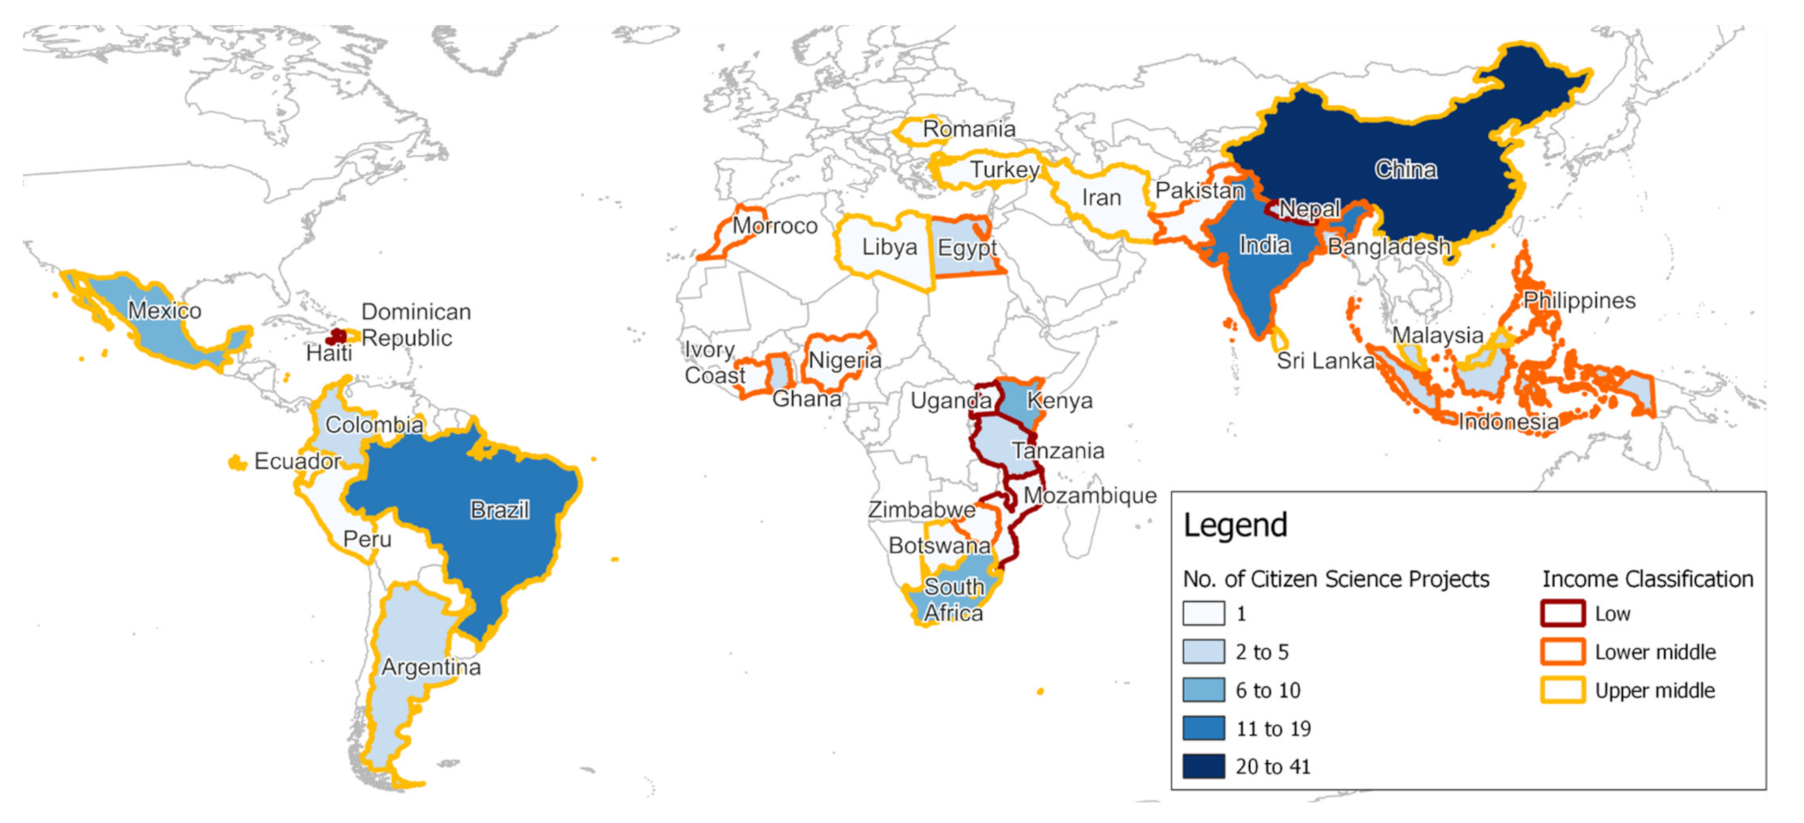
3.1.1. Geographic Dimension

The 139 projects we identified in the semi-systematic review all gathered or analysed citizen-generated data with an associated spatial reference. Of these, 29 took place at a district or neighbourhood scale, 57 were at a city scale, 30 at a national scale, and 23 were global. Projects took place across 34 countries (Figure 2). China had the most projects (42), followed by Brazil with 19, India with 16, and Mexico with 10. There were 18 countries with only 1 project. Most projects took place in upper middle-income countries (96 projects), followed by lower middle-income countries (39 projects), and low-income countries (11 projects). We identified projects in 17 (28%) of the 60 upper middle-income countries globally, 12 (26%) of the 47 lower middle-income countries and 5 (16%) of the 31 low-income countries.

3.1.2. Temporal Dimension

Of the projects we identified, 69 were trials or testing of methodologies and 70 were fully operational projects. Of those that had been operationalised, data on project duration was available for 26 projects and ranged from 10 days to over 8 years, with an average of 36.4 months. In seven cases, data collection was done in regular weekly, monthly, or annual cycles; for the remainder, data collection was continuous or information was not available.

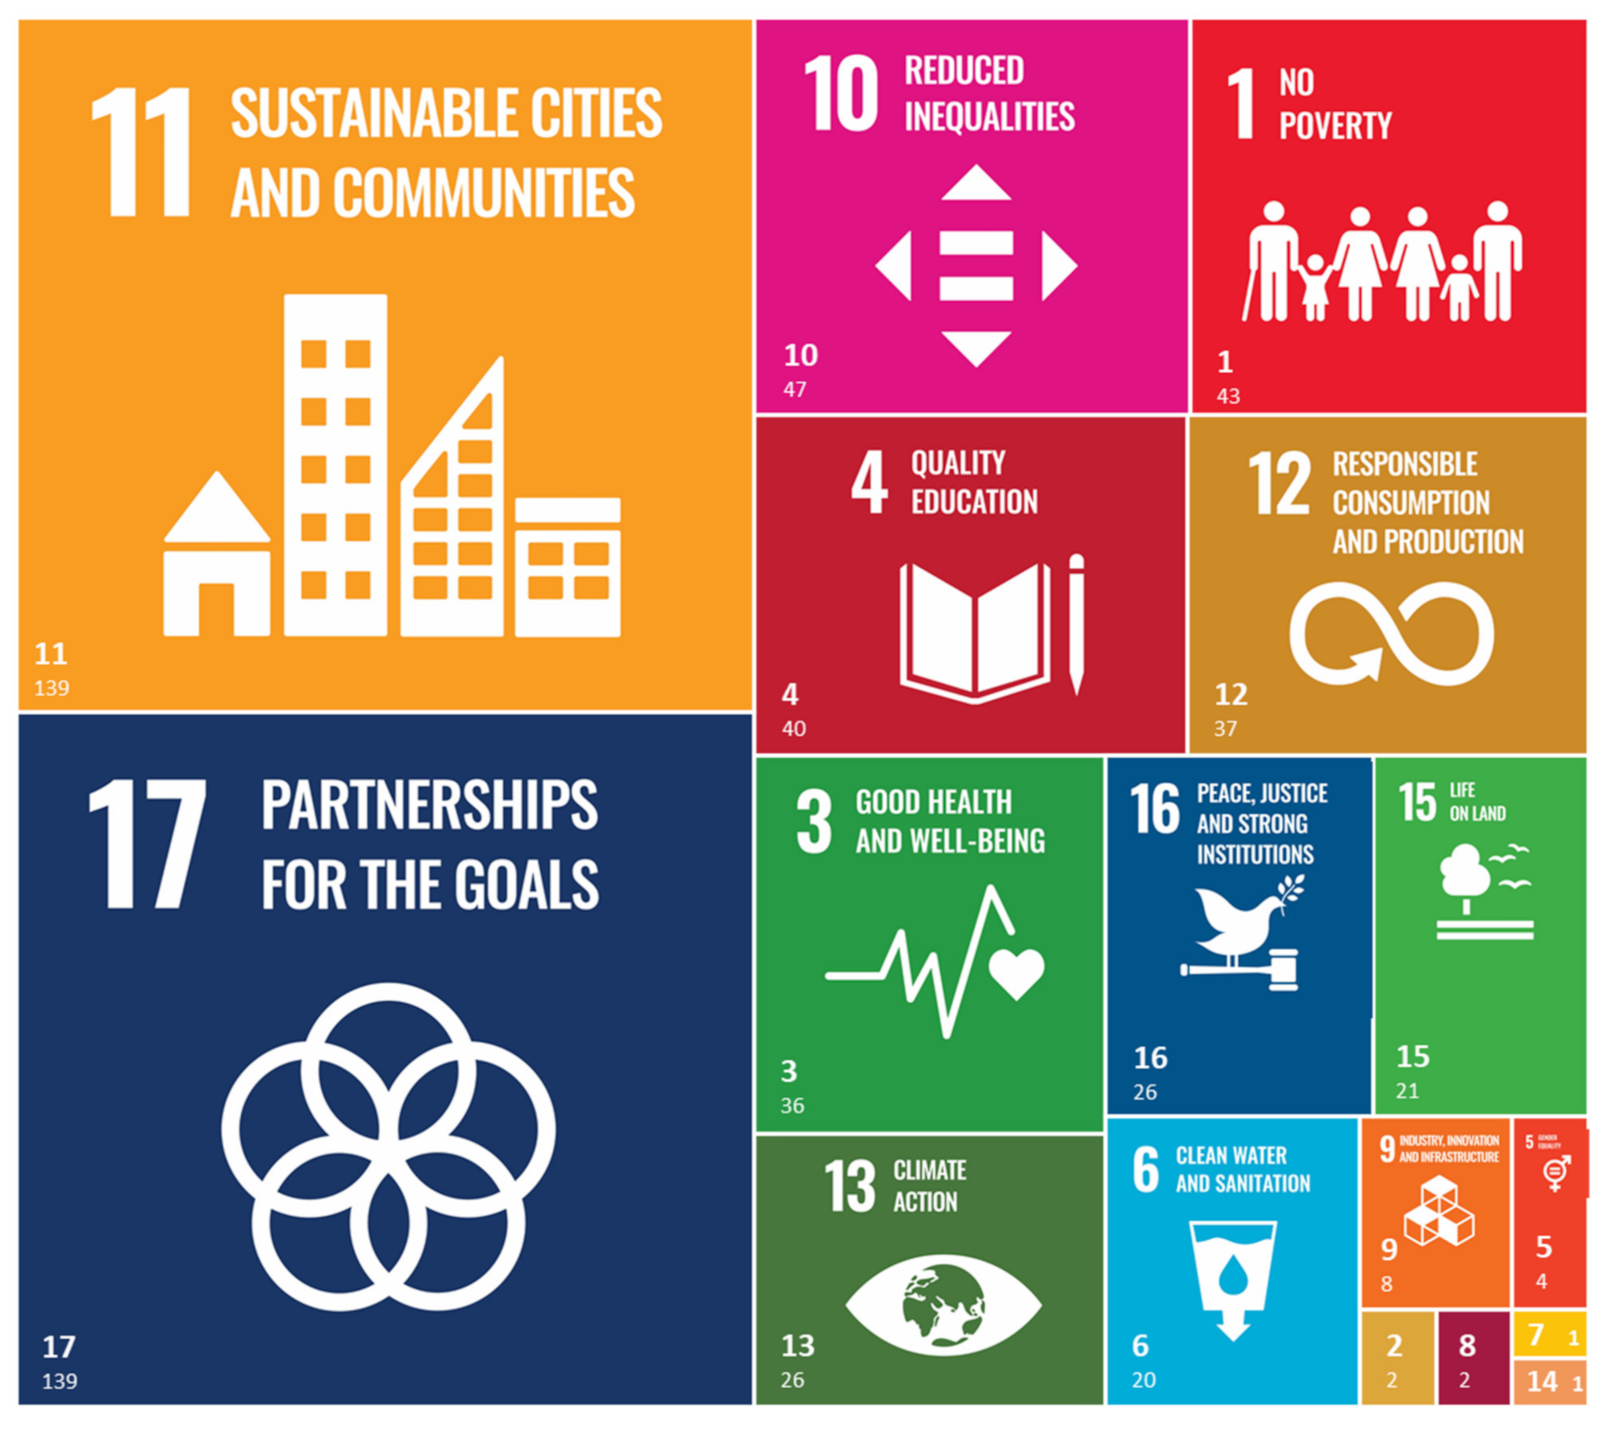
3.1.3. Thematic Dimension

We found alignment of projects with all 17 goals (Figure 3) and with 59 (35%) of their constituent targets (Figure 4a). We found more limited alignment with indicators compared with targets, suggesting that projects covered a wider range of issues than those included in the framework of the SDGs. We found opportunities for contributions to monitoring 8 Tier I and 12 Tier II indicators (Figure 4b). We found more scope for projects to contribute to making progress towards indicators, with 46 indicators identified where projects are or could potentially make contributions (Figure 4c).
All projects fell within the scope of SDG 11 and, within this goal, several projects fell within the scope of target 11.1 (adequate housing and basic services), many of which also fell within target 1.4 (equal access to resources and services). These included projects focused on community mapping of informal settlements and projects which provided platforms for residents to report problems, some of which allowed residents to report anything they perceived to be a problem, whereas others were specific to topics such as access to water and sanitation (under SDG 6), safety (under SDGs 5 and 16), and health services (under SDG 3). For both types of project, we saw opportunities for projects to contribute to monitoring indicators such as 1.4.1 (proportion of population with access to basic services) and 6.1.1 (proportion of population using safely managed drinking water). As well as community mapping projects, we also found many projects which aimed to use citizen generated-data to provide fine scale and up-to-date maps of urban areas. Both types of mapping project had the potential to monitor several indicators related to land use: 6.6.1 (change in extent of water-related ecosystems), 11.3.1 (ratio of land consumption to population growth rate), 11.7.1 (average share of cities that is open space), and 15.1.1 (forest area as proportion of total land area).
Transport was also a major theme in the projects we identified. Most of these projects used mobile sensors or mined data (e.g., from travel cards) to predict efficient routes for drivers, related target 12.2 (sustainable management and efficient use of natural resources); improve public transport systems, related to target 11.2 (access to safe, affordable, and sustainable transport systems for all); or map the quality of roads, related to target 9.1 (quality, reliable, sustainable, and resilient infrastructure). While we found some scope for projects to help make progress on indicator 11.2.1 (proportion of population with convenient access to public transport), we found limited scope for these projects to contribute to indicator monitoring. Another common topic was air pollution, falling under the scope of targets 11.6 (reduce environmental impact of cities) and 3.9 (reduce deaths and illnesses from pollution). In many cases, these projects collected data on particulate matter (PM) pollution using low cost sensors and so fell within the scope of monitoring indicator 11.6.2 (annual means of fine particulate matter). Many of these projects ultimately aimed to reduce exposure to air pollution and so could help make progress on indicator 3.9.1 (mortality rate attributed to air pollution).
Other types of pollution were also a common focus of projects, including light and noise pollution, as well as waste management. Several projects related to water pollution, again falling under the scope of target 3.9 but also several of the targets in SDG 6, including 6.1 (safe and affordable drinking water for all) and 6.3 (improve water quality by reducing pollution), as well as 12.4 (environmentally sound management of chemicals and wastes). Again, we found scope for these projects to help make progress on several indicators (e.g., 6.1.1) as well as potential for contributing to monitoring indicator 6.3.2 (proportion of water bodies with good ambient water quality).
Several projects fell under the scope of target 11.4 (strengthen efforts to protect cultural and natural heritage). These primarily related to biodiversity conservation and so also aligned with SDG 15, as well as one examining coastal ecosystems which fell under the scope of SDG 14. Projects fell under the scope of targets 15.5 (reduce degradation of natural habitats, halt the loss of biodiversity) and 15.9 (integrate biodiversity values into national and local planning) as well as other specific targets related to poaching (15.7) and invasive species (15.8). We found limited opportunities for monitoring indicators under SDG 15, except for 15.1.1, as outlined above.
A suite of projects focused on reducing the impact of disasters, either through improved disaster planning or response. Depending on their specific focus, these projects fell within the scope of targets 11.5 (reduce numbers of deaths and people affected by disasters), 11.b (plans and policies towards resilience to disasters), 1.5 (resilience of the poor and vulnerable to disasters), and 13.1 (strengthen resilience and adaptive capacity to disasters). Some of these could help make progress on indicators 1.5.1, 11.5.1, and 13.1.2 (deaths, missing persons, and persons affected by disaster), 1.5.3, 11.b.2, and 13.1.1 (countries with national and local disaster risk reduction strategies) and 1.5.2 and 11.5.2 (economic loss, damage to critical infrastructure and disruptions to basic services attributed to disasters).
The analysis also identified alignment with goals, targets, and indicators that might be considered co-benefits of CS projects. The target with the most number of projects in its scope was 11.3 (participatory, integrated, and sustainable human settlement planning and management). This reflects the large number of projects which included an ambition or the scope to use citizen collected data to inform participatory and sustainable urban planning. Similarly, projects falling in the scope of target 10.2 (empower and promote the social, economic, and political inclusion of all), 16.6 (effective, accountable, and transparent institutions), and 16.7 (responsive, inclusive, participatory, and representative decision-making) include those that aim to facilitate public engagement and representation in decision-making and to hold decision-makers to account. Some of these projects could also help to make progress on indicators 16.6.2 (proportion of population satisfied with last experience of public services) and 16.7.2 (proportion of population who believe decision-making is inclusive and responsive). Other opportunities for co-benefits were identified within SDG 4, including projects which fell under the scope of target 4.4 (number of youth and adults with skills for employment), 4.7 (knowledge and skills to promote sustainable development), and 12.8 (information and awareness for sustainable development). Projects could also help make progress on indicators 4.7.1 and 12.8.1 (extent to which global citizenship education and education for sustainable development are mainstreamed). Finally, all projects fell under the scope of SDG 17 which aims to ‘Strengthen the means of implementation and revitalize the global partnership for sustainable development’. Projects contribute to this goal through partnership development, data collection for monitoring, and/or because action achieved as part of projects could contribute to achieving the SDGs.

3.1.4. Process Dimension

No projects reported that they were specifically setting out to collect data to contribute to SDG monitoring, although a small number (4) mentioned the SDGs as motivators. In 77 cases, citizens were involved in the active collection of data, in 30 cases data collection was via sensors, in 12 projects citizens were involved in the online processing of data, 33 projects involved mining citizen generated data (such as social media data), and 14 projects involved the secondary use of citizen generated data, for example, from OpenStreetMaps. Single projects often used multiple sources of data collected in different ways. Where participants were engaged in active data generation (including via the use of sensors and online processing of data), they had long term involvement in 9 projects, short term involvement in 16 projects, and in the remainder, involvement was sporadic or the information was not available. In 10 of the 139 projects we examined, citizens were also included in the research or project design; 11 in data processing (including verification, analysis, and interpretation of data); 20 projects included citizens in the use of results (including dissemination, advocacy, the development of solutions to problems, and practical action); 6 in other activities, such as training other volunteers. In 29 projects, training of participants was discussed.

3.1.5. Data Management Dimension

We found limited discussion of FAIR principles in the resources we examined. Resources included some description of the data collected and/or methods used to process data for 106 projects. However, the detail provided varied greatly, from a brief overview of methods to full metadata. A total of 52 projects used online platforms whereby participants (and others) could view data that had been uploaded, either creating new platforms specifically for the project or making use of existing platforms such as Ushahidi, Google Map Maker, or Open Street Maps. However, in most cases, raw data could not be downloaded from these platforms. While in a small number of cases (13 projects) data were made available freely online or it was stated that data were publicly available, how this was implemented was variable; in some cases full metadata were available, whereas in others, only the locations of points, and none of the associated attributes, were available. In some cases, data were only shared with particular stakeholders, and in others, it was made explicit that data would not be shared more widely in order to protect those who had submitted it, for example, in the case of raising safety concerns (e.g., P40).

3.2. Opportunities and Challenges for CS in LMIC Cities

3.2.1. Data Generation

Several benefits of collecting or using citizen generated-data were identified by projects in the semi-systematic review. These included fine spatial resolution of data (P64), including for land use maps (P45), which could be used to complement or update official datasets (P1); fine temporal resolution, real time, or up-to-date information, which was considered particularly important for projects in rapidly changing urban environments (P6) or those responding to disasters or emergencies (P13). Cost savings (P33), the ability to gather data from hard to reach groups (P83), understanding citizens’ perspectives (P44) and emotions (P57), and bringing other voices to the fore (P5) were also discussed as advantages of using citizen-generated data.
In some cases, citizen-generated data were described as being of better quality than official datasets (P6). However, data quality was highlighted as a challenge in others (P15) and in some cases (P42) data were not collected in a way that could then be used by researchers. In the interviews, a project leader remarked that, even though data were successfully collected, the quality or validity was questionable for scientific purposes. Despite training, the volunteers could not avoid experimental errors, so the data collection methodology was changed and staff began to supervise sampling (Interview 2, 2019). Another project leader noted that citizen scientists with lower education levels may not understand why data must be collected in a certain way (Interview 8, 2019), and another said volunteers may need more detailed explanation or closer monitoring to avoid contamination of water samples (Interview 3, 2019).
One interviewee highlighted the tension between maintaining data quality standards, including through training and external oversight, and ensuring communities are given ownership of projects. In this case, they have structured their processes to be reiterative and circular so that those involved can learn these best practices by participating in them (Interview 9, 2019). Another method for addressing data challenges identified in Interview 6 was to co-create the methodology and field guide with participants. Illiteracy issues were overcome using pictures and checkmarks, which were easy for everyone to use, and women and their children were able do data collection together. It was recognised, however, that this requires significant investment of time. Several methods to improve data quality were also identified in projects in the systematic review. Crowdsourcing type projects, for example, encouraged the use of photos and videos for data verification (P13), required logins to discourage false data being submitted (P123), and had up/down voting functions (P123). Other projects provided training, had regular visits from project teams to support citizens doing data collection (P90), or provided online training videos (P42).
Other challenges related to spatial and temporal variation in the quality and volume of data collected (P39), as well as between participants from different demographic groups (P3), raising concerns about the representativeness of data. Many projects found benefits in combining multiple datasets to overcome deficiencies in individual datasets (P60); for example, active data collection could help overcome digital invisibility of some groups in social media data.
Data collection in LMICs was also complicated by unreliable internet connection and a lack of equipment or laboratories for processing samples (P90). While mobile and smart phones were recognised as being increasingly widespread, they are still not universally available, and even those who do own them may not have data plans (P59). Several projects sought to take smart city principles and adapt them for the context, for example, allowing people to submit data via SMS (P96) or a voice message (P40).

3.2.2. Engaging Participants

A strong theme emerged from the semi-systematic review and interviews around challenges and lessons learnt for engaging participants in projects in LMICs. To overcome this, crowdsourcing type projects used strategies, such as recruiting using a variety of methods to reach diverse audiences and allowing data submission via a range of platforms to suit different groups (P55). For community-based projects identified in the systematic review, several resources highlighted that adequate investment in time and personnel is required to engage local communities with projects. This included taking the time to understand the local culture and to build trust (P102), together with being sensitive to the community’s experiences (P100). It was considered important to understand the motivations of potential participants, which included knowing results were being used at a local level (P123), helping others (P13) and intrinsic motivations (P40).
In interviews, project leaders recognised the importance of co-designing methods and materials with participants to ensure they are appropriate for their circumstances, including aligning scientific aims or broader goals with community priorities. For example, an interviewee noted that CS requires an investment of resources to getting people interested, especially when working with poor people. Co-creation of methodologies that people can undertake as a part of their daily activities helps avoid overburdening participants. Additionally, if participants are not compensated financially for participating, it is important to ensure that it somehow benefits them (Interview 6, 2019).
Being honest with participants and setting expectations was also considered important. One interviewee highlighted that it was important to be cognizant of what is being offered to participants and making this clear at the start of the project, especially in low-income or slum areas. Participants might expect that when researchers focus on a specific issue in an area, their combined efforts will result in a large change, e.g., a polluting industry will be moved away. However, sometimes the researched issue is not even taken up by the local government for follow up. Researchers need to be clear with participants about the expected impacts, as well as accept that people may not want to participate in a project that they feel will not result in a concrete change for them (Interview 8, 2019).
Many projects which were initiated by researchers from outside the local area emphasised the value of building a team including local stakeholders. This included local universities as well as non-governmental and civil society organisations and community leaders. For example, it was seen as important to find the right local partner to “unlock community involvement”, so that project leaders are not seen as an external actor going in and telling them what to do (Interview 1, 2019).
Exclusion of some groups was also highlighted as an issue. In some cases, projects were not able to reach the intended target groups, potentially with unintended consequences. Transparent Chennai (P131), for example, was developed as a digital platform to record problems and give residents, especially the poor, a voice in city planning. However, they state that “Transparent Chennai is still limited as a tool of empowerment. It is obviously a shared tool between IT experts and NGOs oriented to a segment of the web-connected middle class more than the ordinary or poor citizen. Its potential for inclusion, sharing expertise and monitoring can, under certain conditions, become a strategy of control. It can, for instance, serve to reinforce the local Residents Welfare Associations in their actions to control the quality and value of their area by excluding the poor”.
Interviewees also commented on the challenges of involving specific groups. For example, a project leader noted that their organisation tries to work with the very bottom quintile, many of whom cannot read or write. While digitization is supposed to increase access and inclusion and has brought youth, who do have such skills, into their work, some participants initially feel that they cannot be part of such a process due to their “lack of skills” (Interview 9, 2019). Another interviewee highlighted the challenge of involving women due to their many responsibilities and high workload, including domestic work, caring for the children, and feeding the family. Their strategy was to co-create methods which could be performed alongside that workload (Interview 6, 2019).
The challenge of retaining participants within a project was also raised. In more contributory or crowdsourcing style projects, issues were raised such as striking the balance between simplicity to encourage participation and getting the required data (P3). In community-based projects, regular feedback, and engagement with participants was regarded as important for maintaining engagement (P1). In particular, showing participants that the data they have collected are being used in decision-making or action (P1) was considered important. Several project leaders identified a decline in participant interest, despite initial enthusiasm. For example, one project leader attributed it to the fact that volunteers had to build their own sample collectors, activities were performed outside of work hours and required travel to sampling locations and sample ecosystems were often located in degraded or otherwise unpleasant areas (Interview 5, 2019).

3.2.3. Project Impacts

Projects in the systematic review described impacts on participants, including increased knowledge and skills (P1); behaviour change (P92); increased awareness of their local urban environment (P78); increased understanding of processes and rights; empowerment to develop solutions (P138), take action (P76), advocate for their rights (P132) or hold service providers to account (P96). Participants were also “given a voice” by building engagement between citizens and decision makers (P94), including marginalised groups such as the disabled (P127) or those living in informal settlements (P129). In some cases, data were used immediately, for example, to assist in disaster response (P53).
Challenges were, however, raised in achieving action through projects. For example, one interviewee described obstacles in getting authorities to validate data and respond to problems it identified in a timely way (Interview 3, 2019). Identifying the correct channels of engagement for action and getting buy in from these partners at the beginning of the project was considered crucial. Another interviewee, for example, recognised that they did not involve the correct organisations in their project; local authorities were external to the project and thus it was challenging to impact local policies (Interview 7, 2019). There were also projects with strong engagement with authorities that resulted in action but short cycles of funding or single funders pulling out made having a continuous programme of work, and hence achieving impacts, challenging (P89).

4. Discussion

This study has highlighted the potential for CS to contribute to monitoring, localizing, defining and achieving the SDGs in urban environments in LMICs. Here we discuss some of the key opportunities and challenges we have uncovered and make some recommendations for future directions. When interpreting the results of the review, limitations of the systematic review methodology should be noted. Some projects may not have been found using our search methodologies, for example because they were not covered by our search terms or because reports were not written in English or made publicly available. This may be particularly true for local projects where the data and results are considered to be locally owned and relevant and there is no need to disseminate findings more broadly. Furthermore, interpretations should be made in the context of urban projects in LMICs. Gaps in geographic contexts or SDG targets and indicators do not necessarily mean these gaps exist across CS as a whole. For example, during our searches, we found projects related to election monitoring (e.g., [58]) which would fall under the scope of SDG 16 and reporting on maternal health services in Nigeria via SMS [59], which would fall under the scope of SDGs 3 and 5 but were not included in our study because they were not specifically related to urban areas. Finally, our searches of the grey and academic literature were conducted in June 2018, so we will have missed more recent projects which may, for example, aim to be more aligned with SDG monitoring.

4.1. Opportunities and Challenges for Citizen Science and the SDGs

4.1.1. Geographic Dimension

CS projects are collecting data with spatial references, demonstrating their potential to contribute to monitoring, localizing, and defining SDGs (Table 2). The large number of district- and city-scale projects we identified demonstrates opportunities for CS to contribute to in-depth local monitoring, as well as defining SDGs through identifying local issues, and implementing SDGs through local action. Projects taking place nationally or globally demonstrate the ability for CS data to be collected using common methods across wide geographic scales, including across multiple countries, and so the potential for CS to contribute to international monitoring where common methodologies are needed. Projects across all scales recognised the value of using CS for generating data at spatial scales and resolutions that would not otherwise be possible, confirming the potential for CS to fill data gaps in the SDGs [3].
However, the global spread of projects was uneven. The small number of projects we found in low income countries demonstrates the current limited potential for CS to make contributions in these countries. China alone, an upper middle income country, had nearly four times as any projects as all low income countries combined. The vast majority of these used mobile sensors to collect data or mined citizen-generated data from social media or other sources, reflecting the observation that big data have become a hotspot of Chinese urban research [60]. Expanding middle classes in emerging economies are also likely to have good access to technologies [29,61], perhaps reflecting the relatively large numbers of projects we also found in Mexico, Brazil, and India. This raises concerns, however, over the representativeness of data collected in these countries, as they are less likely to be inclusive of the poor and marginalised [50] and several projects in the review highlighted issues around spatial and demographic variation in data availability. Similar to critiques of smart cities [18], the reliance on this type of CS may mean that projects are not supporting the implementation of e.g., SDG 16.7.2 ‘Proportion of population who believe decision-making is inclusive and responsive by sex, age, disability, and population group’. Several projects, including some in low income countries, demonstrated the ability to crowdsource information (e.g., on water and health services, safety, and waste collections) from citizens using relatively “low tech” and so more accessible methods, such as text or voice messages. However, representativeness of data was highlighted as an issue even in community-based projects in both the systematic review and interviews, for example, due to challenges with engaging particular groups. Thus, while CS may, in some cases, be more inclusive and representative than official datasets, it is not without its challenges in this regard, and CS leaders (as well as city authorities interested in using these data) need to work hard to utilize methods that enable the poorest or excluded to participate more equitably to address urban data gaps and inform city planning.

4.1.2. Temporal Dimension

The majority of projects we identified collected data on a continual basis, again confirming the potential for CS to add detail to official monitoring programmes, which often take place only every few years [3], and to generate up-to-date data, which is critical in fast-changing environments typical of LMIC cities [62]. However, over half of the projects we identified were only at the trial or testing stage and others were only run in the short term. This was sometimes intentional to collect a ‘snap shot’ of data or because they were in response to a specific event such as a disaster. In other cases, however, projects failed to maintain data collection in the long term due to challenges with funding, which has been identified as a critical success factor in previous surveys of CS projects [63]. This is a major barrier for the use of CS in both monitoring and implementing the SDGs. Several of the projects and interviews emphasised the resources and time needed to properly engage with stakeholders and participants, particularly marginalised groups, in order to develop a successful project, further highlighting the need to adequately fund projects. Lack of funding can also limit the ability to scale up local projects, as noted in relation to an urban mapping project in Sao Paulo, Brazil (P130) which stated, “The question is how to scale up and maintain these efforts at the city level. The scarcity of such cases might be well connected to limited resources, NGO experiences and institutional gaps in making it possible to have a continuous program over some years”. Further work is needed to understand how CS can be adequately funded in LMICs, including current funders, barriers to long term funding, and how these can be overcome.

4.1.3. Thematic Dimension

We found projects within the scope of all 17 SDGs, demonstrating the thematic breadth of CS approaches suggested by Fritz et al. [3]. We found clear alignment with urban environments (SDG11) and their challenges, such as various forms of pollution and waste management (SDGs 3, 6, 11, and 12), safety (SDGs 3, 5, 11, and 16), and access to services (SDGs 1, 3, 5, 6, 11, and 16). These findings are broadly in line with those of Fraisl et al. [47], who looked for CS projects that are currently or could potentially contribute data to indicator monitoring and found particular opportunities for indicators related to environmental health and quality of life under SDGs 6, 11, and 15. This also echoes findings from our interviews and systematic review which showed that, where there is active citizen engagement, people are motivated to take part in projects of direct relevance to their lives and local environments, as well as the observation by Pocock et al. [29] that people in LMICs are more likely to take part in projects that relate to their livelihoods. Like Fraisl et al. [47], however, we also found gaps in some themes related quality of life, such as an almost complete absence of projects under SDG 2. This may be due to ethical issues related to asking people to collect data around sensitive topics such as hunger, particularly people living in poverty, as highlighted in our interviews. Another gap was SDG 7, which has been identified elsewhere as an area where there has been relatively little use of CS approaches [64]. Further work is required to assess whether it is useful or desirable for CS approaches to contribute in these areas, what the barriers are, and how they can be overcome.
Further work is needed to explore exactly where CS can have the most “added value”; this could be on issues that are somewhat subjective, such as feeling safe (16.1.4) or having convenient access to transport (11.2.1), which are difficult to measure using traditional methods. It may, however, be desirable for limited resources to be invested in consolidating progress where strong potential for the use of CS approaches has been identified such as land use mapping, water access and quality (see also [52]), and biodiversity and marine litter monitoring [47].
Our study also highlights that there is currently more potential for CS to contribute to implementing rather than monitoring SDGs, for example, by facilitating inclusive and sustainable urban planning, educating participants about sustainable lifestyles, or improving access to services. However, there is still work to do to achieve this potential as in many cases such outcomes were discussed but not realised within the lifetime of projects. Careful project design could facilitate this and avoid opportunities being missed. Education of participants, for example, needs to be purposefully designed into projects [65], as does early engagement of key stakeholders who could use the data being collected in decision-making.

4.1.4. Process and Data Management Dimensions

While we found a small number of resources that mentioned the SDGs as a motivation for running projects, we found no evidence of projects aiming to generate data that could contribute to SDG monitoring. This is unsurprising given the timeframe of our searches was largely prior to the adoption of the SDGs. Our analysis did, however, highlight challenges for integrating data from current projects into SDG monitoring, which varied between different types of project. Those that mine citizen-generated data, such as social media, need to address challenges related to unstructured data as well as biases in where data are generated and by whom. Contributory style projects present, perhaps, the clearest opportunity for generating SDG monitoring data as project leaders can clearly define the monitoring methodology. However, the projects we analysed demonstrated that issues remain around the quality of citizen-generated data, even when clear protocols exist. We also found limited evidence of the consideration of FAIR data management principles. This presents challenges for CS data to be used in SDG monitoring as difficulties will arise from processing and combining datasets that have not used a common methodology, where metadata are not available, and in using data that are not publicly available [3,31]. Going forwards, the development of agreed data collection and metadata standards and protocols for indicators which projects could follow will enable projects to contribute data [14].
Local, community-based projects may present the greatest challenges to contributing data to indicator monitoring. As highlighted in the interviews, when working with the poor in particular, effort should be made to align methods with citizens’ existing interests and activities so it does not place an extra burden on their time, including through co-production. Thus citizen engagement in the development of monitoring methods and materials potentially leads to tensions between needs of citizens and data requirements for monitoring purposes. These projects may be more suited, therefore, to enabling implementation of SDGs or to generating data that adds richness and local context to official monitoring datasets. Alternatively, data collection could be designed to meet both needs if they engage people in developing methods to collect data that are of interest and relevance to their lives to which methods that could contribute to official monitoring are added.
Projects which involve citizens in active data collection and those that involve participants in multiple stages of a project, including setting research questions and designing methods and materials, are also more likely to achieve some of the co-benefits of CS, such as inclusive decision-making and raising awareness of issues related to sustainability [66]. While just over half of the projects we identified involved citizens in active data collection, only 10 projects involved participants in developing the design of the research, perhaps indicating a missed opportunity to achieve additional outcomes from projects. As discussed above, designing some of these features into projects could mean that additional benefits are achieved.

4.2. Future Directions

To realise the potential of CS to contribute to the SDGs, investment is required to support CS in LMICs, especially in the lowest income countries. High income countries, in particular, those in Europe as well as North America and Australia, have decades of experience in running CS projects. New projects in these countries, therefore, benefit from the wealth of knowledge that has accrued in these contexts, as well as the support of CS associations (e.g., the European and Australian Citizen Science Associations), which operate to agree standards and advocate for the use of CS in policy making [25]. There is also awareness of and buy-in to CS at the government level; the US EPA, for example, has a protocol for the use of CS and crowdsourced data within its work [67]. By contrast, the limited use of CS approaches in LMICs historically means that there is a lack of government support for and awareness of these approaches [51]. Some of the learning from high income countries could, therefore, be taken to support the development of and advocacy for CS methods in LMICs, including through newly formed associations such as CitizenScience.Asia, the Citizen Science Global Partnership, and via global projects such as eBird [66].
Furthermore, in their roadmap for CS and the SDGs, Fritz et al. [3] list several actions that need to be taken to foster the use of CS data in monitoring. At the global level, these include engaging with indicator custodian agencies to promote the use of CS and working with these agencies to agree on protocols for data collection. At a national level, these include fostering a culture of trust in CS data in national agencies, building on existing policy frameworks that advocate for the use of CS and promoting dialogue on data quality and data management, with the ultimate aim of national statistics offices using CS data in their official reporting. At a local level, these include raising awareness of best practice in terms of data quality and management and for the options available to align projects with SDG monitoring. Again, due to the experience and structures already in place, many high income countries will be much better placed to take these steps. It is important that global discussions include representatives of LMICs, so their priorities are included in discussions, and data collection methods can be developed with constraints specific to these countries in mind, such as working with the poor and those with limited access to technology. Support should also be given to LMICs to develop the national discussions and frameworks needed to make use of CS data as well as supporting project leaders, including small organisations such as CSOs, in adhering to required standards. It should be recognised that alignment of projects with SDG monitoring is not a necessity; as shown in this paper, the potential for CS to contribute to achieving the SDGs is huge, and in some cases, this will take priority over producing data for monitoring purposes.
Finally, we encourage deeper reflection and discussion of challenges in the CS community which was found to be absent from many of the resources found in our literature review. There is a need for CS to be critical and for project leaders to assess and report on successes and failures in terms of data quality, engagement, participant, and stakeholder outcomes, etc. Where these issues were discussed, they were often noted as observations rather than as a result of a more systematic evaluation or study. Rigorous assessment and reflection needs to be built into CS processes so that it involves participants and other stakeholders and allows for open learning to take place within CS projects and in the community as a whole [67].

5. Conclusions

In this paper, we have shown that opportunities exist for CS to contribute to monitoring, localizing, defining, and achieving the SDGs. We have identified, for example, the capacity for projects to produce data on a wide range of topics and at fine spatial and temporal resolutions, which can be of great value in adding richness to existing datasets. We have also shown the potential that exists for CS to contribute towards the implementation of the SDGs through a wide variety of pathways. However, many challenges need to be further understood and addressed for CS to reach its full potential in LMICs. A full understanding of the social and structural barriers to the successful implementation of CS, particularly in the lowest income countries and when working with the most marginalised in society, is required. Effort is also needed to engage LMICs in discussions about the inclusion of CS data in SDG monitoring and to support the successful implementation of CS initiatives. Without understanding and overcoming barriers and providing this support, there is a risk that those who could most benefit from being engaged with these approaches will in fact be excluded.

Supplementary Materials

The following are available online at https://www.mdpi.com/article/10.3390/su13179534/s1, Method S1: Topic guide for interview related to urban Citizen Science projects implemented in lower and middle income country (LMIC) contexts. Table S1: Resources describing urban citizen-generated data projects in low and middle income countries. Some projects are described in multiple resources and some resources described multiple projects.

Author Contributions

Conceptualization, R.P., H.T. and S.C.; methodology, R.P., H.T. and S.C. software, S.C.; validation, R.P., H.T. and S.C.; formal analysis, R.P., H.T. and S.C.; investigation, R.P. and H.T.; resources, S.C.; data curation, R.P. and H.T.; writing—original draft preparation, R.P., H.T. and S.C.; writing—review and editing, R.P., H.T. and S.C.; visualization, R.P.; supervision, R.P. and S.C.; project administration, R.P. and S.C.; funding acquisition, R.P., H.T. and S.C. All authors have read and agreed to the published version of the manuscript.

Funding

This research was funded by Sida through the Stockholm Environment Institute’s City Health and Wellbeing Initiative. SEI project number: 10023204.

Institutional Review Board Statement

The study was conducted according to the guidelines of the Declaration of Helsinki, and undertaken in accordance with the Stockholm Environment Institute’s ethics procedures 2019.

Informed Consent Statement

Informed consent was obtained from all subjects involved in the study.

Data Availability Statement

Data available on request due to restrictions eg privacy or ethical.

Acknowledgments

Thanks go to Tom Holmes for help with initial processing of resources in the systematic review and to Sarah West for reviewing a draft of the manuscript.

Conflicts of Interest

The authors declare no conflict of interest.

References

  1. UN. A/RES/70/1 UN General Assembly Transforming Our World: The 2030 Agenda for Sustainable Development. Seventieth session of the General Assembly on 25 September 2015. 2015. Available online: https://www.un.org/en/development/desa/population/migration/generalassembly/docs/globalcompact/A_RES_70_1_E.pdf (accessed on 8 July 2021).
  2. IAEG Secretariat. A World that Counts. Mobilising the Data Revolution for Sustainable Development. 2014. Available online: https://www.undatarevolution.org/wp-content/uploads/2014/11/A-World-That-Counts.pdf (accessed on 8 July 2021).
  3. Fritz, S.; See, L.; Carlson, T.; Haklay, M.; Oliver, J.L.; Fraisl, D.; Mondardini, R.; Brocklehurst, M.; Shanley, L.A.; Schade, S.; et al. Citizen science and the United Nations Sustainable Development Goals. Nat. Sustain. 2019, 2, 922–930. [Google Scholar] [CrossRef]
  4. West, S.; Pateman, R. How Could Citizen Science Support the Sustainable Development Goals? Stockholm Environment Institute: Stockholm, Sweden, 2017; Available online: https://mediamanager.sei.org/documents/Publications/SEI-2017-PB-citizen-science-sdgs.pdf (accessed on 8 July 2021).
  5. Shulla, K.; Leal Filho, W.; Sommer, J.; Lange Salvia, A.; Borgemeister, C. Channels of collaboration for citizen science and the Sustainable Development Goals. J. Clean. Prod. 2020, 264, 121735. [Google Scholar] [CrossRef]
  6. Bäckstrand, K. Civic Science for Sustainability: Reframing the Role of Experts, Policy-Makers and Citizens in Environmental Governance. Glob. Environ. Politics 2003, 3, 24–41. [Google Scholar] [CrossRef]
  7. Phillips, T.B.; Ballard, H.L.; Lewenstein, B.V.; Bonney, R. Engagement in science through citizen science: Moving beyond data collection. Sci. Educ. 2019, 103, 665–690. [Google Scholar] [CrossRef]
  8. Lakeman-Fraser, P.; Gosling, L.; Moffat, A.J.; West, S.E.; Fradera, R.; Davies, L.; Ayamba, M.A.; van der Wal, R. To have your citizen science cake and eat it? Delivering research and outreach through Open Air Laboratories (OPAL). BMC Ecol. 2016, 16. [Google Scholar] [CrossRef] [Green Version]
  9. Fernandez-Gimenez, M.E.; Ballard, H.L.; Sturtevant, V.E. Adaptive Management and Social Learning in Collaborative and Community-Based Monitoring: A Study of Five Community-Based Forestry Organizations in the western USA. Ecol. Soc. 2008, 13, 14. Available online: http://www.ecologyandsociety.org/vol13/iss2/art4/ (accessed on 19 August 2021). [CrossRef]
  10. Ballard, H.L.; Dixon, C.G.H.; Harris, E.M. Youth-focused citizen science: Examining the role of environmental science learning and agency for conservation. Biol. Conserv. 2017, 208, 65–75. [Google Scholar] [CrossRef] [Green Version]
  11. Rome, C.; Lucero, C. Wild Carrot (Daucus carota) Management in the Dungeness Valley, Washington, United States: The Power of Citizen Scientists to Leverage Policy Change. Citiz. Sci. Theory Pract. 2019, 4, 36. [Google Scholar] [CrossRef] [Green Version]
  12. Turbé, A.; Barba, J.; Pelacho, M.; Mugdal, S.; Robinson, L.; Serrano-Sanz, F.; Sanz, F.; Tsinaraki, C.; Rubio, J.-M.; Schade, S. Understanding the Citizen Science Landscape for European Environmental Policy: An Assessment and Recommendations. Citiz. Sci. Theory Pract. 2019, 4, 34. [Google Scholar] [CrossRef] [Green Version]
  13. Acuto, M. Give cities a seat at the top table. Nature 2016, 537, 611–613. [Google Scholar] [CrossRef] [Green Version]
  14. UN. A/RES/71/313 Work of the Statistical Commission Pertaining to the 2030 Agenda for Sustainable Development. Seventy-First Session of the General Assembly on 6 July 2015; 2017; Available online: http://ggim.un.org/documents/a_res_71_313.pdf (accessed on 19 August 2021).
  15. UN. Tier Classification for Global SDG Indicators. Available online: https://unstats.un.org/sdgs/iaeg-sdgs/tier-classification/ (accessed on 19 August 2021).
  16. UN. The Sustainable Development Goals Report 2018. 2018. Available online: https://unstats.un.org/sdgs/files/report/2018/TheSustainableDevelopmentGoalsReport2018-EN.pdf (accessed on 8 July 2021).
  17. van den Homberg, M.; Susha, I. Characterizing Data Ecosystems to Support Official Statistics with Open Mapping Data for Reporting on Sustainable Development Goals. ISPRS Int. J. Geo-Inf. 2018, 7, 456. [Google Scholar] [CrossRef] [Green Version]
  18. Klopp, J.M.; Petretta, D.L. The urban sustainable development goal: Indicators, complexity and the politics of measuring cities. Cities 2017, 63, 92–97. [Google Scholar] [CrossRef]
  19. Friesen, J.; Taubenböck, H.; Wurm, M.; Pelz, P.F. Size distributions of slums across the globe using different data and classification methods. Eur. J. Remote Sens. 2019, 52, 99–111. [Google Scholar] [CrossRef] [Green Version]
  20. UN. Measuring Progress. Towards Achieving the Environmental Dimension of the SDGs. 2019. Available online: https://wedocs.unep.org/handle/20.500.11822/27627 (accessed on 8 July 2021).
  21. Amano, T.; Lamming, J.D.L.; Sutherland, W.J. Spatial Gaps in Global Biodiversity Information and the Role of Citizen Science. Bioscience 2016, 66, 393–400. [Google Scholar] [CrossRef] [Green Version]
  22. Danielsen, F.; Topp-Jørgensen, E.; Levermann, N.; Løvstrøm, P.; Schiøtz, M.; Enghoff, M.; Jakobsen, P. Counting what counts: Using local knowledge to improve Arctic resource management. Polar Geogr. 2014, 37, 69–91. [Google Scholar] [CrossRef]
  23. Pocock, M.J.O.; Roy, H.E.; Preston, C.D.; Roy, D.B. The Biological Records Centre: A pioneer of citizen science. Biol. J. Linn. Soc. 2015, 115, 475–493. [Google Scholar] [CrossRef] [Green Version]
  24. Lu, Y.L.; Nakicenovic, N.; Visbeck, M.; Stevance, A.S. Five priorities for the UN Sustainable Development Goals. Nature 2015, 520, 432–433. [Google Scholar] [CrossRef] [PubMed] [Green Version]
  25. Hecker, S.; Wicke, N.; Haklay, M.; Bonn, A. How Does Policy Conceptualise Citizen Science? A Qualitative Content Analysis of International Policy Documents. Citiz. Sci. Theory Pract. 2019, 4, 32. [Google Scholar] [CrossRef] [Green Version]
  26. Hayhow, D.; Eaton, M.; Stanbury, A.; Burns, F.; Kirby, W.; Bailey, N.; Beckmann, B.; Bedford, J.; Boersch-Supan, P.; Coomber, F.; et al. State of Nature Report 2019. 2019. Available online: https://nbn.org.uk/wp-content/uploads/2019/09/State-of-Nature-2019-UK-full-report.pdf (accessed on 19 August 2021).
  27. Global Taskforce of Local and Regional Governments, United Nations Development Programme and UN-Habitat. Roadmap for Localizing the SDGs: Implementation and Monitoring at a Subnational Level. Undated. Available online: https://www.uclg.org/sites/default/files/roadmap_for_localizing_the_sdgs_0.pdf (accessed on 19 August 2021).
  28. Thinyane, M.; Goldkind, L.; Lam, H.I. Data Collaboration and Participation for Sustainable Development Goals-a Case for Engaging Community-Based Organizations. J. Hum. Rights Soc. Work 2018, 3, 44–51. [Google Scholar] [CrossRef]
  29. Pocock, M.J.; Chandler, M.; Bonney, R.; Thornhill, I.; Albin, A.; August, T.; Bachman, S.; Brown, P.M.; Gasparini Fernandes Cunha, D.; Grez, A.; et al. Chapter Six—A Vision for Global Biodiversity Monitoring with Citizen Science. In Advances in Ecological Research; David, A., Bohan, A.J.D., Woodward, G., Jackson, M., Eds.; Academic Press: Cambridge, MA, USA, 2018; Volume 59, pp. 169–223. [Google Scholar]
  30. UN. 2030 Agenda for Sustainable Development. 2015. Available online: https://sustainabledevelopment.un.org/post2015/transformingourworld (accessed on 8 July 2021).
  31. Jameson, S.; Lämmerhirt, D.; Prasetyo, E. Acting Locally, Monitoring Globally? How to Link Citizen-Generated Data to SDG Monitoring; DataShift, Open Knowledge International: Cambridge, UK, 2017. [Google Scholar]
  32. Lidskog, R. Scientised citizens and democratised science. Reassessing the expertlay divide. J. Risk Res. 2008, 11, 69–86. [Google Scholar] [CrossRef]
  33. Sauermann, H.; Vohland, K.; Antoniou, V.; Balazs, B.; Gobel, C.; Karatzas, K.; Mooney, P.; Perello, J.; Ponti, M.; Samson, R.; et al. Citizen science and sustainability transitions. Res. Policy 2020, 49, 103978. [Google Scholar] [CrossRef]
  34. Danielsen, F.; Pirhofer-Walzl, K.; Adrian, T.P.; Kapijimpanga, D.R.; Burgess, N.D.; Jensen, P.M.; Bonney, R.; Funder, M.; Landa, A.; Levermann, N.; et al. Linking Public Participation in Scientific Research to the Indicators and Needs of International Environmental Agreements. Conserv. Lett. 2014, 7, 12–24. [Google Scholar] [CrossRef]
  35. Kullenberg, C.; Kasperowski, D. What Is Citizen Science?—A Scientometric Meta-Analysis. PLoS ONE 2016, 11, e0147152. [Google Scholar] [CrossRef] [Green Version]
  36. Brouwer, S.; Hessels, L.K. Increasing research impact with citizen science: The influence of recruitment strategies on sample diversity. Public Underst. Sci. 2019, 28, 606–621. [Google Scholar] [CrossRef] [PubMed]
  37. Hajer, M.; Nilsson, M.; Raworth, K.; Bakker, P.; Berkhout, F.; de Boer, Y.; Rockstrom, J.; Ludwig, K.; Kok, M. Beyond Cockpit-ism: Four Insights to Enhance the Transformative Potential of the Sustainable Development Goals. Sustainability 2015, 7, 1651–1660. [Google Scholar] [CrossRef] [Green Version]
  38. Branchini, S.; Meschini, M.; Covi, C.; Piccinetti, C.; Zaccanti, F.; Goffredo, S. Participating in a Citizen Science Monitoring Program: Implications for Environmental Education. PLoS ONE 2015, 10, e0131812. [Google Scholar] [CrossRef] [PubMed]
  39. Stedman, R.; Lee, B.; Brasier, K.; Weigle, J.L.; Higdon, F. Cleaning Up Water? Or Building Rural Community? Community Watershed Organizations in Pennsylvania. Rural Sociol. 2009, 74, 178–200. [Google Scholar] [CrossRef]
  40. Cervantes, M.; Hong, S.J. STI policies for delivering on the Sustainable Development Goals. In OECD Science, Technology and Innovation Outlook 2018: Adapting to Technological and Societal Disruption; OECD Publishing: Paris, France, 2018. [Google Scholar]
  41. West, S.E.; Büker, P.; Ashmore, M.; Njoroge, G.; Welden, N.; Muhoza, C.; Osano, P.; Makau, J.; Njoroge, P.; Apondo, W. Particulate matter pollution in an informal settlement in Nairobi: Using citizen science to make the invisible visible. Appl. Geogr. 2020, 114, 102133. [Google Scholar] [CrossRef]
  42. Folkerth, M.; Adcock, K.; Singler, M.; Bishop, E. Citizen Science: A New Approach to Smoke-Free Policy Advocacy. Health Promot. Pract. 2020, 21, 82S–88S. [Google Scholar] [CrossRef] [Green Version]
  43. Leminen, S.; Westerlund, M.; Nyström, A.-G. Living Labs as Open-Innovation Networks. Technol. Innov. Manag. Rev. 2012, 2, 6–11. [Google Scholar] [CrossRef]
  44. Ritchie, H. Urbanisation. OurWorldInData.Org. 2018. Available online: https://ourworldindata.org/urbanization (accessed on 8 July 2021).
  45. Cohen, B. Urbanization in developing countries: Current trends, future projections, and key challenges for sustainability. Technol. Soc. 2006, 28, 63–80. [Google Scholar] [CrossRef]
  46. Broto, V.C.; Trencher, G.; Iwaszuk, E.; Westman, L. Transformative capacity and local action for urban sustainability. Ambio 2019, 48, 449–462. [Google Scholar] [CrossRef] [PubMed] [Green Version]
  47. Fraisl, D.; Campbell, J.; See, L.; Wehn, U.; Wardlaw, J.; Gold, M.; Moorthy, I.; Arias, R.; Piera, J.; Oliver, J.L.; et al. Mapping citizen science contributions to the UN sustainable development goals. Sustain. Sci. 2020, 15, 1735–1751. [Google Scholar] [CrossRef]
  48. Bio Innovation Service. Citizen Science for Environmental Policy: Development of an EU-Wide Inventory and Analysis of Selected Practices. Final Report for the European Commission, DG Environment under the Contract 070203/2017/768879/ETU/ENV.A.3, in Collaboration with Fundacion Ibercivis and The Natural History Musuem; Publications Office of the European Union: Luxembourg, 2018. [Google Scholar]
  49. Colston, N.M.; Vadjunec, J.M.; Wakeford, T. Exploring the entry points for citizen science in urban sustainability initiatives. Curr. Opin. Environ. Sustain. 2015, 17, 66–71. [Google Scholar] [CrossRef] [Green Version]
  50. Gulsrud, N.M.; Raymond, C.M.; Rutt, R.L.; Olafsson, A.S.; Plieninger, T.; Sandberg, M.; Beery, T.H.; Jonsson, K.I. ‘Rage against the machine’? The opportunities and risks concerning the automation of urban green infrastructure. Landsc. Urban Plan. 2018, 180, 85–92. [Google Scholar] [CrossRef]
  51. Pocock, M.J.O.; Roy, H.E.; August, T.; Kuria, A.; Barasa, F.; Bett, J.; Githiru, M.; Kairo, J.; Kimani, J.; Kinuthia, W.; et al. Developing the global potential of citizen science: Assessing opportunities that benefit people, society and the environment in East Africa. J. Appl. Ecol. 2019, 56, 274–281. [Google Scholar] [CrossRef]
  52. Quinlivan, L.; Chapman, D.V.; Sullivan, T. Applying citizen science to monitor for the Sustainable Development Goal Indicator 6.3.2: A review. Environ. Monit. Assess. 2020, 192, 218. [Google Scholar] [CrossRef] [PubMed]
  53. Cooper, C.; Lewenstein, B. Two Meanings of Citizen Science. In The Rightful Place of Science: Citizen Science; Cavalier, D., Kennedy, E., Eds.; Consortium for Science, Policy and Outcomes: Tempe, AZ, USA; Washington, DC, USA, 2016. [Google Scholar]
  54. ECSA. ECSA’s Characteristics of Citizen Science. 2020. Available online: https://zenodo.org/record/3758668 (accessed on 8 July 2021).
  55. World Bank. World Development Indicators (June 2019). Available online: https://databank.worldbank.org/source/world-development-indicators (accessed on 8 July 2021).
  56. Shayo, D.P.; Kersting, N. Crowdmonitoring of Elections through ICT: The Case of Uchaguzi Wetu 2015 Crowdsourcing Platform in Tanzania. In Proceedings of the 2017 Conference for E-Democracy and Open Government (CeDEM), Krems, Austria, 17–19 May 2017; pp. 36–45. [Google Scholar]
  57. Making All Voices Count. Text2speak: Provision of Quality Health Services in Nigeria. Available online: https://www.makingallvoicescount.org/project/sms-service-to-strengthen-accountability-delivery-of-maternal-care/ (accessed on 8 July 2021).
  58. Long, Y.; Liu, L. Transformations of urban studies and planning in the big/open data era: A review. Int. J. Image Data Fusion 2016, 7, 295–308. [Google Scholar] [CrossRef]
  59. Kharas, H. The Unprecedented Expansion of the Global Middle Class: An Update. 2017. Available online: www.brookings.edu/research/the-unprecedented-expansion-of-the-global-middle-class-2/ (accessed on 8 July 2021).
  60. Zhang, X.Q. The trends, promises and challenges of urbanisation in the world. Habitat Int. 2016, 54, 241–252. [Google Scholar] [CrossRef]
  61. Cunha, D.G.F.; Marques, J.F.; De Resende, J.C.; De Falco, P.B.; De Souza, C.M.; Loiselle, S.A. Citizen science participation in research in the environmental sciences: Key factors related to projects’ success and longevity. An. Acad. Bras. Cienc. 2017, 89, 2229–2245. [Google Scholar] [CrossRef] [Green Version]
  62. Filippo, D.D.; Lascurain, M.L.; Pandiella-Dominique, A.; Sanz-Casado, E. Scientometric Analysis of Research in Energy Efficiency and Citizen Science through Projects and Publications. Sustainability 2020, 12, 5175. [Google Scholar] [CrossRef]
  63. Bonney, R.; Phillips, T.B.; Ballard, H.L.; Enck, J.W. Can citizen science enhance public understanding of science? Public Underst. Sci. 2016, 25, 2–16. [Google Scholar] [CrossRef] [PubMed]
  64. Turrini, T.; Dörler, D.; Richter, A.; Heigl, F.; Bonn, A. The threefold potential of environmental citizen science-Generating knowledge, creating learning opportunities and enabling civic participation. Biol. Conserv. 2018, 225, 176–186. [Google Scholar] [CrossRef]
  65. Guerrini, C.J.; Majumder, M.A.; Lewellyn, M.J.; McGuire, A.L. Citizen science, public policy. Science 2018, 361, 134–136. [Google Scholar] [CrossRef] [PubMed]
  66. Sullivan, B.L.; Wood, C.L.; Iliff, M.J.; Bonney, R.E.; Fink, D.; Kelling, S. eBird: A citizen-based bird observation network in the biological sciences. Biol. Conserv. 2009, 142, 2282–2292. [Google Scholar] [CrossRef]
  67. Kieslinger, B.; Schäfer, T.; Heigl, F.; Dörler, D.; Richter, A.; Bonn, A. The Challenge of Evaluation: An Open Framework for Evaluating Citizen Science Activities; SocArXiv Papers; 2017; Available online: https://osf.io/preprints/socarxiv/enzc9/ (accessed on 19 August 2021). [CrossRef]
Figure 1. Overview of methods, including academic and grey (non-academic) literature reviews and project leader interviews.
Sustainability 13 09534 g001
Figure 2. Low, lower middle and upper middle income countries with urban citizen science projects identified in the semi-systematic review. Depth of filled colour represents the number of different projects identified in each country. Colour of outline shows if countries are classed as low (red), lower middle (orange), or upper middle (yellow) income countries.
Sustainability 13 09534 g002
Figure 3. Number of projects in the scope of each Sustainable Development Goal. Number in the bottom left corner of each square is the number of projects. SDG 9: Industry, innovation and infrastructure; SDG 5: Gender equality; SDG 2: Zero hunger; SDG 8: Decent work and economic growth; SDG 7: Affordable and clean energy; SDG 14: Life below water.
Sustainability 13 09534 g003
Figure 4. Projects under the scope of SDG (a) targets, (b) monitoring indicators, and (c) achieving progress towards indicators. Numbers in boxes show the number of projects under the scope of the target or indicator, reflected in their colour (red = fewer projects, green = more projects). Numerals in (b) show whether indicators are classified as Tier I or II.
Sustainability 13 09534 g004
Table 1. Framework for assessing values of citizen science (CS) methodologies for monitoring, localising, defining, and implementing the Sustainable Development Goals (SDGs). Dimensions of CS and features of these dimensions and their value for the SDGs are taken from Fritz et al. [3]. Values in relation to monitoring, localising, defining, and implementing the SDGs were defined by the authors. ‘Information derived from resources’ describes information we extracted from resources identified in the semi-systematic review to assess these values and ‘Categories’ shows how this information was categorised, where appropriate.
Dimension of CS [3]Feature of CS Dimension and Value for SDGs [3]Value for Monitoring (M), Localising (L), Defining (D) and Implementing (I) SDGsInformation Derived from ResourcesCategories (If Applicable)
SpatialSpatial reference: location can contribute to spatially explicit indicatorsM: spatial information required for monitoring indicators
L: data captured about local conditions
D: can help to define new local indicators
Were data collected with spatial information?Yes; No
Spatial resolution: Denser coverage than traditional surveysM: adds richness to traditional datasets
L: captures local information in detail
D: can help to define new local indicators
I: achieving SDGs often happens locally
Scale of projectNeighbourhood; City; Country; Global 1
Spatial extent: Wide geographic coverage and remote locationsM: increases geographic extent of information captured
L/D/I: can help to localize, define and implement SDGs in more and remote locations
Country or countries projects took place inCountry name
Economic classification of countryLow; Lower middle; Upper middle
TemporalTemporal duration: regular or continuous data collection well suited to SDGsM/L: regular and long term data collection valuable for monitoring indicators at national or local level
I: longer term projects more likely to achieve results in implementing SDGs
Whether project was fully launchedTrial/testing of methods; Full project
For full projects, duration for which project was live
Number of weeks, months or years
Temporal resolution: more frequent update cycles could fill gaps in SDG indicatorsM: as noted, frequent cycles of data collection can help fill gaps in official datasetsFrequency of data collectionRegular cycles (weekly, monthly, annually); Continuous
ThemeThematic subject: multiple domains relevant to a range of SDG indicators (especially Tier II)M: opportunities for monitoring across a range of SDGs; particular opportunities for using novel data sources in Tier II indicators
I: opportunities for projects to help achieve a wide range of SDGs
Sustainable Development Goal(s); Targets and Indicators project is aligned withGoal, Target and Indicator number(s)
Whether project would help monitor or make progress on the indicators identifiedMonitor; Implement
Tier of Indicators aligned with projectsI; II
Thematic resolution and definition: richer, more detailed vocabularies could fill data gaps (especially Tier II)D/L: projects not currently aligned SDG framework could be used to define new targets and indicators, particularly those that capture citizen concerns and prioritiesCount of Targets project is aligned with but not any of the associated Indicators
Type of CS project/stage of scientific process citizens involved in
n/a
ProcessDriver: Indicator alignment versus ownership and community needsM: different methods will be required for processing citizen science data in projects with different drivers or purposes
D/L: community driven projects may be more suited to localizing and defining new indicators
I: implementation mechanisms may differ between projects types
Was SDG monitoring a specific consideration for the projectYes; No
Purpose of the data: implicit use of CS data for SDG indicatorsCitizen involvement in stages of project process 2Project design; Data collection; Data processing; Using results; Other
Data collection and processing: can be aligned with indicator needs or contribute to new indicators
Cognitive attention: active and passive data sources available for indicatorsI: secondary outcomes (e.g., education, behaviour change) more likely from projects where participants are actively engaged and engaged in multiple stages of the research processDuration of citizen involvementSporadic; Short term; Long term 3
Citizen involvement in data collectionData mined; Secondary use; Mobile sensor; Active
Citizens given trainingYes; No
Data managementFAIR principles: data are findable, accessible, interoperable and reusableM: Data adhering to FAIR principles are more able to be incorporated into SDG monitoringEvidence of adherence to FAIR principlesn/a
1 Neighbourhood = specific area of a city; City = more than one area of city; Country = more than one city in a Country; Global = more than once country. 2 NGO = Non-governmental organisation; CSO = Civil society organisation. 3 Short term = less than a year; Long term = more than a year.
Table 2. Semi-systematic review search terms and inclusion criteria.
Search TermsInclusion Criteria
Citizen Science and Related MethodsLocation
citizen science, community science, community monitoring, volunteer monitoring, participatory monitoring, public participation in scientific, community based participatory research, crowdsourcing, crowd sourcing, crowdsensing, crowd sensing, volunteered geographic information, crowdmonitoring, crowd monitoring, participatory sensing, participatory urban sensing, participatory data collection, co-design, co-createdUrban
Cities
Published 2010–2018
Full resource written in English
Described project(s):
  • Trialed or launched
  • Using and/or collecting citizen-generated data
  • In urban environments
  • In low and/or middle income countries
Publisher’s Note: MDPI stays neutral with regard to jurisdictional claims in published maps and institutional affiliations.

