Article

Influence of Surface Water on Desert Vegetation Expansion at the Landscape Scale: A Case Study of the Daliyabuyi Oasis, Taklamakan Desert

1
College of Resources and Environment Science, Xinjiang University, Urumqi 830046, China
2
Institute of Arid Ecology and Environment, Xinjiang University, Urumqi 830046, China
3
Key Laboratory of Oasis Ecology, Xinjiang University, Urumqi 830046, China
*
Author to whom correspondence should be addressed.
Sustainability 2021, 13(17), 9522; https://doi.org/10.3390/su13179522
Submission received: 30 May 2021 / Revised: 23 July 2021 / Accepted: 17 August 2021 / Published: 24 August 2021
(This article belongs to the Section Sustainability in Geographic Science)

Abstract

:
Surface water is an important factor affecting vegetation change in desert areas. However, little research has been conducted on the effects of surface water on vegetation expansion. In this study, the annual spatial distribution range of vegetation and surface water in the Daliyabuyi Oasis from 1990 to 2020 was extracted using Landsat time-series images. Based on multi-temporal and multi-scale remote sensing images, several plots were selected to demonstrate the process of landform change and vegetation expansion, and the influence of surface water on vegetation expansion was analyzed. The results show that the vegetation distribution and surface water coverage have increased from 1990 to 2020; and surface water is a critical factor that drives the expansion of vegetation. On the one hand, surface water in the study area was essential for reshaping the riparian landform, driving the transformation of dunes into floodplains, and increasing the potential colonization sites for vegetation. However, landform changes ultimately changed the redistribution of surface water, ensuring that enough water and nutrients provided by sediment were available for plant growth. Our study provides a critical reference for the restoration of desert vegetation and the sustainable development of oases.

1. Introduction

Vegetation is a prominent desert landscape representation of oases, and the expansion and decline of vegetation determine the development and extinction of oases [1,2]. Therefore, exploring the expansion process of desert vegetation is essential for mitigating the severe impacts of desertification and providing scientific support for the effective management and sustainable development of oases [3]. Arid and semi-arid areas constitute over 30% of the world’s land surface. In these water-limited ecosystems, soil moisture strongly affects land surface hydrology, subsurface hydrology, and eco-hydrological fluxes [4]. Moreover, vegetation can have a significant effect on hydrological fluxes due to variations in the physical characteristics of the land surface, soil, and vegetation, such as the roughness, albedo, infiltration capacity, root depth, architectural resistance, leaf area index (LAI), and stomatal conductance [5].
The growth and dynamics of vegetation are affected by many environmental factors, such as microclimate, soil structure, water, solar radiation, and topography [6,7,8,9]. Among these factors, water is responsible for the growth and changes in desert plants, and directly affects the spatial and temporal distribution patterns of desert vegetation [10,11,12,13]. In desert areas, rainfall is scarce, and evapotranspiration rates are high. Groundwater and surface water are the main water sources that ensure the existence, vitality, and regeneration of desert plants [14,15].
At both the individual and population scales, groundwater predominately affects the vitality of desert plants, whereas surface water mainly determines their regeneration [15,16]. The roots of desert plants can adapt to drought conditions by reaching deep into the soil and absorbing groundwater [17]. Populus euphratica and Tamarix chinensis are typical constructive plant species in arid areas. Studies have shown that 2–4 m is the suitable groundwater level for P. euphratica and T. chinensis, and 6 m is the stress groundwater level for the survival of these plants [18]. In the wild, there is less human disturbance; thus, the groundwater level is relatively stable, and the variation in small-scale space is slight. In habitats with suitable groundwater levels, the regeneration and expansion of desert plants mainly depend on surface water [19,20,21]. First, within a long time span, rivers can shape landforms, affect the sedimentation process, and provide the material basis for the colonization of plant seedlings [22,23]. Second, seasonal floods wet the floodplain soil, improve the soil moisture content, and reduce soil salinity, thus providing favorable conditions for the germination of vegetation seeds [15,16,24]. A field survey conducted in the lower reaches of the Tarim River indicated that the number of P. euphratica seeds in summer was as high as 85,743 seeds/m2. Moreover, it was determined that the germination rate of P. euphratica seeds in distilled water was 92.0% and 60.8% in silt, and only 3.6% of the seeds could germinate in unflooded soil [25]. Third, in the young stage of plants, the root system is underdeveloped and unable to extract groundwater; thus, young plants predominately depend on seasonal surface water for survival and plant seedlings die easily due to lack of water supply [9]. Furthermore, several studies have shown that surface water affects the spatial distribution of desert plants by driving geomorphic changes and by influencing the availability of water, light, nutrients, and other resources [26]. For example, floods eroded the high terrace causing the newly developing floodplain to widen [23].
In desert riparian areas, field surveys do not adequately capture the vegetation expansion process driven by surface waters, and remote sensing is required to explore this process on large spatial and temporal scales [27]. Satellite remote sensing has the advantage of providing long-term continuous time-series data, increasing the efficiency and convenience of detecting large-scale vegetation changes [28]. Moreover, satellite remote sensing has the advantages of a large coverage area, which can effectively compensate for the lack of spatial distribution of hydrological monitoring stations, and has become an important means of obtaining surface water distribution information [29]. Landsat series images have both good spatial and temporal resolutions and accumulate a large amount of long-term historical time-series archived data that can be obtained for free. Currently, it is the most widely used remote sensing data source for land surface change detection [30,31].
Surface water is an essential limiting factor for the expansion of desert plants. However, in desert areas, most studies have focused on the influence of groundwater on vegetation and less on the impact of surface water on vegetation expansion. Therefore, at the landscape scale, the process of plant expansion into deserts is inadequately understood. Because of this, this study selected a typical oasis in a desert hinterland and obtained Landsat time-series images from 1990 to 2020 to determine changes in the spatial distribution and frequency of surface water sources. The normalized difference vegetation index (NDVI) has been used to estimate the density of green at regional scales, which can effectively indicate the growth and vitality of vegetation, and is one of the most important indicators in studying vegetation dynamics [32,33,34]. Thus, the NDVI and Otsu thresholding method [35] were used to extract the distribution of vegetation; and the automated water extraction index (AWEI no shadow) [36] and the maximum entropy thresholding method [37] were employed to extract the spatial distribution of surface water, and frequency of surface water occurrence. Furthermore, the process of vegetation expansion into the desert was explored at the landscape scale, and the influence of surface water on vegetation expansion was analyzed from three aspects: geomorphologic change, plant seedling colonization, and soil nutrients, to provide scientific support for the sustainable management of desert oases.

2. Study Site and Data
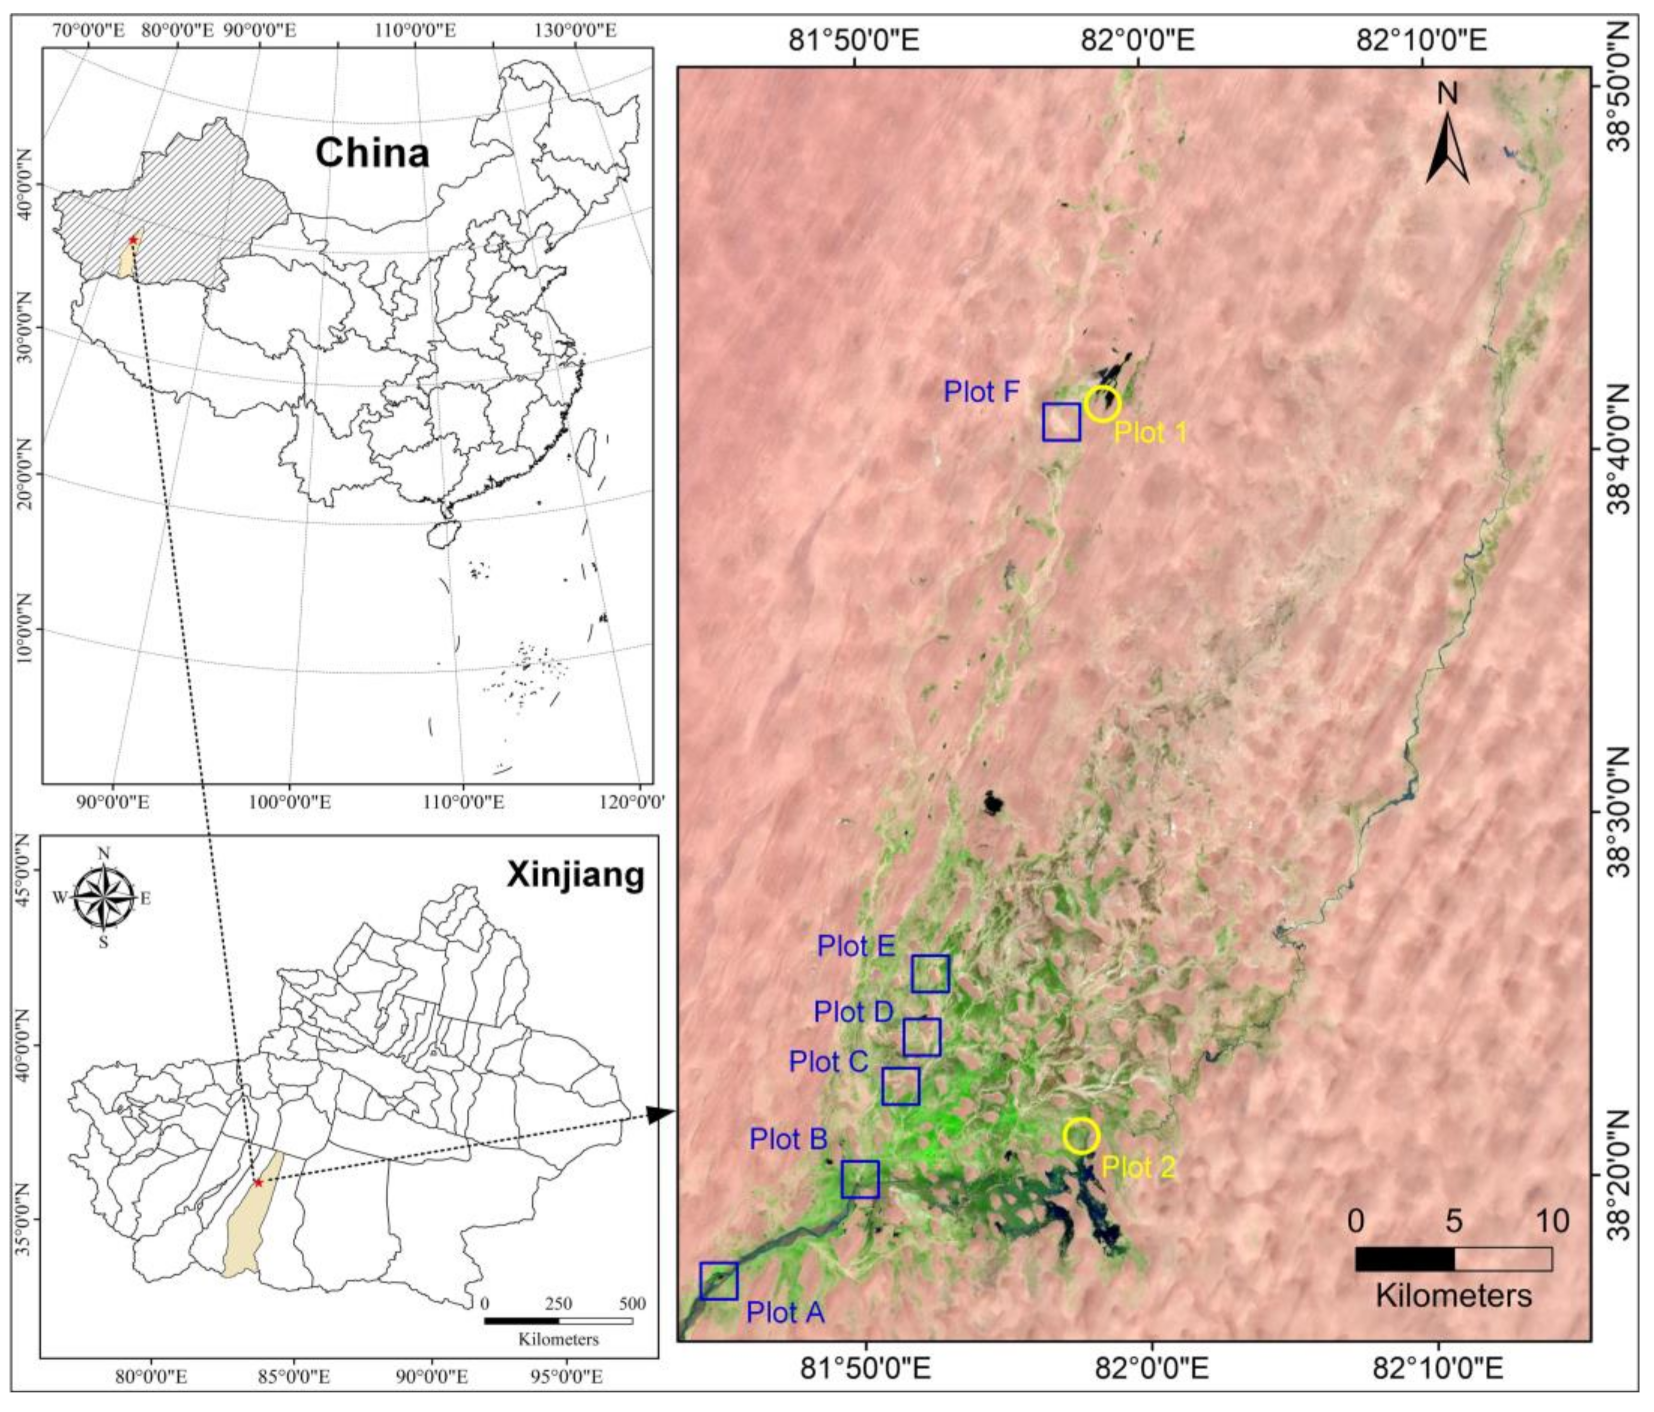
2.1. Study Site

In the hinterland of the Taklamakan Desert, the Daliyabuyi Oasis is a large natural oasis that evolved from the tail of the Keriya River (Figure 1). Its geographical coordinates are 38°16′–38°37′ N and 81°05′–81°46′ E [38]. The Daliyabuyi Oasis is a relatively primitive natural oasis that lacks large-scale agricultural and industrial activities, and is a typical representative of a desert ecosystem [39]. The main land cover types are desert, vegetation, and surface water. The vegetation is dominated by P. euphratica, T. chinensis, and Phragmites communi. Moreover, the relatively simple land types are conducive to studying the vegetation expansion process driven by surface water from remote sensing images [40].

2.2. Data

2.2.1. Landsat Images

A total of 190 cloudless images from 1990 to 2020 (Table 1, Table S1) were selected for this study, and the images were downloaded from the United States Geological Survey (USGS, Available online: https://earthexplorer.usgs.gov/ (accessed on 23 May 2021)). After radiometric correction (RC) was performed on the original level-1 Landsat images, the fast line-of-sight atmospheric analysis of spectral hypercubes (FLAASH) module was used to perform atmospheric correction, and then cropped to obtain the range of the Daliyabuyi Oasis. The above processing steps were performed using ENVI 5.3 software.

2.2.2. Unmanned Aerial Vehicle (UAV) Images

The DJI Phantom4 UAV was used to obtain high-resolution images of the typical plots. Then the Pix4Dmapper software, a widely used software for UAV images preprocessing, was used to perform stitching processing to obtain orthographic images and digital surface model (DSM) data.

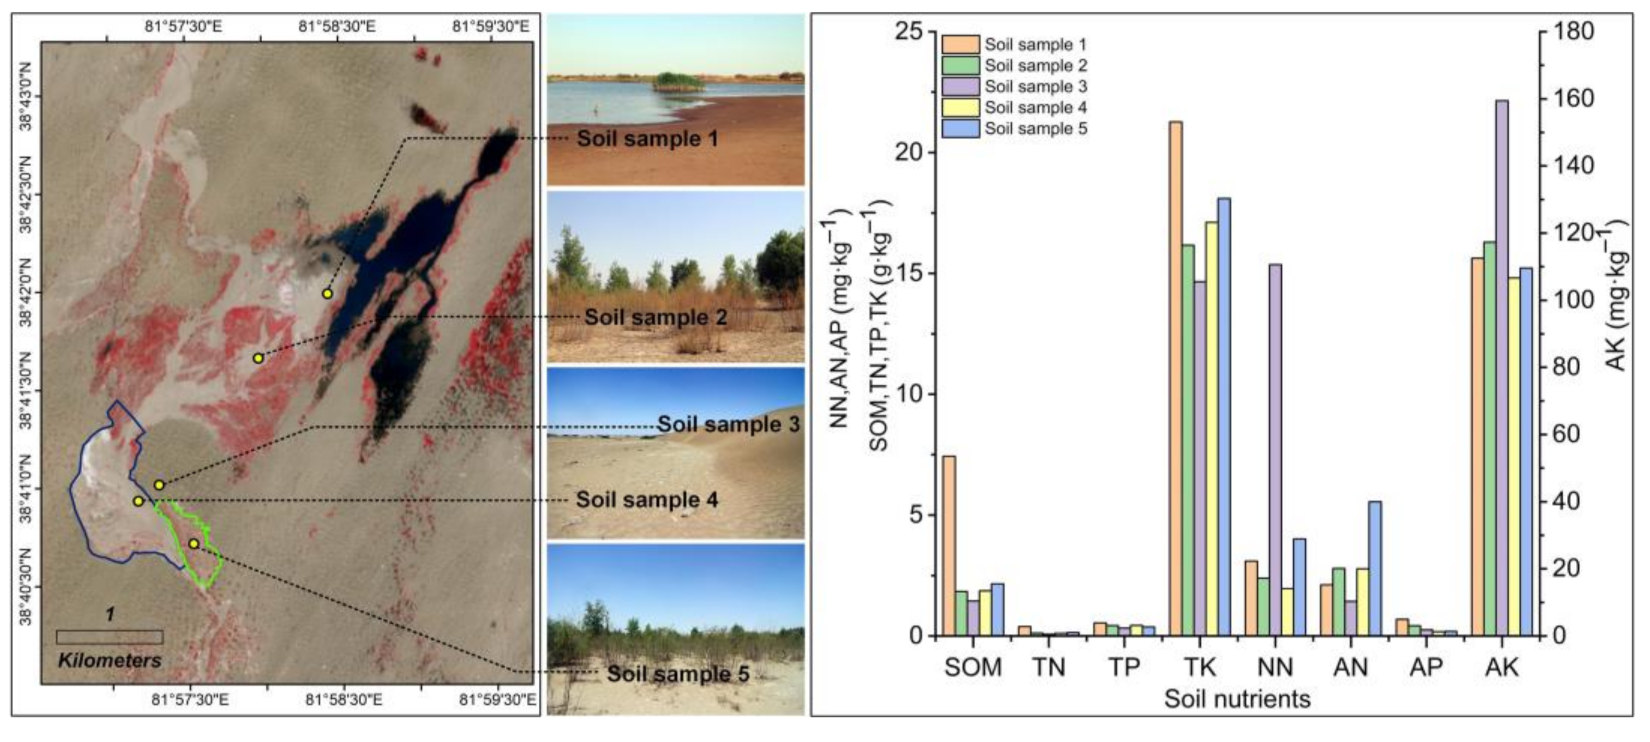
2.2.3. Soil Nutrient Content Data

Soil samples were collected in June 2020. Three soil samples were collected at intervals of 10 m in each sampling plot and were uniformly mixed; the resulting sample was considered to be the representative of the soil from the respective plot. Each soil sample was collected at a depth of 0–30 cm from the soil surface. The soil nutrient content test methods were as follows: the potassium dichromate method was used to determine the soil organic matter (SOM) content; the perchloric acid-sulfuric acid digestion method was used to determine the soil total nitrogen (TN); the molybdenum antimony colorimetric method was used to determine the total phosphorus (TP) and available phosphorus (AP); the atomic absorption method was used to determine the soil total potassium (TK) and soil available potassium (AK); and the AA3 continuous flow analyzer was used to determine the soil nitrate-nitrogen (NN) and soil ammonia nitrogen (AN).

3. Methods

We used continuous time-series Landsat images to map the spatial distribution of vegetation and surface water. First, the NDVI and Otsu thresholding method were used to extract the spatial distribution of vegetation from 1990 to 2020. Then, the spatial distribution of surface water from 1990 to 2020 were mapped using the AWEI no shadow and the maximum entropy thresholding method. Finally, combined with the UAV data and soil nutrient content data, the impact of surface water on vegetation expansion was analyzed. Figure 2 shows the flowchart of the main steps of this study.

3.1. Identification of Vegetation

Extracting the distribution of vegetation is a useful indicator of the vegetation expansion in a region. First, the NDVI was calculated and the annual NDVI was obtained using the maximum value composite (MVC) method. The Otsu thresholding method was then used to segment the NDVI images and obtain the annual vegetation spatial distribution from 1990 to 2020.

3.1.1. NDVI Calculation

NDVI is the most widely used vegetation index in vegetation remote sensing, which can effectively indicate vegetation growth and vitality. Compared with the enhanced vegetation index (EVI), the NDVI is more sensitive to sparse vegetation distribution. The calculation formula is as follows:
N D V I = ρ n i r ρ r e d ρ n i r + ρ r e d
where ρnir represents the reflectance of the pixel in the near-infrared band, and ρred represents the reflectance of the pixel in the red band. In this study, IDL 8.5 software was used to calculate the NDVI in batches.

3.1.2. Using the MVC Method to Synthesize the Annual NDVI

Using NDVI to analyze the interannual changes in vegetation requires the elimination of “noise” caused by differences in the imaging environment and dynamic changes of the land surface. On the one hand, the growth state of vegetation varies with the seasons, and the NDVI of plants usually reaches a maximum within the peak growth period (June to August). However, the seasonal surface water dynamic change in the study area interferes with the vegetation NDVI variation, and the existence of clouds and cloud shadows also affects the vegetation NDVI. The MVC method is typically used to eliminate the interference of adverse factors in the observation of vegetation NDVI. If there were at least two non-cloud (or cloudless) images available from June to August in a year, the MVC method was used to synthesize the annual NDVI. Based on this, an annual NDVI of 21 years from 1990 to 2020 was obtained.

3.1.3. Extracting the Vegetation Distribution

The Otsu thresholding method, also known as the maximum inter-class variance method, is a commonly used automatic threshold determination method. This method uses the gray value corresponding to the maximum inter-class variance as the threshold for segmenting images. Several studies have demonstrated the high accuracy of this method for extracting vegetation information [31]. Thus, this study used the Otsu thresholding method in IDL 8.5 to extract the distribution of vegetation surrounding the Daliyabuyi Oasis.

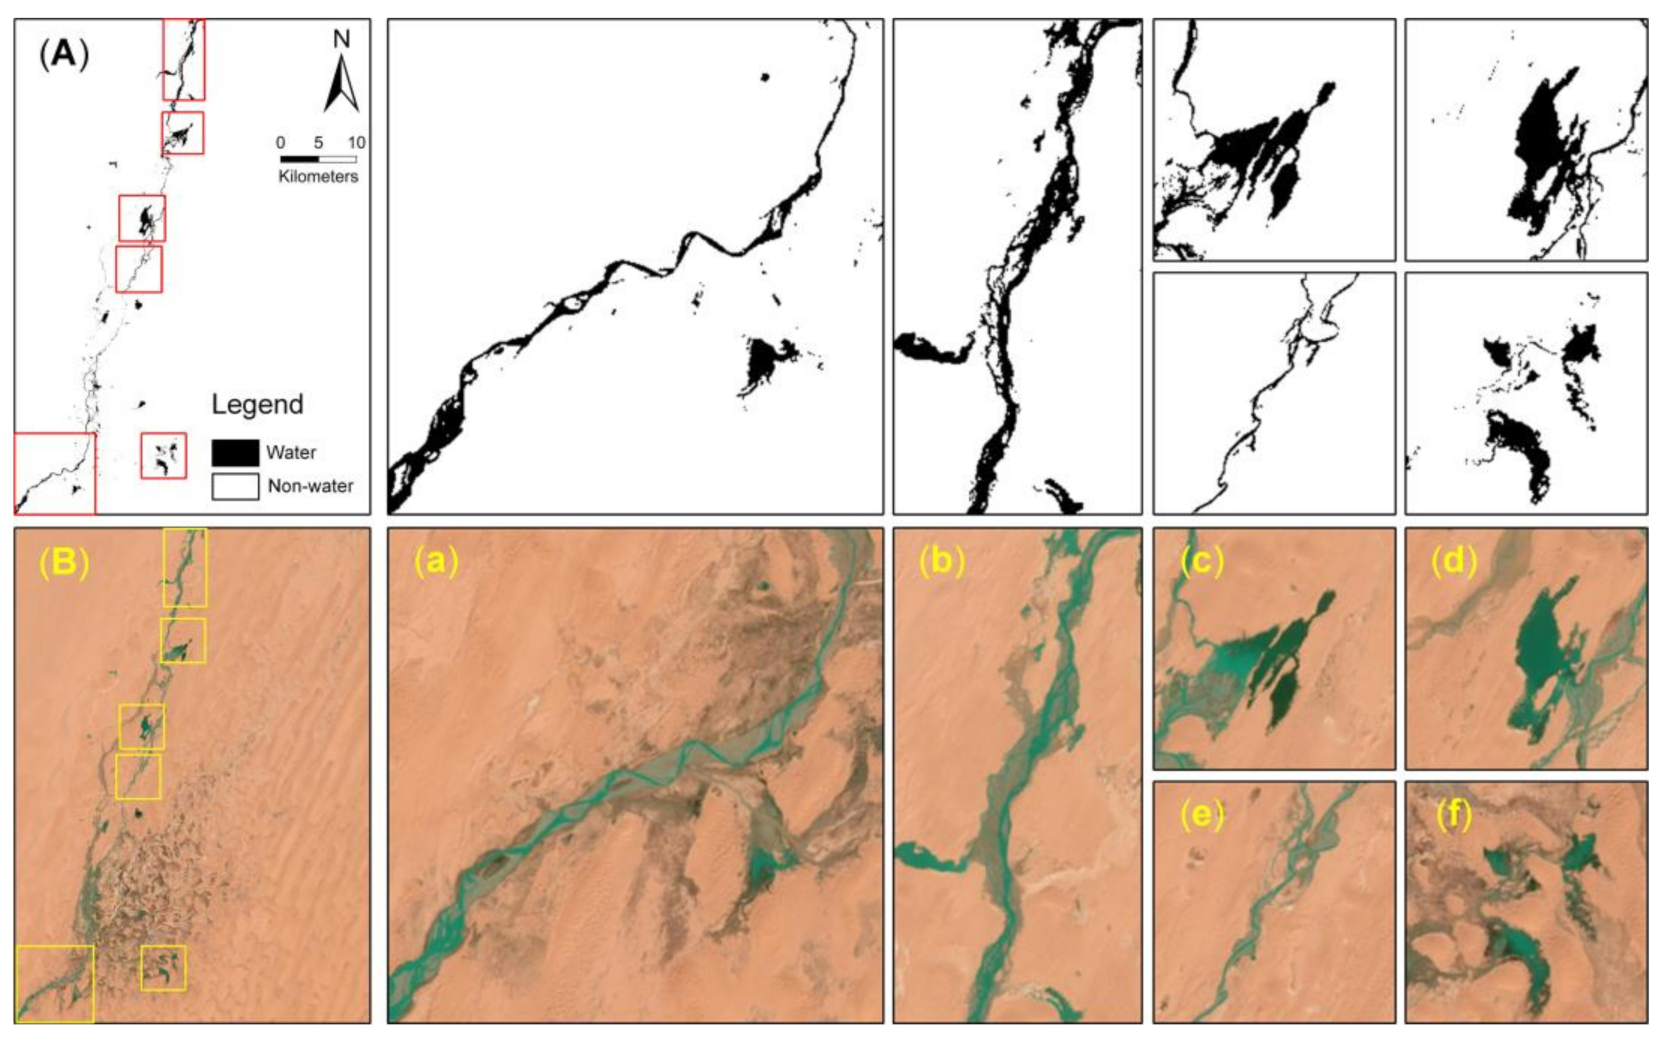
3.2. Mapping Surface Water Distribution

The water index threshold method is a widely used method for mapping surface water distribution, as it can automatically extract water by calculating the water index and segmenting water index images.

3.2.1. Water Index

The AWEI no shadow has a unique advantage in the detection of water body edges and is characterized by a relatively stable threshold, which is beneficial for improving the classification accuracy of water and is suitable for surface water change research. Its formulation is:
AWEI no   shadow = 4 ρ g r e e n ρ s w i r 1 0.25 ρ n i r + 2.75 ρ s w i r 2
where ρgreen is the reflectance of the green band, ρswir1 denotes the reflectance of the swir1 band, ρnir represents the reflectance of the near-infrared band, and ρswir2 is the reflectance of the swir2 band.

3.2.2. Automatic Threshold Determination Method

Owing to the high variation in land cover during the period when different images were obtained, it was difficult to use the same threshold or a single rule to segment the water index image to construct a time-series surface water dataset. Instead, it was necessary to adopt an appropriate automatic thresholding method to calculate the image threshold one by one to extract the surface water distribution. The small proportion of water pixels in the image of the study site increased the difficulty of extracting surface water using an automatic threshold segmentation algorithm. Given the significant advantage of the maximum entropy threshold determination method in extracting small targets [41], this study used this method to segment water index images to effectively map the spatial distribution of surface water.

3.3. Accuracy of Surface Water Extraction

Five verification plots were selected from the image (Figure 3), and each verification plot randomly generated 100 pixels. The visual interpretation method was then used to determine the category of the pixel to obtain the reference data. Based on the classification data and reference data, a confusion matrix was constructed, and the user’s accuracy (UA), producer’s accuracy (PA), overall accuracy (OA), and F1-score were calculated to evaluate the accuracy of surface water extraction. The results showed that the PA, UA, and F1-score of the water extraction were 85.15%, 92.47%, and 88.66%, respectively (Table 2). This indicates that the AWEI no shadow and the maximum entropy threshold determination method were effective in extracting the distribution of surface water.

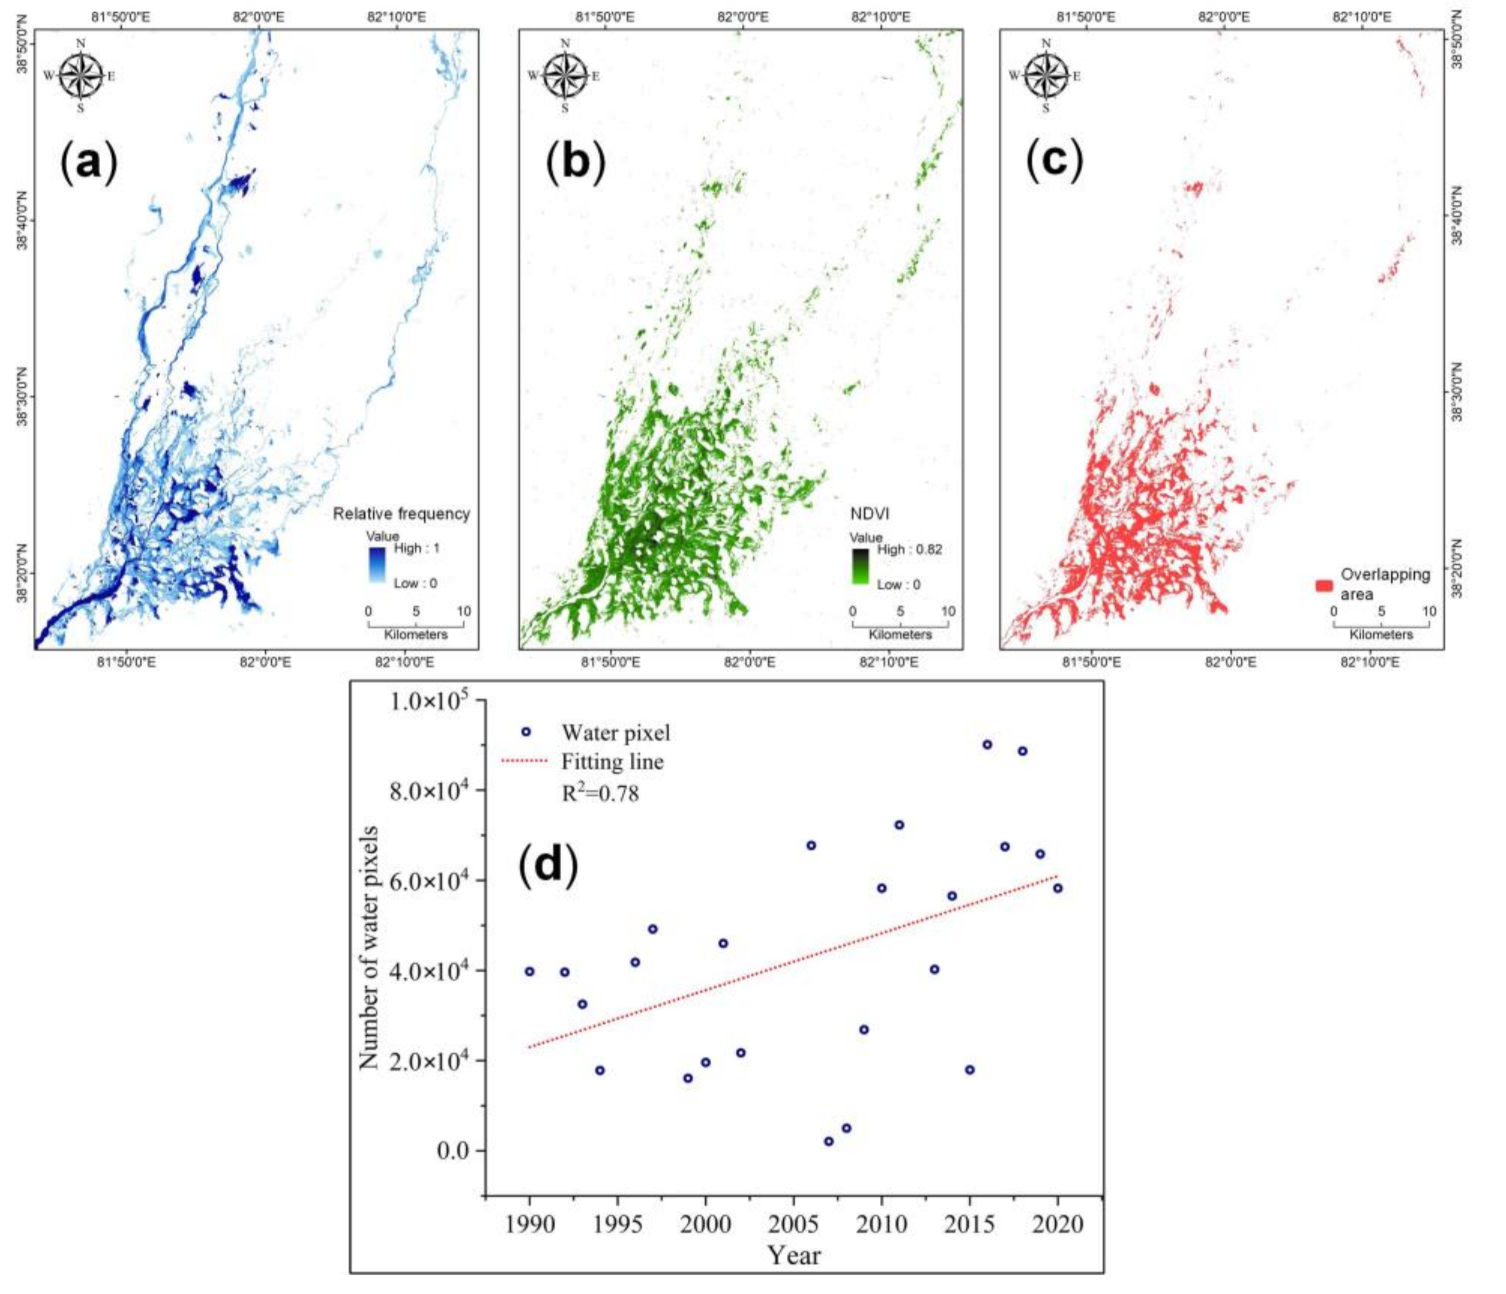
3.4. Relative Frequency of Surface Water Distribution

Based on the 148 images of surface water distribution (the 42 images contaminated by clouds were discarded to maximize extraction accuracy), we calculated the following: (1) the annual surface water distribution from 1990 to 2020, and (2) the relative frequency of surface water from 1990 to 2020. Relative frequency of surface water was defined as the number of times a pixel was flagged as flooded divided by the number of cloud-free observations per pixel; it was expressed as ranging from 0 to 100% [42].

4. Results

4.1. Temporal and Spatial Distribution of Vegetation and Surface Water

Changes in the number of vegetation pixels directly indicated changes in the oasis area. The number of oasis vegetation pixels showed an increasing trend. Overall, the area of oasis vegetation increased throughout the study period, with expansion being observed predominately in the west, east, and south of the oasis, whereas vegetation degradation was observed north of the tail of the oasis, an area to which surface water rarely extends. An analysis of the number of annual water pixels from 1990 to 2020 revealed an expansion in the surface water coverage. Moreover, the surface water distribution area was mainly concentrated in the west, middle, and southeast of the oasis. Using the MVC method to synthesize the 190 NDVI images and obtain an NDVImvc image, we adopted the Otsu thresholding method to segment the NDVImvc image to extract the vegetation distribution range from 1990 to 2020. The union of the 148 images from the water classification analysis was taken as the water distribution range from 1990 to 2020. Then, the overlapping area of surface water coverage and vegetation distribution range from 1990 to 2020 was extracted. The results show that during this period, the number of water and vegetation pixels in the distribution range in the oasis was 314,975 and 264,560, and the number of pixels in the overlap range of water and vegetation was 170,493. These results indicate that surface water flows in 64.61% of the area of vegetation distribution, and vegetation grows in 54.27% of the area of water coverage. The spatial coverage range of surface water from 1990 to 2020 was consistent with the spatial distribution of vegetation, and the water-rich area was consistent with the distribution of lush vegetation.

4.2. Effects of Surface Water on Vegetation Expansion

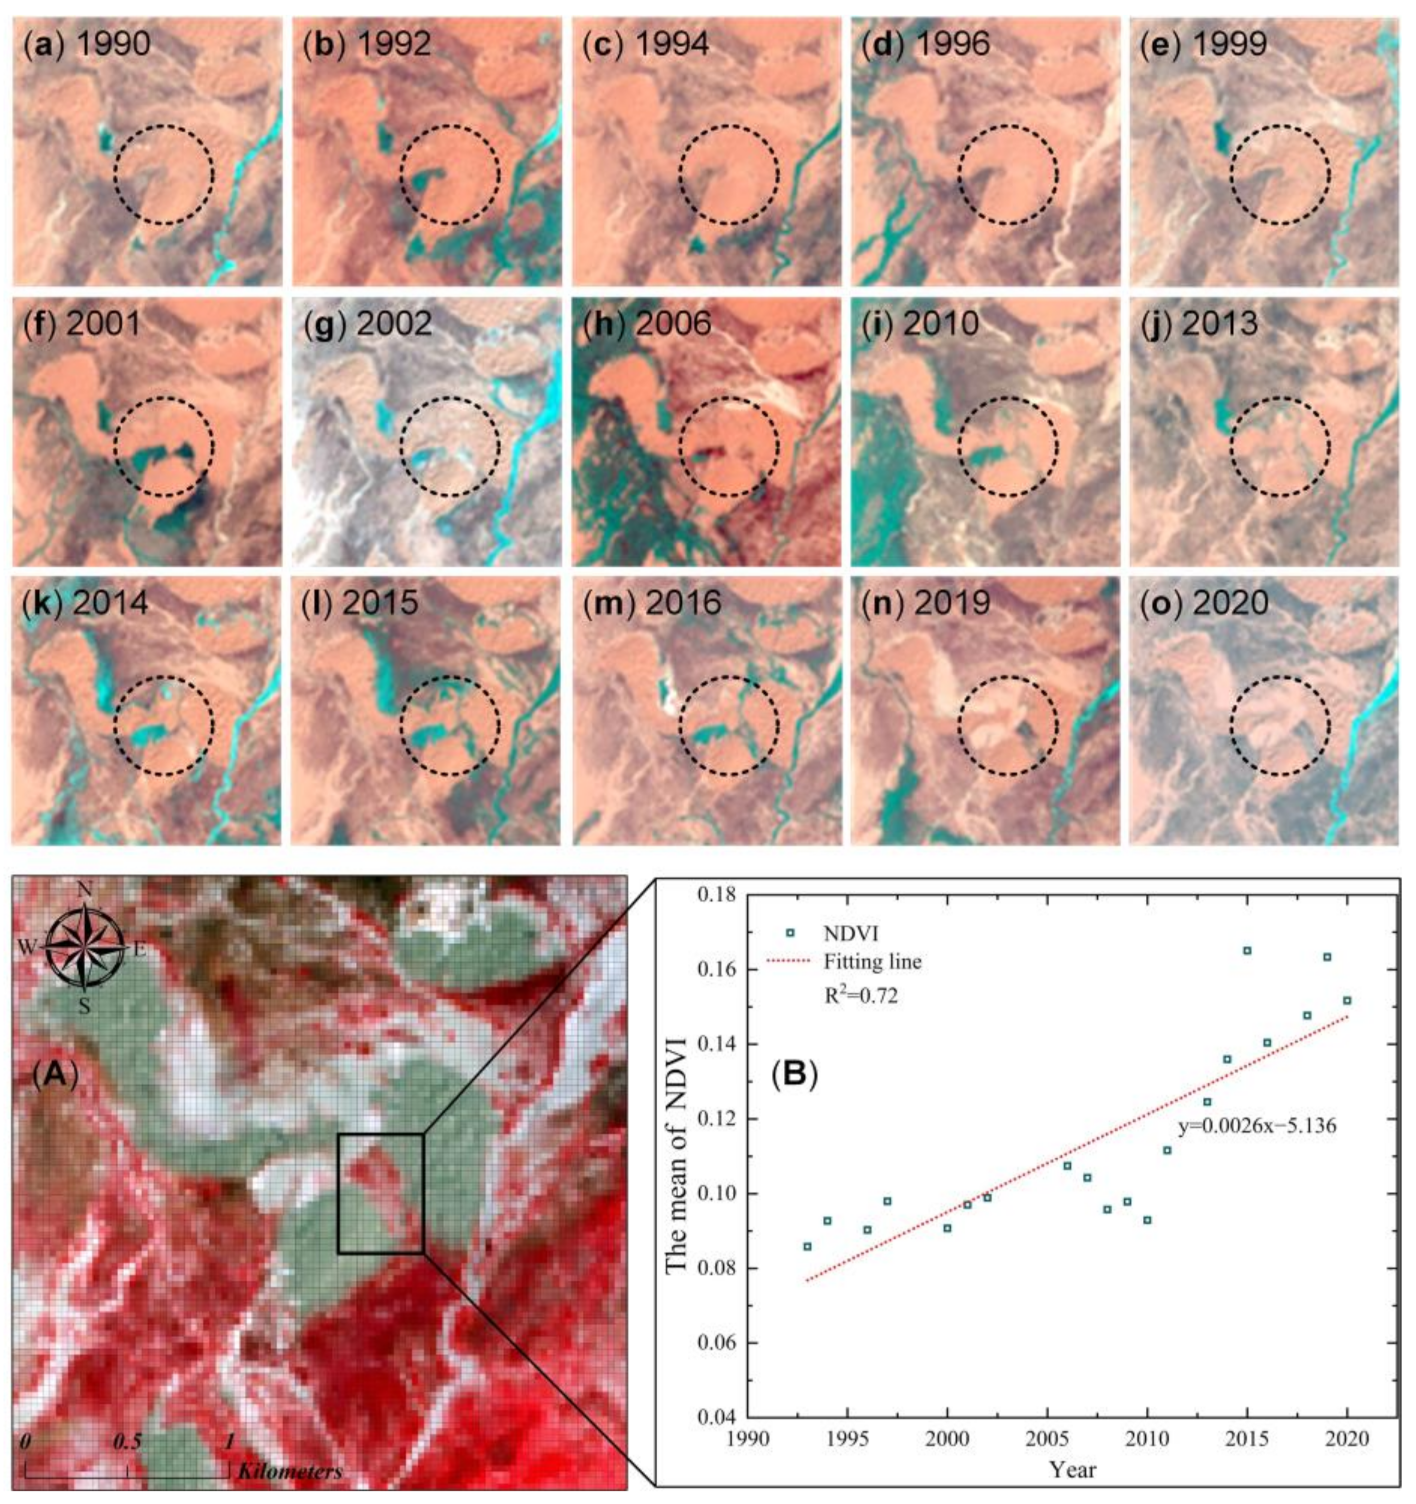
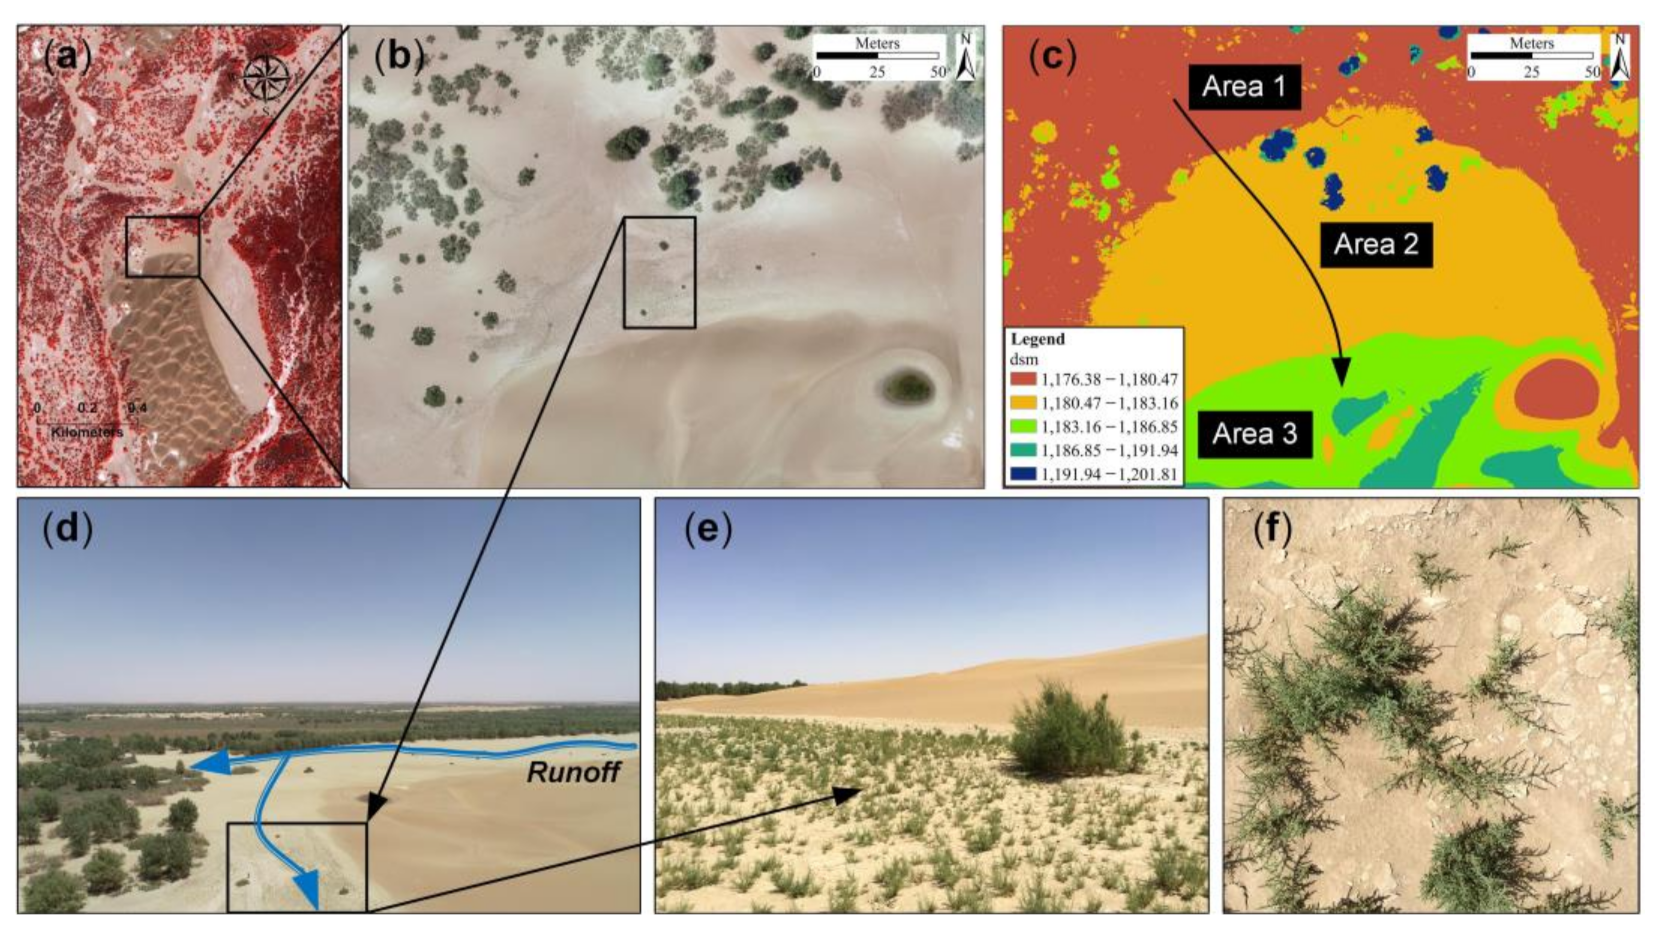
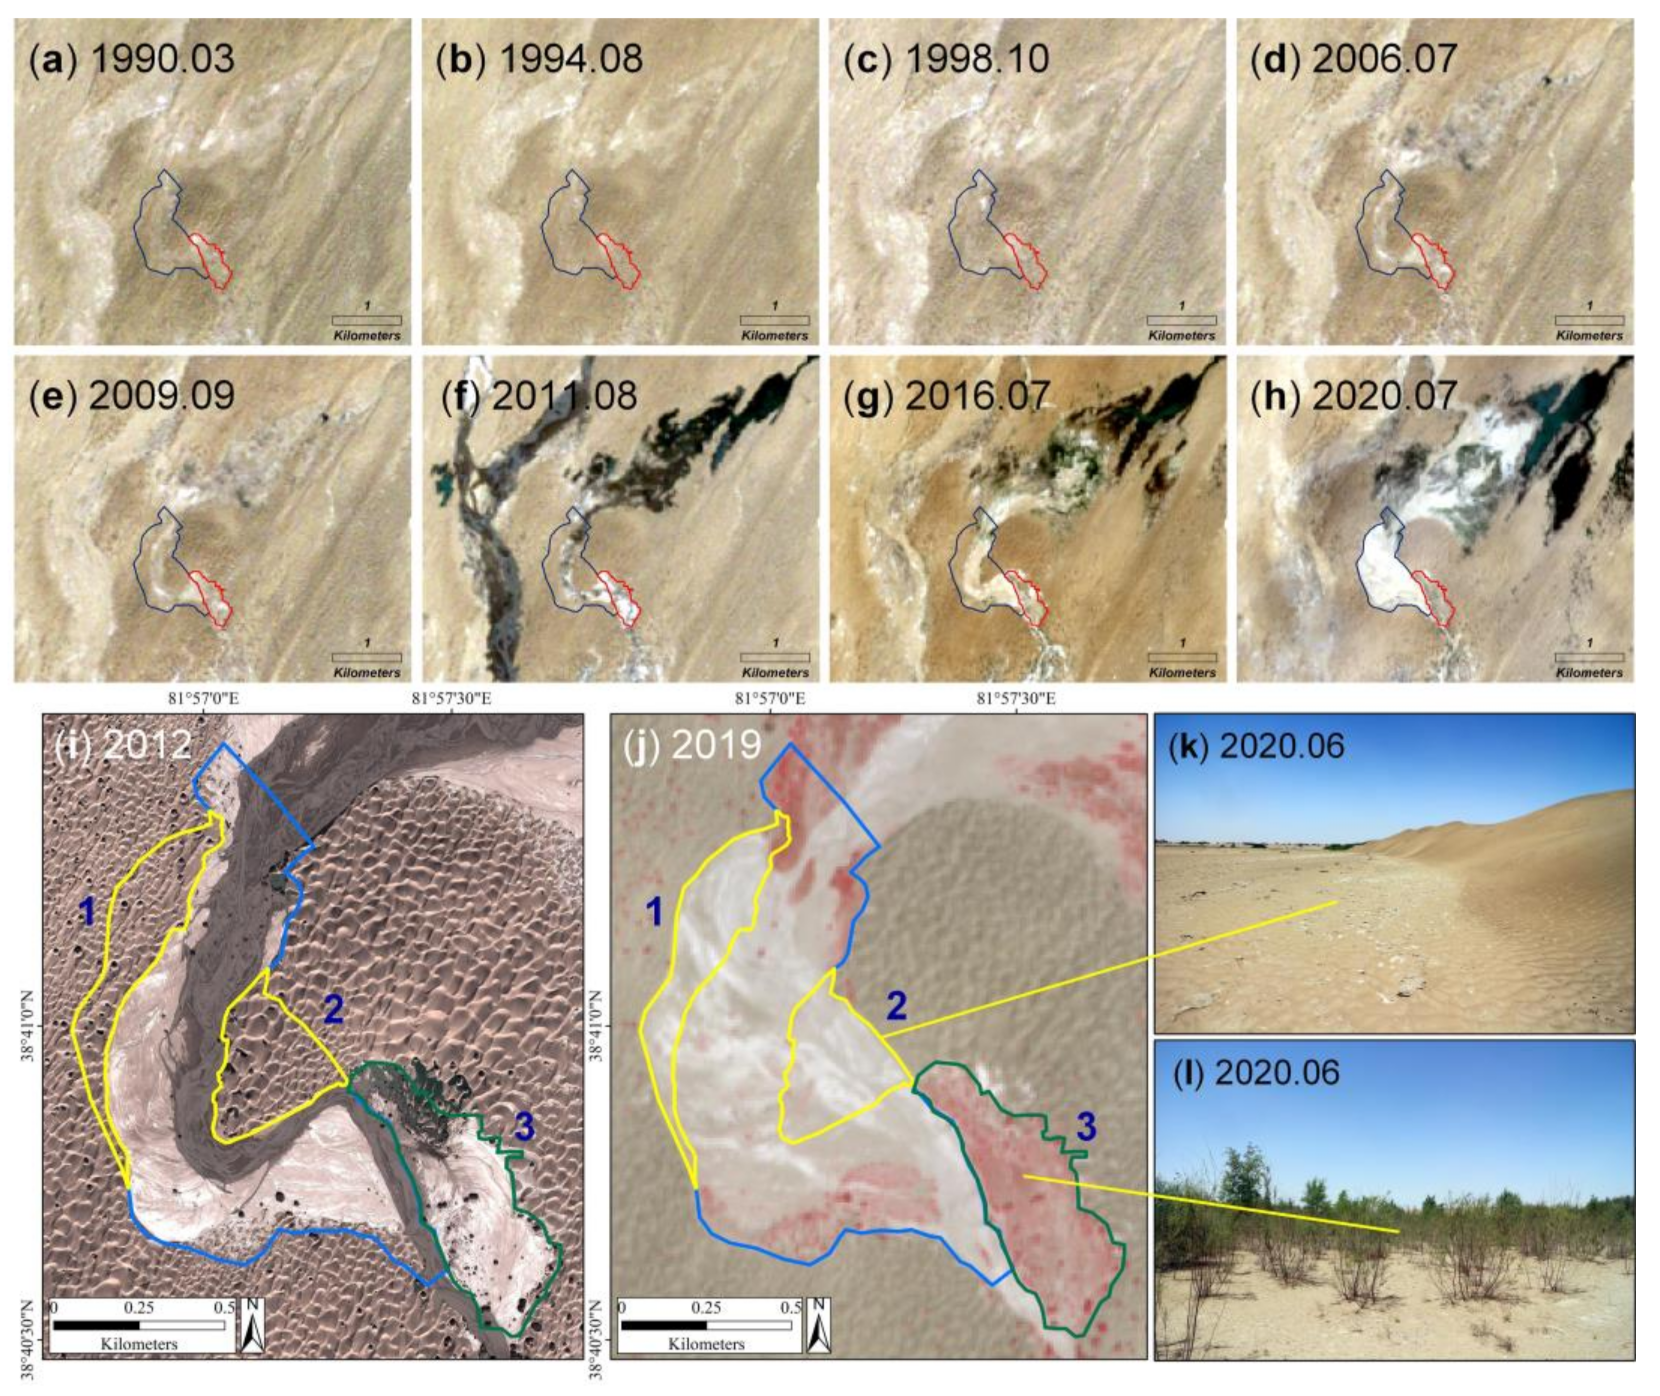
4.2.1. Landform Changes

The deposition process is difficult to observe, and the vegetation in the river channel is mainly distributed on the batture above the water surface. Therefore, we chose the batture in the river channel (plot A,B), and used the change of vegetation distribution (area) to indicate the dynamic of the batture for analyzing the deposition process (Figure 4 and Figure 5).
  • Sediment deposition
Comparing the annual NDVI images of different years, it was found that the batture area in the river channel increased significantly, indicating that the deposition process increased during the study period. As shown in plot A (Figure 6), the batture was located in the middle of the river channel in 1993, with an area of approximately 6.93 hm2. For the remainder of the study period, the batture area increased, and the river channel width gradually narrowed. By 2020, the batture area was 18.63 hm2, 2.7 times greater than that in 1993. As shown in plot B (Figure 6), in 1993, a small amount of vegetation was distributed throughout the batture. From 1993 to 2020, the batture area gradually increased and moved toward the right bank of the river channel. By 2020, the batture was already connected to the land of the right bank.
2.
Erosion of sand dunes by surface water
Plot C and plot F are located near the river channel, where seasonal floods occur often. The landform of these plots obviously change due to the erosion of surface water. Thus, we chose plot C and plot F to reveal the erosion effect of surface water on sand dunes.
  • Sand dune cut-off
In the river channels in plot C (Figure 7), when the surface water was abundant it flowed into the desert, constantly eroding the dunes and cutting the dune chain. Over time, the large dune chain gradually fragmented, and the desert near the river channels gradually flattened into the floodplain. In Figure 7, the area marked with a black dotted line represents a connected dune chain that occurred from 1990 to 1999. During this period, the scouring capacity of the surface water was weak, and there was no significant change in the dune chain. However, since 2001, surface water has often extended to this area, significantly accelerating the change in desert landforms in this region. Moreover, the images after 2010 indicate the formation of a stable flow channel. From 2010 to 2015, the flow completely cut the linked dune chains in the central area into different areas. During the period from 2016 to 2020, the floodplain area expanded rapidly, plants continued to be established, and the surface NDVI increased gradually. As shown in Figure 7, the NDVI of the marked region in 1990 was approximately 0.09, which was the same as that of bare land, indicating there was almost no vegetation distributed in this area during this period. However, by 2020, the NDVI of the region had increased to approximately 0.15.
b.
Flattening of low dunes
The plot shown in Figure 8 is near the river west of the oasis. The plot was covered by sand in 1990, and the surface water reached the plot in approximately 2002. Since 2010, the magnitude of surface water has increased significantly. The dunes on both sides of the river channel (the marked area) were eroded by surface water and changed to a floodplain. The floodplain continued to expand, and vegetation began to be established for the remainder of the study period. By comparing the Google image in 2012 with the Sentinel-2 image in 2019 (Figure 8), it was found that in 2012, areas 1 and 2 were originally dunes with areas of 12 hm2 and 11 hm2, respectively. After 2012, the dunes were eroded and shifted by seasonal floods, and gradually flattened into a floodplain over seven years. In area 3, there was almost no vegetation cover, except for several T. chinensis plants in the floodplain in 2012. By 2019, the distribution of young P. euphratica and T. chinensis increased significantly. It can also be seen that the dunes were leveled into floodplains under the action of hydraulic power. Once a floodplain has developed, water accessibility is guaranteed, and vegetation can be successfully established.

4.2.2. Analysis of Plant Seedling Colonization Process

Plot D and plot E are typical landform change areas. After landform change, vegetation can colonize rapidly. Therefore, we used the images of plot D and plot E to show the process of landform change and vegetation expansion.
Plot D, shown in Figure 9, is near the river in the middle of the oasis. In 1990, the northern and southern dunes were connected. However, surface water erosion gradually increased the area of the floodplain and eroded the dunes. By 2016, the dunes had been eroded into two parts, and the area of the river beach had begun to expand rapidly. Comparing the images from 2016 to 2020, after the dunes were leveled, plants colonized the newly formed floodplain, and many T. chinensis seedlings occupied this area.
Plot E in Figure 10 indicates the plant expansion process, whereby dunes were gradually transformed into a floodplain from surface water erosion and deposition, providing the ideal environment for the growth of T. chinensis seedlings. The size of image (a) is 250 m × 200 m. Density segmentation was performed on the DSM of image (a) (Figure 10), and the DSM image was divided into three regions according to the value of the DSM. The elevation of areas 1 and 2 ranged from 1176.4 m to 1180.8 m and from 1180.8 m to 1183.2 m, respectively, and P. euphratica and T. chinensis were distributed in areas 1 and 2. The elevation of area 3 exceeded 1183.2 m, and the area was covered with sand. From area 1 to area 3 (indicated by the arrow), the elevation gradually increased, and the vegetation distribution reduced, with T. chinensis seedlings distributed between areas 2 and 3. It is also evident from plot E that the plants expanded from area 1 to area 2, and then gradually expanded to area 3. Comparing Figure 10a and Figure 10b, the boundary between areas 3 and 2 is the edge of the dune; that is, the boundary is the baseline of the dunes eroded by surface water. Therefore, it can be inferred that area 2 was once covered by dunes. However, under the effects of surface water erosion, area 2 gradually evolved into a floodplain, which became the colonization site of the T. chinensis seedlings.

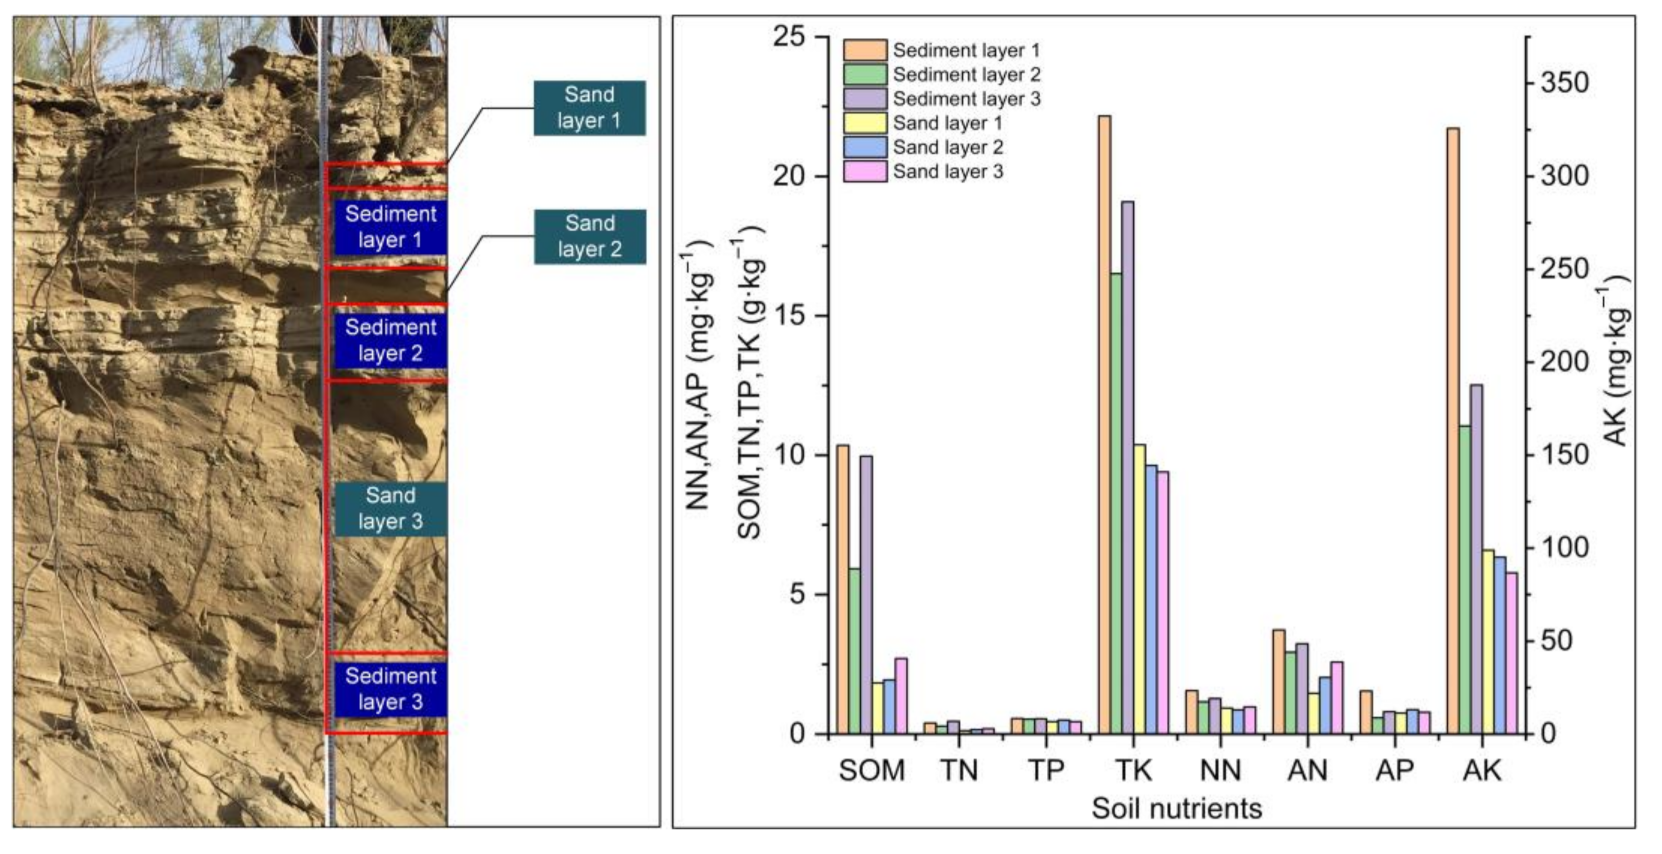
4.3. Soil Nutrient Analysis

Soil samples were collected from the plots to analyze the differences in soil nutrients between the river sediments and sand. Plot 1 (Figure 11), a soil profile formed by river erosion that records the formation process of the aeolian sedimentary layer (sand) and aqueous sedimentary layer (soil), is situated east of the oasis. The height of the exposed part of the soil profile was approximately 184 cm. From top to bottom, the sand and fluvial sediment layers appear alternately. As shown in Figure 11, the thicknesses of sand layers 1, 2, and 3 were 6 cm, 10 cm, and 70 cm, respectively, and the thicknesses of fluvial sediment layers 1, 2, and 3 were 20 cm, 16 cm, and 16 cm, respectively. The soil nutrient analysis revealed that the nutrient content of the river sediments was significantly higher than that of the sand layer. Moreover, the sediment SOM content was four times that of the sand layer, and the sediment TN, TP, and AP contents were approximately two times that of the sand layer.
Plot 2 (Figure 12) is near the lake at the end of the river to the west of the oasis, and records the process of geomorphic change and vegetation colonization. Five soil samples were collected from this plot. Sample 1 was river sediment obtained from near the lake, sample 2 was a mixture of river sediment and sand collected from the floodplain where young P. euphratica and T. chinensis were distributed, sample 3 was a sand sample collected from the dune, soil sample 4 was sand collected from a non-vegetated floodplain, and sample 5 was a mixture of river sediment and sand collected from the floodplain where the P. euphratica and T. chinensis were distributed. The results showed that the contents of SOM, TN, TP, and AP in the river sediments were significantly higher than those in the other samples. The SOM of the river sediments was approximately 3–5 times that of the other samples, and the TN content was approximately four times that of the other samples. Moreover, the AN content in sample 5, the mixture of river sediment and sand in the distribution area of P. euphratica and T. chinensis, was significantly higher than that in the floodplain without vegetation, but lower than that in the river sediment.

5. Discussion

Landform changes and vegetation expansion driven by surface water is a long-term and discontinuous process, which is difficult to record at the same site in the same category of remote sensing images. Therefore, in this study, based on multi-scale datasets composed of Landsat time-series images, UAV images, and ground images, we selected several typical sites to demonstrate the landscape changes under the influence of surface water, and then analyzed the impact of surface water on the process of vegetation expansion at the landscape scale.
The influence of surface water on geomorphology manifests primarily as the erosion of the desert by water flow and the deposition process of river sediment. The erosion process (i.e., the transformation process from the desert to the floodplain) can be identified by detecting the land cover change in the remote sensing images, whereas the deposition process is difficult to identify directly by the land cover change. Because the vegetation in the river channel was mainly distributed on the batture above the water surface, deposition process in the river channel could be identified by analyzing the long-term vegetation changes. Analysis based on annual NDVI images indicated that the area of the batture in the river channel has expanded. The main reason for this expansion is the loose soil structure of the desert and the increased vulnerability of soil to erosion in the upper reaches of the river. Moreover, the elevation in the lower reaches of the Keriya River is approximately 1100–1300 m, the slope is 1–1.5‰, and the river water is muddy during the flood season [43]. Previous studies have shown that the average annual sediment discharge of the Keriya River is approximately 3.51 × 10⁴ t [44]. In the tail area of the river, the flow velocity reduces, and the sediment deposits, thereby increasing the batture area.
Vegetation expansion mainly occurs in the floodplain, and the erosion of the surface water can drive the transformation from desert to floodplain, which is an important premise for vegetation expansion. The appropriate water and soil conditions of the floodplain are favorable for seed germination and seedling survival, making it a potential colonization site for desert plants [15]. Moreover, water leveling of the dunes ensures the accessibility of surface water, which carries the river sediment and transports nutrients to the barren sand, changing the dunal environment into a floodplain one. The increase in the floodplain area indicates the expansion of potential plant colonization sites. Aeolian sedimentation is another important external force shaping desert landforms. Surface water has a positive effect on vegetation expansion, whereas the aeolian sedimentation process curbs vegetation expansion. In the Taklimakan Desert, which is affected by northeast and northwest winds, the dunes move southward [45]. The annual movement speed of low dunes in the Daliyabuyi Oasis is approximately 3–5 m, and the annual movement speed of tall dunes is less than 1 m [44].
Our study site was located in the hinterland of the desert, which is less disturbed by human activities, and there are no artificial forests or crops in the oasis. Natural vegetation changes are mainly controlled by natural environmental factors. Moreover, the land cover in the oasis is relatively simple. Therefore, the oasis served as an ideal site for exploring the process of vegetation expansion [2]. The novel feature of this study is that we used long time-series and multi-scale remote sensing data to reconstruct the vegetation expansion under the influence of surface water in the desert. The influence of surface water on vegetation expansion was analyzed from three aspects: landform changes, plant seedling colonization, and soil nutrients. This study will facilitate an in-depth understanding of the influence of surface water on the vegetation expansion process in desert areas, which will be beneficial for the restoration of desert vegetation and sustainable management of oases. The limitation of this study is that the surface water regime includes five key aspects: timing, frequency, magnitude, duration, and rate of change [46,47,48]. However, owing to the harsh climate and poor accessibility, it is difficult to conduct in situ observations. Obtaining the relevant quantitative observation data of the surface water regime and establishing the quantitative relationship between the surface water regime and vegetation expansion will be the focus of future research.

6. Conclusions

Because of the significant influence of surface water on vegetation expansion in desert areas, this study selected a typical oasis and explored the influence of surface water on the process of desert vegetation expansion on a landscape scale using remote sensing images. The results show that landform changes driven by surface water are the leading conditions for triggering vegetation expansion in the Daliyabuyi Oasis. The effects of surface water on vegetation expansion can be summarized as follows:
  • Changing the landform near the river channel, the surface water drives the transformation of the dune near the river to the floodplain, providing a potential colonization site for plant seedlings;
  • Surface water indirectly affects water redistribution by changing the landform. The formation of the floodplain ensures the accessibility of surface water and provides a relatively stable water supply for vegetation growth;
  • Surface water provides soil nutrients for the floodplain; thus, the river sediments are rich in soil nutrients, such as organic matter, nitrogen, and phosphorus, and are the main sources of soil nutrients in the floodplain.

Supplementary Materials

The following are available online at https://www.mdpi.com/article/10.3390/su13179522/s1, Table S1: The acquisition date of Landsat images used in this paper.

Author Contributions

Conceptualization, H.L. and Q.S.; methodology, H.L. and Q.S.; investigation, H.L. and Y.W.; formal analysis, H.L. and H.S.; resources, Q.S.; writing—original draft, H.L.; writing—review and editing, B.I. and Q.S. All authors have read and agreed to the published version of the manuscript.

Funding

The authors thank the National Natural Science Foundation of China (NSFC, U1703237) for the financial support.

Institutional Review Board Statement

Not applicable.

Informed Consent Statement

Not applicable.

Data Availability Statement

No new data were created or analyzed in this study. Data sharing was not applicable to this study.

Conflicts of Interest

The authors declare no conflict of interest.

References

  1. Ding, C.; Huang, W.; Li, Y.; Zhao, S.; Huang, F. Nonlinear Changes in Dryland Vegetation Greenness over East Inner Mongolia, China, in Recent Years from Satellite Time Series. Sensors 2020, 20, 3839. [Google Scholar] [CrossRef]
  2. Yang, X. The oases along the Keriya River in the Taklamakan Desert, China, and their evolution since the end of the last glaciation. Environ. Geol. 2001, 41, 314–320. [Google Scholar] [CrossRef]
  3. Venter, Z.S.; Scott, S.L.; Desmet, P.G.; Hoffman, M.T. Application of Landsat-derived vegetation trends over South Africa: Potential for monitoring land degradation and restoration. Ecol. Indic. 2020, 113, 106206. [Google Scholar] [CrossRef]
  4. Srivastava, A.; Saco, P.M.; Rodriguez, J.F.; Kumari, N.; Chun, K.P.; Yetemen, O. The role of landscape morphology on soil moisture variability in semi-arid ecosystems. Hydrol. Process. 2021, 35, 13990. [Google Scholar] [CrossRef]
  5. Maza, M.; Srivastava, A.; Bisht, D.S.; Raghuwanshi, N.S.; Bandyopadhyay, A.; Chatterjee, C.; Bhadra, A. Simulating hydrological response of a monsoon dominated reservoir catchment and command with heterogeneous cropping pattern using VIC model. J. Earth Syst. Sci. 2020, 129, 200. [Google Scholar] [CrossRef]
  6. Hutchins, R.B.; Blevins, R.L.; Hill, J.D.; White, E.H. The influence of soils and microclimate on vegetation of forested slopes in eastern kentucky. Soil Sci. 1976, 121, 234–241. [Google Scholar] [CrossRef]
  7. Florinsky, I.; Kuryakova, G. Influence of topography on some vegetation cover properties. Catena 1996, 27, 123–141. [Google Scholar] [CrossRef]
  8. Yetemen, O.; Istanbulluoglu, E.; Flores-Cervantes, J.H.; Vivoni, E.R.; Bras, R.L. Ecohydrologic role of solar radiation on landscape evolution. Water Resour. Res. 2015, 51, 1127–1157. [Google Scholar] [CrossRef]
  9. Kumari, N.; Srivastava, A.; Dumka, U.C. A Long-Term Spatiotemporal Analysis of Vegetation Greenness over the Himalayan Region Using Google Earth Engine. Climate 2021, 9, 109. [Google Scholar] [CrossRef]
  10. Shaw, J.R.; Cooper, D.J. Linkages among watersheds, stream reaches, and riparian vegetation in dryland ephemeral stream networks. J. Hydrol. 2008, 350, 68–82. [Google Scholar] [CrossRef]
  11. Vesipa, R.; Camporeale, C.; Ridolfi, L. Effect of river flow fluctuations on riparian vegetation dynamics: Processes and models. Adv. Water Resour. 2017, 110, 29–50. [Google Scholar] [CrossRef] [Green Version]
  12. Guo, H.; Jiapaer, G.; Bao, A.; Li, X.; Huang, Y.; Ndayisaba, F.; Meng, F. Effects of the Tarim River’s middle stream water transport dike on the fractional cover of desert riparian vegetation. Ecol. Eng. 2017, 99, 333–342. [Google Scholar] [CrossRef]
  13. Xu, M.; Chen, Y.; Liu, J.; Wang, D.; Liu, Y. The distribution pattern dynamics of Populus euphratica are influenced by hydrology in the middle reaches of Tarim River. Acta Ecol. Sin. 2016, 36, 2646–2655. [Google Scholar]
  14. Webb, R.H.; Leake, S.A. Ground-water surface-water interactions and long-term change in riverine riparian vegetation in the southwestern United States. J. Hydrol. 2006, 320, 302–323. [Google Scholar] [CrossRef]
  15. Shafroth, P.B.; Schlatter, K.J.; Gomez-Sapiens, M.; Lundgren, E.; Grabau, M.R.; Ramírez-Hernández, J.; Rodríguez-Burgueño, J.E.; Flessa, K.W. A large-scale environmental flow experiment for riparian restoration in the Colorado River Delta. Ecol. Eng. 2017, 106, 645–660. [Google Scholar] [CrossRef]
  16. Schlatter, K.J.; Grabau, M.R.; Shafroth, P.B.; Zamora-Arroyo, F. Integrating active restoration with environmental flows to improve native riparian tree establishment in the Colorado River Delta. Ecol. Eng. 2017, 106, 661–674. [Google Scholar] [CrossRef]
  17. Chen, Y.; Pang, Z.; Chen, Y.; Li, W.; Xu, C.; Hao, X.; Huang, X.; Huang, T.; Ye, Z. Response of riparian vegetation to water-table changes in the lower reaches of Tarim River, Xinjiang Uygur, China. Hydrogeol. J. 2008, 16, 1371–1379. [Google Scholar] [CrossRef]
  18. Chen, Y.; Li, W.; Chen, Y.; Zhou, H.; Hao, X.; Zhu, C. Water Use Process of Constructive Plants in Desert Riparian Forest. Arid Zone Res. 2018, 35, 130–136. [Google Scholar] [CrossRef]
  19. Zheng, Y.; Jiao, P.; Zhao, Z.; Li, Z. Clonal growth of Populus Pruinosa Schrenk and its role in the regeneration of riparian forests. Ecol. Eng. 2016, 94, 380–392. [Google Scholar] [CrossRef]
  20. Halik, Ü.; Aishan, T.; Betz, F.; Kurban, A.; Rouzi, A. Effectiveness and challenges of ecological engineering for desert riparian forest restoration along China’s largest inland river. Ecol. Eng. 2019, 127, 11–22. [Google Scholar] [CrossRef]
  21. Liu, G.; Kurban, A.; Duan, H.; Halik, Ü.; Ablekim, A.; Zhang, L. Desert riparian forest colonization in the lower reaches of Tarim River based on remote sensing analysis. Environ. Earth Sci. 2014, 71, 4579–4589. [Google Scholar] [CrossRef]
  22. Bornette, G.; Tabacchi, E.; Hupp, C.; Puijalon, S.; Rostan, J.C. A model of plant strategies in fluvial hydrosystems. Freshw. Biol. 2008, 53, 1692–1705. [Google Scholar] [CrossRef] [Green Version]
  23. Stromberg, J.C.; Tluczek, M.G.F.; Hazelton, A.F.; Ajami, H. A century of riparian forest expansion following extreme disturbance: Spatio-temporal change in Populus/Salix/Tamarix forests along the Upper San Pedro River, Arizona, USA. For. Ecol. Manag. 2010, 259, 1181–1189. [Google Scholar] [CrossRef]
  24. Lytle, D.A.; Merritt, D.M. Hydrologic regimes and riparian forests: A structured population model for cottonwood. Ecology 2004, 85, 2493–2503. [Google Scholar] [CrossRef] [Green Version]
  25. Cao, D.; Li, J.; Huang, Z.; Baskin, C.C.; Baskin, J.M.; Hao, P.; Zhou, W.; Li, J. Reproductive Characteristics of a Populus euphratica Population and Prospects for Its Restoration in China. PLoS ONE 2012, 7, e39121. [Google Scholar] [CrossRef] [Green Version]
  26. Hopley, T.; Byrne, M. Connectivity in riparian plants: Influence of vegetation type and habitat fragmentation overrides water flow. Oecologia 2018, 188, 465–478. [Google Scholar] [CrossRef] [PubMed]
  27. Jarchow, C.J.; Nagler, P.L.; Glenn, E.P. Greenup and evapotranspiration following the Minute 319 pulse flow to Mexico: An analysis using Landsat 8 Normalized Difference Vegetation Index (NDVI) data. Ecol. Eng. 2017, 106, 776–783. [Google Scholar] [CrossRef]
  28. Hill, M. Vegetation index suites as indicators of vegetation state in grassland and savanna: An analysis with simulated SENTINEL 2 data for a North American transect. Remote Sens. Environ. 2013, 137, 94–111. [Google Scholar] [CrossRef]
  29. Walker, J.J.; Soulard, C.E.; Petrakis, R.E. Integrating stream gage data and Landsat imagery to complete time-series of surface water extents in Central Valley, California. Int. J. Appl. Earth Obs. Geoinform. 2020, 84, 101973. [Google Scholar] [CrossRef]
  30. Dube, T.; Mutanga, O. Evaluating the utility of the medium-spatial resolution Landsat 8 multispectral sensor in quantifying aboveground biomass in uMgeni catchment, South Africa. ISPRS J. Photogramm. Remote Sens. 2015, 101, 36–46. [Google Scholar] [CrossRef]
  31. Seaton, D.; Dube, T.; Mazvimavi, D. Use of multi-temporal satellite data for monitoring pool surface areas occurring in non-perennial rivers in semi-arid environments of the Western Cape, South Africa. ISPRS J. Photogramm. Remote Sens. 2020, 167, 375–384. [Google Scholar] [CrossRef]
  32. Rouse, J.; Haas, R.; Schell, J.; Deering, D.; Harlan, J. Monitoring the Vernal Advancement and Retrogradation (Green Wave Effect) of Natural Vegetation; Final Report; NASA/GSFC Type III: Greenbelt, MD, USA, 1974. [Google Scholar]
  33. Tucker, C.J. Red and photographic infrared linear combinations for monitoring vegetation. Remote Sens. Environ. 1979, 8, 127–150. [Google Scholar] [CrossRef] [Green Version]
  34. Kumari, N.; Saco, P.M.; Rodriguez, J.F.; Johnstone, S.A.; Srivastava, A.; Chun, K.P.; Yetemen, O. The Grass Is Not Always Greener on the Other Side: Seasonal Reversal of Vegetation Greenness in Aspect-Driven Semiarid Ecosystems. Geophys. Res. Lett. 2020, 47, e2020GL088918. [Google Scholar] [CrossRef]
  35. Otsu, N. A Threshold Selection Method from Gray-Level Histograms. IEEE Trans. Syst. Man Cybern. 1979, 9, 62–66. [Google Scholar] [CrossRef] [Green Version]
  36. Feyisa, G.L.; Meilby, H.; Fensholt, R.; Proud, S. Automated Water Extraction Index: A new technique for surface water mapping using Landsat imagery. Remote Sens. Environ. 2014, 140, 23–35. [Google Scholar] [CrossRef]
  37. Kapur, J.N.; Sahoo, P.K.; Wong, A.K.C. A new method for gray-level picture thresholding using the entropy of the histogram. Comput. Vision Graph. Image Process. 1985, 29, 273–285. [Google Scholar] [CrossRef]
  38. Shi, H.; Shi, Q.; Zhou, X.; Imin, B.; Li, H.; Zhang, W.; Kahaer, Y. Effect of the competition mechanism of between co-dominant species on the ecological characteristics of Populus euphratica under a water gradient in a desert oasis. Glob. Ecol. Conserv. 2021, 27, e01611. [Google Scholar] [CrossRef]
  39. Hao, L.; Qingdong, S.; Imin, B.; Kasim, N. Methodology for optimizing quadrat size in sparse vegetation surveys: A desert case study from the Tarim Basin. PLoS ONE 2020, 15, e0235469. [Google Scholar] [CrossRef]
  40. Shi, Q.; Guo, Y.; Zhou, X. Machanism of the influence of surface water and groundw-ater on vegetation pattern in Daliyaboyi oasis at the tail of Keriya river in Taklamakan deser. J. Xin-Jiang Univ. (Nat. Sci. Ed.) 2019, 36, 253–259. [Google Scholar] [CrossRef]
  41. Li, H.; Shi, Q.; Wan, Y.; Shi, H.; Imin, B. Using Sentinel-2 Images to Map the Populus euphratica Distribution Based on the Spectral Difference Acquired at the Key Phenological Stage. Forests 2021, 12, 147. [Google Scholar] [CrossRef]
  42. Tulbure, M.G.; Broich, M.; Stehman, S.V.; Kommareddy, A. Surface water extent dynamics from three decades of seasonally continuous Landsat time series at subcontinental scale in a semi-arid region. Remote Sens. Environ. 2016, 178, 142–157. [Google Scholar] [CrossRef]
  43. Ni, P. History, Present Situation and Evolution Prospect of Daliyaboyi oasis. Arid Zone Res. 1993, 10, 12–18. [Google Scholar]
  44. Zhu, Z.; Lu, J.; Jiang, W. Study on Formation and Development of Aeolian Landform and Trend of Environment Change at Lower reach of Keriya River, Taklimakan Desert. J. Desert Res. 1988, 8, 1–10. [Google Scholar]
  45. Dong, Z.; Lyu, P. Development of aeolian geomorphology in China in the past 70years. Acta Geogr. Sin. 2020, 75, 509–528. [Google Scholar] [CrossRef]
  46. Junk, W.J.; Bayley, P.; Sparks, R. The Flood Pulse Concept in River-Floodplain Systems. Can. Spec. Publ. Fish. Aquat. Sci. 1989, 106, 110–127. [Google Scholar]
  47. Perona, P.; Camporeale, C.; Perucca, E.; Savina, M.; Molnar, P.; Burlando, P.; Ridolfi, L. Modelling river and riparian vegetation interactions and related importance for sustainable ecosystem management. Aquat. Sci. 2009, 71, 266–278. [Google Scholar] [CrossRef] [Green Version]
  48. Poff, N.L.; Allan, J.D.; Bain, M.B.; Karr, J.R.; Prestegaard, K.L.; Richter, B.D.; Sparks, R.E.; Stromberg, J.C. The Natural Flow Regime. Bioscience 1997, 47, 769–784. [Google Scholar] [CrossRef]
Figure 1. Study site and the location of the typical plots used in this study.
Sustainability 13 09522 g001
Figure 2. Flowchart of the study methodology.
Sustainability 13 09522 g002
Figure 3. (A) Classification results of surface water. (B) Landsat 8 image acquired on 19 September 2016; the band combination is 7/3/2. The areas marked by the boxes represent a typical water body (af).
Sustainability 13 09522 g003
Figure 4. Spatial distribution of vegetation from 1993 to 2020. (am) Distribution of vegetation in different years; (n) interannual variations in the vegetation area.
Sustainability 13 09522 g004
Figure 5. Distribution range of vegetation and surface water from 1990 to 2020. (a) Relative frequency of surface water; (b) vegetation distribution range; (c) overlapping range of vegetation and surface water; (d) interannual variation of surface water distribution.
Sustainability 13 09522 g005
Figure 6. Change of batture area in the river channel during the study period. (ap) The batture area in different years.
Sustainability 13 09522 g006
Figure 7. Floodplain formation process (plot C). (A) The newly floodplain. (B) Interannual variations in the vegetation area of the newly floodplain. (ao) The floodplain area in different years.
Sustainability 13 09522 g007
Figure 8. Transition process from dunes to floodplains (plot F).(aj) The dunes area in in different years. (k) Ground image of the dunes. (l) Ground image of vegetation.
Sustainability 13 09522 g008
Figure 9. Landform changes and plant colonization (plot D). (ah) Erosion process of dunes by surface water in different years; (ag) Landsat image display with standard false color; (h) Sentinel-2 image display with standard false color; (i) ground image showing the colonization process of Tamarix chinensis.
Sustainability 13 09522 g009
Figure 10. Plant expansion process (plot E). (a) The location of plot E, a Gaofen-2 image display with standard false color; (b) the UAV orthographic image of plot E; (c) the DSM image of plot E; (d) the top view of plot E, the blue curve presents the flow direction of the river; (e,f) are ground images of Tamarix chinensis in plot E.
Sustainability 13 09522 g010
Figure 11. Soil nutrients in the riverbed samples (plot 1).
Sustainability 13 09522 g011
Figure 12. Soil nutrient profile of samples collected from the area surrounding the river (plot 2).
Sustainability 13 09522 g012
Table 1. Description of the Landsat images.
YearSensorTiles
1990–1998TM46
1999–2002ETM+19
2006–2011TM46
2013–2020OLI79
Table 2. Confusion matrix.
Classified DataReference DataPA
WaterOther
water86792.47%
other1539296.31%
UA85.15%98.25%
OA: 97% F1-score: 88.66%
Publisher’s Note: MDPI stays neutral with regard to jurisdictional claims in published maps and institutional affiliations.

