Article

The Use of Calcium Lactate to Enhance the Durability and Engineering Properties of Bioconcrete

by
Saddam Hussein Abo Sabah
1,*,
Luis Hii Anneza
1,
Mohd Irwan Juki
1,*,
Hisham Alabduljabbar
2,*,
Norzila Othman
3,
Adel Ali Al-Gheethi
3 and
Abdullah Faisal Al-Shalif
1
1
Jamilus Research Centre for Sustainable Construction (JRC), Faculty of Civil Engineering and Built Environment, Universiti Tun Hussein Onn Malaysia, Parit Raja 86400, Johor, Malaysia
2
Department of Civil Engineering, College of Engineering, Prince Sattam Bin Abdulaziz University, Alkharj 11942, Saudi Arabia
3
Micro-Pollutant Research Centre (MPRC), Faculty of Civil Engineering and Built Environment, Universiti Tun Hussein Onn Malaysia, Parit Raja 86400, Johor, Malaysia
*
Authors to whom correspondence should be addressed.
Sustainability 2021, 13(16), 9269; https://doi.org/10.3390/su13169269
Submission received: 25 June 2021 / Revised: 5 August 2021 / Accepted: 13 August 2021 / Published: 18 August 2021
(This article belongs to the Special Issue Sustainable Concrete Materials and Technologies)

Abstract

:
This study investigated the optimization of the bioconcrete engineering properties and durability as a response of the calcium lactate (CL) content (0.22–2.18 g/L) and curing duration (7–28 days) using the response surface methodology (RSM). Scanning electronic microscopy (SEM) was conducted to evaluate the microstructure of calcium precipitated inside the bioconcrete. The results indicated that the optimal conditions for the engineering properties of concrete and durability were determined at 2.18 g/L of CL content after 23.4 days. The actual and predicted values of the compressive strength, splitting tensile strength, flexural strength, and water absorption were 43.51 vs. 43.43, 3.19 vs. 3.19, 6.93 vs. 5.50, and 7.55 vs. 7.55, respectively, with a level of confidence exceeding 95%. The scanning electron microscope (SEM) images and energy-dispersive X-ray spectroscopy (EDX) proved that the amount of calcium increased with the increase in CL content up to 2.81 g/L at 23.4 days, reducing the pores inside the concrete and making it a great potential option for healing of concrete structures.

1. Introduction

Concrete is still today the most common material in the construction industry due to its strength and durability. However, the primary drawback of concrete is its low tensile strength, making it vulnerable to cracks [1,2] and enabling harmful chemicals to penetrate the concrete causing corrosion of the steel reinforcement [3]. Researchers have been investigating several approaches to develop new solutions to overcome this weakness for the past few decades, and one of these solutions is bioconcrete [4]. The term bioconcrete, as its name indicates, is a combination of biological microorganisms and concrete. It has the ability to heal itself via the help of bacteria and fungus.
Bacteria have the capability to precipitate calcium carbonate (CaCO3), which plays a major role in the self-healing of concrete cracks [5,6]. Siddique and Chahal [7] indicated that the bacteria possess the urease enzyme, which generates carbonate and facilitates the healing of microcracks. Many researchers have investigated the effect of bacteria on the concrete mechanical properties [8,9,10,11,12]. Kumari et al. [13] experimentally studied how the Bacillus conhii affected the cement mortar at cell concentrations of 10, 105, and 107 cell/mL. It was revealed that the highest cell concentration (107 cell/mL) achieved an increase of 49% in the compressive strength due to both bacteria and the calcium chloride. Similarly, Ghosh et al. [14] used seven Shewanella sp. concentrations ranging from 10 to 107 cells/mL and found that a 25% increase in the compressive strength was achieved with a cell concentration of 105 cells/mL. Furthermore, Andalib et al. [15] investigated five concentrations of B. megaterium (10 × 105–50 × 105 cells/mL) and found that the highest improvement in the compressive strength (24%) occurred at 30 × 105 cell/mL due to the addition of the calcium lactate which enhanced the compressive strength as well.
Kunal et al. [16] tested the effectiveness of bacteria in improving the splitting tensile strength of concrete by replacing 10% of the cement content with bacteria. The results showed that the bacteria improved the splitting tensile strength. However, when the inclusion of bacteria exceeded 10%, the strength started to decrease, which might be due to the decrease in the hydration process due to the lower cement content. Priya et al. [17] added silica and B. sphaericus bacteria to concrete to observe their effect on its strength and durability. It was found that the splitting tensile strength of concrete increased as the volume of the bacterial solution increased. However, when the solution volume exceeded 20 mL, the splitting tensile strength declined.
Mondal and Ghosh [18] reported that the presence of B. subtilis reduced the water absorption of the mortar mix, and the reduction increased with the increase in the cell concentrations. Chahal et al. [19] found that the addition of Sporoscarcina pasteurii bacteria reduced the concrete water absorption by four times compared to that of the normal concrete. Moreover, three types of bacteria (S. pasteurii, B. subtilis, and B. sphaericus) were employed to improve the permeability resistance of concrete [20]. The three bacteria reduced the water absorption of the concrete due to the formation of a calcium carbonate layer on the concrete surface with the lowest improvement found to be in the B. subtilis mix.
The calcium nutrient source also acts as an additional food source for the bacteria to precipitate calcium carbonate at a higher rate, which helps increase the strength of concrete and aids in self-healing of microcracks. Calcium lactate is an organic calcium source which is used in many milk, cheese, and food products. This concentration can produce a significant amount of calcium carbonate within a short period. Calcium lactate comes in a liquid form and is added as a supplement in the water used for concrete mixing. The bacteria liquid culture and calcium lactate are added directly to the concrete mix. Researchers have used calcium lactate to enhance the compressive strength and the self-healing of cracks. Vijay and Murmu [21] investigated the effect of calcium lactate on the compressive strength of microbial concrete using different concentrations of 0.5%, 1.0%, 1.5%, 2.0%, and 2.5% as a partial replacement of cement. The results showed that an increase of 12% in the compressive strength of the concrete occurred with the 0.5% concentration. Ducasse-Lapeyrusse et al. [22] experimentally proved that calcium lactate significantly increased the self-healing kinetics in large cracks over 150 µm.
Alshaibani et al. [23] indicated that the design approach of one-variable-at-a-time is complex and time-consuming to conduct for each single factor because the optimization method entails the use of a single parameter for every trial. For the optimum levels to be obtained, many experimental trials need to be conducted. One of the investigational techniques is the response surface methodology (RSM), which represents an important tool that employs mathematical models and statistics for the optimization of parameters of fermentation processes. Moreover, RSM consists of multivariable polynomial models, which are used to optimize a response based on a given set of variables. In addition, there is a wide application of the RSM approach in the optimization of microbial fermentation processes, as well as in the determination of the effect of various factors. A different approach used to increase engineered strain’s expression is the application of biostatistics to optimize culture conditions, with the RSM optimization with central composite design (CCD) being the widely accepted design.
Therefore, the contribution of this paper is to experimentally investigate the effect of calcium lactate and curing period on the durability and engineering properties of bioconcrete. In addition, RSM is used to optimize the performance of bioconcrete through the optimization of the two variables simultaneously rather than a single variable. In other words, the best operating parameters required to achieve a high-quality bioconcrete as well as the interaction between the independent factors and their role in the improvement of the bioconcrete properties are investigated. Furthermore, the microstructure of the bioconcrete is determined to study the effectiveness of the calcium addition in the enhancement of bioconcrete compared to the concrete control (without calcium).

2. Experimental Work

2.1. Materials

In this study, a grade 30 concrete mixture was produced. The compositions of the mix were ordinary Portland cement conforming to BS 197-1:2000 [24], natural river sand with a fineness modulus of 3.63 conforming to BS 882-1992 [25], coarse aggregates with sizes ranging from 600 to 20 mm, and tap water as the mixing agent.

2.2. Preparation of Ureolytic Bacteria and Calcium Lactate

Ureolytic bacteria used in this study were isolated from fresh urine by subculturing 10 mL of the urine in one liter of sterilized nutrient broth; the medium was incubated at 35 °C in an orbital shaker for 10 days at 125 rpm. The bacterial growth was determined in terms of optical density (OD) by measuring the rate of absorbance at a wavelength of 500 nm. The bacterial isolates were purified using the streak plate technique on nutrient agar medium; this step was repeated three times to confirm the purity of the bacterial isolate. The bacterial isolate was identified as Bacillus sphaericus based on the morphological and biochemical tests. The bacterial culture was kept in a refrigerator to be used in the concrete mixture.
The calcium lactate was adopted from the study of Xu et al. [26]. Calcium lactate as a nutrient source was used to support the bacterial growth since concrete does not contain an organic compound like glucose which is necessary for the bacterial growth. It also acted as a calcium ion source. It was prepared by dissolving the calcium lactate powder in 1 L of sterile water and added into the concrete mixture in three concentrations (0.001, 0.005, and 0.01 mol/L). Table 1 summarizes the concentrations of calcium lactate that were used in the current study.

2.3. Concrete Mix Design

The mixed design was carried out to achieve a strength of M30 grade at 28 days. Three types of specimens were prepared. The first specimen contained 5% Bacillus sphaericus (B. sphaericus) as a water replacement. In total, 5% of the water content was replaced with B. sphaericus. The second specimens contained B. sphaericus with different contents of calcium lactate. The mix proportions are presented in Table 2. For the ease of presenting, the specimens were named as follows: 5% B. sphaericus for the specimens with 5% B. sphaericus and no calcium lactate; 0.22 B. sphaericus for the specimens with B. sphaericus and 0.22 g/L calcium lactate; 1.09 B. sphaericus for the specimens with B. sphaericus and 1.09 g/L calcium lactate; and 2.18 B. sphaericus for the specimen with B. sphaericus and 2.18 g/L calcium lactate.
Half of the total amount of sand was first poured into the mixer, and the coarse aggregates were then added and mixed. The remaining 50% of sand was then poured and followed by the cement. Next, water was slowly added, and the whole mixture was mixed until homogeneity was achieved. After that, the bacteria and calcium lactate were added into the mix. The mixes were cast in molds and left to harden for 24 h before curing took place.

2.4. Test Setup and Method

2.4.1. Compressive Strength Test

The test was performed to assess the compressive strength of the specimens at 7, 14, and 28 days using a universal testing machine. A total of 36 specimens of 150 mm × 150 mm × 150 mm were prepared and tested under a rate of 14 N/mm2. The test was conducted in accordance with BS 12390-3:2002 [27].

2.4.2. Splitting Tensile Test

This splitting tensile test was conducted to evaluate the effect of bacteria on the bonding characteristics of the concrete at 28 days in accordance with BS 12390-6:2009 [28]. Twelve specimens were cast in a 150 mm cylindrical mold with a height of 300 mm. The load was applied in a continuous manner up to failure using a universal testing machine.

2.4.3. Flexural Strength Test

To measure the bending capacity of the specimens, the flexural test was conducted at 28 days in accordance with BS EN 12390-5:2009 [29]. Three specimens of 100 mm × 100 mm × 500 mm were tested for each mix design.

2.4.4. Water Penetration

This test was employed to evaluate the water penetration resistance of the concrete specimens. First, 12 concrete cubes of size 150 mm were cast and cured at 28 days based on BS EN 12390-8 [30]. The specimens were then tested using an apparatus with a constant air pressure of 5 KPa for 72 h.

2.5. Microstructure Analysis

Microstructure analysis was conducted using scanning electronic microscopy (SEM) machine. The machine was equipped with a JEOL-JSM 5600 LV microscope and 6587 EDS detectors with an accelerating voltage of 15 Kv. For the microstructure analysis, fragments of about 1–2.5 cm long were collected after the compressive strength test, coated with a gold sputter platting, and then fixed on the testing plate using a carbon tape. The specimens’ images were magnified from 500× to 1500× magnification based on the obtained clarity of the image. The images captured for SEM were transferred to an energy dispersive X-ray (EDX) detector to analyze elements within each concrete matrix.
Furthermore, the chemical composition of the specimens was investigated via conducting an X-ray spectroscopy (XRF). This test requires pellets to be made using the sample and wax. The samples were crushed, ground, and sieved via a 63 µm sieve. Next, 8 g of the sample was mixed with 2 g of wax and pressed with a hand-hydraulic pressing machine to form pellets.

2.6. Design of Experiment

The response surface methodology (RSM) was employed to study the effects of the calcium lactate content (x1) and curing period (x2) on the compressive strength (y1), splitting tensile strength (y2), flexural strength (y3), and water penetration (y4) of bioconcrete. A total of 12 experiments was determined using the central composite design method. The response (Y) is the function of the levels of independent variables as shown in Equation (1).
Y = f ( x 1 x 2 ) + ε
where ε is the experimental error.
The quadratic model was also used to predict the responses and describe the relationship between the independent variables.
Y = β 0 + i = 1 k β i x i + i = 1 k β i i x i 2 + i < j k β i j x i x j
where Y is the predicted responses (compressive strength, splitting tensile strength, flexural strength, and water penetration); β0 is a constant coefficient; βi, βii and βij are the regression coefficients; and k is the number of the independent variables (CL content and curing period).
To analyze the obtained data and investigate the first order response surface equations of the model, RSM was employed. The significance of the two variables on the strength and durability of bioconcrete was analyzed using the analysis of variance (ANOVA) with p < 0.05 to check the fit of the linear model, and the adjusted coefficient of determination (R2adjusted) was used. Furthermore, a three-dimensional graphical representation was also used to depict the interactions between the independent variables and their effects on the responses.

3. Results and Discussion

3.1. Independent Factors Screening

The central composite design with two independent variables was utilized to optimize the effect of the CL content (x1) and curing period (x2) on the strength and durability of bioconcrete. A total of twelve runs was conducted as summarized in Table 3. The collected data were analyzed via the analysis of variance (ANOVA, p < 0.05).

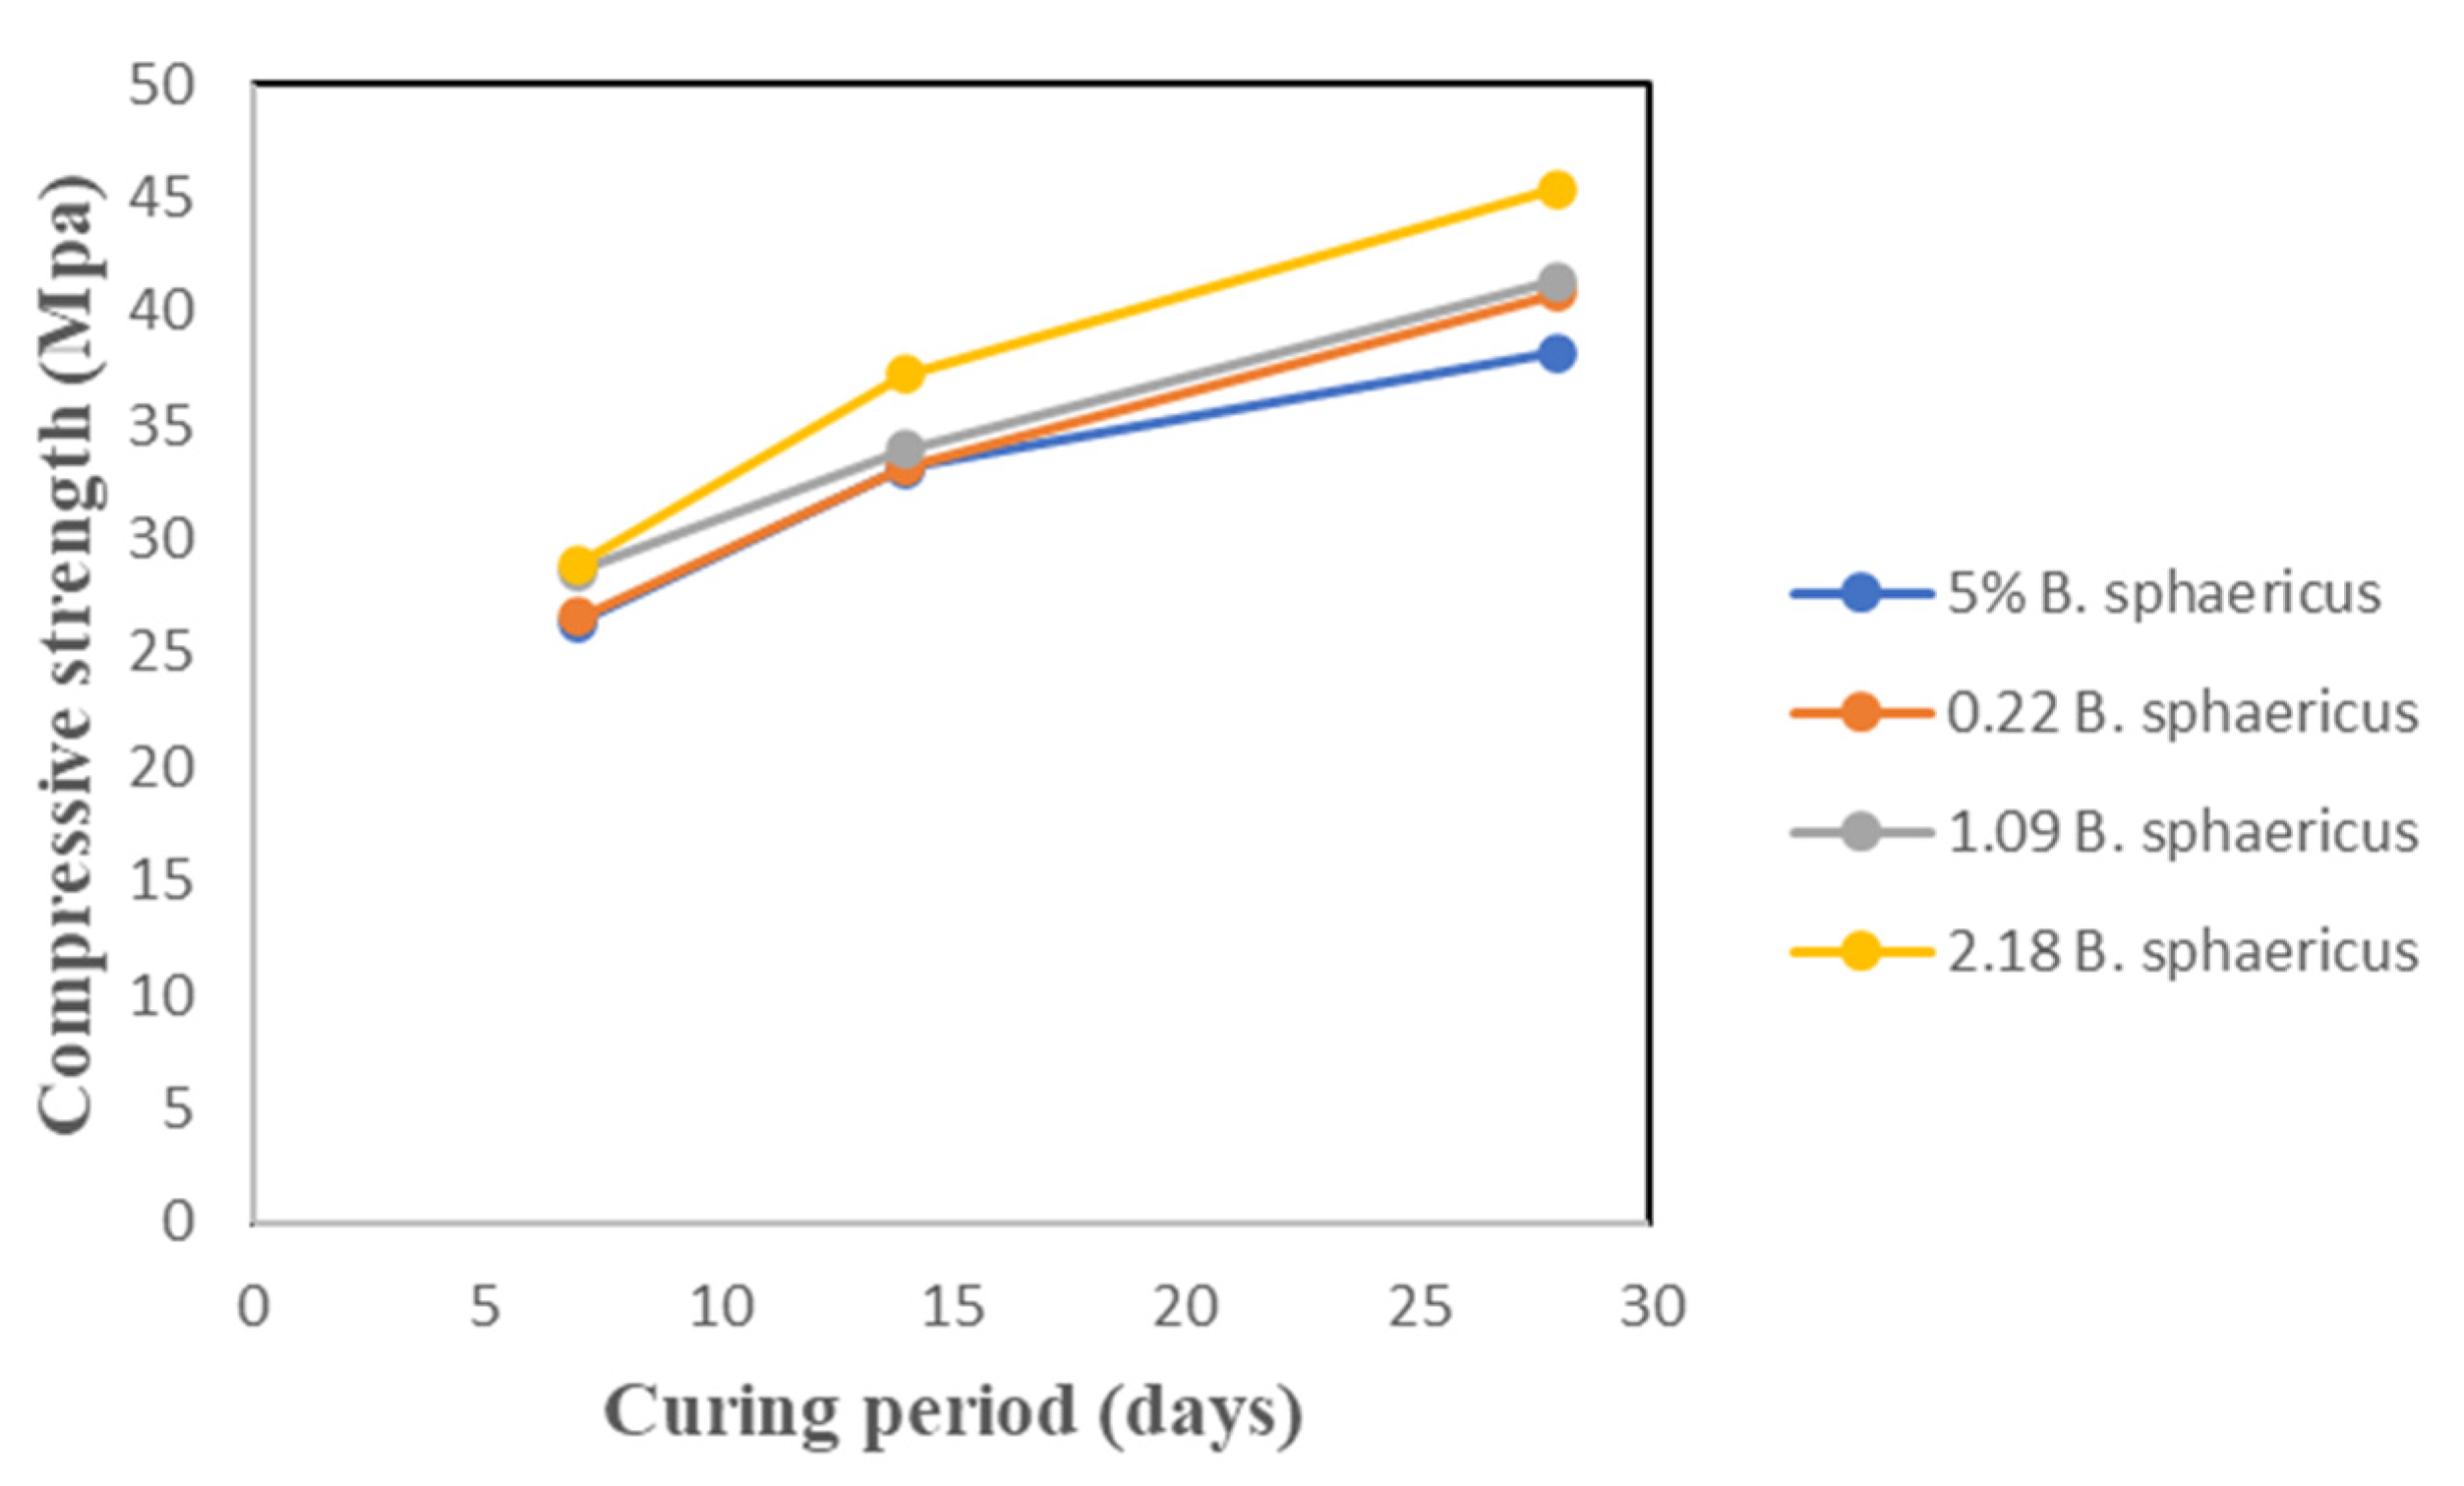
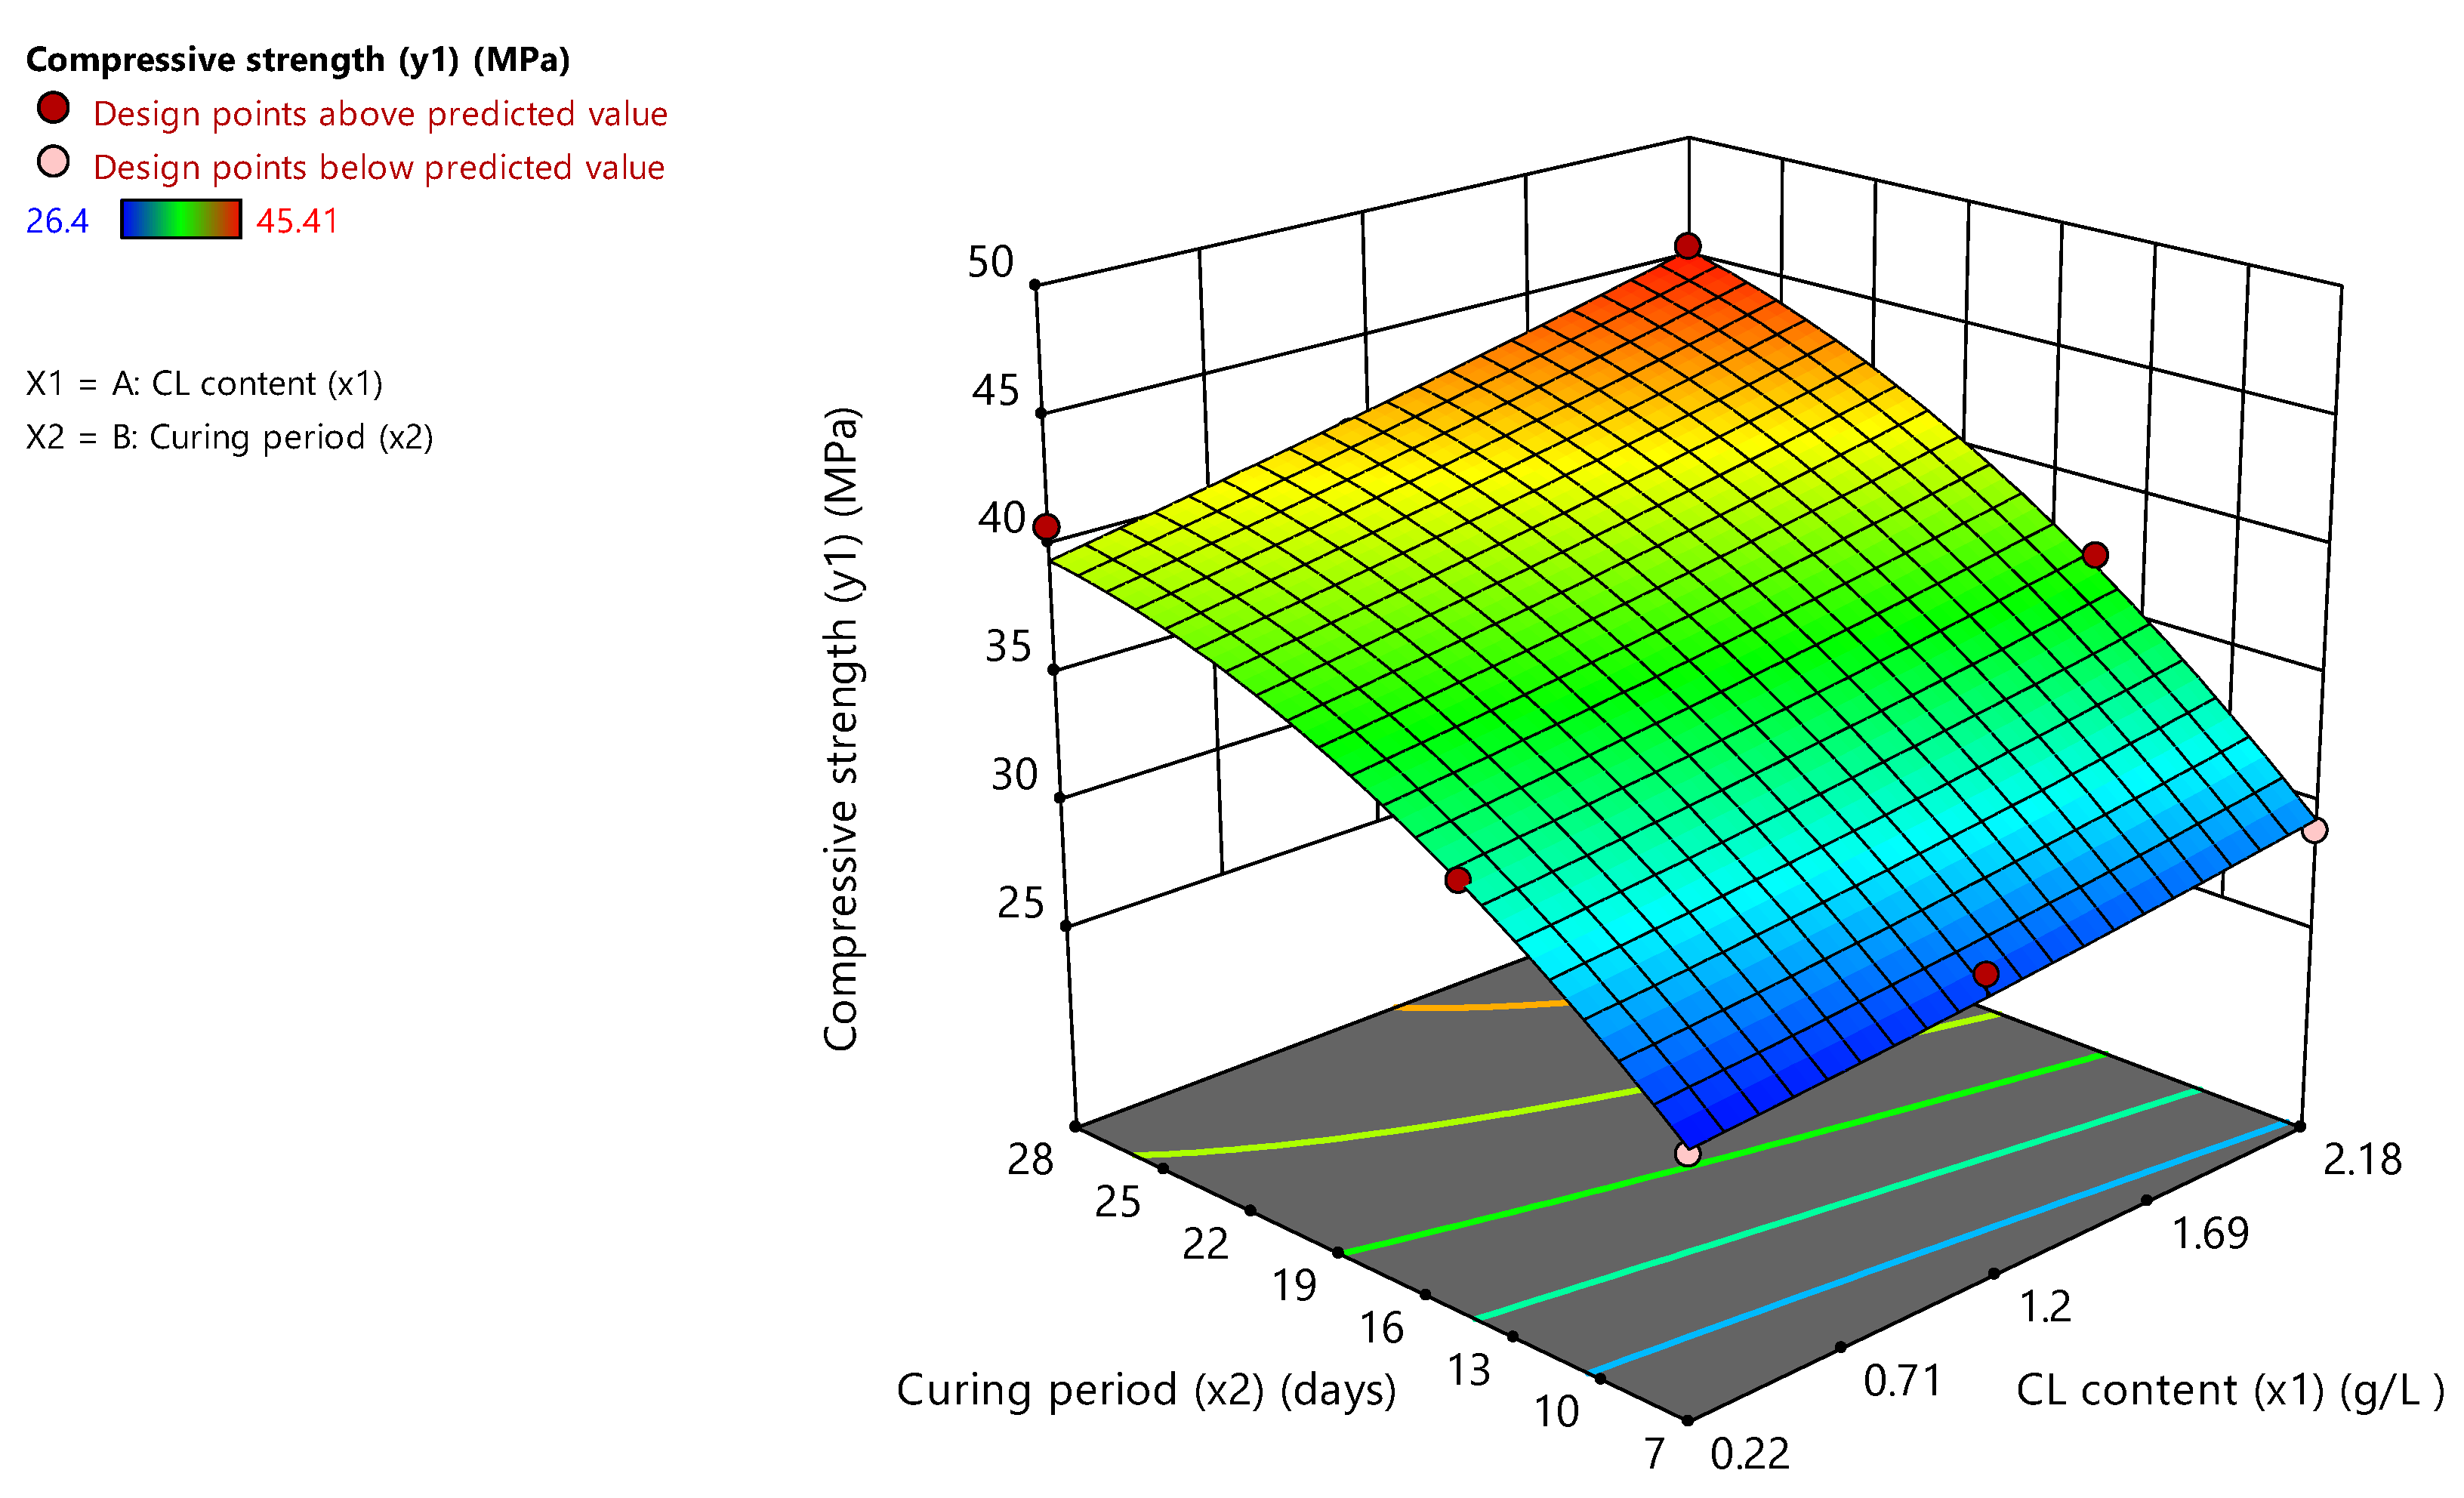
3.2. Compressive Strength

Figure 1 depicts the experimental results of the compressive strength test. It shows the variation in the compressive strength for the different specimens. A slight increase in the compressive strength with the addition of CL was noticed, and the increase was proportional to the CL content (x1) and curing period (x2). At 7 days, the increase varied between 0.75 and 9.5% compared to that of the control. Similarly, at 14 and 28 days, the compressive strength reached a maximum increment of 12.4% and 13.4%, respectively. The improvement in the compressive strength was due to the higher amount of calcite precipitated with the addition of CL. Figure 2 shows the interaction between CL and curing period.
Table 4 indicates that the CL content (x1) and curing period (x2) had a positive significant linear effect on the compressive strength (y1) due to the precipitation of calcite within the concrete matrix pores.
The synergistic effects of the investigated factors were based on the ANOVA analysis. For the compressive strength (y1), the results revealed that both the CL content and curing period had a positive significant synergic effect with p = 0.0005 and p < 0.0001, respectively. In addition, the interaction between the CL content and curing period (x1 x2) was positive but slightly insignificant (p > 0.05) with an 94% significance level. The regression model for the compressive strength was significant with a confidence level of 95% (p < 0.05), and a determination coefficient (R2adjusted) equaled 0.9813, indicating the suitability of the current model.
The relationship between the response (compressive strength, y1) and the independent variables (CL content, x1 and curing period, x2) is described as follows:
y 1 = 37.45 + 2.07 x 1 + 7.18 x 2 + 0.7859 x 1 x 2 + 0.1849 x 1 2 2.38 x 2 2
The residual plots were examined for the model adequacy checking in Figure 3. Figure 3a depicts the normal % probability and studentized residuals plot. The residuals show how well the model satisfies the assumptions of the analysis of variance (ANOVA) where the studentized residuals measure the number of standard deviations separating the actual and predicted values. It is clear that neither is a response transformation needed nor is there any problem with normality.
Figure 3b shows the studentized residuals and predicted compressive strength. According to Myers and Montgomery [31], when the variance of the response relies on the mean level of y, the plot exhibits a funnel-shaped pattern. Based on Figure 3b, there is no transformation needed for the response because the patterned formed is not a funnel.

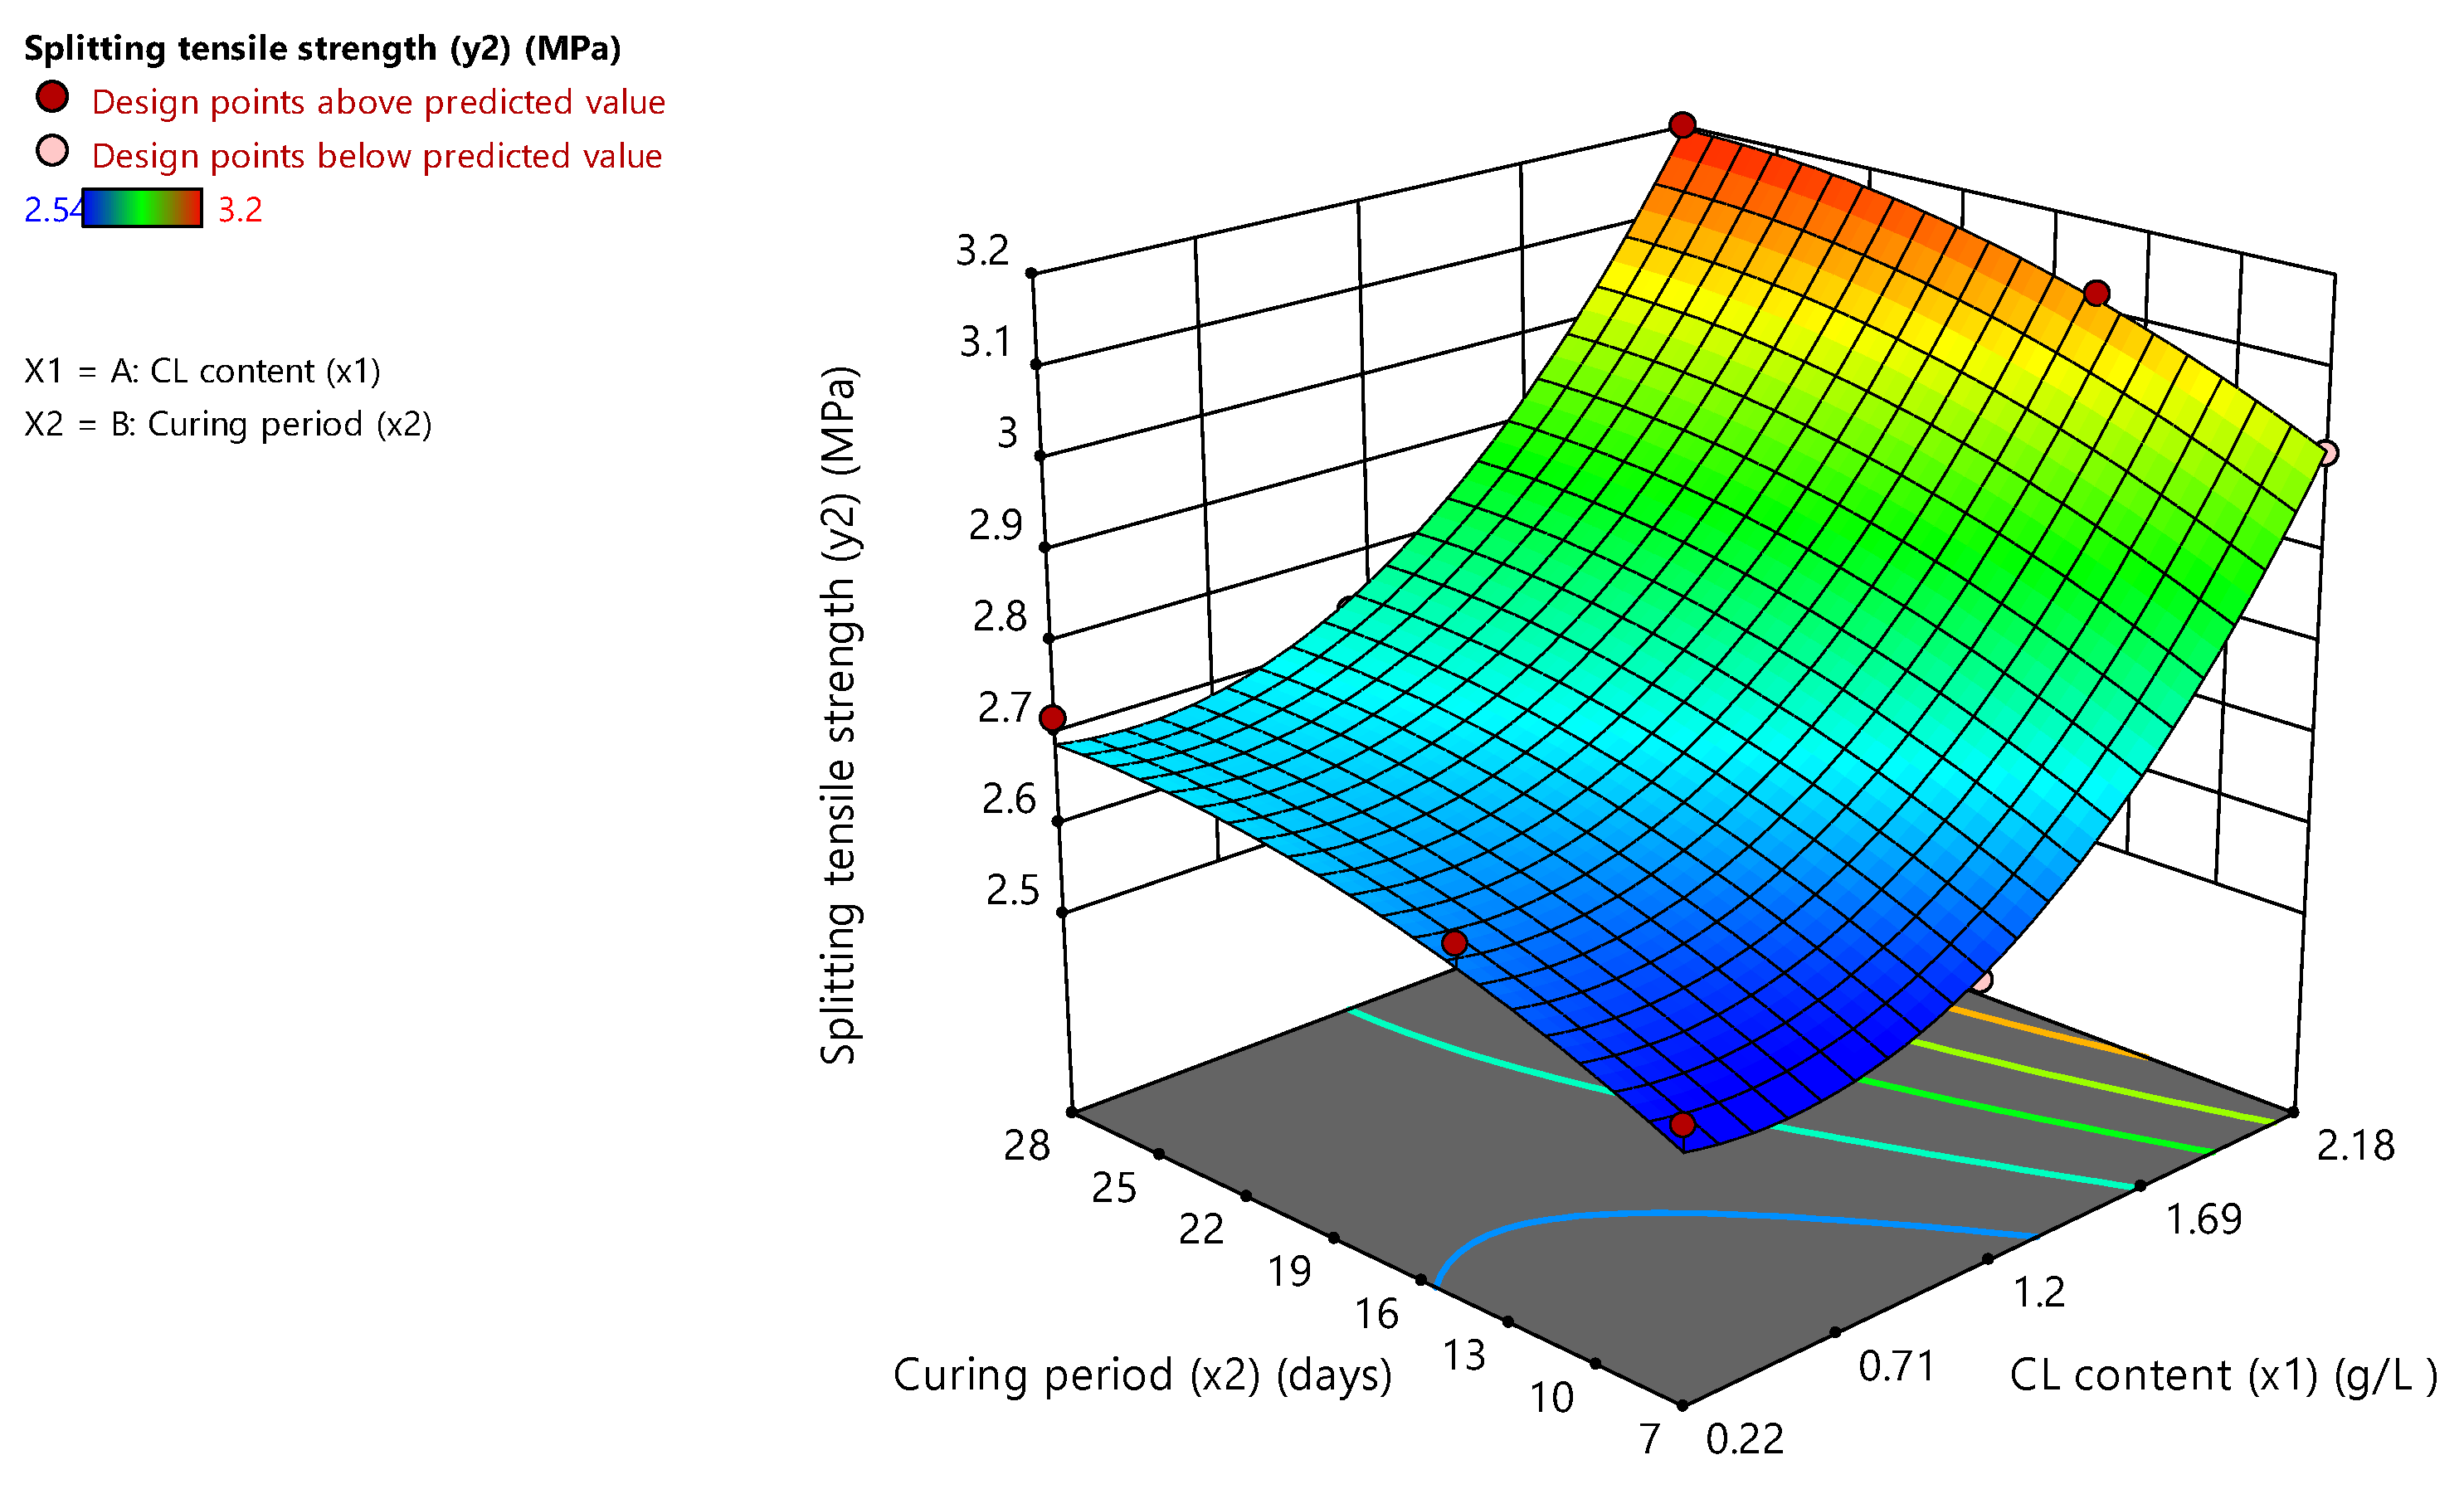
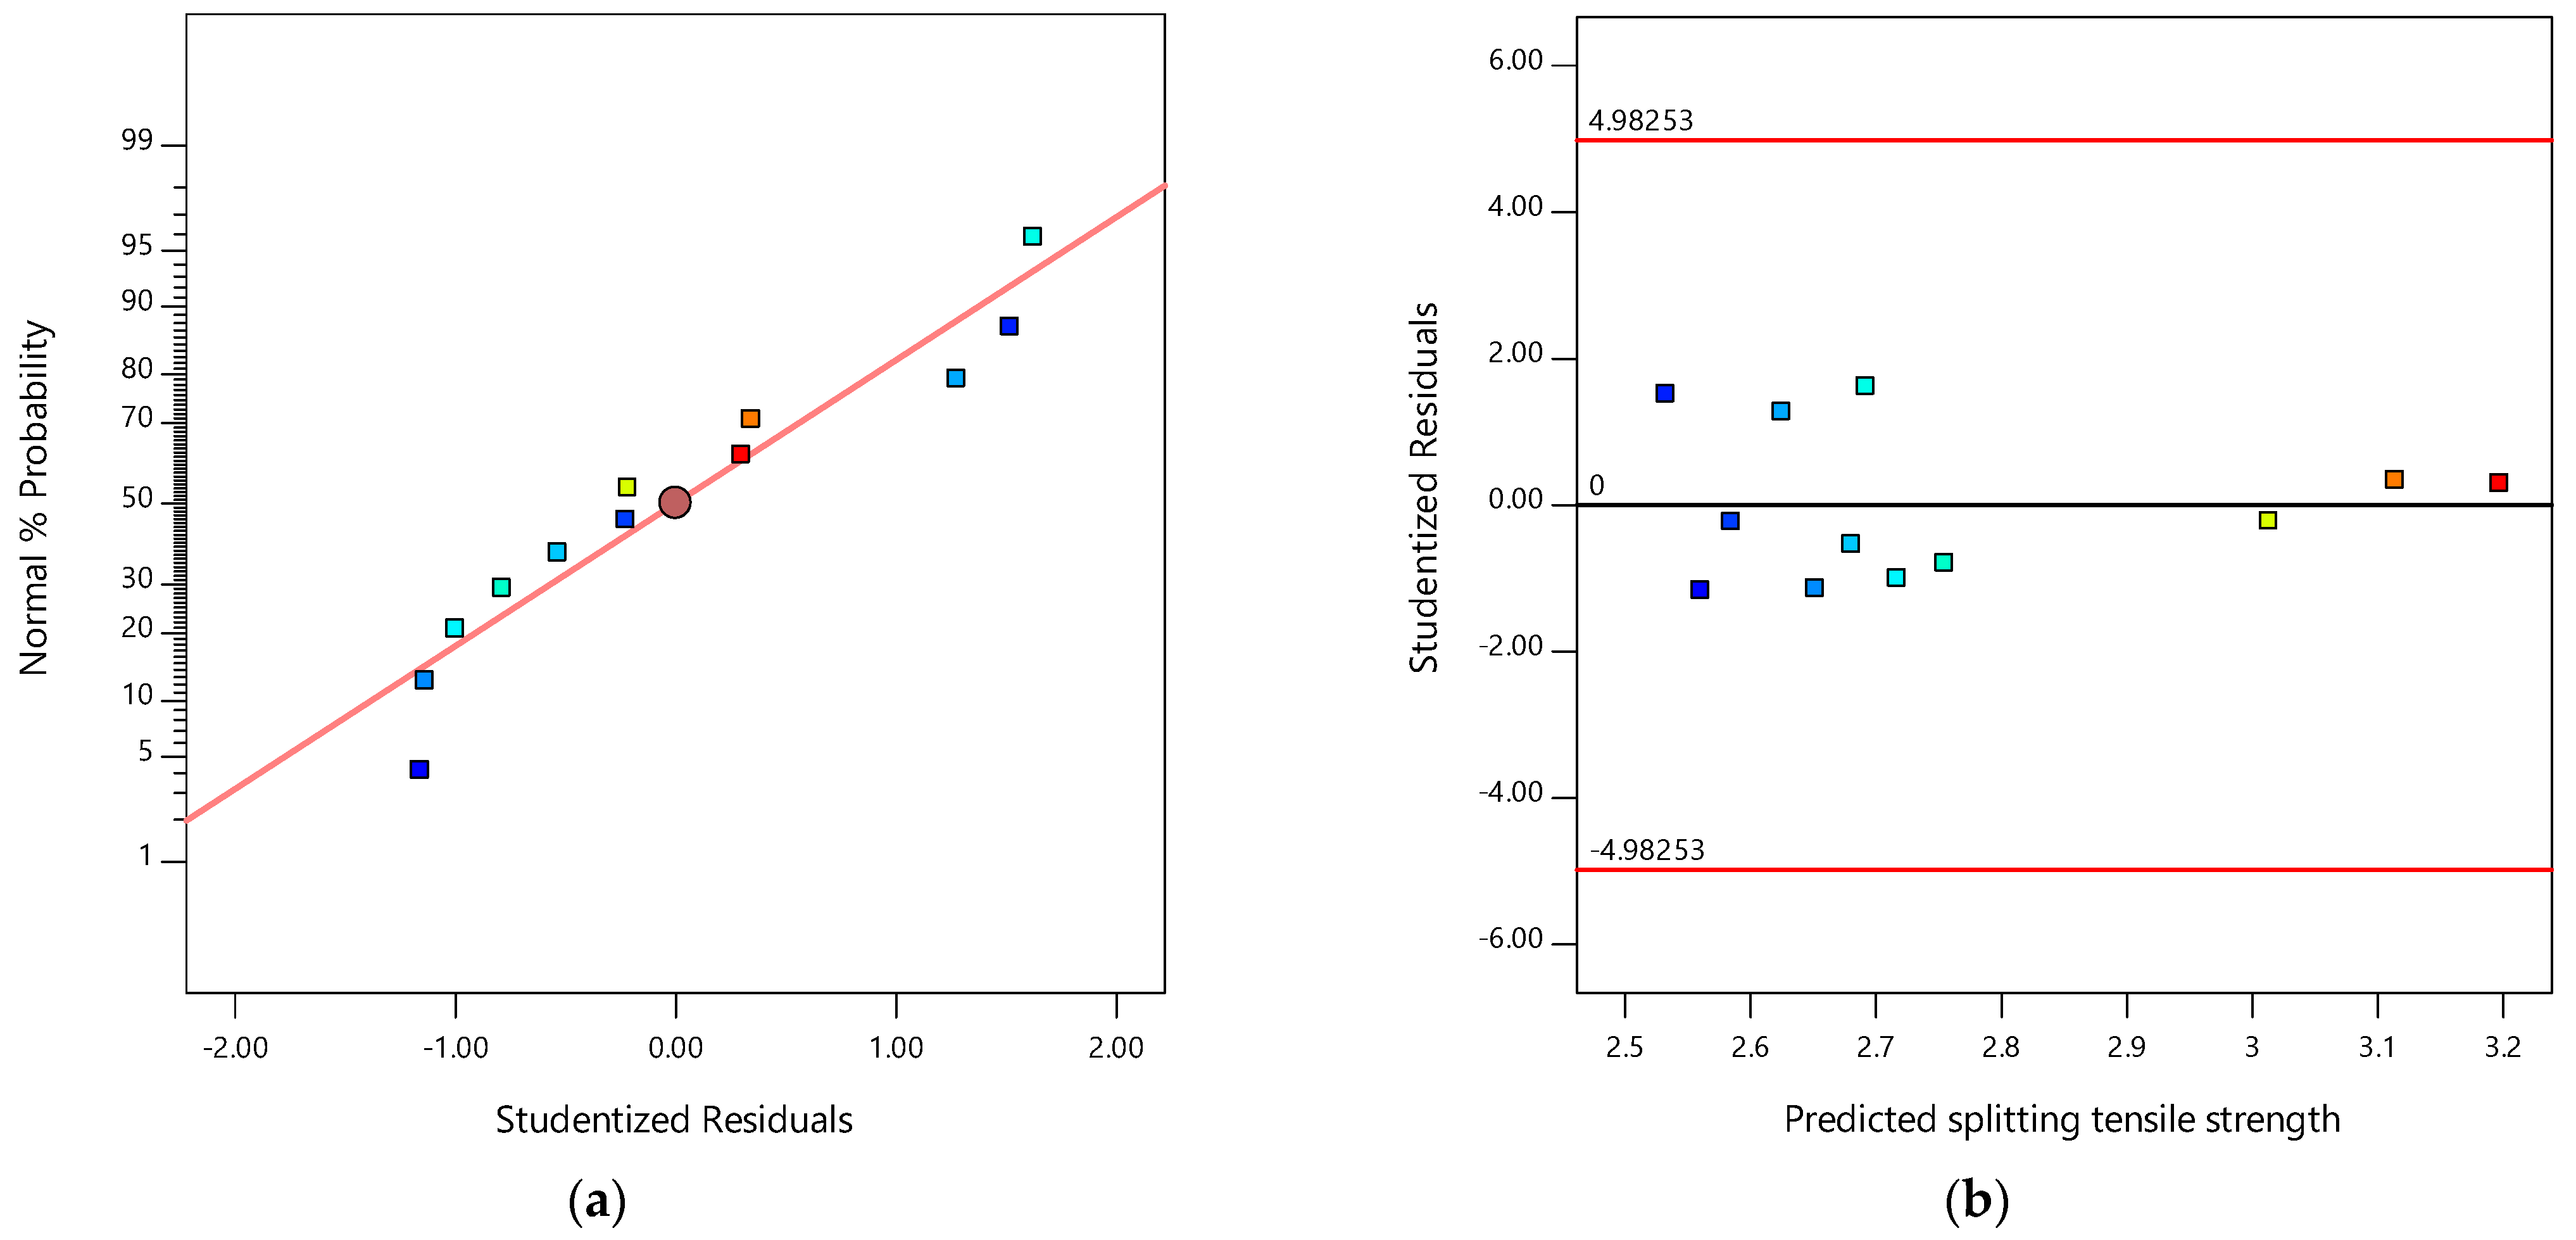
3.3. Splitting Tensile Strength

Figure 4 shows the experimental results of the splitting tensile strength test which increased with the addition of CL. It is obvious that the increase in the splitting tensile strength is proportional to the CL content and curing period. The highest increment was noticed at 28 days with 2.18 B. sphaericus by 18.5%. A slight increment in tensile strength was also seen with 0.22 B. sphaericus and 1.09 B. sphaericus by almost 0.74% and 1.48%, respectively. The interaction of both CL and curing period is depicted in Figure 5.
The effects of x1 and x2 on the splitting tensile strength are shown in Figure 5 and Table 5. The two variables (x1 and x2) showed a significant linear effect on the splitting tensile strength (y2). As the CL content increased, the splitting tensile strength increased by almost 0.74–18.5% compared to the splitting tensile strength of the control specimen. The strength also increased from 0.74% at 7 days to 18.5% at 28 days. This indicates that the inclusion of calcium lactate improved the bioconcrete matrix integrity leading to a significant increase in the tensile strength.
The data in Table 5 show that the CL content and curing period have a positive significant synergic effect with p < 0.0001. The model achieved a 95% confidence level (p < 0.05) and a determination coefficient (R2adjusted) of 0.9875 indicating the aptness of the model. Furthermore, the interaction between the CL content and curing period was positive but insignificant (p > 0.05) with a 44% significance level. This low confidence level signifies that x1 and x2 interacted positively to enhance the splitting tensile strength of the bioconcrete, but the interaction was not influential.
The splitting tensile strength (y2) as a function of the CL content (x1) and the curing period (x2) is obtained as follows:
y 2 = 2.74 + 0.2464 x 1 + 0.0858 x 2 + 0.0061 x 1 x 2 + 0.1634 x 1 2 0.0441 x 2 2
The normal % probability and studentized residuals plot for the splitting tensile strength is shown in Figure 6a. The response transformation looks good and the normality as well. In addition, the pattern shape of the studentized residuals and predicted splitting tensile strength is not a funnel indicating that the response does not need any transformation (Figure 6b).

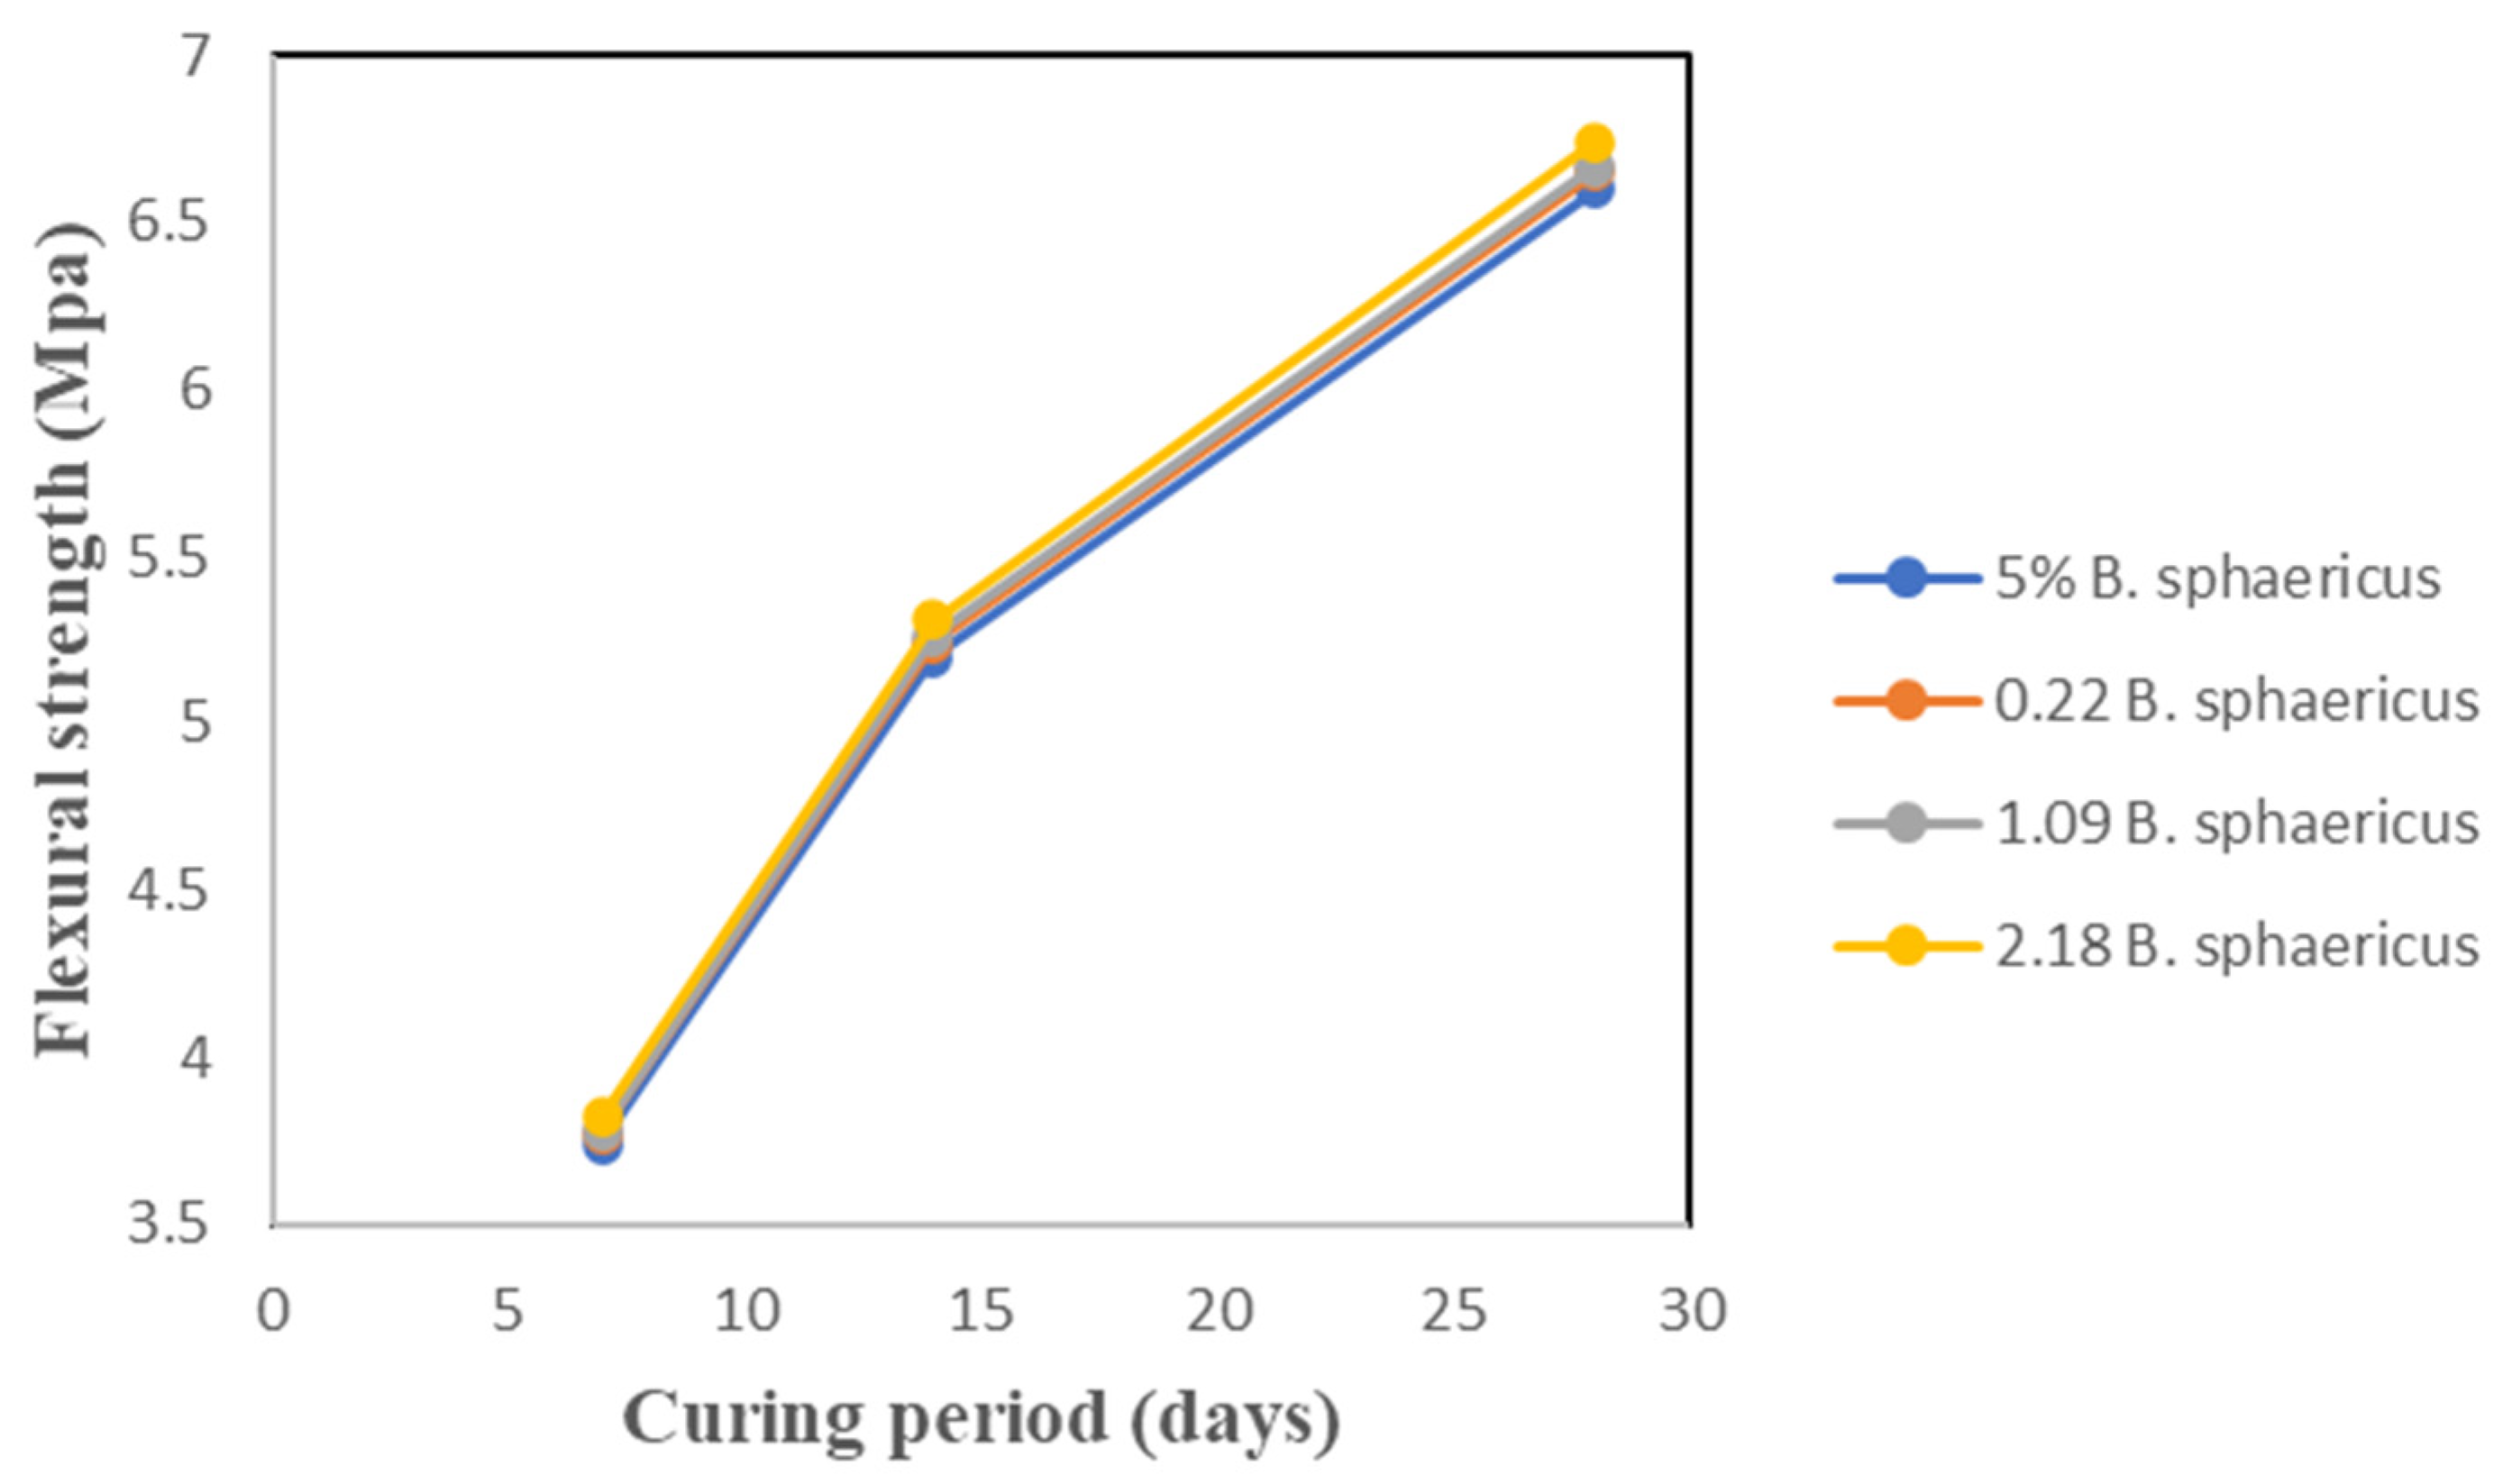
3.4. Flexural Strength

The flexural strength for the specimens was measured at 7, 14, and 28 days. Figure 7 shows that the flexural strength was directly proportional to the CL content and curing period. In comparison to the flexural strength of the control specimen, the improvements in the flexural strength of the 0.22 B. sphaericus, 1.09 B. sphaericus, and 2.18 B. sphaericus specimens were higher by 0.76%, 1.1%, and 2.2%, respectively. The same increments were observed for the curing period. The lowest increment (0.76%) was achieved at 7 days, while the highest (2.2%) was obtained at 28 days. The interaction of both CL and curing period is depicted in Figure 8. The effects of x1 and x2 on the flexural strength of the bioconcrete are presented in Figure 8 and Table 6.
The ANOVA analysis (Table 6) shows that the CL content and curing period had a positive significant effect with p = 0.0002 and p < 0.0001, respectively. The regression model was also significant with a 95% confidence and a determination coefficient (R2adjusted) of 0.9998. In addition, the interaction between x1 and x2 was slightly insignificant (p > 0.05) with 88% significance level.
The flexural strength as a function of x1 and x2 is obtained by:
y 3 = 5.81 + 0.0441 x 1 + 1.45 x 2 + 0.0115 x 1 x 2 0.002 x 1 2 0.5766 x 2 2              
The normality of the flexural strength had no issues as shown in Figure 9a as well as the transformation. Like the splitting tensile strength, the predicted flexural strength did not require any transformation since no funnel-shaped pattern was formed (Figure 9b).

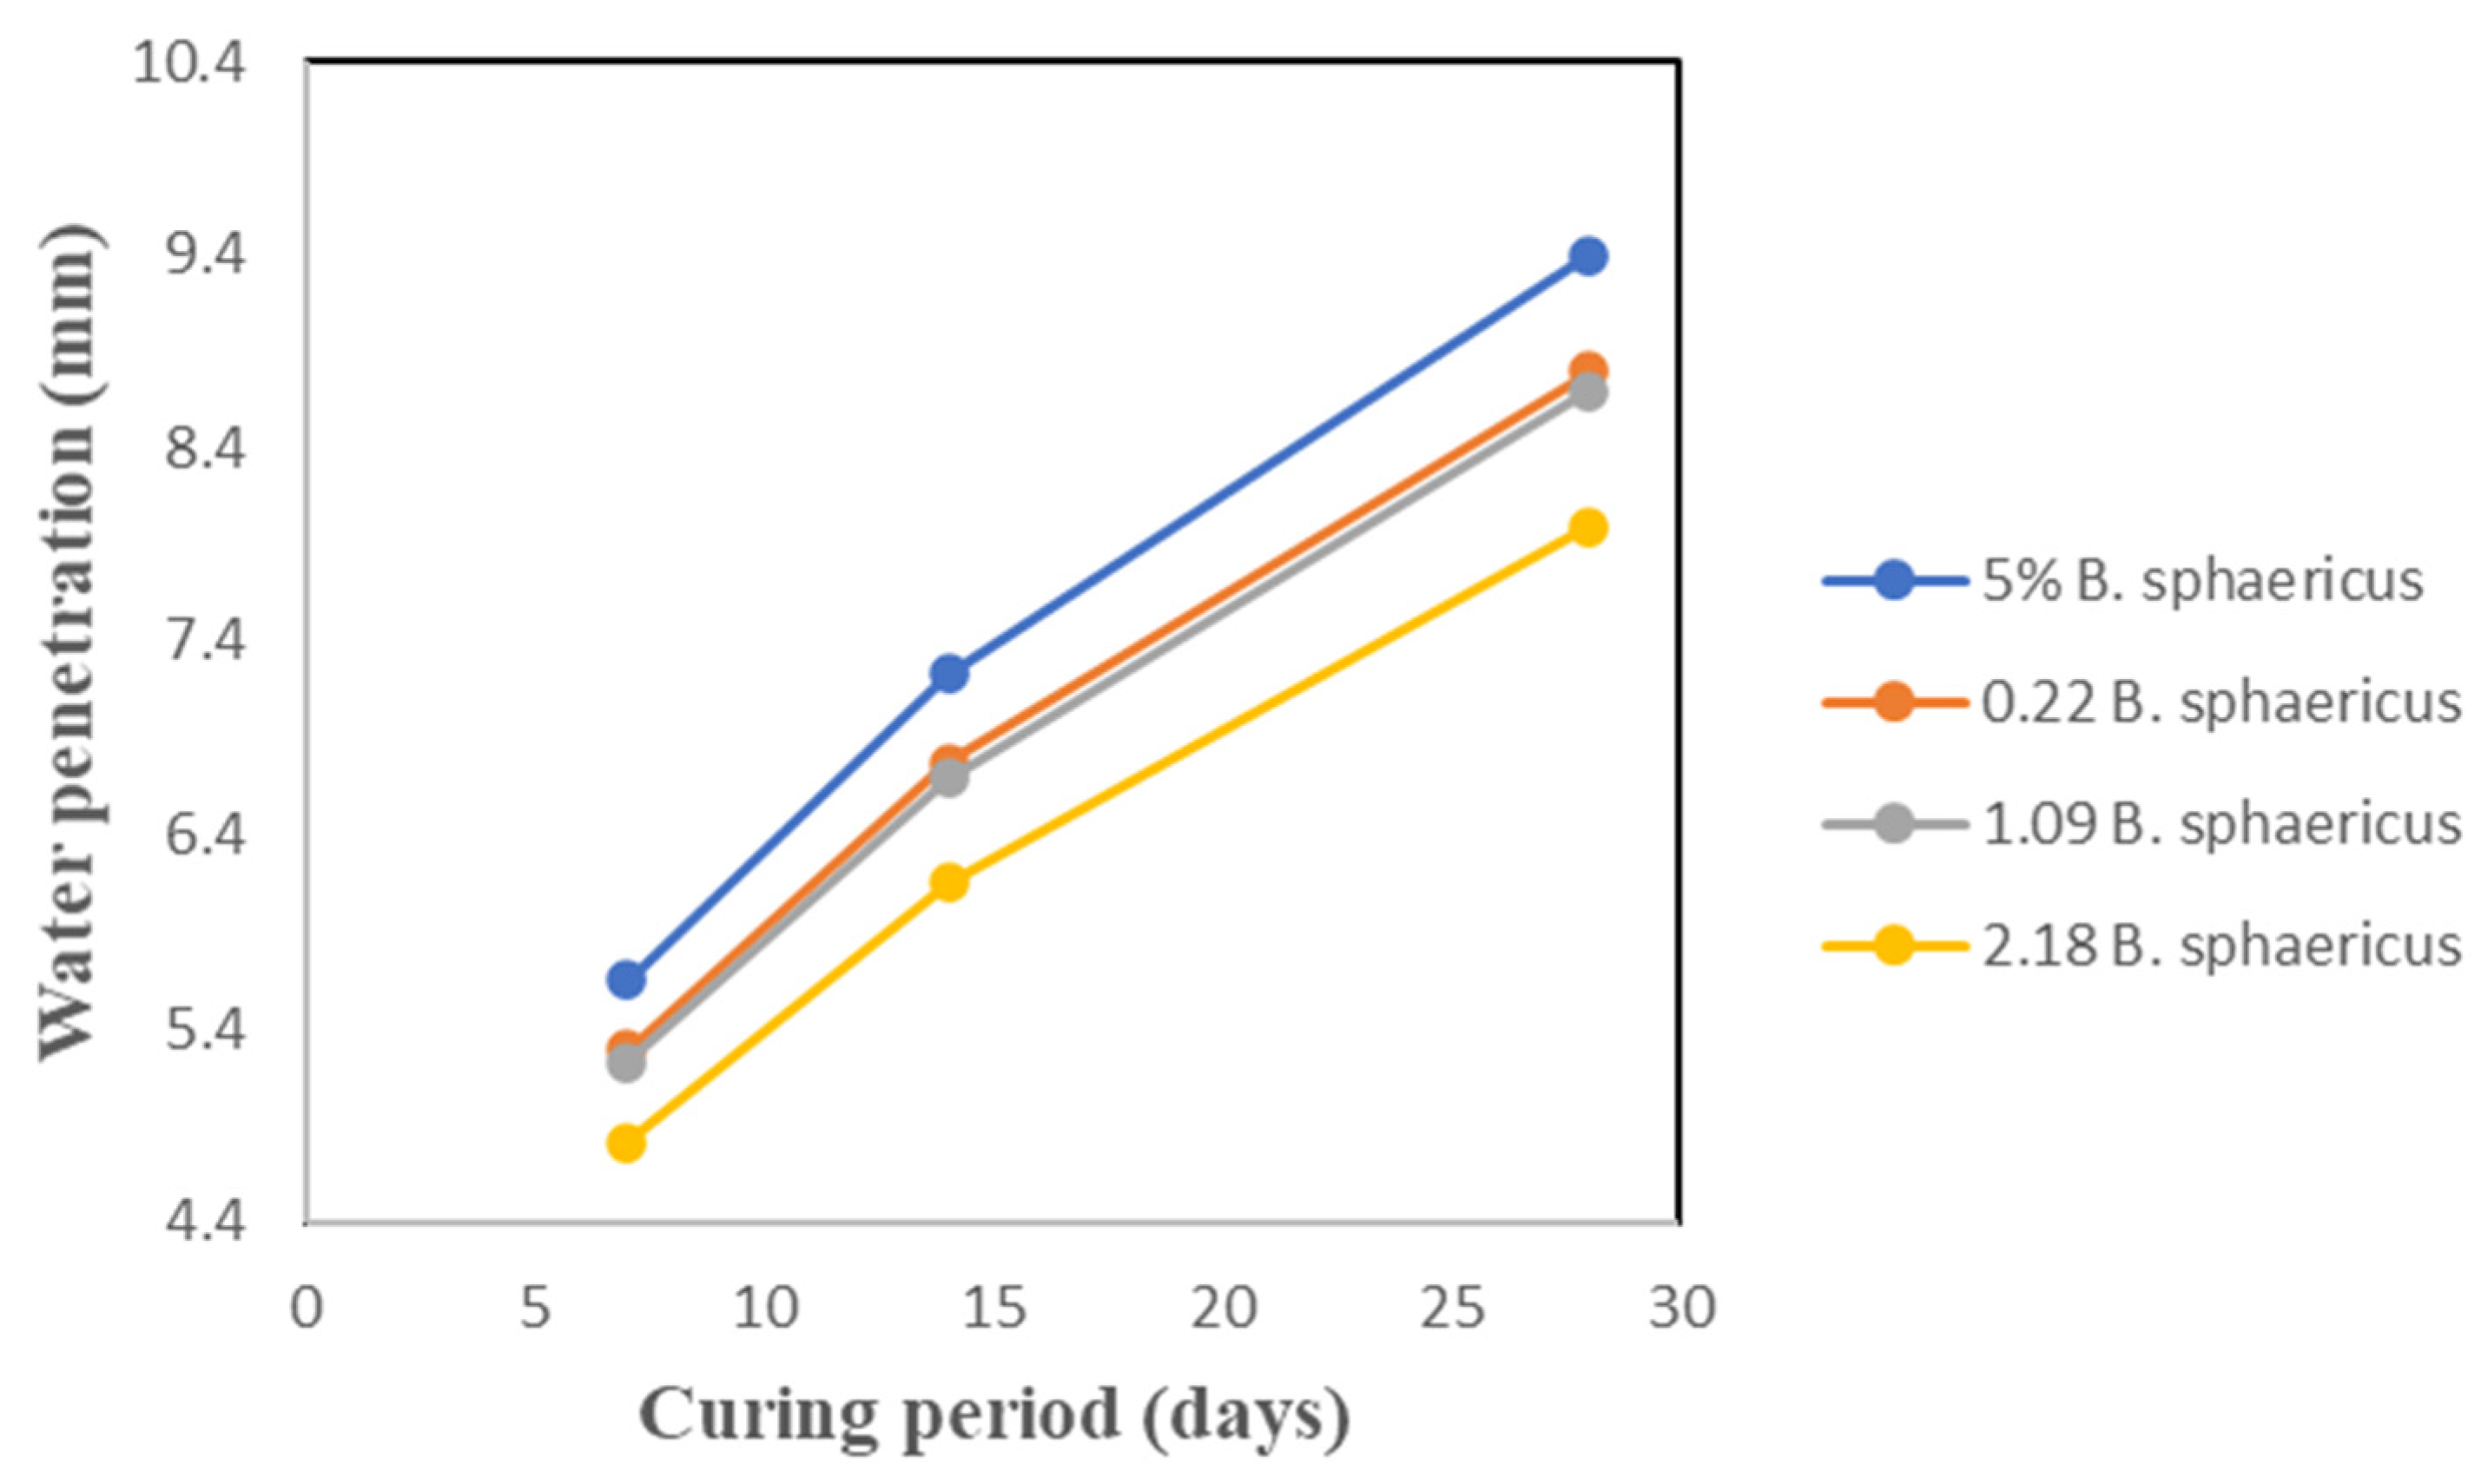
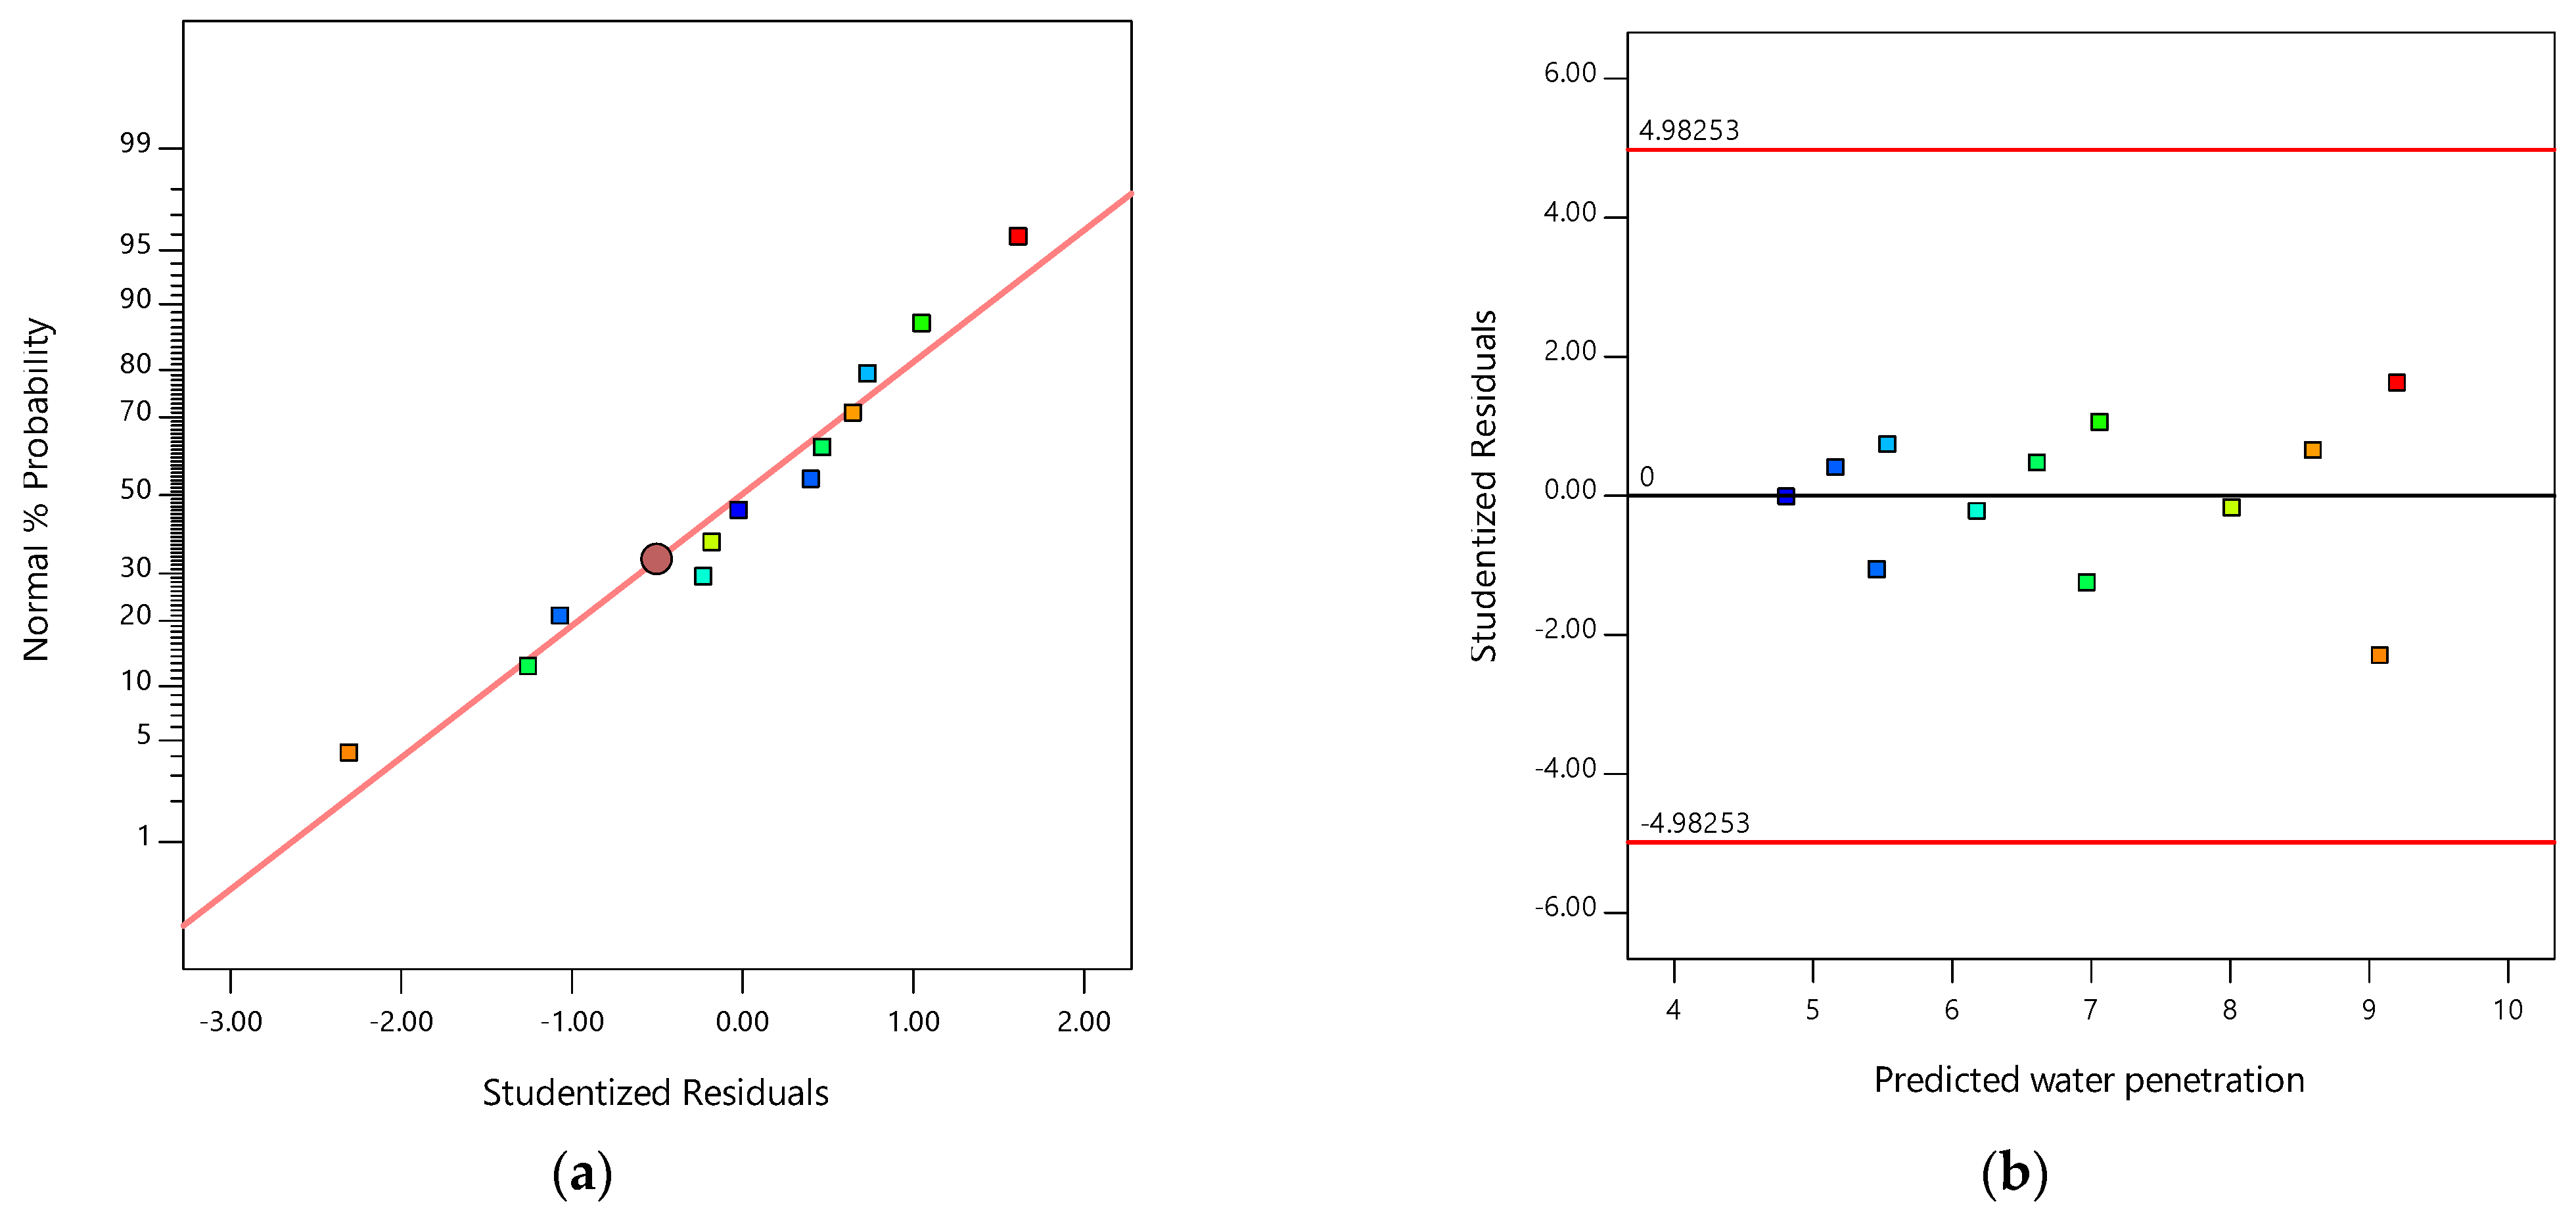
3.5. Water Penetration

Figure 10 shows that the water absorption capability of the bioconcrete decreased as the CL content increased from 0.22 to 2.18 g/L. The reduction varied between 6.5% and 15% compared to the control specimen water absorption. On the other hand, the water penetration increased as the bioconcrete curing period went higher. The penetration depth ranged from 5.65 mm at 7 days to 9.4 mm at 28 days, and the difference was about 60%. The interaction of both CL and curing period is depicted in Figure 11.
Table 7 clearly shows that both the CL content and curing period had a positive significant synergic effect on the water penetration of the bioconcrete with p < 0.05. The model achieved a significant confidence level of 95% and an R2adjusted of 0.9998. In addition, there existed a positive interaction between x1 and x2 with an interaction significance of 75.4%.
To find the relationship between the bioconcrete water penetration (y4), the CL content (x1), and the curing period (x2), Equation (6) was used:
y 4 = 7.18 0.4288 x 1 + 1.71 x 2 0.1037 x 1 x 2 + 0.0079 x 1 2 0.3431 x 2 2  
The normal % probability and studentized residuals plot for the splitting tensile strength is shown in Figure 12a. Both response transformation and normality did not have any issues. Figure 12b also indicates that the pattern shape of the studentized residuals and predicted penetration depth was not a funnel; therefore, the predicted penetration did not require any transformation.

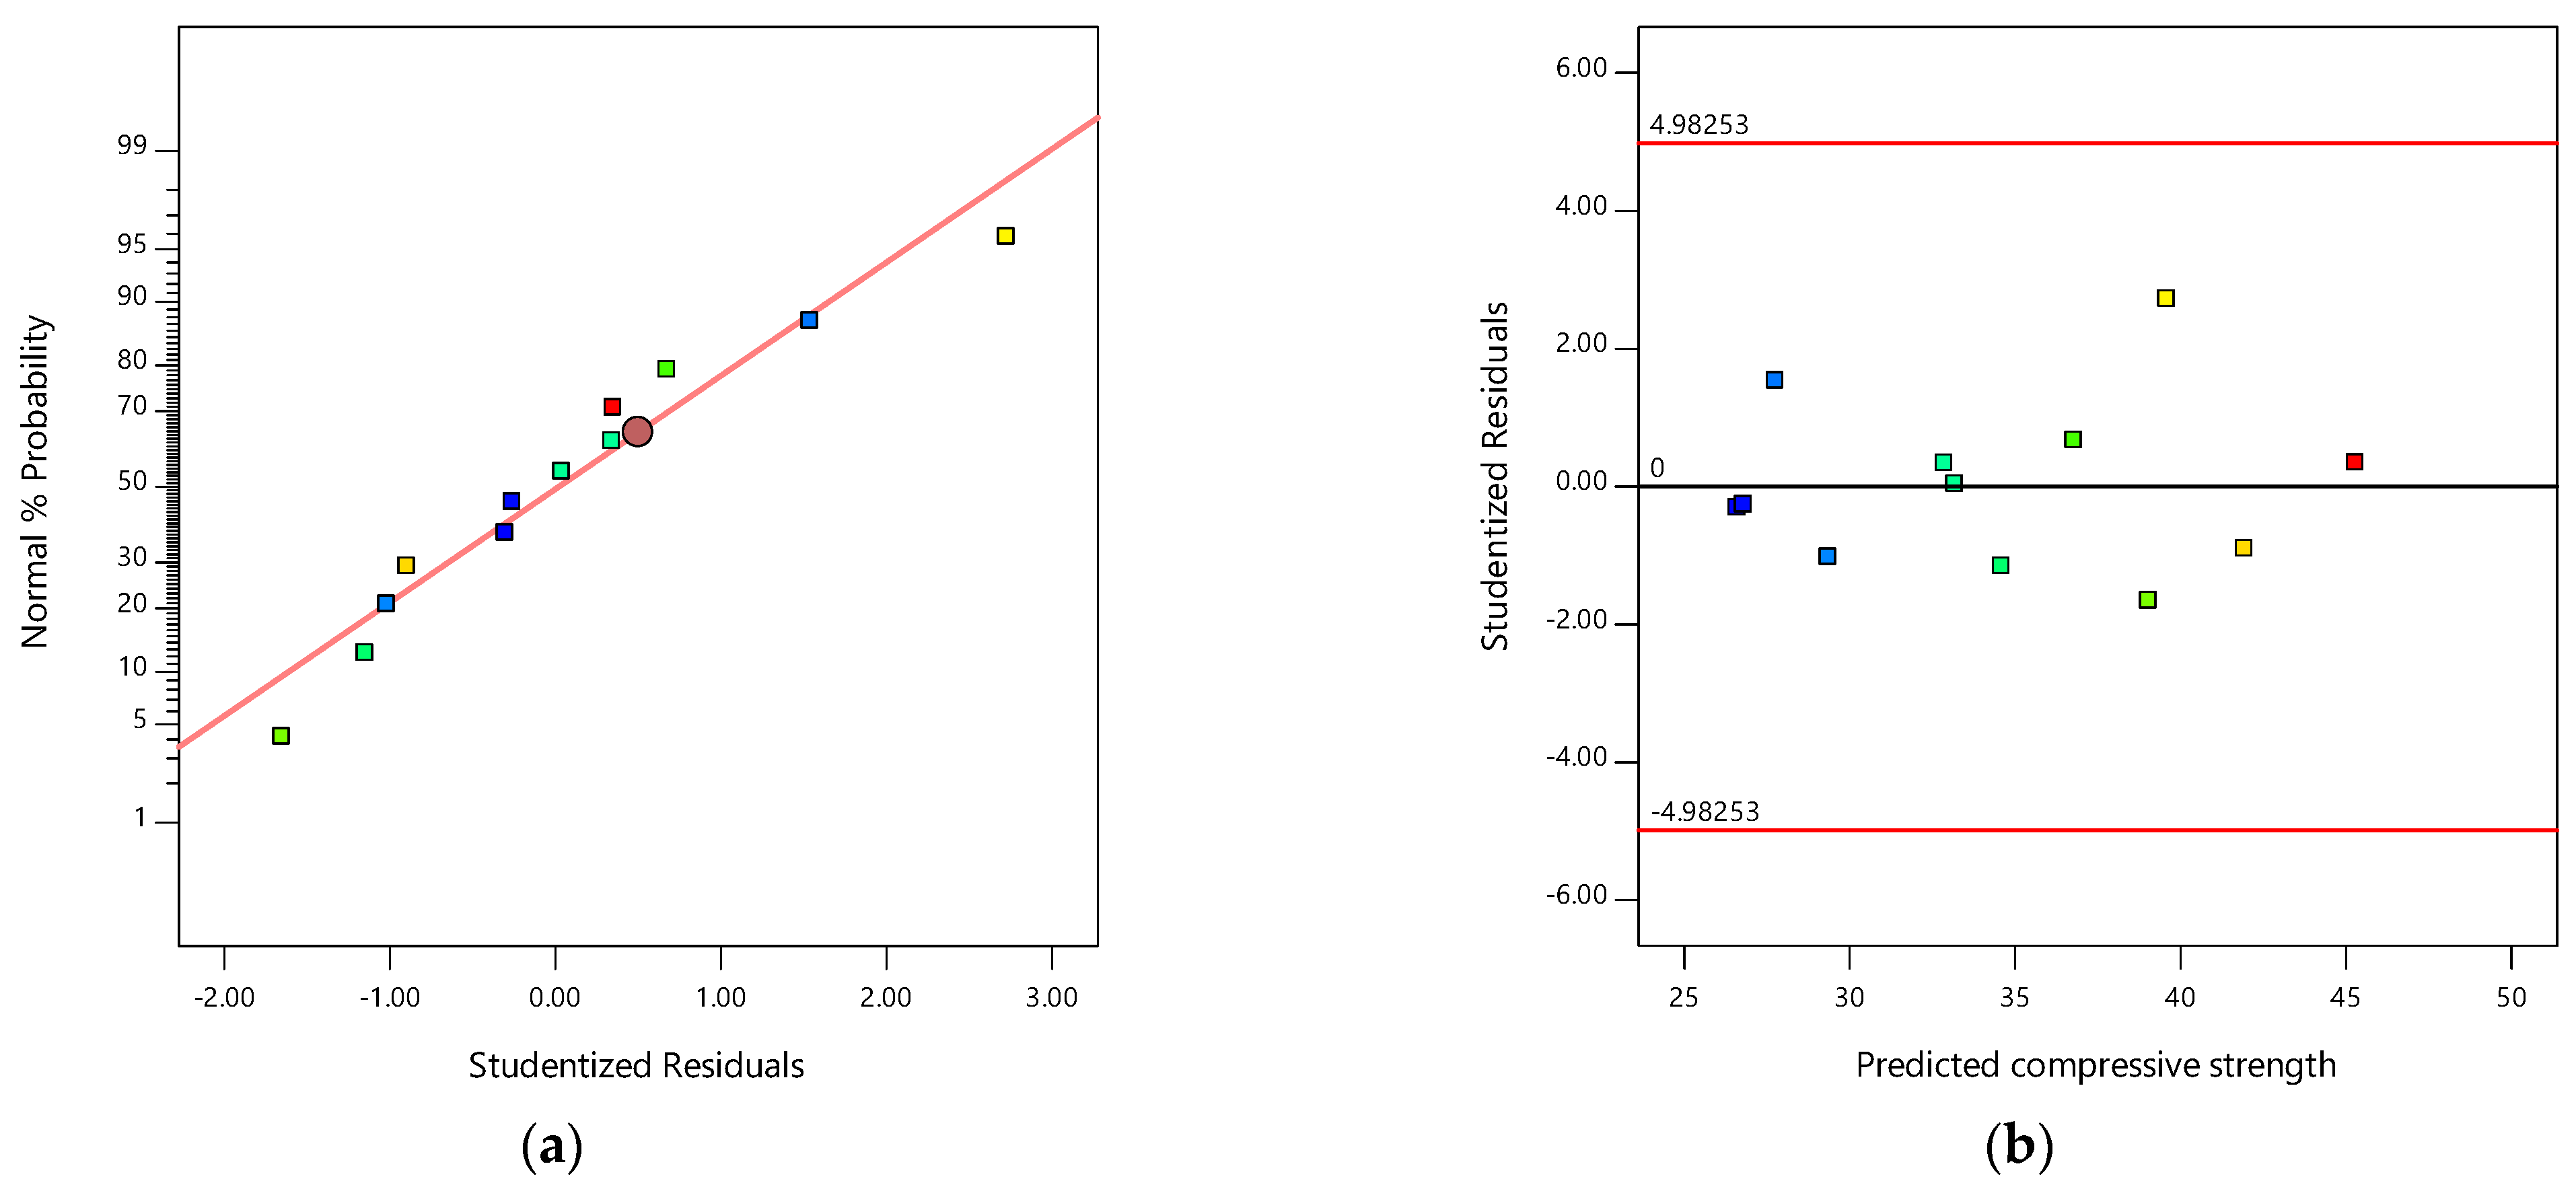
3.6. Optimization of Concrete Properties via RSM
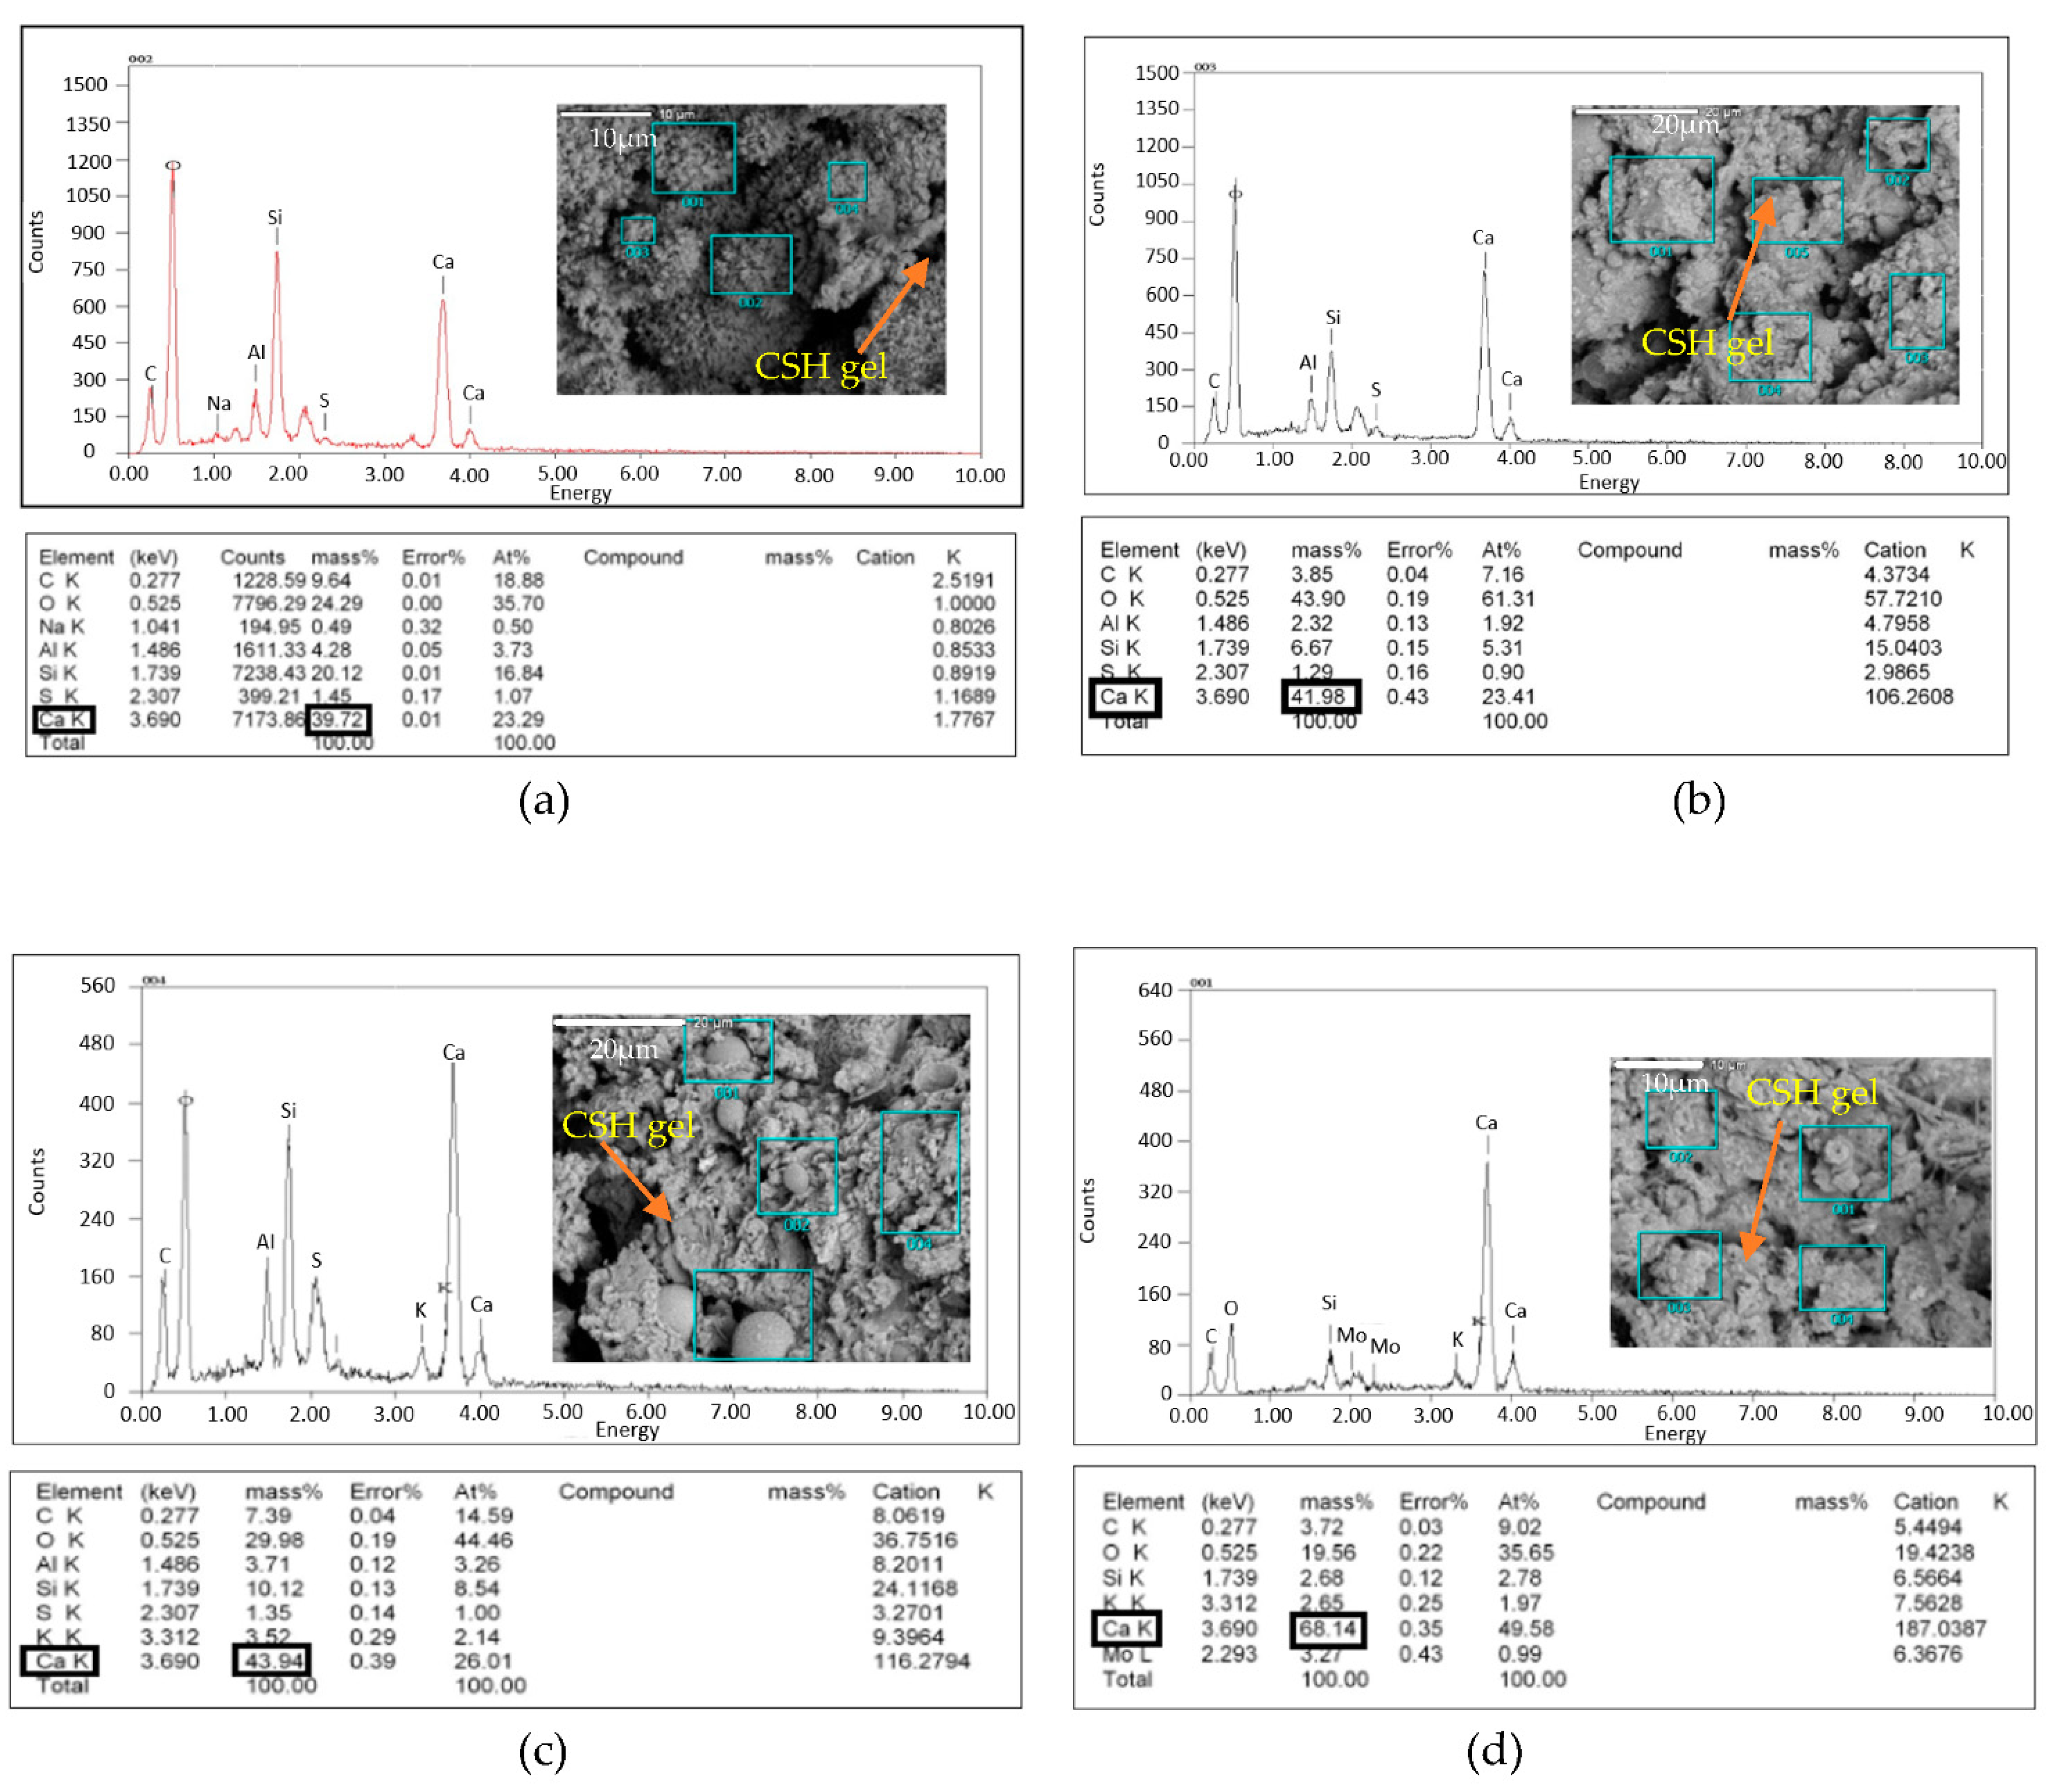
In this study, the point optimization technique in RSM was employed to conduct the optimization process. The condition for the best behavior was adopted based on the experimental results that were obtained from the laboratory and analyzed by RSM. The optimal behavior of the concrete was recorded at 2.18 g/L CL and 23.42 days of curing. The observed and predicted values in compressive strength (y1), splitting tensile strength (y2), flexural strength (y3), and water penetration (y4) were 43.51 MPa vs. 43.43 MPa, 3.19 MPa vs. 3.19 MPa, 6.93 MPa vs. 6.50 MPa, and 7.55 mm vs. 7.55, respectively (Table 8).

3.7. SEM Analysis

The hardened concrete morphology was analyzed in this study via the scanning electronic microscopy image (SEM) combined with EDX for the four specimens (Figure 13). The main purpose of this analysis was to study how much calcium was precipitated inside the bioconcrete at 28 days with the addition of different proportions of CL.
The results showed that the capability of bioconcrete to precipitate calcium increased as the amount of CL increased. Compared to the control specimen (0 B. sphaericus), the calcium content increased by 5.7%, 10.6%, and 71.6% at 0.22 B. sphaericus, 1.09 B. sphaericus, and 2.18 B. sphaericus, respectively. This clearly indicates the effectiveness of CL in the healing process of bioconcrete as it fills up the pores as the calcium carbonate is precipitated. The increments of calcium mass by addition of calcium lactate were 41.98%, 43.94%, and 68.14% for bioconcrete containing 0.22 B. sphaericus, 1.09 B. sphaericus, and 2.18 B. sphaericus, respectively. Table 9 summarizes the calcium mass for all specimens at day 28.

4. Conclusions

The utilization of calcium lactate to enhance the durability and engineering properties of bioconcrete was successfully optimized. The best operating parameters for improving the compressive strength was 43.51 vs. 43.43 Mpa; splitting tensile strength was 3.19 vs. 3.19 Mpa; flexural strength was 6.93 vs. 5.50; and water absorption was 7.55 vs. 7.55 mm at a calcium lactate content of 2.18 g/L and curing period of 23.4 days. These findings indicated that the compressive strength, the splitting tensile strength, and the flexural strength are directly proportional to both the CL content and curing duration. This improvement was due to the higher amount of calcite precipitated with the addition of CL. The water absorption capability of the bioconcrete decreased as the CL content increased. However, it increased as the bioconcrete curing period went higher. The SEM/EDX analysis proved that CL has great potential to be used in the healing process of concrete structures due to its ability to precipitate huge amounts of calcium.

Author Contributions

Conceptualization, S.H.A.S., L.H.A., M.I.J., and N.O.; methodology, S.H.A.S., A.A.A.-G., and L.H.A.; software, S.H.A.S. and A.A.A.-G.; validation, S.H.A.S. and L.H.A.; formal analysis, S.H.A.S. and L.H.A.; investigation, S.H.A.S. and L.H.A.; resources, M.I.J. and N.O.; data curation, S.H.A.S. and L.H.A.; writing—original draft preparation, S.H.A.S.; writing—review and editing, S.H.A.S., A.F.A.-S., and H.A.; visualization, S.H.A.S. and L.H.A.; supervision, M.I.J. and N.O.; project administration, M.I.J. and N.O.; funding acquisition, M.I.J. and H.A. All authors have read and agreed to the published version of the manuscript.

Funding

This research was funded by the Ministry of Higher Education (MoHE) Malaysia under the Fundamental Research Grant Scheme, grant number (FRGS/1/2019/WAB05/UTHM/02/1) and supported by Universiti Tun Hussien Onn Malaysia (UTHM) under MDR (VOT No. H486 & H487). The APC was funded by Universiti Tun Hussien Onn Malaysia (UTHM).

Institutional Review Board Statement

Not applicable.

Informed Consent Statement

Not applicable.

Data Availability Statement

Not applicable.

Acknowledgments

This research was supported by Ministry of Higher Education (MOHE) Malaysia through Fundamental Research Grant Scheme (FRGS)(FRGS/1/2019/WAB05/UTHM/02/1) and Universiti Tun Hussein Onn Malaysia through MDR (Vot H486 & H487).

Conflicts of Interest

The authors declare no conflict of interest.

References

  1. Khaliq, W.; Ehsan, M.B. Crack healing in concrete using various bio influenced self-healing techniques. Constr. Build. Mater. 2016, 102, 349–357. [Google Scholar] [CrossRef]
  2. Algaifi, H.A.; Bakar, S.A.; Alyousef, R.; Sam, A.R.M.; Ibrahim, M.W.; Shahidan, S.; Ibrahim, M.; Salami, B.A. Bio-inspired self-healing of concrete cracks using new B. pseudomycoides species. J. Mater. Res. Technol. 2021, 12, 967–981. [Google Scholar] [CrossRef]
  3. Reinhardt, H.-W.; Jooss, M. Permeability and self-healing of cracked concrete as a function of temperature and crack width. Cem. Concr. Res. 2003, 33, 981–985. [Google Scholar] [CrossRef]
  4. Amziane, S.; Sonebi, M. Overview on Biobased Building Material made with plant aggregate. RILEM Tech. Lett. 2016, 1, 31–38. [Google Scholar] [CrossRef]
  5. Wang, J. Self-Healing Concrete by Means of Immobilized Carbonate Precipitating Bacteria. Ph.D. Thesis, Ghent University, Ghent, Belgium, 2013. [Google Scholar]
  6. Wang, J.; Jonkers, H.M.; Boon, N.; De Belie, N. Bacillus sphaericus LMG 22257 is physiologically suitable for self-healing concrete. Appl. Microbiol. Biotechnol. 2017, 101, 5101–5114. [Google Scholar] [CrossRef] [PubMed]
  7. Siddique, R.; Chahal, N.K. Effect of ureolytic bacteria on concrete properties. Constr. Build. Mater. 2011, 25, 3791–3801. [Google Scholar] [CrossRef]
  8. Parastegari, N.; Mostofinejad, D.; Poursina, D. Use of bacteria to improve electrical resistivity and chloride penetration of air-entrained concrete. Constr. Build. Mater. 2019, 210, 588–595. [Google Scholar] [CrossRef]
  9. Karimi, N.; Mostofinejad, D. Bacillus subtilis bacteria used in fiber reinforced concrete and their effects on concrete penetrability. Constr. Build. Mater. 2020, 230, 117051. [Google Scholar] [CrossRef]
  10. Nguyen, T.H.; Ghorbel, E.; Fares, H.; Cousture, A. Bacterial self-healing of concrete and durability assessment. Cem. Concr. Compos. 2019, 104, 103340. [Google Scholar] [CrossRef]
  11. Algaifi, H.A.; Bakar, S.A.; Sam, A.R.M.; Abidin, A.R.Z.; Shahir, S.; AL-Towayti, W.A.H. Numerical modeling for crack self-healing concrete by microbial calcium carbonate. Constr. Build. Mater. 2018, 189, 816–824. [Google Scholar] [CrossRef]
  12. Algaifi, H.A.; Bakar, S.A.; Sam, A.R.M.; Ismail, M.; Abidin, A.R.Z.; Shahir, S.; Altowayti, W.A.H. Insight into the role of microbial calcium carbonate and the factors involved in self-healing concrete. Constr. Build. Mater. 2020, 254, 119258. [Google Scholar] [CrossRef]
  13. Kumari, C.; Das, B.; Jayabalan, R.; Davis, R.; Sarkar, P. Effect of nonureolytic bacteria on engineering properties of cement mortar. J. Mater. Civ. Eng. 2017, 29, 06016024. [Google Scholar] [CrossRef]
  14. Ghosh, P.; Mandal, S.; Chattopadhyay, B.; Pal, S. Use of microorganism to improve the strength of cement mortar. Cem. Concr. Res. 2005, 35, 1980–1983. [Google Scholar] [CrossRef]
  15. Andalib, R.; Abd Majid, M.Z.; Hussin, M.W.; Ponraj, M.; Keyvanfar, A.; Mirza, J.; Lee, H.-S. Optimum concentration of Bacillus megaterium for strengthening structural concrete. Constr. Build. Mater. 2016, 118, 180–193. [Google Scholar] [CrossRef]
  16. Kunal; Siddique, R.; Rajor, A.; Singh, M. Influence of bacterial-treated cement kiln dust on strength and permeability of concrete. J. Mater. Civ. Eng. 2016, 28, 04016088. [Google Scholar] [CrossRef]
  17. Priya, T.S.; Ramesh, N.; Agarwal, A.; Bhusnur, S.; Chaudhary, K. Strength and durability characteristics of concrete made by micronized biomass silica and Bacteria-Bacillus sphaericus. Constr. Build. Mater. 2019, 226, 827–838. [Google Scholar] [CrossRef]
  18. Mondal, S.; Ghosh, A.D. Investigation into the optimal bacterial concentration for compressive strength enhancement of microbial concrete. Constr. Build. Mater. 2018, 183, 202–214. [Google Scholar] [CrossRef]
  19. Chahal, N.; Siddique, R.; Rajor, A. Influence of bacteria on the compressive strength, water absorption and rapid chloride permeability of fly ash concrete. Constr. Build. Mater. 2012, 28, 351–356. [Google Scholar] [CrossRef]
  20. Nosouhian, F.; Mostofinejad, D.; Hasheminejad, H. Influence of biodeposition treatment on concrete durability in a sulphate environment. Biosyst. Eng. 2015, 133, 141–152. [Google Scholar] [CrossRef]
  21. Vijay, K.; Murmu, M. Effect of calcium lactate on compressive strength and self-healing of cracks in microbial concrete. Front. Struct. Civ. Eng. 2019, 13, 515–525. [Google Scholar] [CrossRef]
  22. Ducasse-Lapeyrusse, J.; Gagné, R.; Lors, C.; Damidot, D. Effect of calcium gluconate, calcium lactate, and urea on the kinetics of self-healing in mortars. Constr. Build. Mater. 2017, 157, 489–497. [Google Scholar] [CrossRef]
  23. Al-Shaibani, M.M.; Radin Mohamed, R.M.S.; Zin, N.M.; Al-Gheethi, A.; Al-Sahari, M.; El Enshasy, H.A. Enhanced Pharmaceutically Active Compounds Productivity from Streptomyces SUK 25: Optimization, Characterization, Mechanism and Techno-Economic Analysis. Molecules 2021, 26, 2510. [Google Scholar] [CrossRef] [PubMed]
  24. European Committee for Standardization. Cement. Composition, Specifications and Conformity Criteria for Common Cements; British Standard Institution: London, UK, 2011; BS EN 197-1:2011; pp. 1–197. [Google Scholar]
  25. Specification for Aggregates from Natural Sources for Concrete; British Standards Institution: London, UK, 1992; BS 882:1992; pp. 1–14.
  26. Xu, J.; Du, Y.; Jiang, Z.; She, A. Effects of calcium source on biochemical properties of microbial CaCO3 precipitation. Front. Microbiol. 2015, 6, 1366. [Google Scholar] [CrossRef] [PubMed]
  27. Standard Test Method for Compressive Strength of Cement Mortar; British Standard Institution: London, UK, 2002; B EN 12390:2002; Part-3.
  28. Testing Hardened Concrete. Tensile Splitting Strength of Test Specimens; British Standard Institution: London, UK, 2009; B EN 12390:2009; Part-6.
  29. Testing Hardened Concrete. Flexural Strength of Test Specimens; British Standards Institution: London, UK, 2009; B EN 12390:2009; Part-5.
  30. Testing Hardened Concrete; British Standard Institution: London, UK, 2009; B EN 12390:2009; Part-8.
  31. Myers, R.H.; Montgomery, D.C.; Anderson-Cook, C. Process and product optimization using designed experiments. Response Surf. Methodol. 2002, 2, 328–335. [Google Scholar]
Figure 1. Compressive strength.
Sustainability 13 09269 g001
Figure 2. Interaction of CL content and curing period and their effects on the compressive strength.
Sustainability 13 09269 g002
Figure 3. (a) Normal % probability and studentized residual plot for compressive strength, (b) the studentized residuals and predicted response plot for compressive strength.
Sustainability 13 09269 g003
Figure 4. Splitting tensile strength.
Sustainability 13 09269 g004
Figure 5. Interaction of CL content and curing period and their effects on the splitting tensile strength.
Sustainability 13 09269 g005
Figure 6. (a) Normal % probability and studentized residual plot for splitting tensile strength, and (b) the studentized residuals and predicted response plot for splitting tensile strength.
Sustainability 13 09269 g006
Figure 7. Flexural strength.
Sustainability 13 09269 g007
Figure 8. Interaction of CL content and curing period and their effects on the flexural strength.
Sustainability 13 09269 g008
Figure 9. (a) Normal % probability and studentized residual plot for flexural strength, (b) the studentized residuals and predicted response plot for flexural strength.
Sustainability 13 09269 g009
Figure 10. Water penetration.
Sustainability 13 09269 g010
Figure 11. Interaction of CL content and curing period and their effects on the water penetration.
Sustainability 13 09269 g011
Figure 12. (a) Normal % probability and studentized residual plot for water penetration, (b) the studentized residuals and predicted response plot for water penetration.
Sustainability 13 09269 g012
Figure 13. SEM images of (a) 0 B. sphaericus, (b) 0.22 B. sphaericus, (c) 1.09 B. sphaericus, (d) 2.18 B. sphaericus.
Sustainability 13 09269 g013
Table 1. Calcium lactate concentrations.
Chemical Formula of Calcium LactateC6H10CaO6Weight of Calcium Lactate Used Based on Water (34.2 kg)
Molar mass of calcium lactate218 g/mol-
0.001 mol/L × 218 g/mol0.22 g/L7.5 g
0.005 mol/L × 218 g/mol1.09 g/L37.3 g
0.01 mol/L × 218 g/mol2.18 g/L74.6 g
Table 2. Mix design proportions of control and bacterial specimens.
Batch No.SpecimensCement
(kg)
Fine Aggregate
(kg)
Coarse Aggregate
(kg)
Water
(L)
Bacteria in Nutrient Broth
(L)
Calcium Lactate
(g)
15% B. sphaericus63111.618332.51.71-
20.22 B. sphaericus63111.618332.51.717.5
31.09 B. sphaericus63111.618332.51.7137.3
42.18 B. sphaericus63111.618332.51.7174.6
Table 3. Central composite design arrangement and responses of bioconcrete with CL content (0–2.18 g/L) (x1) and curing period (7–28 days) (x2).
Run x 1 x 2 y 1 y 2 y 3 y 4
ExperimentPredictionExperimentPredictionExperimentPredictionExperimentPrediction
10726.4026.602.542.563.743.755.655.54
20.22726.6026.792.562.533.773.765.295.46
31.09728.6027.752.582.583.783.795.235.17
42.18728.9029.363.013.013.823.824.814.81
501433.1032.862.632.655.205.227.237.07
60.221433.2033.172.652.625.245.236.776.97
71.091433.9034.592.672.685.265.266.696.62
82.181437.2036.783.123.115.315.316.156.19
902838.2039.032.702.726.606.619.409.20
100.222840.8439.582.722.696.656.638.809.08
111.092841.3741.932.742.756.676.688.708.60
122.182845.4145.283.203.206.746.748.008.02
(y1) compressive strength; (y2) splitting tensile strength; (y3) flexural strength; and (y4) water penetration.
Table 4. Regression coefficients of the CL content and curing period and their significance on the bioconcrete compressive strength.
TermCoefficientF Valuep Value
y 1 y 1 y 1
Model37.45116.73<0.0001
x 1 2.0746.980.0005
x 2 7.18500.64<0.0001
x 1 x 2 0.78595.440.0585
x 1 2 0.18490.14510.7164
x 2 2 −2.3815.940.0072
R2 = 0.9898; R2adjusted = 0.9813.
Table 5. Regression coefficients of the CL content and curing period and their effects on the bioconcrete splitting tensile strength.
TermCoefficientF Valuep Value
y 2 y 2 y 2
Model2.74175.04<0.0001
x 1 0.2464773.37<0.0001
x 2 0.085882.80<0.0001
x 1 x 2 0.00610.37490.5628
x 1 2 0.1634131.22<0.0001
x 2 2 −0.04416.330.0455
R2 = 0.9932; R2adjusted = 0.9875.
Table 6. Regression coefficients of the CL content and curing period and their effects on the bioconcrete flexural strength.
TermCoefficientF Valuep Value
y 3 y 3 y 3
Model5.8112,833.29<0.0001
x 1 0.044159.450.0002
x 2 1.4556,490.15<0.0001
x 1 x 2 0.01153.230.1222
x 1 2 −0.00200.04530.8385
x 2 2 −0.57662595.72<0.0001
R2 = 0.9999; R2adjusted = 0.9998.
Table 7. Regression coefficients of the CL content and curing period and their effects on the bioconcrete water penetration.
TermCoefficientF Valuep Value
y 4 y 4 y 4
Model7.18126.06<0.0001
x 1 −0.428835.230.0010
x 2 1.71492.54<0.0001
x 1 x 2 −0.10371.650.2462
x 1 2 0.00790.00460.9484
x 2 2 −0.34315.780.0531
R2 = 0.9999; R2adjusted = 0.9998.
Table 8. The optimal performance to improve the concrete engineering properties.
Run x 1 x 2 y 1 y 2 y 3 y 4
ActualPredictedActualPredictedActualPredictedActualPredicted
12.1823.4243.5143.433.193.196.936.507.557.55
Table 9. Ca mass % from SEM/EDX analysis.
SpecimenCa Mass (%)
0 B. sphaericus39.72
0.22 B. sphaericus41.98
1.09 B. sphaericus43.94
2.18 B. sphaericus68.14
Publisher’s Note: MDPI stays neutral with regard to jurisdictional claims in published maps and institutional affiliations.

