Article

Impact of COVID-19 Pandemic on Home Range in a Suburban City in the Osaka Metropolitan Area

Department of Housing and Environmental Design, Graduate School of Human Life Science, Osaka City University, Osaka 5588585, Japan
*
Author to whom correspondence should be addressed.
Sustainability 2021, 13(16), 8974; https://doi.org/10.3390/su13168974
Submission received: 9 July 2021 / Revised: 7 August 2021 / Accepted: 9 August 2021 / Published: 11 August 2021

Abstract

:
This study aims to clarify the impact of the COVID-19 pandemic on home range. The home range is the area that individuals traverse in conducting their daily activities, such as working and shopping. In Japan, the central government declared the first state of emergency in April 2020. This study analyzed the panel data for mobile phone GPS location history from April 2019 to April 2020 in Ibaraki City, Osaka Metropolitan area. The study applied the minimum convex polygon method to analyze the data. The results show that the home range decreased significantly between April 2019 and April 2020. Specifically, the home range in 2020 decreased to approximately 50% of that in 2019 because of COVID-19 infection control measures, preventing people from traveling far from their homes and only allowing them to step outside for the bare minimum of daily activities and necessities. The results suggest that the emergency reduced people’s home ranges to the neighborhood scale. Therefore, it is necessary to consider designing new walkable neighborhood environments after the COVID-19 pandemic era.

1. Introduction

1.1. Background

A significant social problem in Japan is population decline, with a rapidly increasing number of older adults. In 2019, the Japanese aged population (65 years old and over) was 35.89 million, constituting 28.4 percent of the total population [1]. For an aging society, the home range is an essential indicator in planning a “community-based integrated care system” to support the daily activities of older adults [2]. The home range is defined as the area that individuals traverse in conducting their daily activities, such as working and shopping [3]. In other words, the home range is one of the essential considerations for policymakers and urban planners in Japan. Therefore, the government has introduced enhanced policies that allow citizens to conduct their daily activities on a neighborhood scale. For example, in the field of urban planning, many local governments developed the “Location Optimization Plan” [4].
One of the aims of planning is to improve walkability by designing walkable neighborhoods. Walkability is defined as a property of a residential environment that promotes walking or cycling with safety, comfort, and the attractions of daily life [5]. Designing walkable neighborhoods could contribute to reducing the burden on the environment [6]. Additionally, the design could contribute to promoting the health of older adults [7,8]. Chen et al. [9] found that older adults living in high walkability areas tend to be healthier, with higher physical activity levels. The contribution could help to keep healthcare costs under control and maintain sustainable financial balances in local governments.
The Coronavirus Disease 2019 (COVID-19) pandemic might accelerate the change as the “new normal” lifestyle. For example, the mayor of Paris, Anne Hidalgo, proposed the realization of a 15-min city by 2024, in a move toward the design of walkable neighborhoods after the COVID-19 pandemic era, where people can live without using cars [10]. There has been an increase in research on the progression toward the realization of the 15-min city [11]. In Japan, the first recorded case of COVID-19 occurred in January 2020, and the Japanese central government declared the first state of emergency on 7 April 2020 [12]. In Osaka Metropolitan area, the state of emergency lasted until 21 May 2020. Since then, the number of infected people has continued to fluctuate in Osaka [13]. During the first state of emergency in Ibaraki City in Osaka Metropolitan area, Kato [14] reported that dense human space-times were formed in the parks as well as in the stations. Similarly, Kato et al. [15] reported an increasing number of bicycle trips. Those studies suggest that the home range might be decreased to the neighborhood scale due to the state of emergency. Therefore, this study focuses on changes in the home range during the COVID-19 pandemic.

1.2. Purpose

This study aims to clarify the impact of the COVID-19 pandemic on home ranges in suburban Ibaraki City, Osaka Metropolitan area. The study primarily employed the minimum convex polygon (MCP) method using mobile phone GPS location history (LH) data. The analysis was conducted on panel data from April 2019 to April 2020 using the case study of Ibaraki City. The period and area of the LH data are the same as that of the studies of Kato [14] and Kato et al. [15]. Using the LH data, this study clarified the home range by utilizing MCP.
Ibaraki City is a suburban city in the Osaka Metropolitan suburban area located midway between Osaka City and Kyoto City, as shown in Figure 1. Ibaraki City frequently collaborates with neighboring municipalities in the metropolitan suburban area. Residents of this city frequently commute about 30 min to neighboring cities, such as Osaka City or Kyoto City, because of the city’s extensive train network. The population of Ibaraki City is approximately 280,000, and its area is 10 km east-west and 17 km north-south. Similar to other cities, it experienced an increase in COVID-19 infections during the state of emergency. However, during April 2020, only zero to three Ibaraki citizens were infected with COVID-19 [13]. This number of cases was small compared to other cities in Osaka Prefecture.

1.3. Novelty

The impact of the COVID-19 pandemic on the home range is still being studied. For example, the COVID-19 pandemic has led to the widespread adoption of telecommuting among adults and remote learning among children [16]. In order to understand daily activities more accurately, mobile phone GPS data is used. Lee et al. [17] clarified that equitable policy decisions could be made based on the LH data because the LH data thus obtained can provide more accurate population data than census data in emergencies. Oliver et al. [18] pointed out the effectiveness of using mobile phone data for analysis in the COVID-19 pandemic. Using GPS data, the spatial distribution of COVID-19 infected people has been verified in China [19]. In the United States, it was confirmed that there was an association between mobility patterns and COVID-19 transmission by using mobile phone location data [20]. Using mobile phone data, Chang et al. [21] simulated the spread of the infection and pointed out the necessity of controlling the movements of a few super spreaders. In addition to mobility-related information, mobile phone data can also allow researchers to determine which citizens stayed at home [22]. These studies suggest the effectiveness of mobile phone GPS LH data during the COVID-19 pandemic.
However, the impact of the state of emergency varied from country and region. In particular, the Japanese state of emergency was called a “soft lockdown” [23]. This is because the Japanese government restricted the activities of companies and other organizations but not of individuals [24]. Therefore, most citizens could go out, at least minimally, even under the state of emergency declaration. In fact, Anzai et al. [25] reported that widespread travel projects could spread the infection. In Tokyo, Yabe et al. [26] found that human mobility decreased by more than 50% and social contact by more than 70% between January and April 2020. By contrast, unexpectedly high population densities had been reported in suburban cities [27]. Therefore, the population may have decreased in urban centers but increased in suburban cities. Kato [14] obtained a similar result using the case of Ibaraki City. Therefore, this present study’s novel contribution is to quantitatively clarify changes in home ranges using LH data in the suburban city. The study’s results will allow us to consider designing a new neighborhood environment after the COVID-19 pandemic era.

2. Materials and Methods

2.1. Mobile Phone GPS Location History Data

The present study used LH data comprising GPS location data obtained at regular intervals from mobile phones with users’ consent. The time interval for data collection was approximately every 15 min, depending on the mobile phone type. In Ibaraki City, there are approximately 1,600,000 LH data logs per day for approximately 12,000 individuals. The LH data can be considered as that of approximately 4.2% of its citizens. In Japan, the Agoop Corporation collects daily mobile phone location data and provides anonymized data for research purposes [28]. Governments and municipalities have used GPS data provided by Agoop Corporation for the control of the COVID-19 infection [29]. In addition, Kato [14] and Kato et al. [15] studied human mobility using the LH data provided by Agoop Corporation. Therefore, the LH data was validated as high-quality data used in policymaking and research to control the pandemic. This study complies with the “Guidelines for the Use of Device Location Data,” a common regulation for location data in Japan [30]. For example, the guideline prohibits using GPS data for any purpose that involves identifying individual users. The data were collected by obtaining consent from the mobile phone users, all of whom installed specific applications based on the type of data to be collected, the purpose of use, the provision to third parties, and the privacy policy. One of the applications is “WalkCoin,” which uses pedometers to help users earn e-coins [31]. Therefore, the LH data provided by Agoop have been acquired mainly from ordinary citizens. Additionally, users can stop sending the GPS location data by changing their phones’ basic settings. The data were obtained through contracts between Agoop Corporation and the Graduate School of Life Sciences at Osaka City University, where the authors work.
The LH data mainly comprises the following variables: daily ID, user ID, year, month, day, day of week, hour, minutes, latitude, longitude, operating system (Android/iOS), country, GPS accuracy, speed, mesh ID, estimated transportation methods, and gender. User IDs are anonymized 96-digit alphanumeric codes, including information that protects personal privacy such as names, ages, and addresses. The user ID is a permanent ID assigned to each device and enables panel data analysis. Among these variables, this study used user ID, year/month/day, hour/minutes, and latitude/longitude.
The study extracted data on people living in Ibaraki City. Therefore, data relating to people who only passed through Ibaraki City—for example, people going from Osaka to Tokyo by train or car—were excluded. The study extracted user IDs with LH data that started after 03:00 AM and were obtained from users located in Ibaraki City. This means that the time the mobile phone was turned on and GPS data was collected was after 3:00 AM. The time of 03:00 AM was selected because it had the lowest amount of LH data on traveling by walking, cycling, trains, or cars, as observed by analyzing the estimated travel methods at each hour, as shown in Figure 2. This study analyzed the home range from 3:00 to 27:00. Moreover, it assumed that the users were asleep and in the same location when the smartphone was turned off after 3:00 and before 27:00.
The LH data provided by Agoop were not obtained from all mobile phones in Japan. As mentioned above, the dataset in this study represents approximately 4.2% of Ibaraki City’s population. An equation to estimate the population by analyzing the relationship between actual traffic surveys and LH data was proposed [32]. However, it is possible to analyze the home range distribution without using LH data from the entire population. Furthermore, the penetration rate of mobile phones in Japan is high across all generations. Therefore, this study’s utilized data were considered adequate for giving an accurate picture of the changes in the home range.

2.2. Panel Data Analysis for the COVID-19 Pandemic

This study performed panel data analysis during the first state of emergency. It compared the panel data for one month from when Japan implemented the state of emergency in April 2020 with the panel data for April 2019. Many cities worldwide were also in lockdown in April 2020. On 7 April 2020, when the emergency was declared, Osaka Prefecture requested people to stay at home and cancel any events, as shown in Figure 3 [33]. On 14 April 2020, a week later, the government requested restrictions on the unnecessary use of facilities such as community centers, public libraries, and gymnasiums [34]. Compliance with these requests might lead to the gradual narrowing down of residents’ home ranges. Therefore, it is valid to analyze the periods of April 2019 and April 2020.

2.3. Minimum Convex Polygon

This study analyzed home ranges using the MCP method. The MCP method is an established radio–telemetric analysis method for estimating animals’ home ranges. The radio–telemetry analysis involves tracking individual animals using GPS. This analysis has contributed significantly to animal ecological research development since the 1960s. The kernel density method is another well-known radio–telemetric home range estimation method [35,36]. This method describes the utilization probability of points through a probability density function. However, the advantage of MCP is its simplicity and intuitive use. MCP analyzes zones that connect the outermost observation points [37]. It generally calculates the home range area. However, it was used in this study to calculate the home range length (HR-length), which is the distance to the farthest point moved from the home. This is because local governments used distance when considering infection prevention measures during the COVID-19 pandemic.
Specifically, the HR-length was calculated in three phases. First, a personal space-time path between 3:00 and 27:00 was drawn. Then, this study identified the starting home point after 3:00, and the farthest point moved from the home between 3:00 and 27:00. Secondly, the home range distance for each mobile phone user was calculated from the latitude and longitude difference between the starting home point and the farthest point moved from the home. Thirdly, based on the space-time paths of multiple mobile phone users, their HR-length were calculated. Then, the averages of their HR-length for each day were calculated. Figure 4 presents the schematic diagram of the equation used to analyze the MCP.
This study performed a series of analyses using HR-length data. First, the change in the average HR-length was analyzed for April 2019 and April 2020. Next, the average value of the HR-length for each week was calculated. Finally, municipalities with the farthest points moved from homes were analyzed.

3. Results

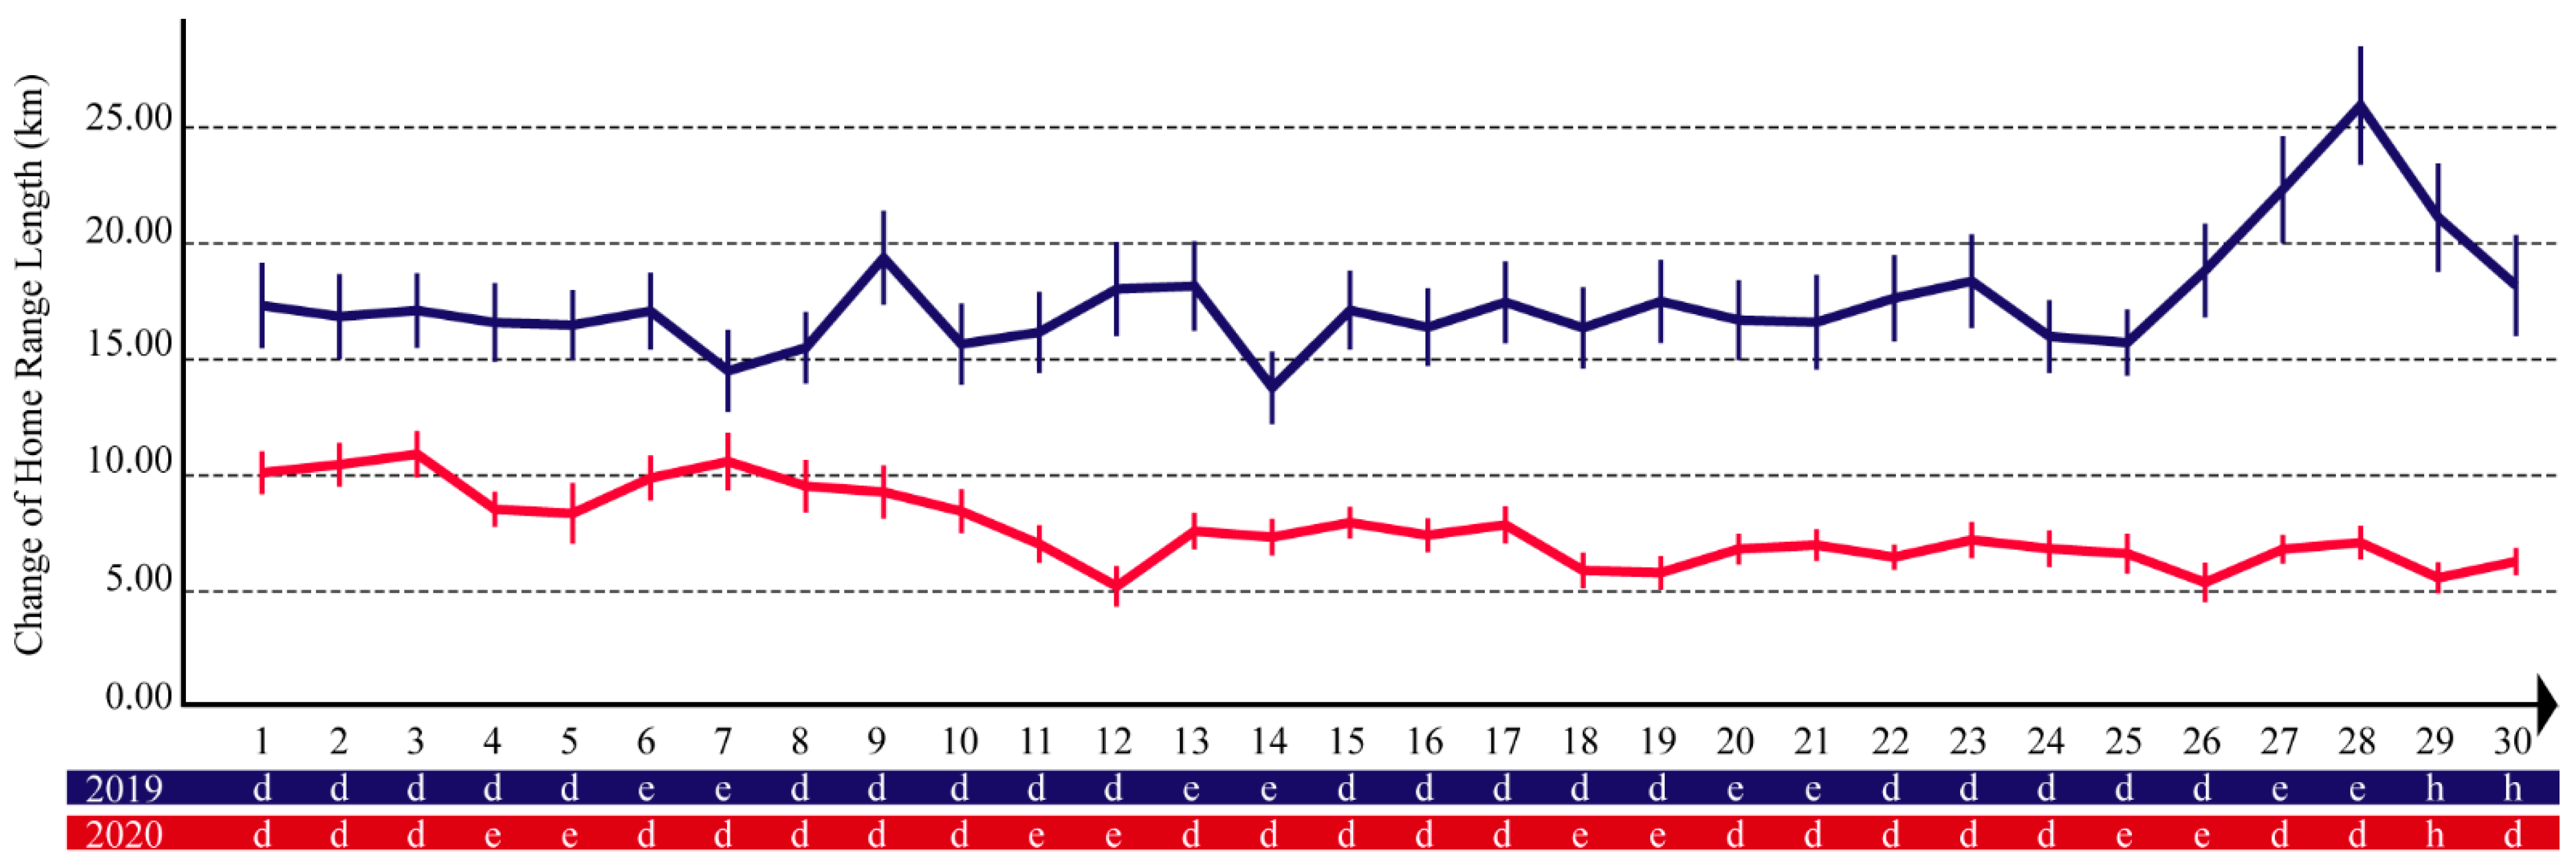
3.1. Change of Daily Home Range Length

The analysis results of the HR-length of each day, calculated by applying the MCP method, are shown in Figure 5. Figure 5 shows the analysis of the average and 95% intervals of the HR-length in a time series. In Figure 5, “d” means weekday and “e” means weekend. It shows that the HR-length decreased significantly between April 2019 and April 2020 because of the COVID-19 pandemic. Next, the changes in HR-length in April 2019 and April 2020 were examined separately. In 2019, the HR-length tended to be higher on weekdays than on weekends and holidays. However, at the end of April, Japan has a long holiday called “the Golden Week.” In 2019, this was a 10-day holiday, when many people went on trips or returned to their hometowns. Therefore, the HR-length increased significantly from 26 April 2019, when the holiday started.
In 2020, the HR-length at the beginning of April was approximately two-thirds of what it was in April 2019. Since mid-March, Osaka Prefecture had requested that residents refrain from leaving the prefecture. Therefore, as of 1 April 2020, the HR-length had already decreased. Subsequently, the length at the end of April 2020 fell to approximately half of that in April 2019. After 7 April when the state of emergency was declared, the length decreased further, reducing daily, particularly between 7 and 12 April. The government did not impose any penalties on those who broke the rules; therefore, many people gradually changed their home ranges even after the state of emergency was declared. However, from the third to fourth week of April 2020, the HR-length did not change significantly because people’s behavior had changed sufficiently and the government had asked residents to refrain from traveling during the Golden Week.

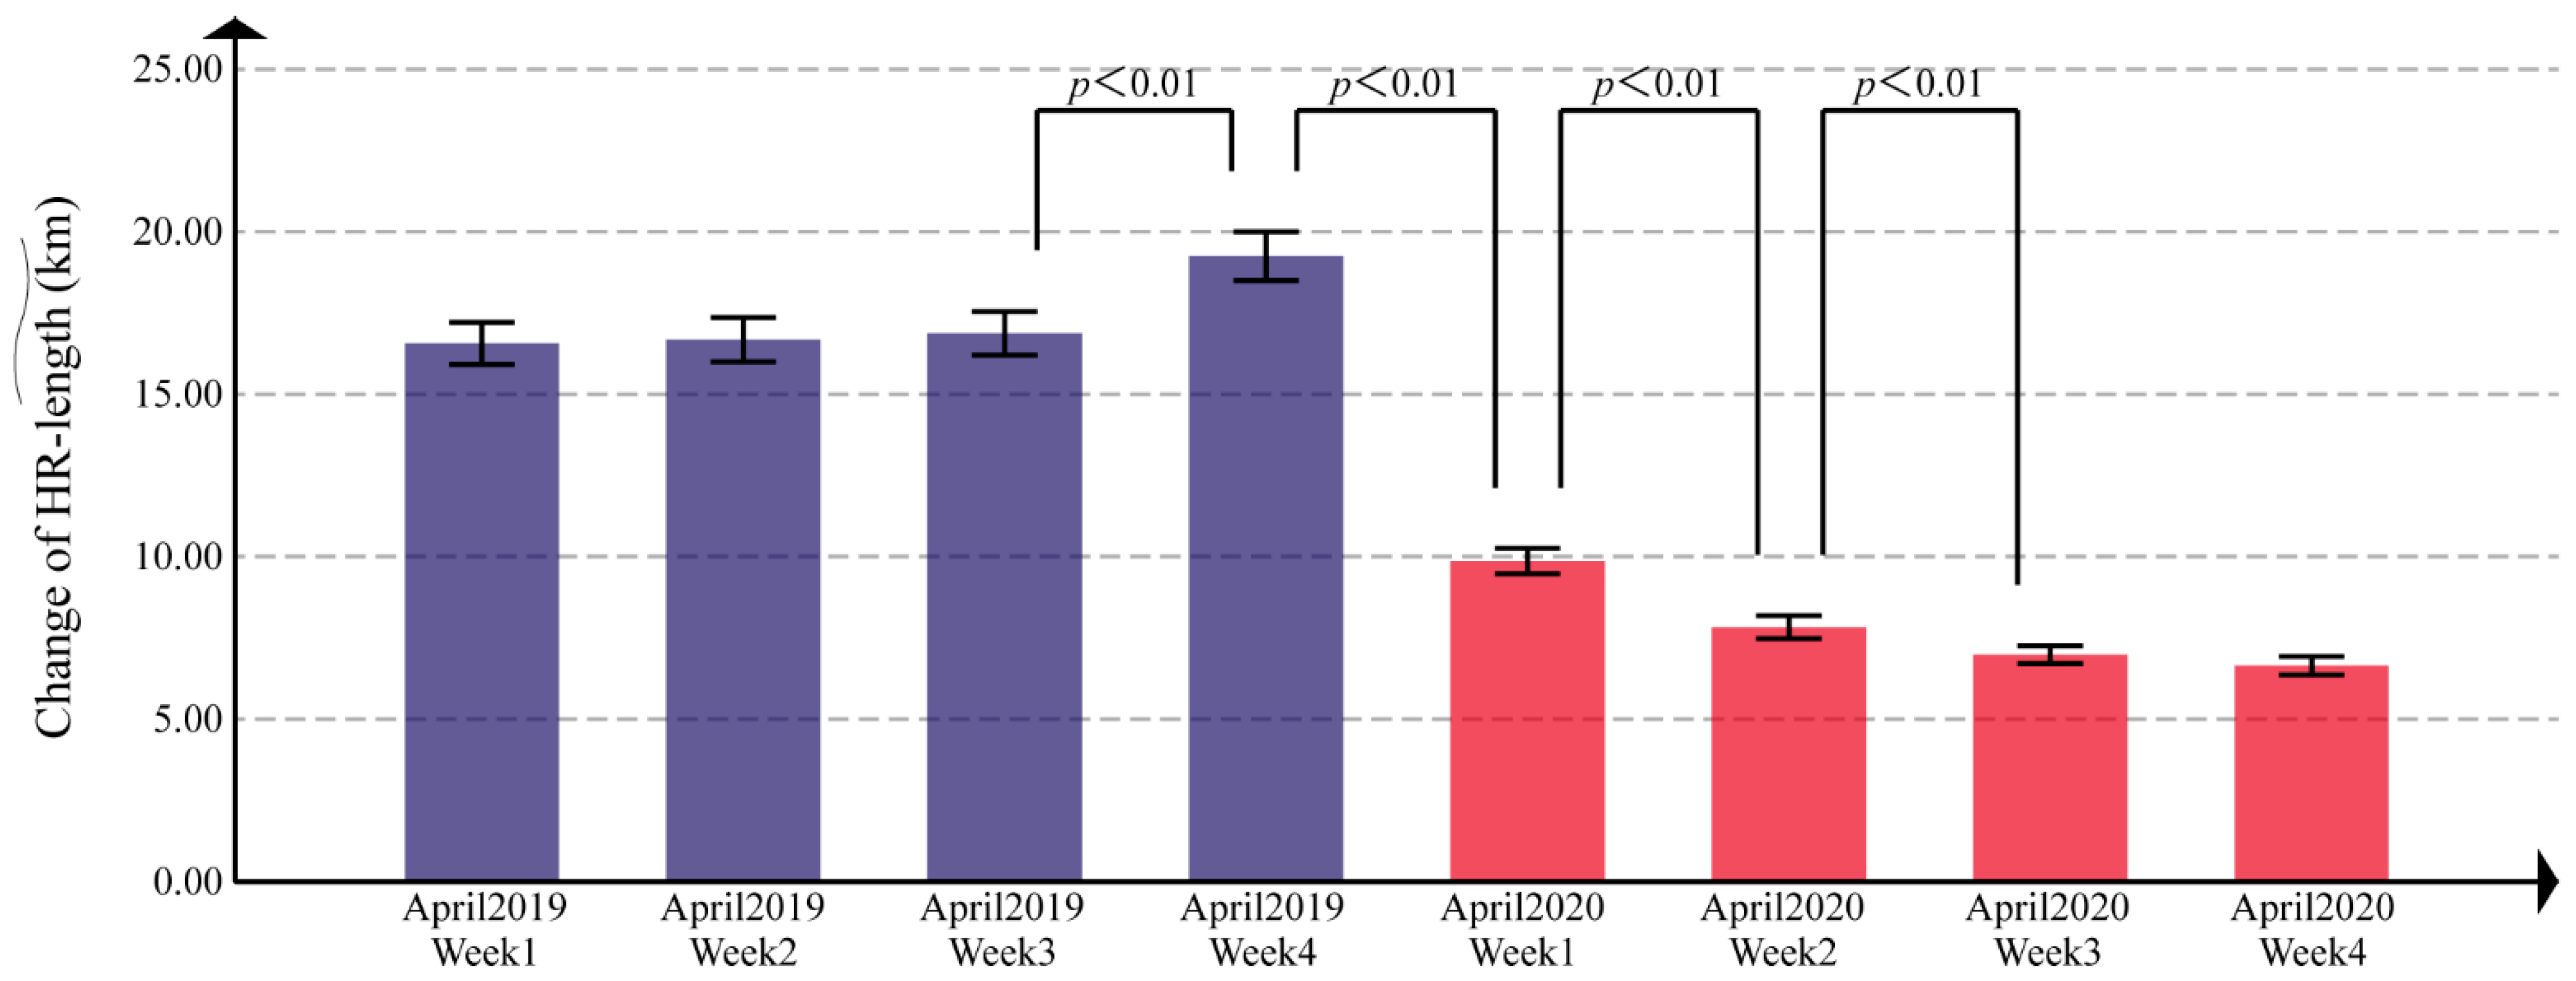
3.2. Change of Weekly Home Range Length

Next, the weekly averages of the home range length were analyzed, and the results are shown in Figure 6. Significant differences in the average values for each week are indicated by the student t-test. Figure 6 shows the analysis of the average and 95% intervals. In Figure 6, blue is each week of April 2019 and red is each week of April 2020. There was a significant increase in the average value of the HR-length for each week (abbreviated as HR length ˜ ) from the third to fourth week of April 2019 ( HR length ˜ 2019w3 = 16.88 km; HR length ˜ 2019w4 = 19.25 km), which verifies that the Golden week increased the HR length ˜ . However, there was a significant decrease in HR length ˜ in the first week of April 2020 compared with the fourth week of April 2019 in order to analyze the impact of the COVID-19 pandemic. The HR length ˜ in 2020 was found to have decreased to approximately half that of 2019 ( HR length ˜ 2020w1 = 9.86 km). After that, the HR length ˜ continued to decrease significantly over the second ( HR length ˜ 2020w2 = 7.86 km) and third ( HR length ˜ 2020w3 = 6.99 km) weeks of 2020. This result validates the daily change of HR-length in Figure 5, which shows a significant decrease in HR length ˜ with the declaration of a state of emergency.

3.3. Municipalities of the Farthest Points

Subsequently, the municipalities comprising the farthest point moved from the residents’ homes were analyzed, and the results are shown in Figure 7. These results reveal that the distribution of the farthest points did not change significantly from the first to the fourth week of April 2019. For example, the ratio of Ibaraki City as the farthest point moved from residents’ homes went from approximately 45% to 48%. However, the ratio of Ibaraki City as the farthest point moved from residents’ homes was significantly different between the fourth week of April 2019 and the first week of April 2020. In particular, this changed significantly between the first and second weeks of April 2020. In the first week of April 2020, before the state of emergency was declared, the ratio of Ibaraki City as the farthest point was approximately 60%. However, in the second week of April 2020, after the state of emergency was declared, this ratio increased to approximately 65%. Figure 7 shows that the ratio of Takatsuki, Suita, Settsu, and Minoh Cities, which neighbor Ibaraki City, as the farthest point did not change significantly between April 2019 and April 2020. However, travel to urban centers such as the north and central wards in Osaka City decreased significantly.

4. Discussion

This study clarified that the HR-length decreased to approximately half during the COVID-19 pandemic in the suburban city of Ibaraki City in the Osaka Metropolitan area. Specifically, the HR-length between April 2019 and April 2020 decreased rapidly, with a significant difference observed. The HR length ˜ in 2020 was found to have decreased to approximately 50% that of 2019. Travel to the urban center of Osaka City decreased significantly because of the state of emergency, which prevented people from traveling far from their homes and only allowed them to go out for the bare minimum of daily activities. The results suggest that the COVID-19 pandemic reduced people’s home ranges on a neighborhood scale. Specifically, in the suburban city, people did not go to urban centers but rather lived in their own and neighboring cities. The results are surprising in a suburban city where many residents live in wide home ranges.
The results are logically matched with two previous studies in Ibaraki City in April 2020, which is the same period and area of this research. First, Kato [14] clarified that dense human space-times were formed in the parks as well as in the stations. This means that they did not go from the stations to the urban centers but rather visited the neighborhood parks. In Ibaraki City, the information distributed by the government frequently warned of increased population density in its parks [38]. Second, Kato et al. [15] reported an increased number of bicycle trips, which suggests that people moved around the neighborhood. As in Houston and parts of Seattle, Doubleday et al. [39] found that the number of people who walked and rode bicycles increased with the government’s stay home order. In Ibaraki City, the police department reported that the number of injuries in traffic accidents related to cycling increased [40].
A limitation of this study is that it focused only on the variable of distance. Although this study confirmed that people’s travel distances to the farthest location were reduced, the activities near their homes might have increased slightly. MCP, which is the study method, could analyze the space-time area of zones that connect the outermost observation points. Kato [14] reported that dense human space-times were unexpectedly formed in the parks. The risk of infection with COVID-19 increased as they contacted others. However, in New York, Oishi et al. [41] found that the higher the walkability of districts, the lower the number of COVID-19 infections and deaths. Therefore, the place and duration of stay should be clarified in future studies. Furthermore, by including the data of infected individuals, causal relationships between the number of infected people and home ranges could be examined.

5. Conclusions

The study’s results show that the HR-length decreased to approximately half during the state of emergency, which suggests that we should consider the design of new neighborhood environments after the COVID-19 pandemic era. Paris [10] proposed 15 min cities, and Portland [42] proposed 20 min neighborhoods. Japan, with its aging society, also needs to redesign its cities strategically. Such a design is expected to contribute to Goal 11 of the Sustainable Development Goals (SDGs): “Make cities and human settlements inclusive, safe, resilient and sustainable.” The COVID-19 pandemic has indeed accelerated the need to enrich neighborhood environments.
As Japan’s population continues to decline, neighborhood stores and hospitals have tended to cluster around urban centers and neighborhood environments are beginning to lack necessary urban facilities. However, to support the lives of the increasing number of older adults, walkable neighborhoods are essential in planning a “community-based integrated care system” [2]. In the short term, during the COVID-19 pandemic, placemaking projects were practical for enriched neighborhood environments. It has been noted that “with community-based participation at its center, an effective placemaking process capitalizes on a local community’s assets, inspiration, and potential, and it results in the creation of quality public spaces that contribute to people’s health, happiness, and well-being” [43]. During the COVID-19 pandemic, well managed outdoor placemaking projects were effective in preventing COVID-19 infection [44]. Short-term placemaking projects are more effective in collaboration with local governments and citizens. In the long term (i.e., after the COVID-19 pandemic), in order to maintain the citizens’ daily activities, there is a need for urban planning that diversifies the land use of the neighborhood environment. The central government needs to take the initiative in changing long-term urban planning as part of a national strategy. It is essential to have urban facilities such as stores and hospitals within walking distance. Though cities with growing populations have simplified land uses, shrinking cities need to diversify land uses for walkable neighborhoods [4].
Worldwide, the number of infected people has continued to fluctuate, and the number of new variants of SARS-CoV-2 has been increasing. The impacts of the COVID-19 pandemic are predicted to be long-lasting, and we will continue to live in coexistence with the virus for some years. In April 2021, the Japanese government declared a third state of emergency in Osaka Prefecture. A limitation of this research is that we only compared April 2019 and April 2020. Another limitation of this research is that we only analyzed Ibaraki City. The residents’ home ranges might constantly be changing, depending on the infection situation. After the COVID-19 pandemic era, future studies should research the design of walkable neighborhoods, increasing the research periods and areas after the state of emergency.

Author Contributions

Conceptualization, H.K.; methodology, H.K.; software, H.K.; validation, H.K., A.T. and D.M.; formal analysis, H.K.; investigation, H.K.; resources, H.K.; data curation, H.K.; writing—original draft preparation, H.K.; writing—review and editing, H.K., A.T. and D.M.; visualization, H.K.; supervision, H.K.; project administration, H.K.; funding acquisition, H.K. All authors have read and agreed to the published version of the manuscript.

Funding

This research was funded by the JSPS KAKENHI (grant number 21K14318).

Institutional Review Board Statement

The protocol of this study was approved by the Agoop Corporation, which provides anonymized LH data. This study complies with the “Guidelines for the Use of Device Location Data,” a common regulation for location data in Japan.

Informed Consent Statement

Informed consent was obtained from all subjects, all of whom installed particular applications based on the type of data to be collected, the purpose of use, the provision to third parties, and the privacy policy. Additionally, the subjects can stop sending the GPS location data at any time by changing their mobile phones’ settings.

Data Availability Statement

The data of this study cannot be shared publicly due to mobile phone users’ confidentiality. GPS location history panel data are available to researchers and governments through agreements with the Agoop Corporation. By establishing contacts with the corporation, various stakeholders can access and utilize LH data for research purposes according to the “Guidelines for the Use of Device Location Data” to protect the privacy of users’ GPS location history.

Acknowledgments

The authors are deeply grateful for the support of the Urban Development Department of the Ibaraki City Government (Local Government in the Osaka Metropolitan area).

Conflicts of Interest

The authors declare no conflict of interest.

References

  1. Statistics Bureau of Japan. Statistical Handbook of Japan 2020. Available online: https://www.stat.go.jp/english/data/handbook/c0117.html (accessed on 5 August 2021).
  2. Japanese MHLW (Ministry of Health, Labour, and Welfare). Establishing “the Community-Based Integrated Care System.”. Available online: https://www.mhlw.go.jp/english/policy/care-welfare/care-welfare-elderly/dl/establish_e.pdf (accessed on 30 June 2021).
  3. Burt, W.H. Territoriality and home range concepts as applied to mammals. J. Mammal. 1943, 24, 346–352. [Google Scholar] [CrossRef]
  4. Kato, H. How Does the Location of Urban Facilities Affect the Forecasted Population Change in the Osaka Metropolitan Fringe Area? Sustainability 2021, 13, 110. [Google Scholar] [CrossRef]
  5. Kato, H.; Kanki, K. Development of walkability indicator for visualising smart shrinking—A case study of sprawl areas in North Osaka Metropolitan Region. Int. Rev. Spat. Plan. Sustain. Dev. 2020, 8, 39–58. [Google Scholar] [CrossRef] [Green Version]
  6. Kato, H. Effect of Walkability on Urban Sustainability in the Osaka Metropolitan Fringe Area. Sustainability 2020, 12, 9248. [Google Scholar] [CrossRef]
  7. Cerin, E.; Saelens, B.E.; Sallis, J.F.; Frank, L.D. Neighborhood environment walkability scale: Validity and development of a short form. Med. Sci. Sports Exerc. 2006, 38, 1682–1691. [Google Scholar] [CrossRef] [Green Version]
  8. Inoue, S.; Murase, N.; Shimomitsu, T.; Ohya, Y.; Odagiri, Y.; Takamiya, T.; Ishii, K.; Katsumura, T.; Sallis, J.F. Association of physical activity and neighborhood environment among Japanese adults. Prev. Med. 2009, 48, 321–325. [Google Scholar] [CrossRef]
  9. Chen, B.-I.; Hsueh, M.-C.; Rutherford, R.; Park, J.-H.; Liao, Y. The associations between neighborhood walkability attributes and objectively measured physical activity in older adults. PLoS ONE 2019, 14, e0222268. [Google Scholar] [CrossRef]
  10. World Economic Forum. Paris Is Planning to Become a ‘15-minute City’. Available online: https://www.weforum.org/videos/paris-is-planning-to-become-a-15-minute-city-897c12513b (accessed on 2 April 2021).
  11. Balletto, G.; Ladu, M.; Milesi, A.; Borruso, G. A Methodological Approach on Disused Public Properties in the 15-Minute City Perspective. Sustainability 2021, 13, 593. [Google Scholar] [CrossRef]
  12. Prime Minister of Japan and His Cabinet. [COVID-19] Declaration of a state of emergency in response to the novel coronavirus disease. Kantei. 7 April 2020. Available online: https://japan.kantei.go.jp/ongoingtopics/_00018.html (accessed on 12 April 2021).
  13. Osaka Prefecture. COVID-19 Task Force website. Latest Updates on COVID-19 in Osaka. Available online: https://covid19-osaka.info/en (accessed on 13 June 2021).
  14. Kato, H. Development of a Spatio-temporal Analysis Method to Support the Prevention of COVID-19 Infection: Space-Time Kernel Density Estimation Using GPS Location History Data. In Urban Informatics and Future Cities; Geertman, S., Pettit, C., Goodspeed, R., Staffans, A., Eds.; Springer Nature: Cham, Switzerland, 2021; pp. 51–67. ISBN 978-3-030-76058-8. [Google Scholar] [CrossRef]
  15. Kato, H.; Matsushita, D. Changes in Walkable Streets during the COVID-19 Pandemic in a Suburban City in the Osaka Metropolitan Area. Sustainability 2021, 13, 7442. [Google Scholar] [CrossRef]
  16. Muto, K.; Yamamoto, I.; Nagasu, M.; Tanaka, M.; Wada, K. Japanese citizens’ behavioral changes and preparedness against COVID-19: An online survey during the early phase of the pandemic. PLoS ONE 2020, 15, e0234292. [Google Scholar] [CrossRef]
  17. Lee, Y.H.; Lee, J.S.; Baek, S.C.; Hong, W.H. Spatial Equity with Census Population Data vs. Floating Population Data: The Distribution of Earthquake Evacuation Shelters in Daegu, South Korea. Sustainability 2020, 12, 8046. [Google Scholar] [CrossRef]
  18. Oliver, N.; Lepri, B.; Sterly, H.; Lambiotte, R.; Deletaille, S.; De Nadai, M.; Letouzé, E.; Salah, A.A.; Benjamins, R.; Cattuto, C. Mobile phone data for informing public health actions across the COVID-19 pandemic life cycle. Sci. Adv. 2020, 6, eabc0764. [Google Scholar] [CrossRef]
  19. Jia, J.S.S.; Lu, X.; Yuan, Y.; Xu, G.; Jia, J.M.; Christakis, N.A. Population flow drives spatio-temporal distribution of COVID-19 in China. Nature 2020, 582, 389–394. [Google Scholar] [CrossRef]
  20. Badr, H.S.; Du, H.R.; Marshall, M.; Dong, E.S.; Squire, M.M.; Gardner, L.M. Association between mobility patterns and COVID-19 transmission in the USA: A mathematical modelling study. Lancet Infect. Dis. 2020, 20, 1247–1254. [Google Scholar] [CrossRef]
  21. Chang, S.; Pierson, E.; Koh, P.W.; Gerardin, J.; Redbird, B.; Grusky, D.; Leskovec, J. Mobility network models of COVID-19 explain inequities and inform reopening. Nature 2021, 589, 82-U54. [Google Scholar] [CrossRef] [PubMed]
  22. Lee, M.; Zhao, J.; Sun, Q.; Pan, Y.; Zhou, W.; Xiong, C.; Zhang, L. Human mobility trends during the early stage of the COVID-19 pandemic in the United States. PLoS ONE 2020, 15, e0241468. [Google Scholar] [CrossRef]
  23. The Japan Times. The Coronavirus and Japan’s Constitution. 14 April 2020. Available online: https://www.japantimes.co.jp/opinion/2020/04/14/commentary/japan-commentary/coronavirus-japans-constitution/ (accessed on 9 June 2021).
  24. Japanese Law Translation. Outline of the Act Partially Amending the Act on Special Measures against Novel Influenza, etc., and Other Relevant Acts. Available online: http://www.japaneselawtranslation.go.jp/common/data/outline/210621192151_905R207.pdf (accessed on 1 July 2021).
  25. Anzai, A.; Nishiura, H. “Go To Travel” Campaign and Travel-Associated Coronavirus Disease 2019 Cases: A Descriptive Analysis, July–August 2020. J. Clin. Med. 2021, 10, 398. [Google Scholar] [CrossRef] [PubMed]
  26. Yabe, T.; Tsubouchi, K.; Fujiwara, N.; Wada, T.; Sekimoto, Y.; Ukkusuri, S.V. Non-compulsory measures sufficiently reduced human mobility in Tokyo during the COVID-19 epidemic. Sci. Rep. 2020, 10, 18053. [Google Scholar] [CrossRef] [PubMed]
  27. Mizuno Laboratory. COVID-19 Special Site: Visualization of the Percentage of People Who Refrain from Going Out. National Institute of Informatics. Available online: http://research.nii.ac.jp/~mizuno/ (accessed on 9 April 2021).
  28. Agoop Corporation. Homepage. Available online: https://www.agoop.co.jp/en/ (accessed on 12 April 2021).
  29. Ministry of Health, Labour and Welfare (MHLW). Press: Ministry of Health, Labour and Welfare and Agoop Sign Agreement on Provision of Information Conducive to COVID-19 Cluster Response. Available online: https://www.mhlw.go.jp/stf/newpage_11116.html (accessed on 9 June 2021). (In Japanese)
  30. LBMA Japan. Guidelines for the Use of Device Location Data. Available online: https://www.lbmajapan.com/guideline (accessed on 12 April 2021). (In Japanese).
  31. Agoop. Application “WalkCoin.”. Available online: https://www.agoop.co.jp/appslib/walkcoin/ (accessed on 4 July 2021). (In Japanese).
  32. Ichinose, R.; Maruyama, Y.; Nagata, S. Estimation of the number of floating population based on location data collected from smartphones. J. Jpn. Soc. Civ. Eng. 2018, 74, I_210–I_219. [Google Scholar] [CrossRef]
  33. Osaka Prefecture Government. Outline of Emergency Measures of Osaka Prefecture. Available online: http://www.pref.osaka.lg.jp/attach/38687/00000000/0407_(EN)Emergency%20Measures%20of%20Osaka%20Prefecture.pdf (accessed on 12 April 2021).
  34. Osaka Prefecture Government. Request for Facility Use Restrictions. Available online: http://www.pref.osaka.lg.jp/attach/38687/00000000/Revised(EN)Facility%20Use%20Restrictions%20.pdf (accessed on 9 April 2021).
  35. Worton, B.J. Kernel Methods for Estimating the Utilization Distribution in Home-Range Studies. Ecology 1989, 70, 164–168. [Google Scholar] [CrossRef]
  36. Worton, B.J. Using Monte Carlo Simulation to Evaluate Kernel-Based Home Range Estimators. J. Wildl. Manag. 1995, 59, 794–800. [Google Scholar] [CrossRef]
  37. Anderson, D.J. The Home Range—A New Nonparametric-Estimation Technique. Ecology 1982, 63, 103–112. [Google Scholar] [CrossRef]
  38. Ibaraki City Government. Requests for Use of the Park in Conjunction with Measures to Prevent the Spread of COVID-19. 1 June 2020. Available online: https://www.city.ibaraki.osaka.jp/saigai/shingatacoronavirusinformation/oshirase/kouen/47738.html (accessed on 25 September 2020). (In Japanese).
  39. Doubleday, A.; Choe, Y.; Isaksen, T.B.; Miles, S.; Errett, N.A. How did outdoor biking and walking change during COVID-19?: A case study of three US cities. PLoS ONE 2021, 16, e0245514. [Google Scholar] [CrossRef]
  40. Osaka Prefectural Police. Location of Traffic Accidents in the Southern Part of Ibaraki City [Map of All Traffic Accidents]. Available online: https://www.police.pref.osaka.lg.jp/kotsu/jiko/3/1/10143.html (accessed on 5 April 2021). (In Japanese).
  41. Oishi, S.; Cha, Y.J.; Schimmack, U. The Social Ecology of COVID-19 Cases and Deaths in New York City: The Role of Walkability, Wealth, and Race. Soc. Psychol. Personal. Sci. 2021, 10, 1948550620979259. [Google Scholar] [CrossRef]
  42. Portland Plan. 20-minute Neighborhoods. Available online: https://www.portlandonline.com/portlandplan/index.cfm?a=288098&c=52256 (accessed on 5 April 2021).
  43. Project for Public Spaces. PLACEMAKING—What If We Built Our Cities around Places? Available online: https://www.pps.org/wp-content/uploads/2016/10/Oct-2016-placemaking-booklet.pdf (accessed on 4 July 2021).
  44. Project for Public Spaces. You Asked, We Answered: How Can Public Space Managers Help Fight COVID-19? Available online: https://www.pps.org/article/you-asked-we-answered-how-can-public-space-managers-help-fight-covid-19 (accessed on 4 July 2021).
Figure 1. Location of Ibaraki City in the Osaka Metropolitan Area.
Sustainability 13 08974 g001
Figure 2. Estimated travel methods at each time in one day.
Sustainability 13 08974 g002
Figure 3. The number of COVID-19 infections in Osaka Prefecture from February to May 2020.
Sustainability 13 08974 g003
Figure 4. Analysis Process to analyze the minimum convex polygon.
Sustainability 13 08974 g004
Figure 5. Change of daily HR-length in April 2019 and April 2020.
Sustainability 13 08974 g005
Figure 6. Change of weekly HR length ˜ for April 2019 and April 2020.
Sustainability 13 08974 g006
Figure 7. Changes in the farthest point moved from residents’ homes for each week of April 2019 and April 2020.
Sustainability 13 08974 g007
Publisher’s Note: MDPI stays neutral with regard to jurisdictional claims in published maps and institutional affiliations.

