Article

Economic Feasibility and Sustainability Assessment of Residual Municipal Solid Waste Management Scenarios in NSW, Australia

by
Behnam Hosseini Dastjerdi
1,
Vladimir Strezov
1,*,
Ravinder Kumar
1 and
Masud Behnia
2
1
Department of Earth and Environmental Sciences, Faculty of Science & Engineering, Macquarie University, Sydney, NSW 2109, Australia
2
Macquarie Graduate School of Management, Macquarie University, Sydney, NSW 2109, Australia
*
Author to whom correspondence should be addressed.
Sustainability 2021, 13(16), 8972; https://doi.org/10.3390/su13168972
Submission received: 15 July 2021 / Revised: 6 August 2021 / Accepted: 8 August 2021 / Published: 11 August 2021

Abstract

:
This study evaluates the economic cost and sustainability of treating residual municipal solid waste (MSW) through five waste management scenarios. In the baseline scenario (Bsc), all waste was managed through landfilling, while in scenario 1 (Sc1) all waste was treated by incineration. Sc2 employed anaerobic digestion (AD) for food waste and landfilling, and Sc3 treated the waste through AD for food waste, incineration of combustible and plastic wastes, and landfilling. Sc4 treated the waste using AD, incineration, landfilling, and recycling of the plastic waste. The economic cost of waste management scenarios was estimated by calculating different economic variables, such as gate fees, including capital and operating costs, governmental incentives and levies, and also the potential of employed waste treatment technologies for resource recovery. The results revealed that Sc3 has the lowest economic cost of 238.1 mAUD/year, followed by Sc1 (261.9 mAUD/year), while Bsc proved to be the highest cost at 476.1 mAUD/year for MSW treatment. It was noticed that scenarios employing incineration had lower economic costs compared to Bsc and Sc2, mainly because incineration resulted in higher electricity generation and reduced greenhouse gas emissions. The sustainability assessment results confirmed that Sc3 had the lowest and Bcs the highest total economic cost and environmental damage.

1. Introduction

Urbanisation and population growth have led to higher consumption of materials and, consequently, the production of different types of wastes. Among these, municipal solid waste (MSW) has imposed a significant burden on the environment and became a controversial challenge worldwide [1]. It is reported that across the world, about 2 billion tonnes of MSW are generated annually [1]. Over 60% of the generated waste in the world is treated in an unsustainable way through landfilling and open dumping, while resource recovery through recycling and waste to energy (WtE) technologies are employed for the rest of the waste, which can decrease the environmental impacts, such as global warming and human toxicity [1,2]. MSW can be a valuable source of energy through waste to energy (WtE) technologies, such as incineration, pyrolysis and anaerobic digestion (AD) for electricity generation and other energy source production methods [3,4]. Alternatively, MSW can also be utilised as a raw material in different industries. In this way, a circular economy can be established so that material loops could be closed; additionally, the amount of waste that otherwise needs to be landfilled is reduced [5,6]. In order to conduct sustainable waste management, the environmental and economic aspects of waste management scenarios should be investigated. The Life Cycle Assessment (LCA) tool can be employed to evaluate the environmental impacts of different MSW management scenarios [7].
A number of studies have employed the LCA tool to investigate the environmental impacts of WtE technologies for sustainable waste management [8,9,10]. Consequently, the literature indicates that LCA provides insightful information to decision-makers to predict the combination of waste treatment technologies for maximum resource recovery and the lowest impact on the environment and human health [11,12]. However, along with environmental impact assessment, it is also important to conduct an economic evaluation to ensure the suggested waste management strategies are viable and within budget limitations [13,14,15]. Hence, the economic and environmental aspects of waste management scenarios should be considered important factors for sustainable waste management [16]. The economic assessment of a WtE technology can be evaluated using cost and benefit analysis that contains operating and capital costs, benefits from selling the recovered resources and carbon price (cost related to the amount of greenhouse gas [GHG] emissions or carbon credit by avoiding GHG emissions). For example, a WtE technology needs investment for land, construction and equipment, and can generate electricity. The economic assessment of WtE technologies needs to consider capital (building and construction cost, equipment cost) and operating costs (fuel cost, human resource cost, maintenance), as well as financial benefits from selling electricity or carbon credits by avoiding GHG emissions. Consequently, effective scenarios based on lower economic cost and environmental impact can be developed using a combination of different waste treatment technologies for sustainable waste management.
Several studies have reported the economic assessment of WtE technologies in different parts of the world. For instance, Luz et al. [17] investigated the techno-economic aspect of gasification technology for MSW management in Brazil. They included three scenarios based on different population sizes and amounts of waste generated to examine the economic feasibility of gasification for MSW management. The study suggested that the gasification plant produced higher energy generation efficiency in a high population municipality. For example, the gasification plant generated 1065 kW/t of MSW for a population of 259,845 people, while the plant generated only 794 kW/t of MSW for a population of 34,203 people. Overall, the study indicated that bigger units were more economically feasible compared to smaller units. In a separate study, Colvero et al. [18] conducted an economic analysis of MSW treatment through different WtE technologies in 19 municipalities focusing on the importance of the size of treatment plant on the economic aspect for MSW management. The results revealed the size of the treatment plants had significant impact on the cost and benefits of different technologies. For instance, AD process on a small scale was more expensive than composting, while on a large scale, AD was more economical, due to lower average cost for gate fees [18]. In another case, Woon and Lo [19] compared the economic cost of landfilling and incineration treatments of MSW in Hong Kong. The results showed that incineration treatment proved highly economical for MSW management compared to landfilling, as incineration resulted in higher electricity generation; the economic benefits from incineration were approximately 4.7 times greater than the extension of the landfill [19].
Economic assessment of WtE technologies is important to develop effective scenarios for sustainable waste management. Although environmental impact assessments of WtE technologies for MSW management in Australia have been examined in previous studies, economic assessment of WtE technologies has been rarely reported. Therefore, considering its importance, this study aims to conduct an economic assessment of WtE technologies in Australia and develop a method to integrate the environmental and economic results to prioritize scenarios for sustainable management of solid waste. The objectives of this study are to quantify and compare the cost and benefits of current and alternative scenarios for treating residual MSW in NSW, identify critical factors with the highest impact on the economic cost, and introduce an indicator to consider both economic and environmental aspects to identify the most sustainable waste management scenario.

2. Materials and Methods

The highest priority for waste management in NSW is to avoid waste generation. Reuse and recycling are the next preferable options, while energy recovery is suggested for avoiding disposal [20]. Approximately 4.75 Mt of MSW is generated in NSW annually, of which around 2.46 Mt is recycled, about 274 kt is treated through the AD process and approximately 2.02 Mt is sent to landfills [21]. In this study, detailed data based on waste materials were adopted to estimate the economic cost and benefit of current and alternative residual MSW management in NSW [21].
The waste management hierarchy intends to prioritise waste treatments to maximise human health and environment protection [22]. The environmental protection authority in NSW has emphasized a higher preference for recycling and WtE compared to waste disposal [20]. Based on the EPA guideline, material recovery has higher preference than energy recovery [20]. This means that open dumping and landfilling without landfill gas recovery is the least preferable option for waste management. Therefore, diverting waste from landfills and dumpsites has high priority.
Five different waste management scenarios for residual MSW were developed. Figure 1 shows the proposed scenarios for residual MSW management in NSW. The adopted scenarios were the same as the scenarios designed and employed in the study conducted by Dastjerdi et al. [8] to assess the environmental impacts of various residual MSW scenarios in NSW. The current situation was considered the baseline scenario (Bsc), where all classes of residual MSW are treated through landfilling. In the four alternative scenarios, recycling and WtE technologies of waste were considered as part of the integrated waste management. Different waste materials, including combustible, food waste, plastic and non-combustible materials, can be treated through incineration, as proposed in scenario 1 (Sc1). In scenario 2 (Sc2) food waste was treated separately through the AD process and the rest of the waste was managed through landfilling. In scenario 3 (Sc3) incineration was employed for plastic and combustible waste, food waste was managed through AD and non-combustible waste through landfilling. Scenario 4 (Sc4) managed waste materials similar to Sc3 with the addition of recycling of plastic waste. It was assumed that by landfilling non-combustible waste, no landfill gas would be recovered because it does not include biodegradable solids. Since gasification is not common global technology, the financial data on an industrial scale were not available and were excluded from this study.
Table 1 demonstrates the weights of various classes of generated residual MSW and the technology adopted to treat them. Furthermore, Table 1 shows the amount of refuse materials that needs landfilling in each scenario and the potential electricity generation and GHG emissions. The potential electricity generation of the scenarios was calculated employing the methods introduced in our previous studies [8,23]. It was assumed that generated electricity can replace the electricity from grid and the relevant GHG emissions can be avoided. Therefore, the negative amount for GHG emissions for specific scenarios show the level of avoided GHG emissions related to electricity generation as higher than the direct GHG emissions. It should be noted that 30% electricity efficiency was considered for the incineration process [24,25,26]. The illustrated data were adopted to investigate the economic cost of scenarios.
The functional unit was defined as the treatment of annual residual MSW in NSW. The system boundaries of scenarios include the treatment gate fees, carbon price, landfill levies and income from exporting electricity and recycled plastics. Landfilling of residuals from recycling, and bottom and fly ash in different scenarios were included in the system boundaries.
Table 2 shows the economic values for different variables in NSW expressed in Australian dollars. Waste management systems consist of three parts, including waste generators (community), waste facility operators and waste authorities (government in different levels) [16]. The waste treatment gate fees were employed based on waste facility and authority reports in NSW. The gate fees are the final cost of treating one tonne of waste containing the capital and operating cost. The landfill levy has been introduced by the environmental protection authority (EPA) to increase the economic cost of landfilling to divert waste from landfills [27]. The amount of landfill levy is increasing annually and the rate is different for various types of waste. This study adopted the latest amount related to metropolitan areas. The carbon price was introduced to the Australian economy by the Clean Energy Act of 2011 and was applied to the biggest GHG emitters. This study assumed that the waste treatment authority should pay for emitted GHGs and receive credit for avoided GHG emissions.
It was assumed that all facilities are at the same distance as the landfill. Therefore, the alteration in transport by diverting waste from landfill to incineration, AD and recycling facility is considered to be minimal. This study adopted 2,023,876 tonnes of residual MSW as a functional unit which is equal to the generated residual MSW in NSW in 2011 as the reference year. In order to calculate the total economic cost for each scenario, Equation (1) was employed. The positive values were used for cost and negative values for benefits. The total positive value means the costs of employing a specific scenario for residual MSW is higher than the benefits.
T C B = i = 1 n ( W T G i × G T C i + G E i × E p + R P i × R P p + R W i × L L )
where TCB is the total cost and benefit (AUD), WTGi represents the weight of waste treated through technology type i (tonne), GTCi stands for gate fee for technology type i (AUD/tonne), GEi is the electricity generated from technology type i (MWh), Ep stands for electricity price (AUD/MWh), PRi is the recycled plastic from technology type i (tonne), RPp represents the recycled plastic price (AUD/tonne), RWi stands for residual remaining from treating waste through technology type i (tonne) and LL is the landfill cost (AUD/tonne).
In order to compare the sustainability of the scenarios, the adopted system boundaries should be the same for economic cost evaluation and environmental impact assessment. Data related to environmental impact assessment, expressed as damage to human health and ecosystems, were extracted from an LCA study that employed the same dataset for waste generation and system boundaries for waste treatment [8].
The priority of scenarios based on economic cost can be different from their priority based on the environmental aspect. Therefore, this study adopted a method to include evaluation of the most sustainable waste management scenario considering economic and environmental aspects. In order to calculate the sustainability of each scenario the normalised values for economic cost, environmental damage to human health and environmental damage to ecosystems were calculated by employing Equation (2). The sustainability indicator was calculated by accumulating normalised values of the three categories calculated by Equation (3):
N o r m a l i z e d   X i j = X i j X j m i n X j m a x X j m i n  
T C D = j = 1 n n o r m a l i z e d   X i j
where X is the normalised value for scenario i and category j (dimensionless), Xij represents the value of scenario i and category j (unit depends on category), Xj-min stands for the lowest value in category j (unit depends on category), Xj-max is the highest value in category j (unit depends on category) and TCD stands for the total economic cost and environmental damage for scenario i (dimensionless).

3. Results and Discussion

3.1. Cost and Benefit of Different Waste Management Scenarios

The income from selling the generated electricity and recycled plastic and avoiding GHG emissions (carbon price) were considered as benefits. The landfill levy, gate fees and carbon price based on GHG emissions from waste treatments were costs. The gate fee includes the capital cost, operating cost and financing interest rates costs.
Table 3 shows the annual cost and benefits of each scenario for various factors, such as the amount of generated electricity, recycled plastic, GHG emissions, carbon price, treatment facility gate fees, including landfill, incineration, AD and material recovery facility (MRF). The results showed that the economic benefits from electricity generation for scenarios with thermochemical WtE technologies (Sc1, Sc3 and Sc4) were higher than the scenarios with only biochemical WtE technologies (Bsc and Sc2). This is because thermal WtE technologies, such as incineration, are efficient in converting the embodied chemical energy in the combustible and plastic waste into electrical energy, while biochemical WtE technologies, like anaerobic digestion, are not useful for generating electricity from non-degradable waste and time consuming for electricity generation from lignocellulosic waste. Consequently, Sc3, which applied incineration to combustible and plastic waste, resulted in the highest benefits from electricity, followed by Sc1, which applied incineration for all waste classes. An economic comparison between different scenarios for treating MSW in Iran was performed by Maghmoumi et al. [35]; the results showed that for waste with high moisture content, biochemical WtE technologies were the most economical options.
The recycling of plastic in Sc4 generated AUD9.6 million in income from recovering plastic and avoiding GHG emissions. Recycling is considered a significant and sustainable method for effective waste management. However, recycling could be costly since it is energy- and human resource-consuming and requires more advanced instrumentation compared to landfilling. The current method for waste management is landfilling, which results in a landfill gate fee, landfill levy and lower resource recovery. Landfilling was required in all scenarios and was employed at different levels. The highest landfilling was related to Bsc, where all residual waste was treated through landfilling. Subsequently, the highest landfill gate fee and landfill levy was related to Bsc and then Sc2, while Sc4 had the lowest costs related to landfilling.
The annual carbon price for the scenarios with incineration technology was found to be negative, primarily due to higher electricity generation and avoided emissions by replacing the electricity from the power grid. Diverting food waste from landfill to the AD process can decrease the annual carbon price from approximately mAUD 35 in Bsc to about mAUD 22 in Sc2. The treatment of food waste through the AD process costs about mAUD 122 per year while reducing the cost of landfilling. The Sc1 had the highest incineration gate fee at about mAUD 263, because all residual MSW was treated through incineration. In Sc3, where the non-combustible waste and food waste were treated through landfilling and AD, the incineration gate fee was about mAUD 145. This figure for Sc4 is lower than Sc3 because the plastic waste was recycled, and only combustible waste was incinerated.
The total cost in all scenarios was higher than the income. The highest total cost was related to Bsc followed by Sc2 at about mAUD 476 and mAUD 437 per annum. The higher total cost in Bsc and Sc2 than other scenarios was primarily due to the high expenditures related to landfilling and low income from electricity generation. Sc3 showed the lowest total cost, followed by Sc1 due to high electricity incomes. Both have higher expenditure related to landfilling compared to Sc4 where the plastic waste was recycled. The results are in line with a study conducted in Mexico where the incineration of waste was found to only be feasible by significantly improving the renewable energy sector through incentivising greener technology and imposing levies on technologies with higher environmental impacts including landfilling [36].
Table 4 presents the annual values for economic cost, environmental damages to human health and ecosystems categories and electricity generation of baseline and alternative scenarios. The values for economic cost for each scenario were employed from Table 3 and the values for environmental damages and electricity generation were adopted from the study conducted on the same dataset of the residual MSW in NSW, Australia [8]. The results showed that Sc3 had the lowest cost and lowest damages to human health and ecosystems, while generating the highest electricity. In contrast, Bsc had the highest economic cost and environmental damages and the lowest electricity generation. Sc2 followed a similar pattern to Bsc, generating the second-lowest amount of electricity and had the second-highest economic cost and environmental damages. The economic cost for Sc1 was lower than Sc4 since Sc1 produced higher electricity than Sc4. The environmental damage to human health and ecosystems categories in Sc1 were higher than Sc4. This is mainly because Sc1 applied incineration for all types of wastes and generated hazardous effluents, while in Sc4, the plastic was recycled and food wastes were managed through AD, which helped to promote more efficient resource recovery and generated less hazardous effluents.
Economic cost, damage to ecosystems and damage to human health categories have different units. In order to compare different scenarios, the results for all categories should be considered. To unify the unit of all three categories the values related to scenarios in each category was normalised.
Equation (2) was employed to calculate the normalised values in all three categories. Table 5 shows the normalised values for all scenarios in three categories and the sum of values as total cost and damage. The calculated sum of normalised values for each scenario was considered as a sustainability indicator. Since this indicator includes both economic and environmental aspects, it can provide a more holistic overview than a comparison based on only one aspect or one environmental category. The results in Table 5 suggest that Sc3 was the most appropriate scenario with the lowest total damage and cost. The second-lowest total cost and damage was related to Sc1 (0.52), closely followed by Sc4 (0.6). Bsc was found to be the least appropriate scenario with the highest total damage and cost for treating residual MSW (3), followed by Sc 2 (2.34). An environmental and economic assessment on Brazilian waste composition showed that the best outcome could be achieved by treating waste through integrated waste management system where the plastic waste was recycled [15]. This can be due to the lower price of electricity and lower labour wage in Brazil compared to Australia. The results of a study conducted by Alzate et al. [37] on waste management in Columbia revealed that a high electricity price in addition to government incentives can provide economic feasibility for employing WtE technologies in waste management scenarios [37]. The results from energy and economic analysis performed by Santos et al. [38] similarly demonstrated that more expensive technologies, such as incineration and AD, need government incentives and supporting policies to become economically beneficial compared to landfilling. Governmental support for greener technologies through carbon credit and landfill levy combined with the high electricity price in NSW resulted in higher economic benefits of scenarios including incineration technology.

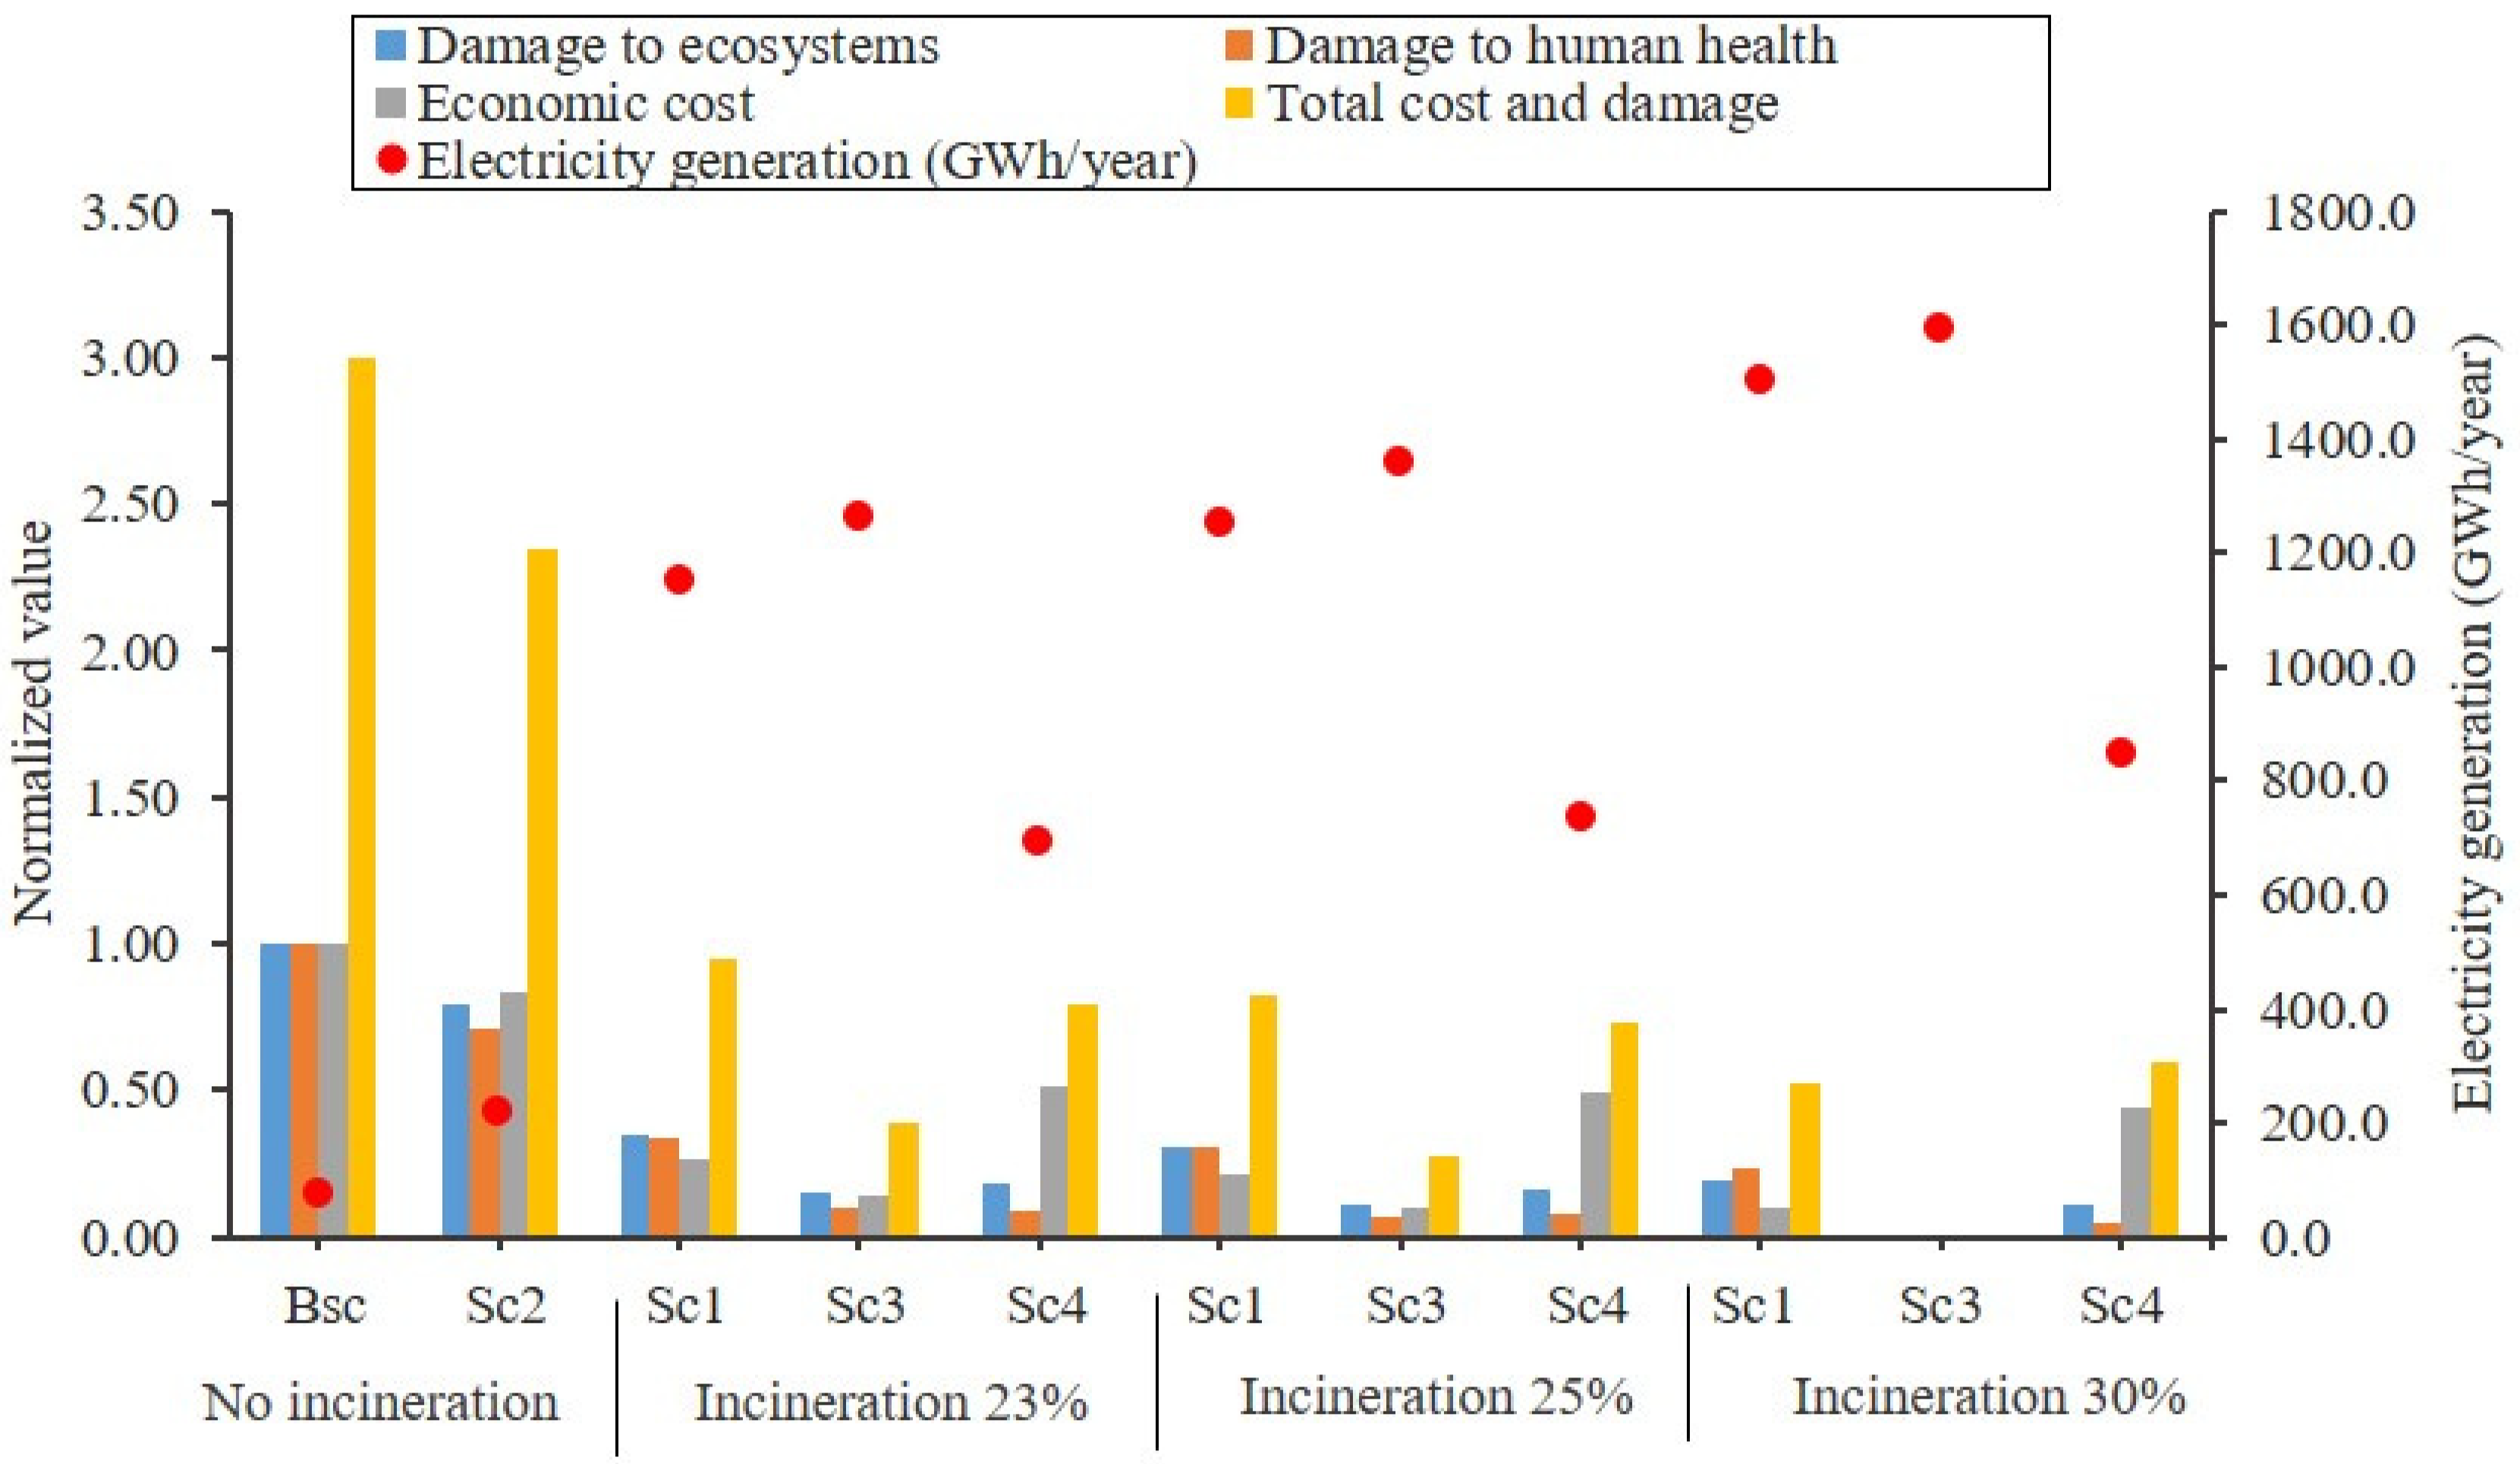
3.2. Sensitivity Analysis: The Efficiency of Incineration for Electricity Generation

Sensitivity analysis is an essential part of scientific research. Electricity generation is a determining factor in the economic and environmental assessment of WtE technologies. The electricity generated through incineration is considerably higher than landfilling and the AD process. Table 6 shows the changes in electricity generation and its influence on the economic cost, environmental damage to ecosystems and human health categories by varying electricity generation efficiency of incineration. Employing incineration in three different efficiency levels (Sc1, Sc3 and Sc4) generated higher electricity and caused lower economic cost and environmental damages than only treating all residual MSW through landfilling and the AD process in Bsc and Sc2. A decrease in electricity generation efficiency cannot change the priority of scenarios for economic cost and damage to ecosystems. While comparing scenarios based on damage to human health, the reduction in electricity generation efficiency from 30% to 23% placed Sc4 higher than Sc3.
Table 7 and Figure 2 show normalised values of economic cost, environmental damage to ecosystems and human health shown in Table 6, and the sum of normalised values of economic cost and both environmental damage categories. The results showed that the highest total cost and damage is related to Bcs at the value of 3 and the lowest value at zero is related to Sc3. Assuming the incineration electricity generation efficiency decreases from 30% to 23% and 25% the priority of Sc1, Sc3 and Sc4 would be different based on total cost and damage. Sc3 has the lowest cost and damage in all energy efficiency and Sc1 is the second-best scenario at 30% electricity efficiency. When considering lower electricity generation efficiency of 23% and 25%, the Sc4 is the second-best scenario with Sc1 showing higher total cost and damage.
Electricity generation had a strong negative correlation with cost (−0.99), which showed the importance of this factor on financial priority. It seems the high electricity price in NSW as well as the role incineration plays in diverting waste from landfills and consequently avoiding landfill levy and landfill gate fees were the main reasons for the strong and diverse relationship. The results also suggested the strong negative correlation between electricity generation and damage to ecosystems and human health (−0.81 and −0.73, respectively). As a consequence of the strong correlation between electricity generation and all three categories (economic cost and both environmental damages), the total cost and damage showed −0.88 as a correlation with electricity generation.
The results revealed that GHG emissions have a very strong positive correlation with damage to human health (1.00) and ecosystems (0.99) but a weaker correlation with economic cost (0.77). The total cost and damage correlation with GHG emissions (0.96) is positive and stronger than electricity generation, which is related to the high impact of GHG emissions on damage to human health and damage to ecosystems. An increase in electricity generation efficiency of incineration treatment decreases the economic cost and environmental damages of Sc1, Sc3 and Sc4. The highest change is related to Sc1, where all residual MSW was treated through incineration and the lowest difference was related to Sc4, where only combustible waste, excluding plastic, was incinerated.

4. Conclusions

This study investigated the economic cost and sustainability of baseline and alternative scenarios for treating residual MSW in NSW. The major factors in the economic assessment of waste management scenarios, including gate fees, government incentives and levies, and the benefits from resource recovery, were considered. Adoption of incineration, AD and recycling technologies in alternative waste management scenarios instead of landfilling revealed financial benefits. These technologies divert waste from landfills, recover higher resource, decrease net GHG emissions and avoid landfill levies in NSW. The results suggested that treatment of combustible and plastic wastes through incineration, employing AD process for food waste and landfilling of non-combustibles in Sc3 was most economical option. This was also confirmed by a sustainability assessment where Sc3 showed the lowest total economic cost and environmental damage. Sensitivity analysis showed that variation in incineration efficiency between 23% and 30% would not change its preference. Furthermore, a strong negative correlation between electricity generation and sustainability was observed for all waste management scenarios.

Author Contributions

B.H.D.: conceptualization, methodology, data curation, writing—original draft. V.S.: writing—review & editing, conceptualization, supervision. R.K.: writing—review & editing. M.B.: supervision. All authors have read and agreed to the published version of the manuscript.

Funding

This research received no external funding.

Institutional Review Board Statement

Not applicable.

Informed Consent Statement

Not applicable.

Data Availability Statement

Not applicable.

Acknowledgments

This research was supported by the Macquarie Research Excellence Scholarship Program (MQRES-2017144) of Macquarie University which should be greatly acknowledged.

Conflicts of Interest

The authors declare no conflict of interest.

References

  1. Kaza, S.; Yao, L.; Bhada-Tata, P.; Van Woerden, F. What a Waste 2.0: A Global Snapshot of Solid Waste Management to 2050; World Bank: Washington, DC, USA, 2018; ISBN 1-4648-1347-7. [Google Scholar]
  2. Rajaeifar, M.A.; Ghanavati, H.; Dashti, B.B.; Heijungs, R.; Aghbashlo, M.; Tabatabaei, M. Electricity Generation and GHG Emission Reduction Potentials through Different Municipal Solid Waste Management Technologies: A Comparative Review. Renew. Sustain. Energy Rev. 2017, 79, 414–439. [Google Scholar] [CrossRef]
  3. Iqbal, A.; Liu, X.; Chen, G.-H. Municipal Solid Waste: Review of Best Practices in Application of Life Cycle Assessment and Sustainable Management Techniques. Sci. Total Environ. 2020, 729, 138622. [Google Scholar] [CrossRef]
  4. Laurent, A.; Bakas, I.; Clavreul, J.; Bernstad, A.; Niero, M.; Gentil, E.; Hauschild, M.Z.; Christensen, T.H. Review of LCA Studies of Solid Waste Management Systems—Part I: Lessons Learned and Perspectives. Waste Manag. 2014, 34, 573–588. [Google Scholar] [CrossRef]
  5. Istrate, I.-R.; Iribarren, D.; Gálvez-Martos, J.-L.; Dufour, J. Review of Life-Cycle Environmental Consequences of Waste-to-Energy Solutions on the Municipal Solid Waste Management System. Resour. Conserv. Recycl. 2020, 157, 104778. [Google Scholar] [CrossRef]
  6. Turk, J.; Cotič, Z.; Mladenovič, A.; Šajna, A. Environmental Evaluation of Green Concretes versus Conventional Concrete by Means of LCA. Waste Manag. 2015, 45, 194–205. [Google Scholar] [CrossRef]
  7. Gibassier, D. From Écobilan to LCA: The Elite’s Institutional Work in the Creation of an Environmental Management Accounting Tool. Crit. Perspect. Account. 2017, 42, 36–58. [Google Scholar] [CrossRef]
  8. Dastjerdi, B.; Strezov, V.; Kumar, R.; He, J.; Behnia, M. Comparative Life Cycle Assessment of System Solution Scenarios for Residual Municipal Solid Waste Management in NSW, Australia. Sci. Total Environ. 2021, 767, 144355. [Google Scholar] [CrossRef]
  9. Fruergaard, T.; Astrup, T. Optimal Utilization of Waste-to-Energy in an LCA Perspective. Waste Manag. 2011, 31, 572–582. [Google Scholar] [CrossRef]
  10. Jensen, M.B.; Møller, J.; Scheutz, C. Comparison of the Organic Waste Management Systems in the Danish–German Border Region Using Life Cycle Assessment (LCA). Waste Manag. 2016, 49, 491–504. [Google Scholar] [CrossRef]
  11. Perez, J.; Manuel de Andres, J.; Lumbreras, J.; Rodriguez, E. Evaluating Carbon Footprint of Municipal Solid Waste Treatment: Methodological Proposal and Application to a Case Study. J. Clean. Prod. 2018, 205, 419–431. [Google Scholar] [CrossRef]
  12. Tong, H.; Shen, Y.; Zhang, J.; Wang, C.-H.; Ge, T.S.; Tong, Y.W. A Comparative Life Cycle Assessment on Four Waste-to-Energy Scenarios for Food Waste Generated in Eateries. Appl. Energy 2018, 225, 1143–1157. [Google Scholar] [CrossRef]
  13. Ayodele, T.R.; Ogunjuyigbe, A.S.O.; Alao, M.A. Economic and Environmental Assessment of Electricity Generation Using Biogas from Organic Fraction of Municipal Solid Waste for the City of Ibadan, Nigeria. J. Clean. Prod. 2018, 203, 718–735. [Google Scholar] [CrossRef]
  14. Fan, Y.V.; Klemeš, J.J.; Perry, S.; Lee, C.T. Anaerobic Digestion of Lignocellulosic Waste: Environmental Impact and Economic Assessment. J. Environ. Manag. 2019, 231, 352–363. [Google Scholar] [CrossRef]
  15. Paes, M.X.; de Medeiros, G.A.; Mancini, S.D.; Bortoleto, A.P.; Puppim de Oliveira, J.A.; Kulay, L.A. Municipal Solid Waste Management: Integrated Analysis of Environmental and Economic Indicators Based on Life Cycle Assessment. J. Clean. Prod. 2020, 254, 119848. [Google Scholar] [CrossRef]
  16. Martinez-Sanchez, V.; Kromann, M.A.; Astrup, T.F. Life Cycle Costing of Waste Management Systems: Overview, Calculation Principles and Case Studies. Waste Manag. 2015, 36, 343–355. [Google Scholar] [CrossRef]
  17. Luz, F.C.; Rocha, M.H.; Lora, E.E.S.; Venturini, O.J.; Andrade, R.V.; Leme, M.M.V.; del Olmo, O.A. Techno-Economic Analysis of Municipal Solid Waste Gasification for Electricity Generation in Brazil. Energy Convers. Manag. 2015, 103, 321–337. [Google Scholar] [CrossRef]
  18. Colvero, D.A.; Ramalho, J.; Gomes, A.P.D.; de Matos, M.A.A.; da Cruz Tarelho, L.A. Economic Analysis of a Shared Municipal Solid Waste Management Facility in a Metropolitan Region. Waste Manag. 2020, 102, 823–837. [Google Scholar] [CrossRef]
  19. Woon, K.S.; Lo, I.M.C. An Integrated Life Cycle Costing and Human Health Impact Analysis of Municipal Solid Waste Management Options in Hong Kong Using Modified Eco-Efficiency Indicator. Resour. Conserv. Recycl. 2016, 107, 104–114. [Google Scholar] [CrossRef]
  20. EPA-NSW. The Waste Hierarchy. Available online: https://www.epa.nsw.gov.au/your-environment/recycling-and-reuse/warr-strategy/the-waste-hierarchy (accessed on 28 July 2019).
  21. Randell, P.; Pickin, J.; Grant, B. Waste Generation and Resource Recovery in Australia: Reporting Period 2010/11; Final Report Prepared for DSEWPC; Blue Environment Pty Ltd.: Docklands, Australia, 2014; Volume 128. [Google Scholar]
  22. Brunner, P.H.; Rechberger, H. Waste to Energy—Key Element for Sustainable Waste Management. Waste Manag. 2015, 37, 3–12. [Google Scholar] [CrossRef]
  23. Dastjerdi, B.; Strezov, V.; Kumar, R.; Behnia, M. An Evaluation of the Potential of Waste to Energy Technologies for Residual Solid Waste in New South Wales, Australia. Renew. Sustain. Energy Rev. 2019, 115, 109398. [Google Scholar] [CrossRef]
  24. Gohlke, O. Efficiency of Energy Recovery from Municipal Solid Waste and the Resultant Effect on the Greenhouse Gas Balance. Waste Manag. Res. 2009, 27, 894–906. [Google Scholar] [CrossRef]
  25. Kourkoumpas, D.-S.; Karellas, S.; Kouloumoundras, S.; Koufodimos, G.; Grammelis, P.; Kakaras, E. Comparison of Waste-to-Energy Processes by Means of Life Cycle Analysis Principles Regarding the Global Warming Potential Impact: Applied Case Studies in Greece, France and Germany. Waste Biomass Valoriz. 2015, 6, 605–621. [Google Scholar] [CrossRef]
  26. Murer, M.J.; Spliethoff, H.; De Waal, C.M.W.D.; Wilpshaar, S.; Berkhout, B.; Van Berlo, M.A.J.V.; Gohlke, O.; Martin, J.J.E. High Efficient Waste-to-Energy in Amsterdam: Getting Ready for the next Steps. Waste Manag. Res. 2011, 29, 20–29. [Google Scholar] [CrossRef]
  27. EPA-NSW. Levy Regulated Area and Levy Rates. Available online: https://www.epa.nsw.gov.au/your-environment/waste/waste-levy/levy-regulated-area-and-levy-rates (accessed on 11 April 2021).
  28. Bulk Energy Australian Electricity Prices & the Cost of Electricity in Australia per KWh. Bulk Energy. 2018. Available online: https://gobulk.com.au/australian-electricity-prices/ (accessed on 11 April 2021).
  29. Clean Energy Regulator Carbon Pricing Mechanism. Available online: http://www.cleanenergyregulator.gov.au/Infohub/CPM/About-the-mechanism (accessed on 11 April 2021).
  30. Ritchie, M. State of Waste. Available online: https://www.eianz.org/document/item/4661 (accessed on 11 April 2021).
  31. Pickin, J.; Wardle, C.; O’Farrell, K.; Nyunt, P.; Donovan, S. National Waste Report 2020. Available online: https://www.environment.gov.au/protection/waste/national-waste-reports/2020 (accessed on 21 March 2021).
  32. EcoGeneration EarthPower, the Biogas Plant That Bubbled Back from the Brink. Available online: https://www.ecogeneration.com.au/earthpower-the-biogas-plant-that-bubbled-back-from-the-brink/ (accessed on 11 April 2021).
  33. Stammbach, M. Submission to the NSW Parliamentary Inquiry into EfW Technology. Available online: https://www.parliament.nsw.gov.au/lcdocs/submissions/58101/0179%20HZIA%20Australia.pdf (accessed on 11 April 2021).
  34. DAWE. The Full Cost of Landfill Disposal in Australia. Available online: http://www.environment.gov.au/protection/waste/publications/full-cost-landfill-disposal-australia#:~:text=Estimated%20costs%20of%20the%20disposal,management%20controls%20and%20prevailing%20climate (accessed on 11 April 2021).
  35. Maghmoumi, A.; Marashi, F.; Houshfar, E. Environmental and Economic Assessment of Sustainable Municipal Solid Waste Management Strategies in Iran. Sustain. Cities Soc. 2020, 59, 102161. [Google Scholar] [CrossRef]
  36. Escamilla-García, P.E.; Camarillo-López, R.H.; Carrasco-Hernández, R.; Fernández-Rodríguez, E.; Legal-Hernández, J.M. Technical and Economic Analysis of Energy Generation from Waste Incineration in Mexico. Energy Strategy Rev. 2020, 31, 100542. [Google Scholar] [CrossRef]
  37. Alzate, S.; Restrepo-Cuestas, B.; Jaramillo-Duque, A. Municipal Solid Waste as a Source of Electric Power Generation in Colombia: A Techno-Economic Evaluation under Different Scenarios. Resources 2019, 8, 51. [Google Scholar] [CrossRef] [Green Version]
  38. Dos Santos, R.E.; dos Santos, I.F.S.; Barros, R.M.; Bernal, A.P.; Tiago Filho, G.L.; da Silva, F.d.G.B. Generating Electrical Energy through Urban Solid Waste in Brazil: An Economic and Energy Comparative Analysis. J. Environ. Manag. 2019, 231, 198–206. [Google Scholar] [CrossRef] [PubMed]
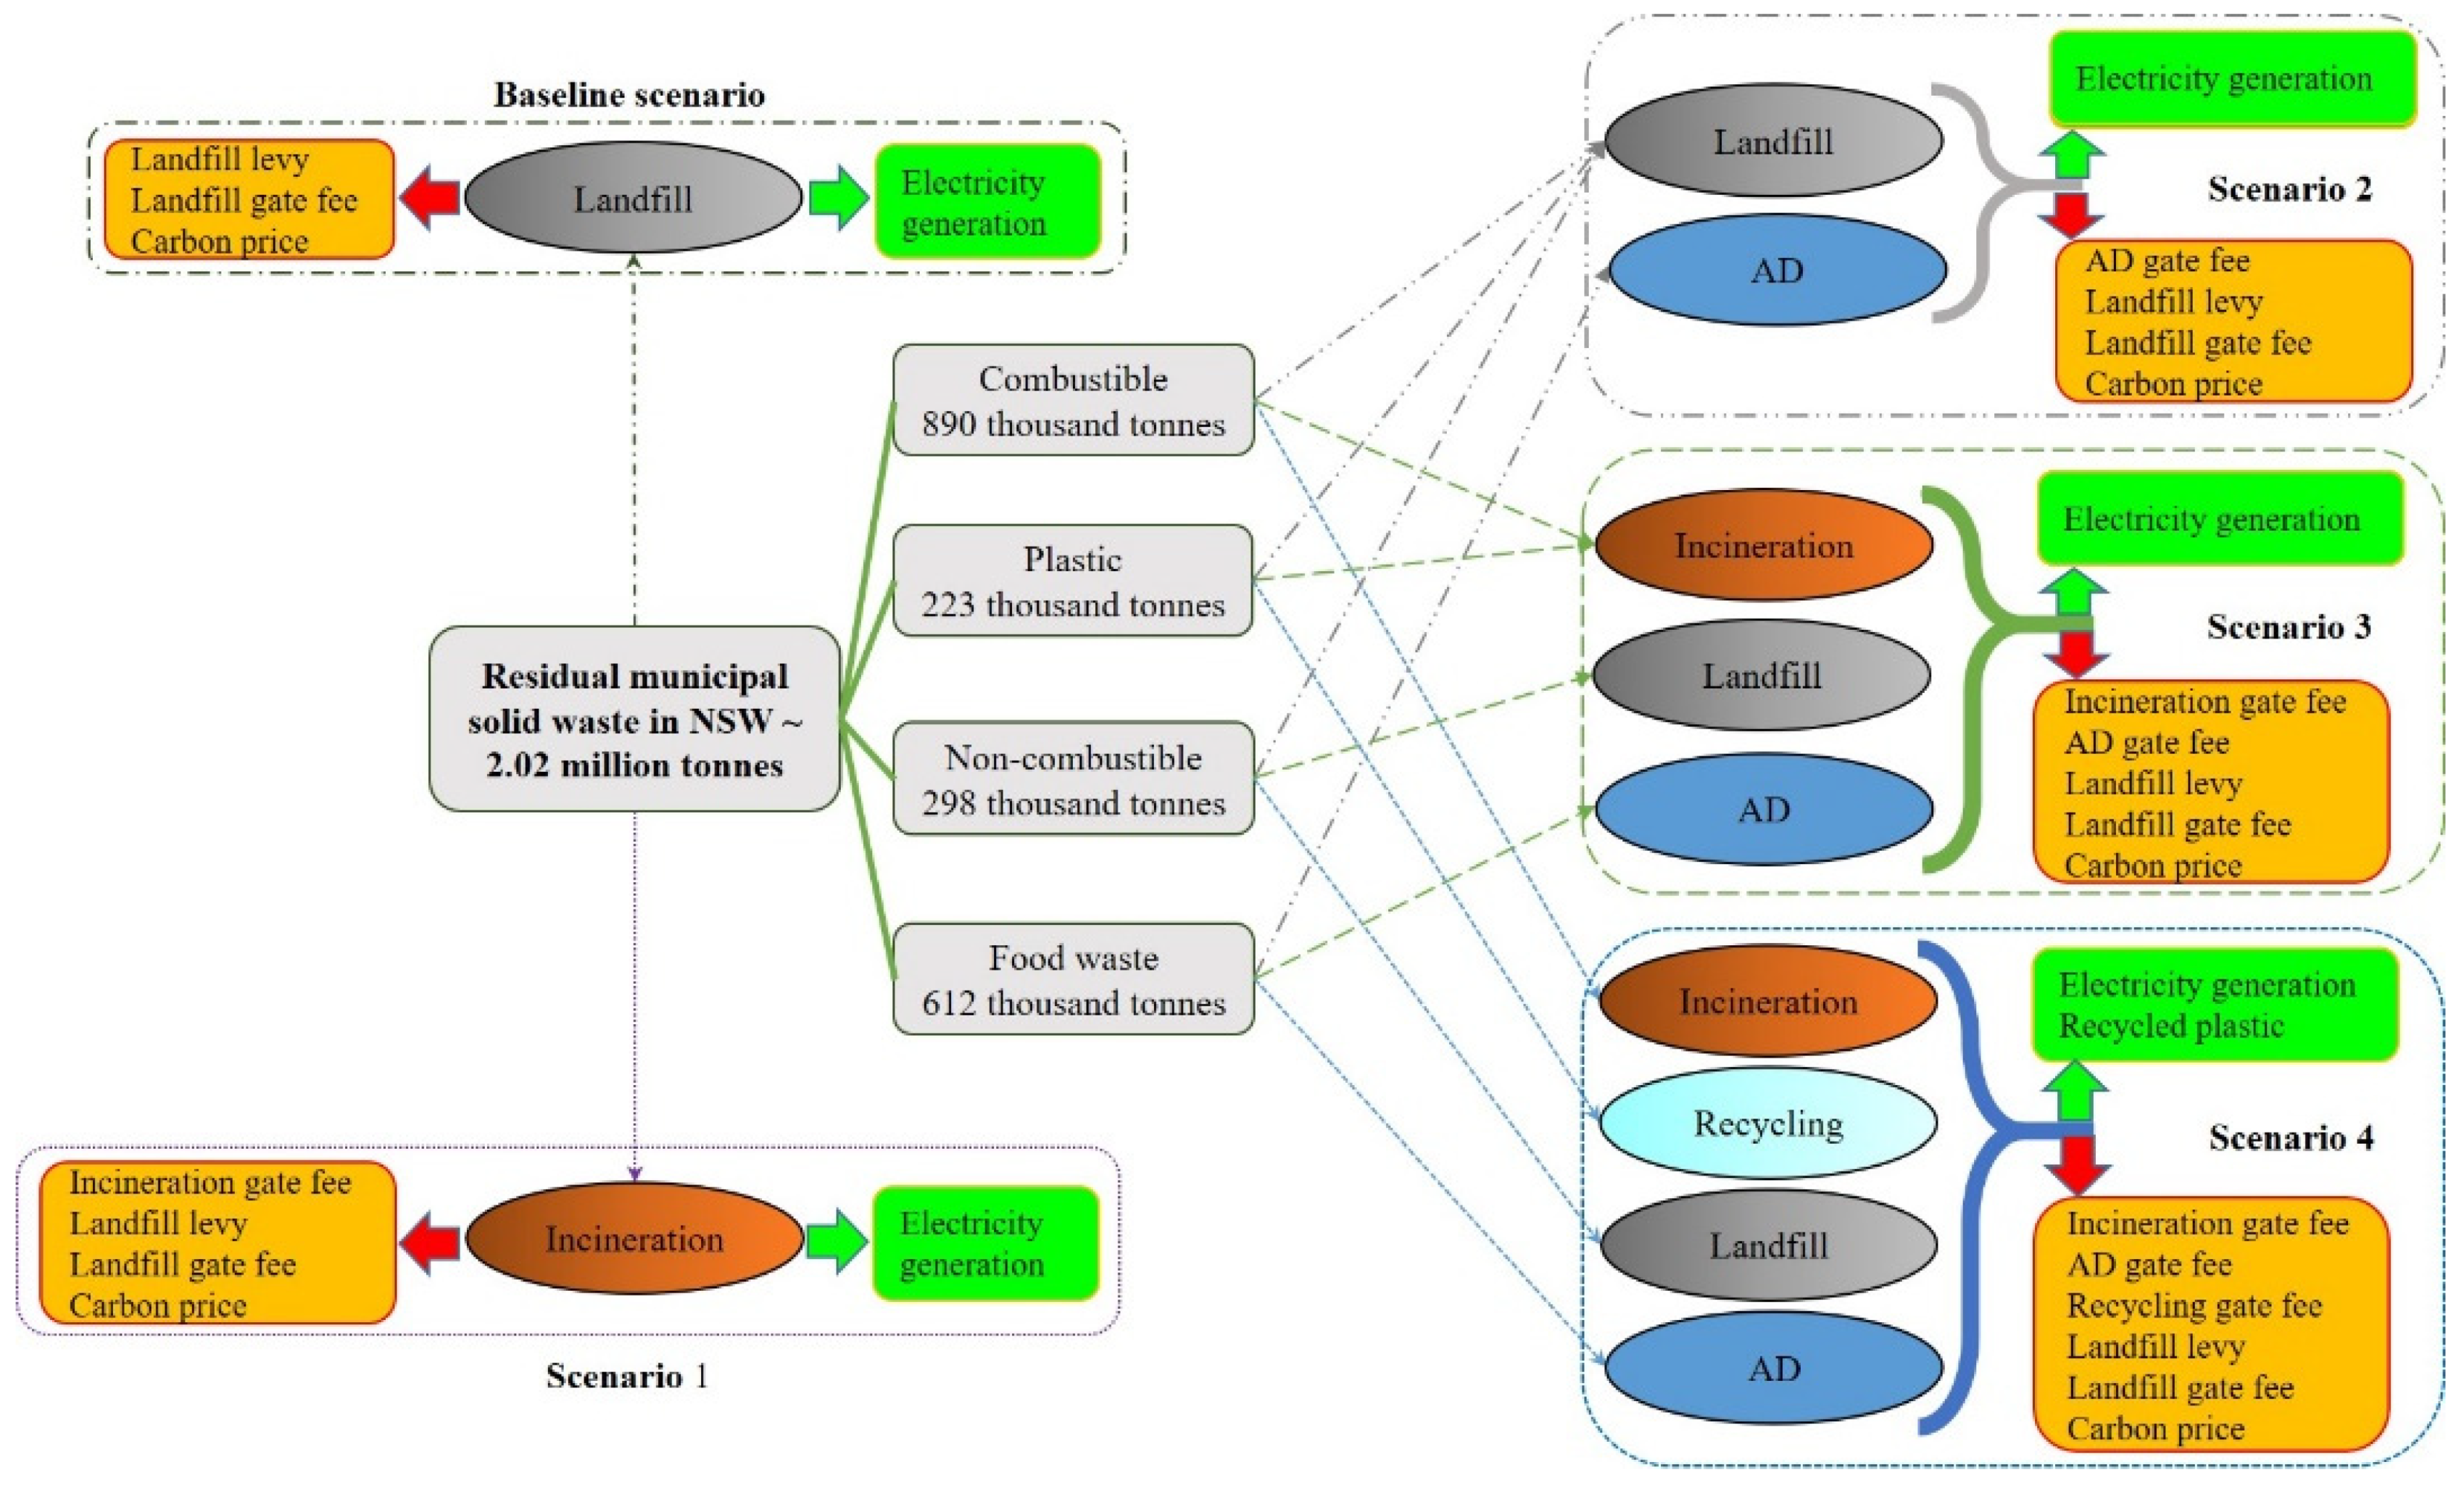
Figure 1. Current and four alternative scenarios for residual MSW management in NSW.
Sustainability 13 08972 g001
Figure 2. Annual electricity generation with different electricity generation efficiencies of 23%, 25% and 30% for incineration and normalised values of economic cost, environmental damage to ecosystems and human health, and total cost and damage of Bsc and all alternative scenarios.
Sustainability 13 08972 g002
Table 1. Different residual MSW classes and management scenarios. The amount of waste treated through each waste treatment technology is shown, as well as the potential electricity generation and GHG emissions [8,23].
ScenariosClass (Treatment)Treated Waste
(kt/year)
Landfilled Waste
(kt/year)
Electricity Generation (GWh/year)GHG Emissions
(kt CO2 eq Emission/year)
Baseline ScenarioAll (Landfill)2024202475.51469.6
Scenario 1All (Incineration)20246301502.9−330.4
Scenario 2 Food (AD)612-182.0−113.9
Combustible and non-combustible (Landfill)1412141239.51037
Subtotal20241412221.5923.1
Scenario 3 Combustible (Incineration)11142871389.0−721.6
Food (AD)612-182.0−113.9
Non-combustible (Landfill)2982980.01.6
Subtotal20245851594.2−833.9
scenario 4 Combustible (Incineration)890223671.1−156
Plastic (Recycling)22319−3.7−516
Food (AD)612-182.0−113.9
Non-combustible (Landfill)2982980.01.6
Subtotal2024540849.4−784.3
Table 2. Economic variables and their units and values.
Economic VariableUnitValueReferences
Electricity generationAUD/MWh88.06[28]
Landfill levyAUD/t waste146[27]
Carbon priceAUD/t CO2 eq24.15[29]
Plastic recycling *AUD/t waste400[30]
Recycled plasticAUD/t plastic47[31]
Anaerobic digestion gate feesAUD/t waste200[32]
Incineration gate feesAUD/t waste130[33]
Landfill gate feeAUD/t waste75[34]
* Operate MRFs to 99.5% quality.
Table 3. Annual income from selling generated electricity, recycled plastic and carbon credits, and costs from landfill levy, carbon price, and gate fees.
Economic FactorsBscSc1Sc2Sc3Sc4
Generated electricity (mAUD/year)−6.6−132.3−19.5−138.3−74.8
Recycled plastic (mAUD/year)0000−9.6
Landfill levy (mAUD/year)295.591.9206.185.578.8
Carbon price (mAUD/year)35.5−822.3−20.1−18.9
Landfill gate fee (mAUD/year) 151.847.2105.943.940.5
MRFs gate fee (99.5% quality separation) (mAUD/year)000089.4
Anaerobic digestion gate fees (mAUD/year)00122.4122.4122.4
Incineration gate fees (mAUD/year)0263.10144.8115.7
Total cost and benefit (mAUD/year)476.1261.9437.2238.1343.6
Table 4. Annual economic cost, environmental damages to ecosystems and human health categories and electricity generation of different scenarios.
CategoryBscSc1 *Sc2Sc3 *Sc4 *Unit
Economic cost 476.1261.9437.2238.1343.6m AUD/year
Damage to ecosystems4.8−3.22.8−5.0−3.9species·yr/year
Damage to human health5719.1389.93730.2−1241.8−914.1DALY/year
Electricity generation75.51502.9221.51594.2849.4GWh/year
* (Incineration with electricity generation efficiency of 30%).
Table 5. Normalised values of economic cost, environmental damage to ecosystems, human health, and total cost and damage for different scenarios.
CategoryBscSc1 *Sc2Sc3 *Sc4 *
Economic cost1.000.100.840.000.44
Damage to ecosystems1.000.190.790.000.11
Damage to human health1.000.230.710.000.05
Total cost and damage3.000.522.340.000.60
* Incineration with electricity generation efficiency of 30%.
Table 6. Annual economic cost, environmental damages to ecosystems and human health categories and electricity generation of Bsc, Sc2 and scenarios including incineration treatment with different electricity generation efficiencies of 23%, 25% and 30%.
CategoryNo IncinerationIncineration Efficiency 23%Incineration Efficiency 25%Incineration Efficiency 30%Unit
BscSc2Sc1Sc3Sc4Sc1Sc3Sc4Sc1Sc3Sc4
Economic cost476437301272361290262356262238344m AUD/year
Damage to ecosystems 4.802.77−1.57−3.52−3.22−2.02−3.94−3.42−3.15−5.00−3.92species·yr/year
Damage to human health571937301094−580−600893−769−691390−1242−914DALY/year
Electricity generation75222115212656931252135973715031594849GWh/year
GHG emissions1471923−7−530−640−99−617−682−330−834−784kt CO2 eq/year
Table 7. Normalised values of economic cost, environmental damage to ecosystems and human health, and total cost and damage of Bsc, Sc2 and scenarios including incineration treatment with different electricity generation efficiencies of 23%, 25% and 30%, as well as the correlation of electricity generation with each cost and damage category.
Category(Normalized Value)No IncinerationIncineration Efficiency 23%Incineration Efficiency 25%Incineration Efficiency 30%Correlation with
BscSc2Sc1Sc3Sc4Sc1Sc3Sc4Sc1Sc3Sc4Electricity GenerationGHGEmissions
Economic cost1.000.840.260.140.520.220.100.490.100.000.44−0.990.77
Damage to ecosystems 1.000.790.350.150.180.300.110.160.190.000.11−0.810.99
Damage to human health1.000.710.340.100.090.310.070.080.230.000.05−0.731.00
Total cost and damage3.002.340.950.390.790.830.280.740.520.000.60−0.880.96
Publisher’s Note: MDPI stays neutral with regard to jurisdictional claims in published maps and institutional affiliations.

