
Changes in Walkable Streets during the COVID-19 Pandemic in a Suburban City in the Osaka Metropolitan Area


Abstract
:1. Introduction
1.1. Background: Walkable Neighborhoods during the COVID-19 Pandemic
1.2. Purpose: Walkable Streets Where Traffic Behavior Has Changed
1.3. Novelty: Traffic Behavior Change during the COVID-19 Pandemic
2. Materials and Methods
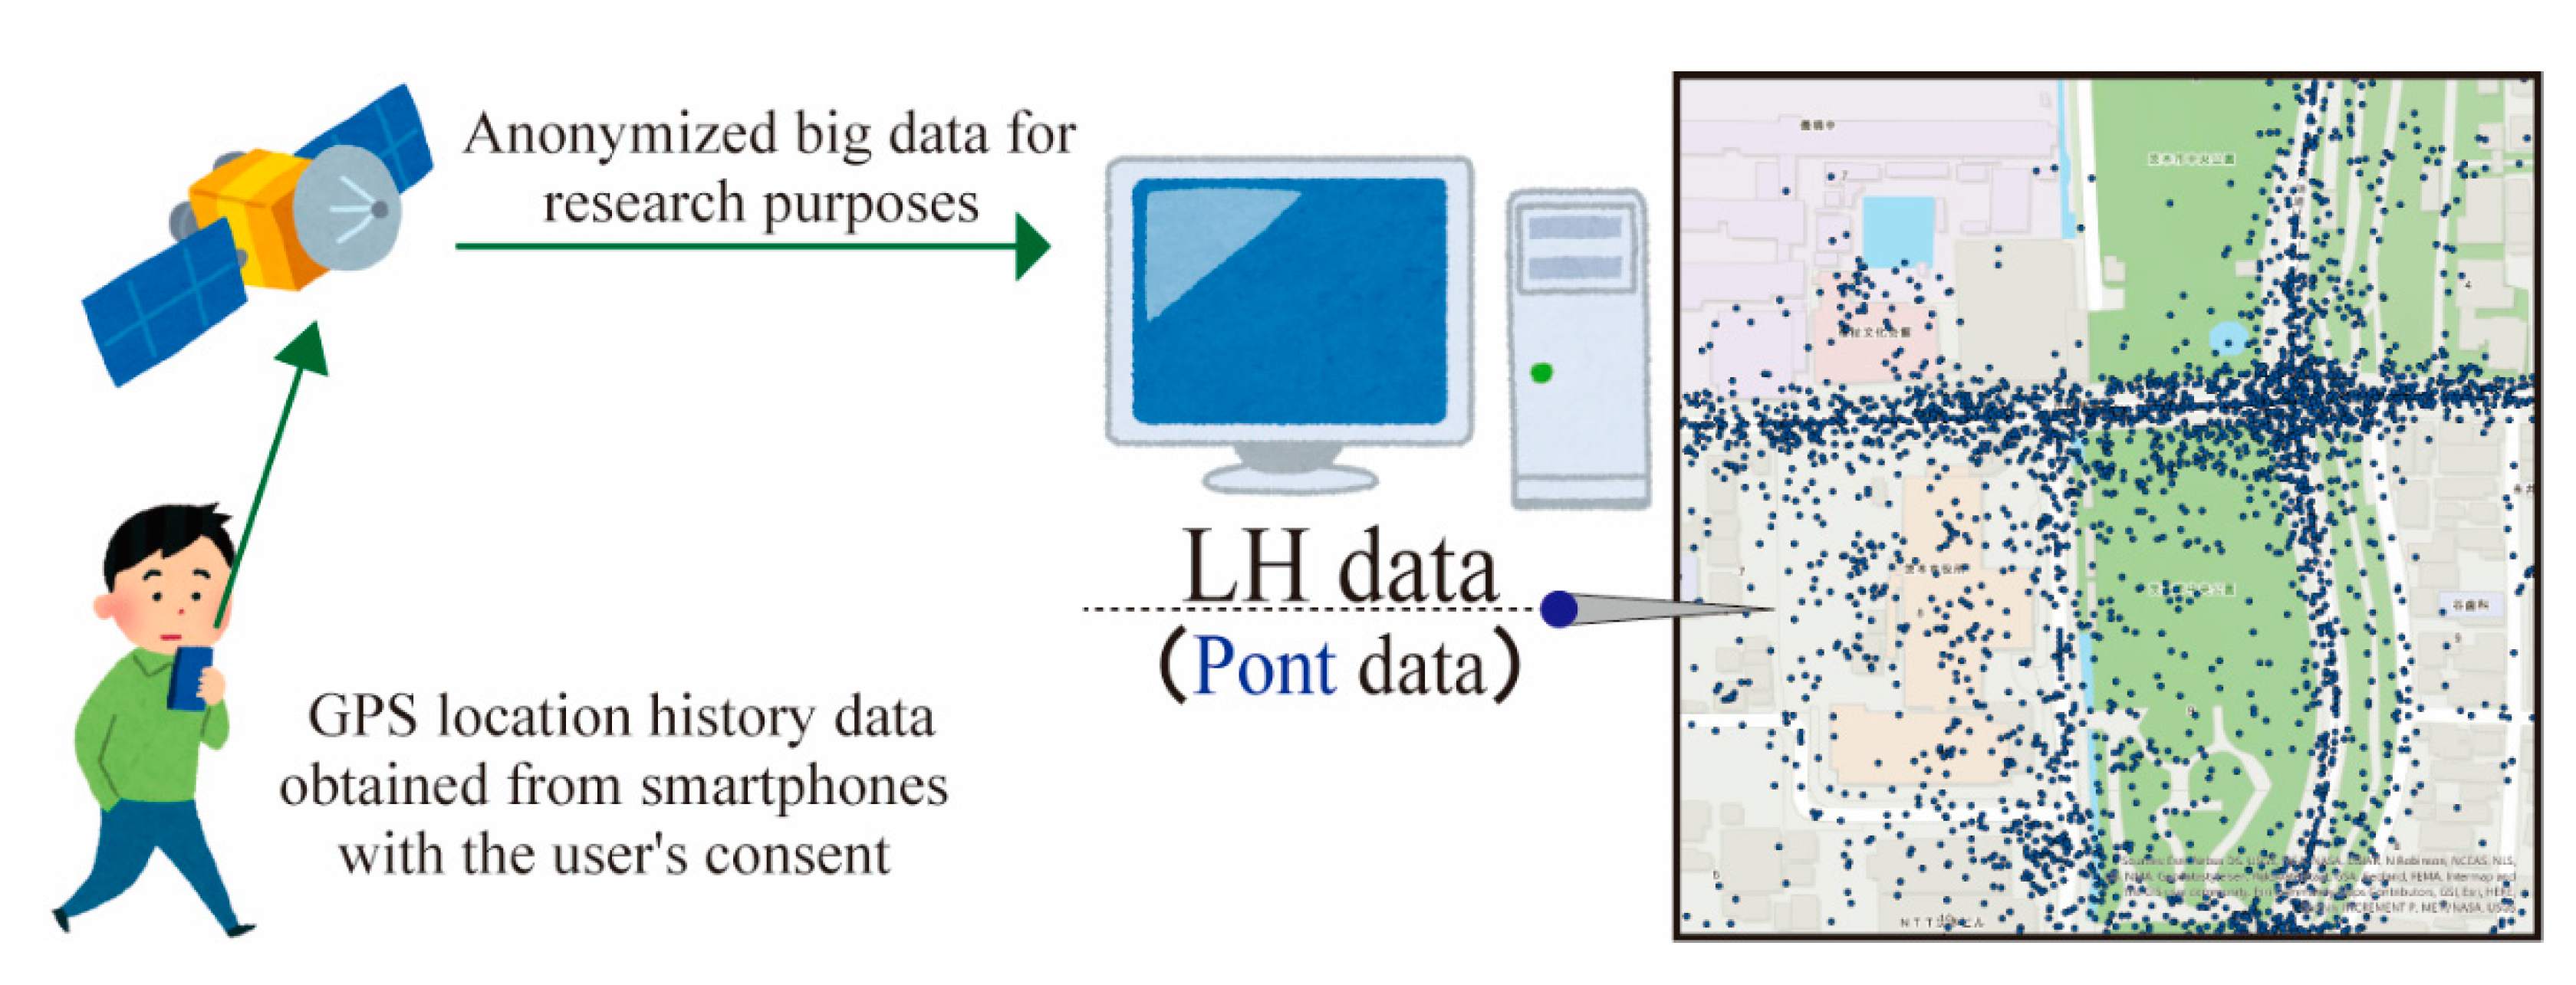
2.1. GPS Location History Data
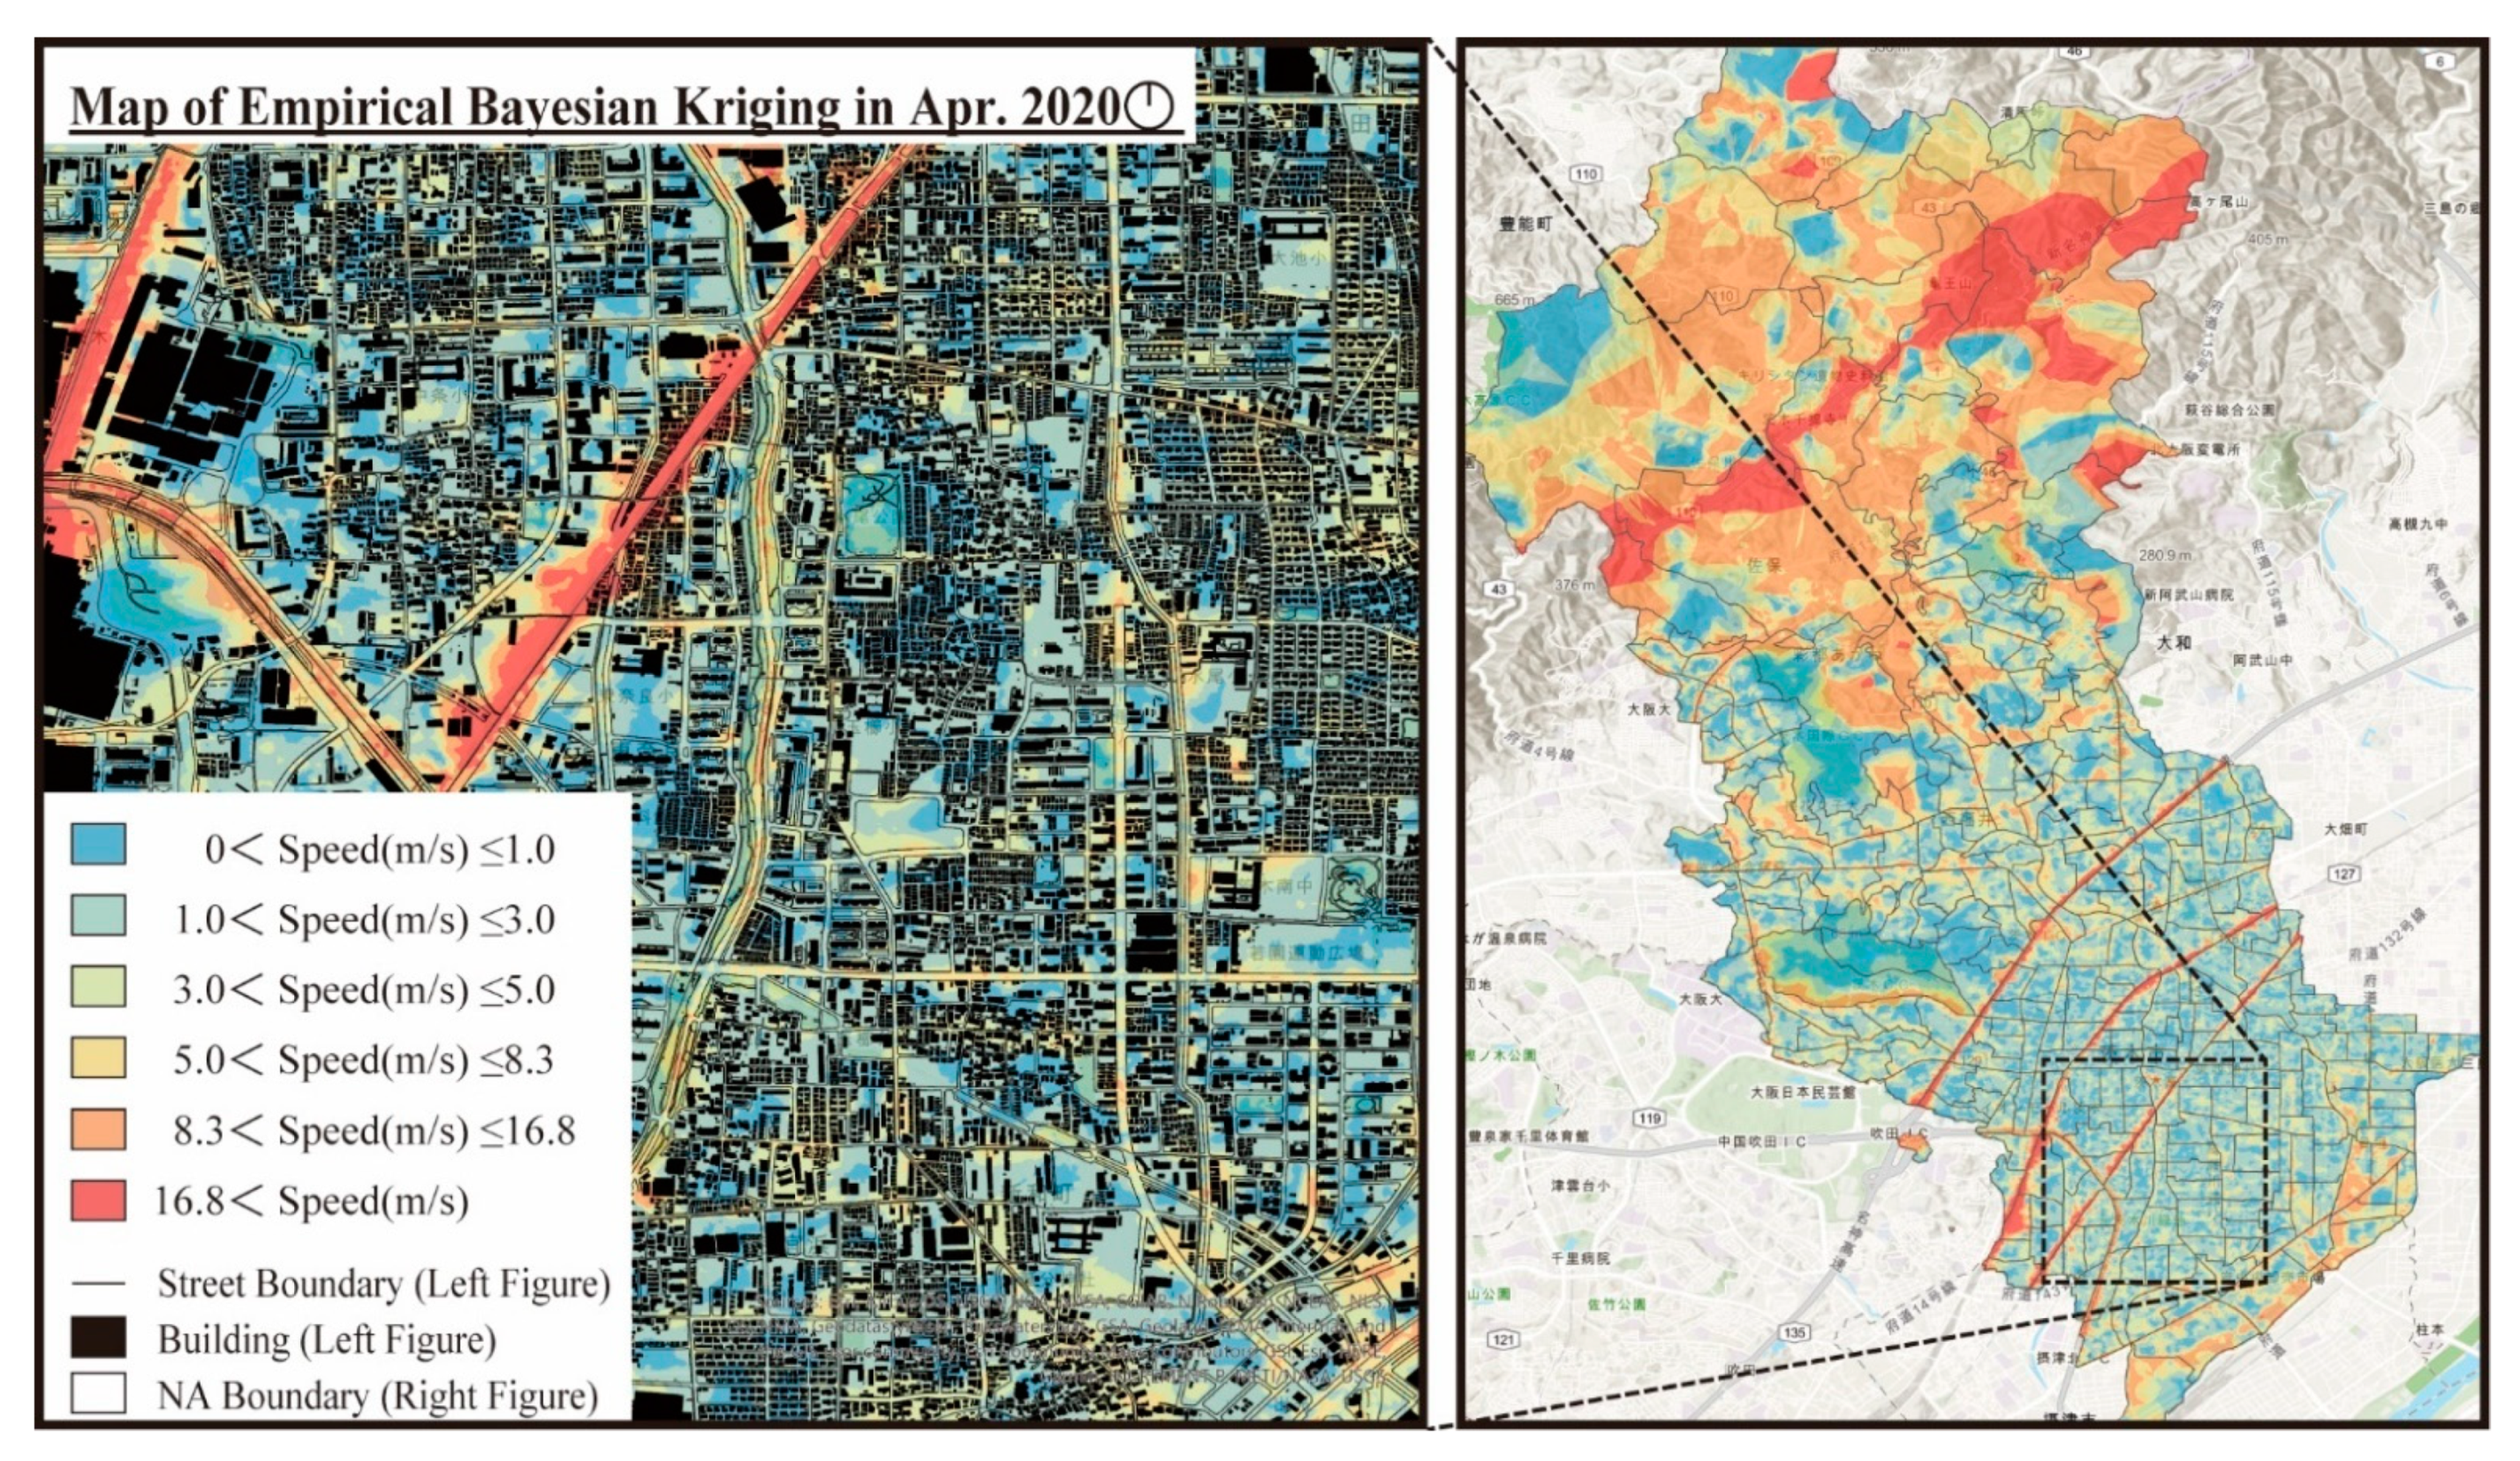
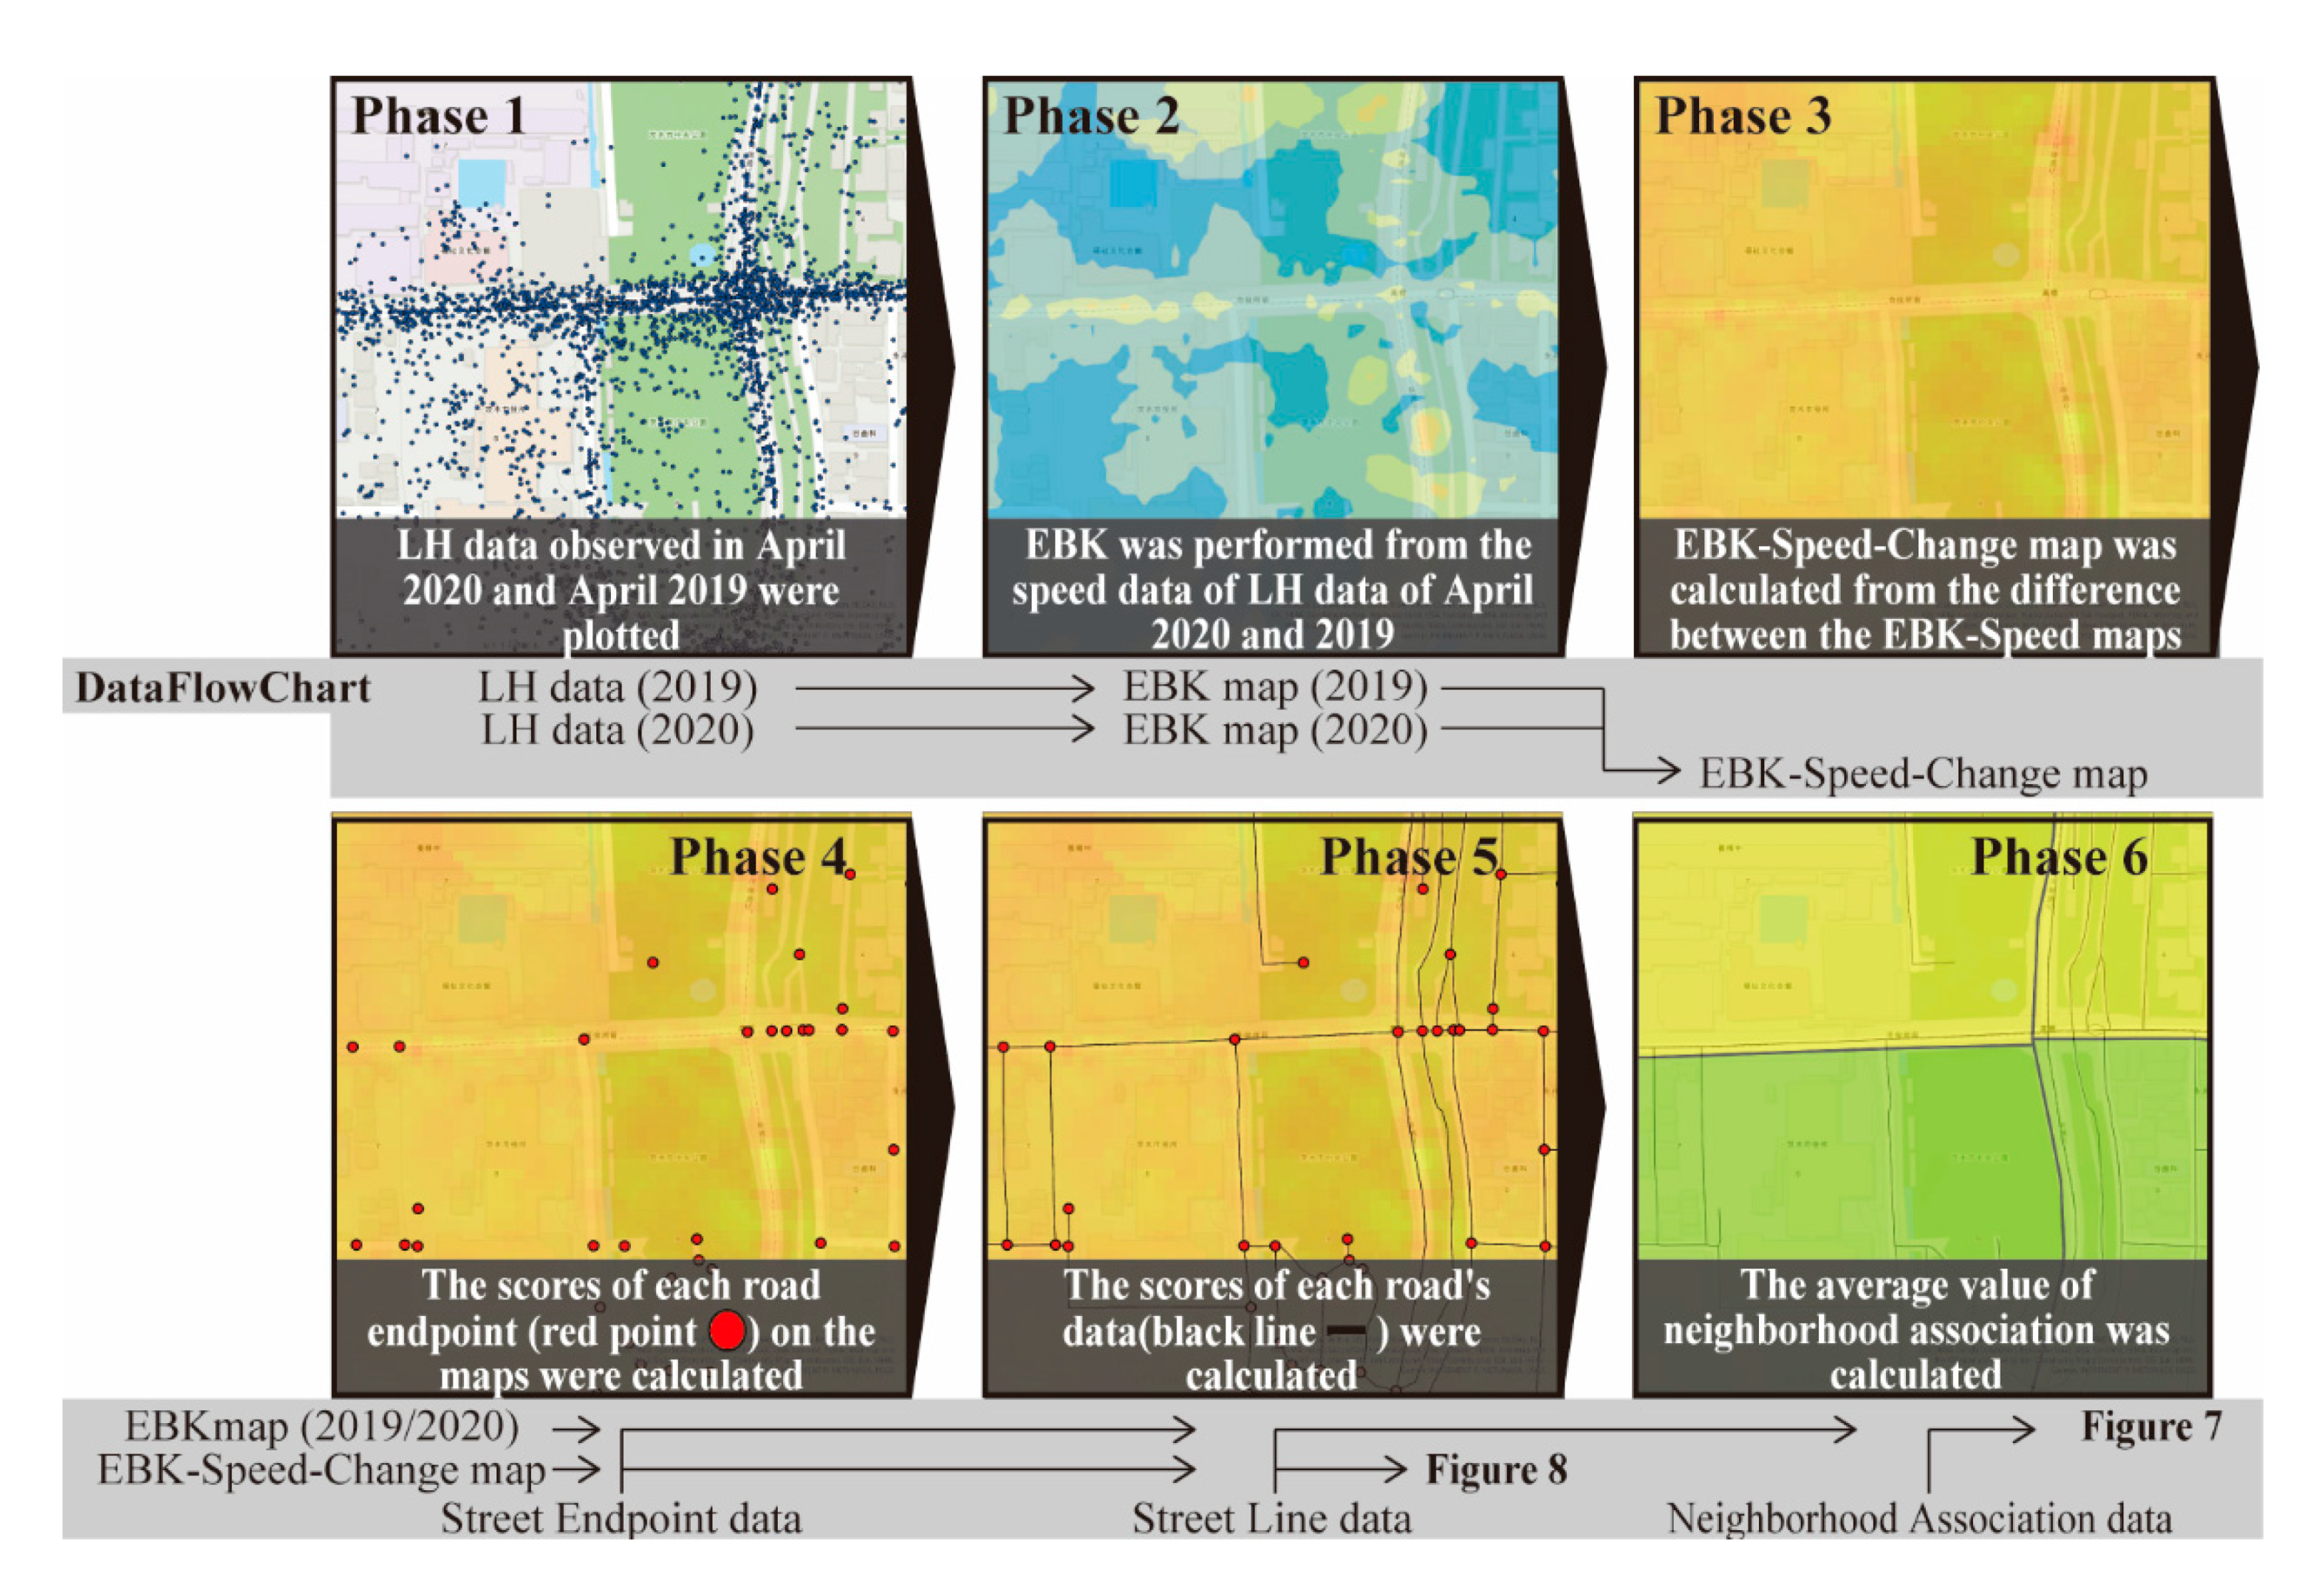
2.2. Empirical Bayesian Kriging
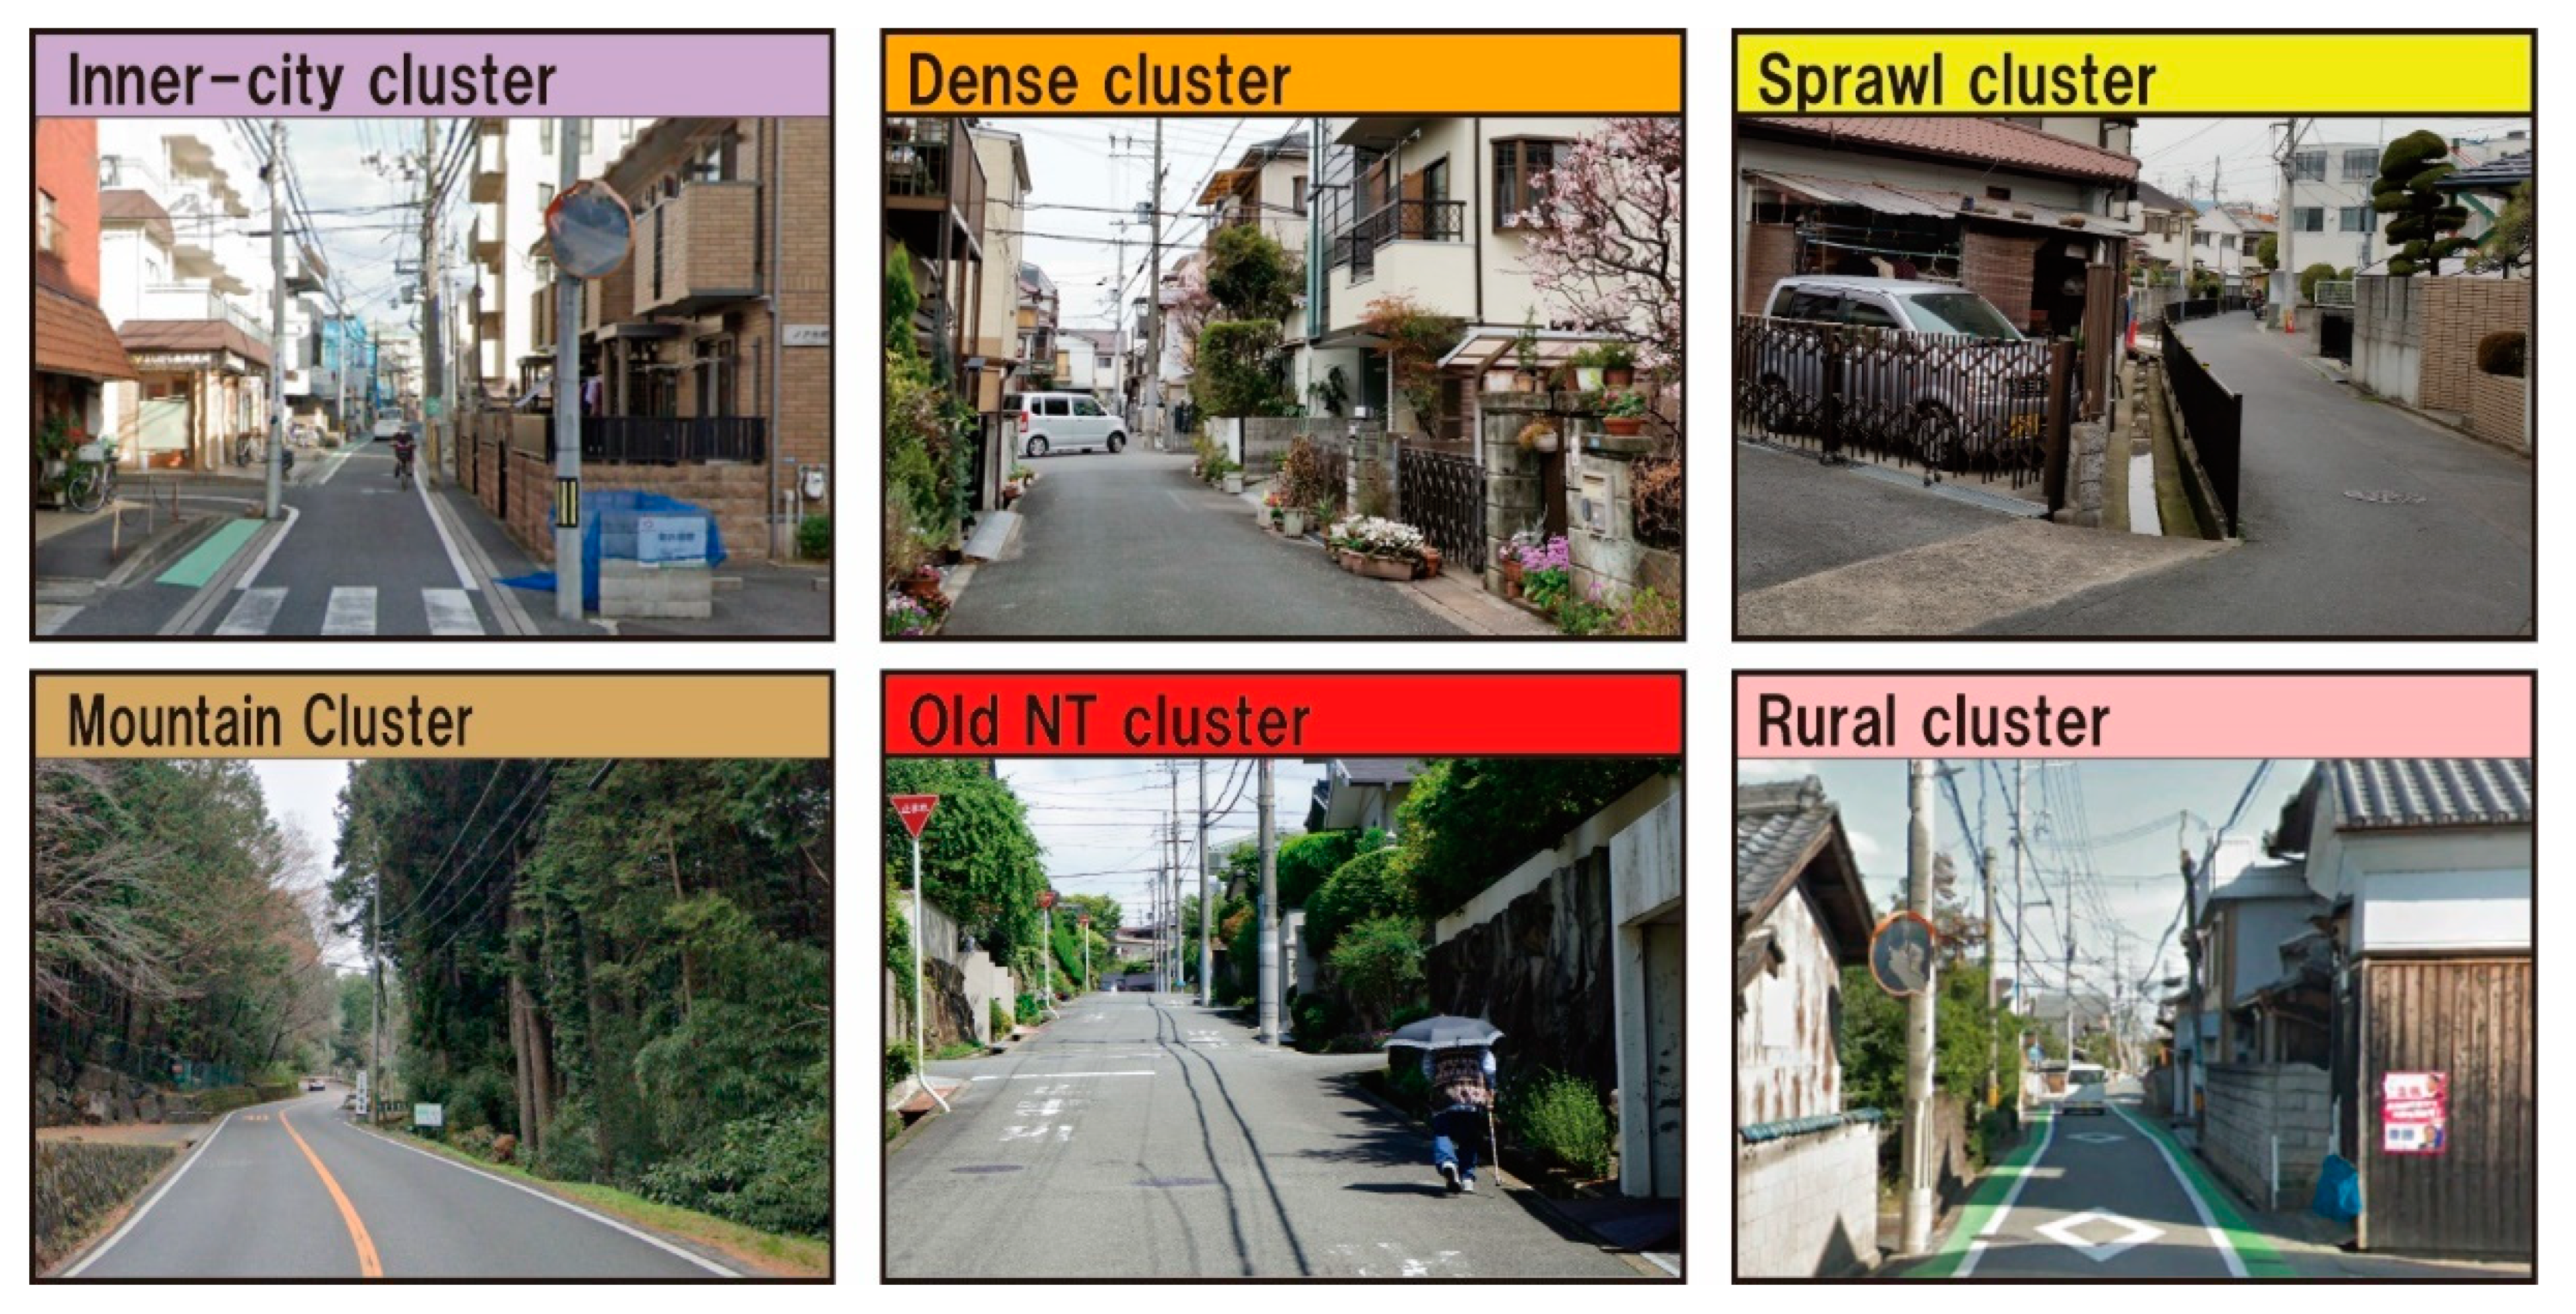
2.3. Urban Ecological Analysis
3. Results
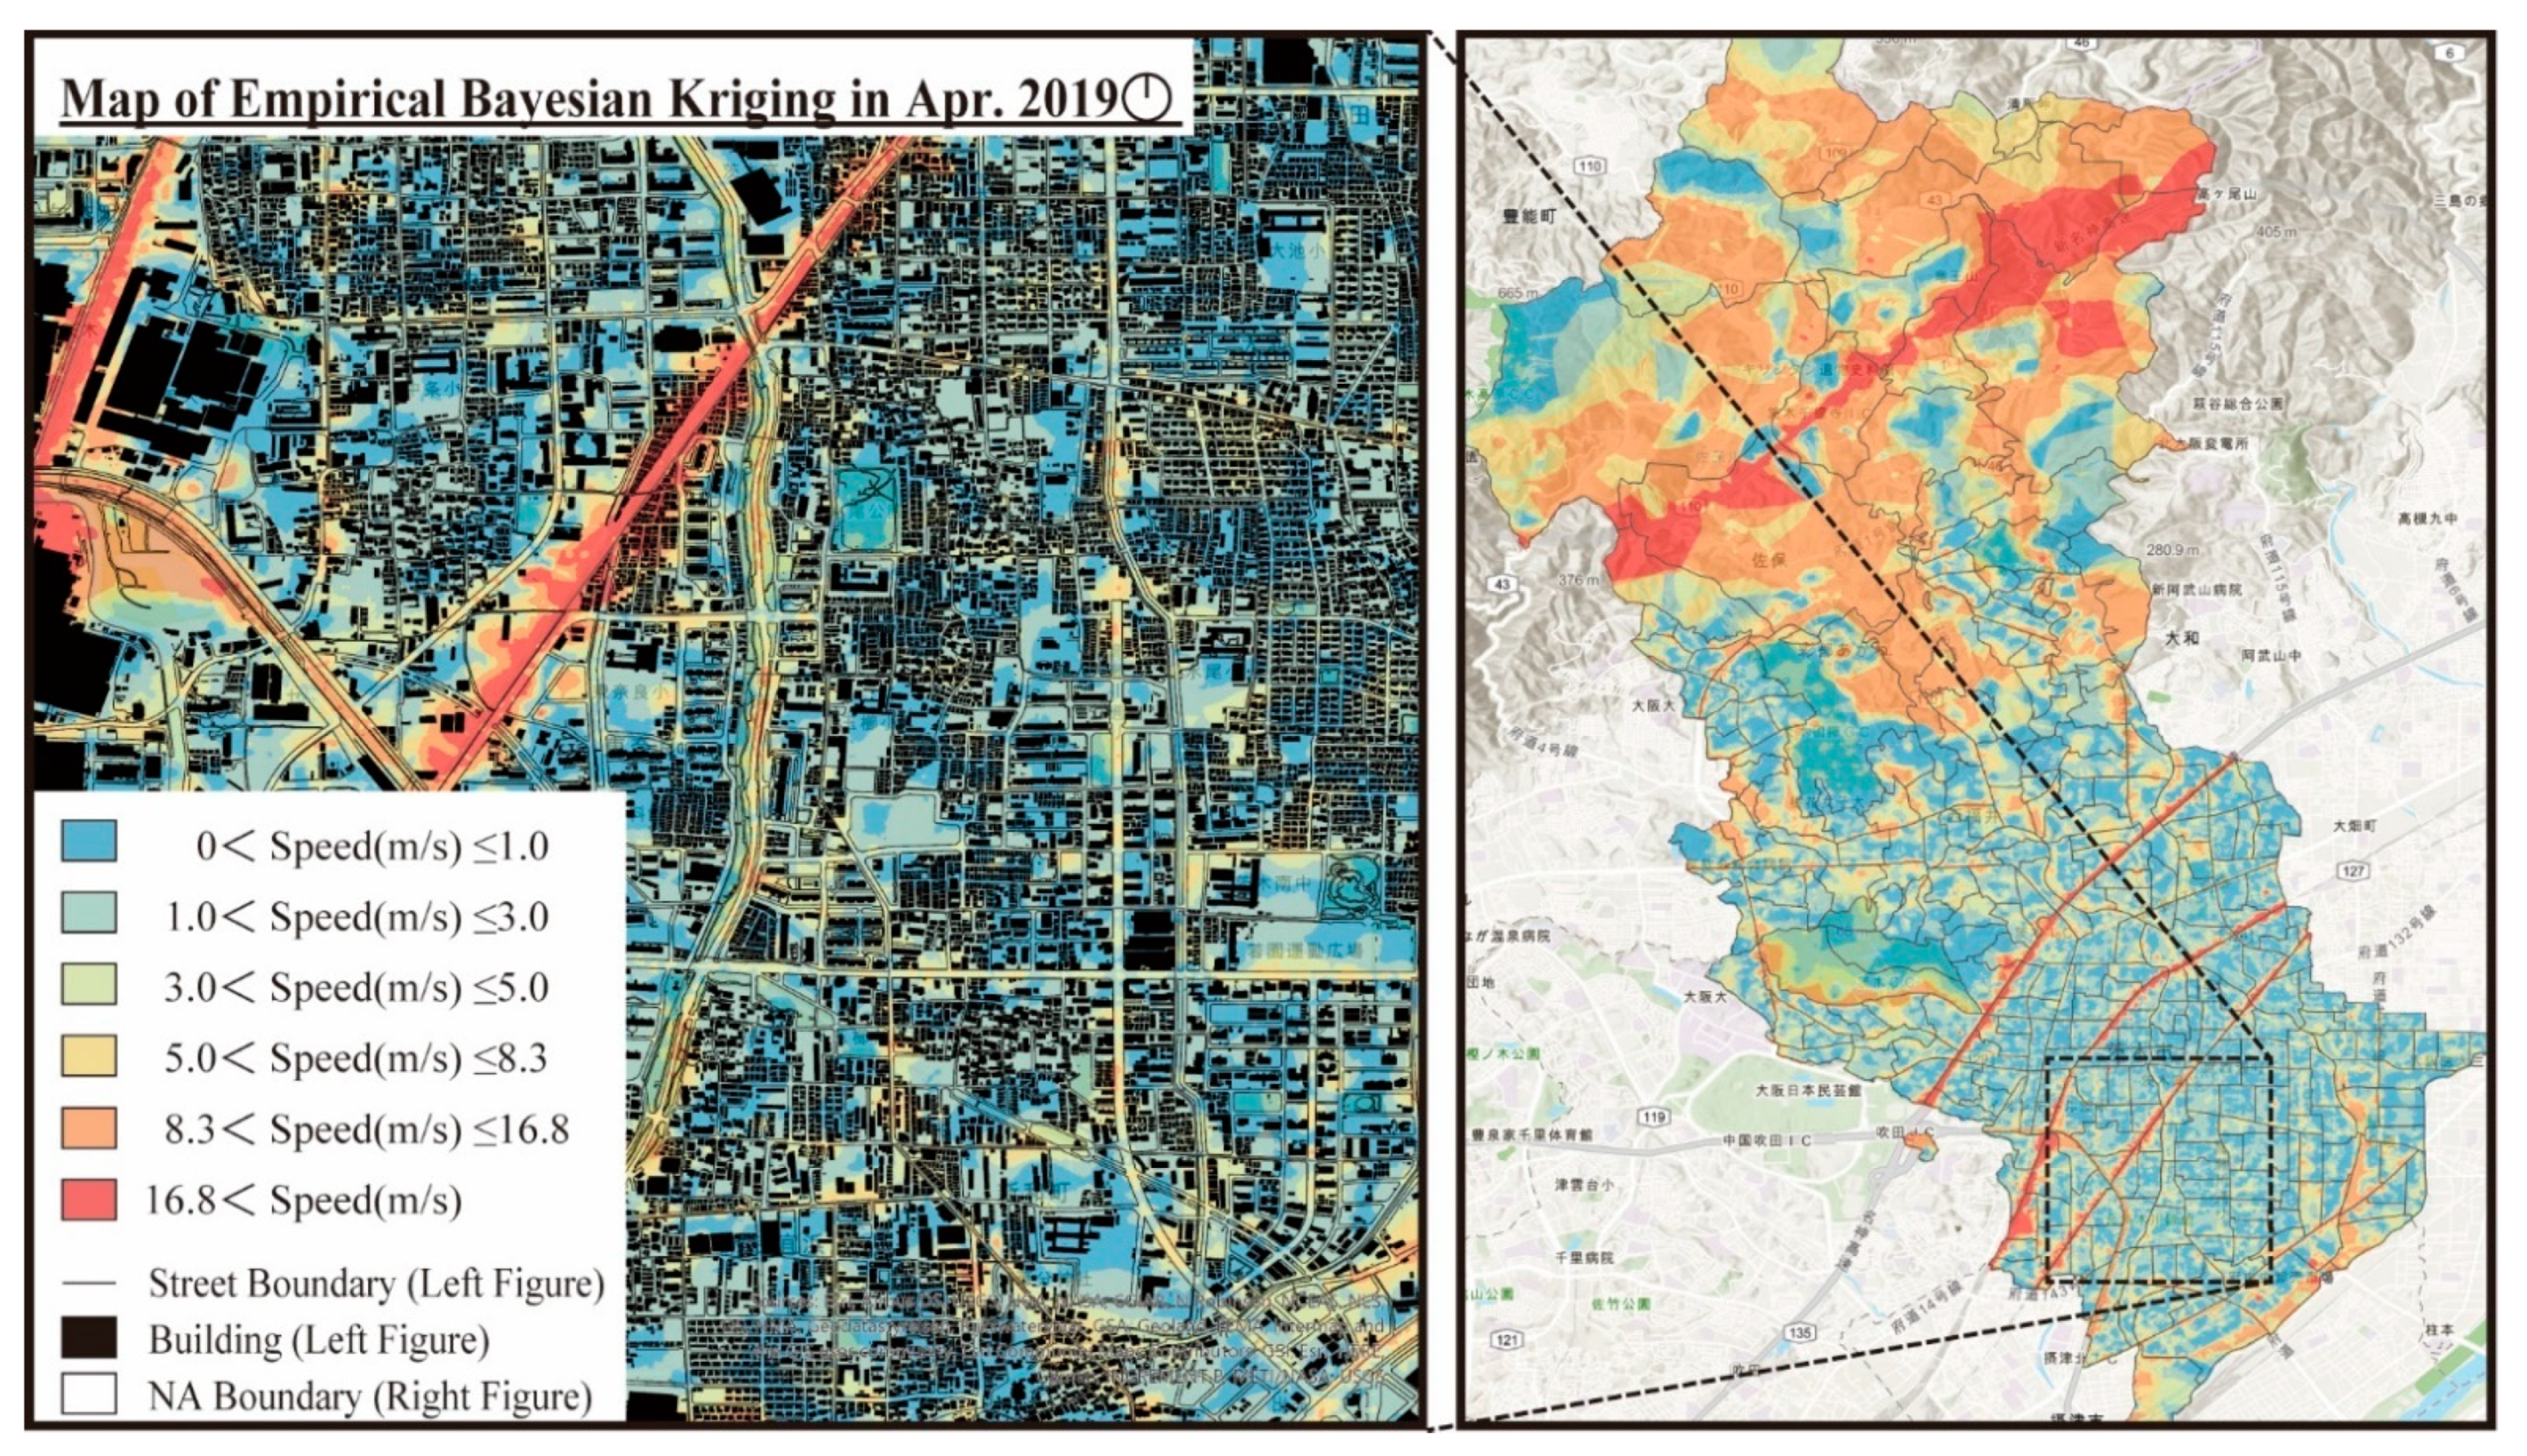
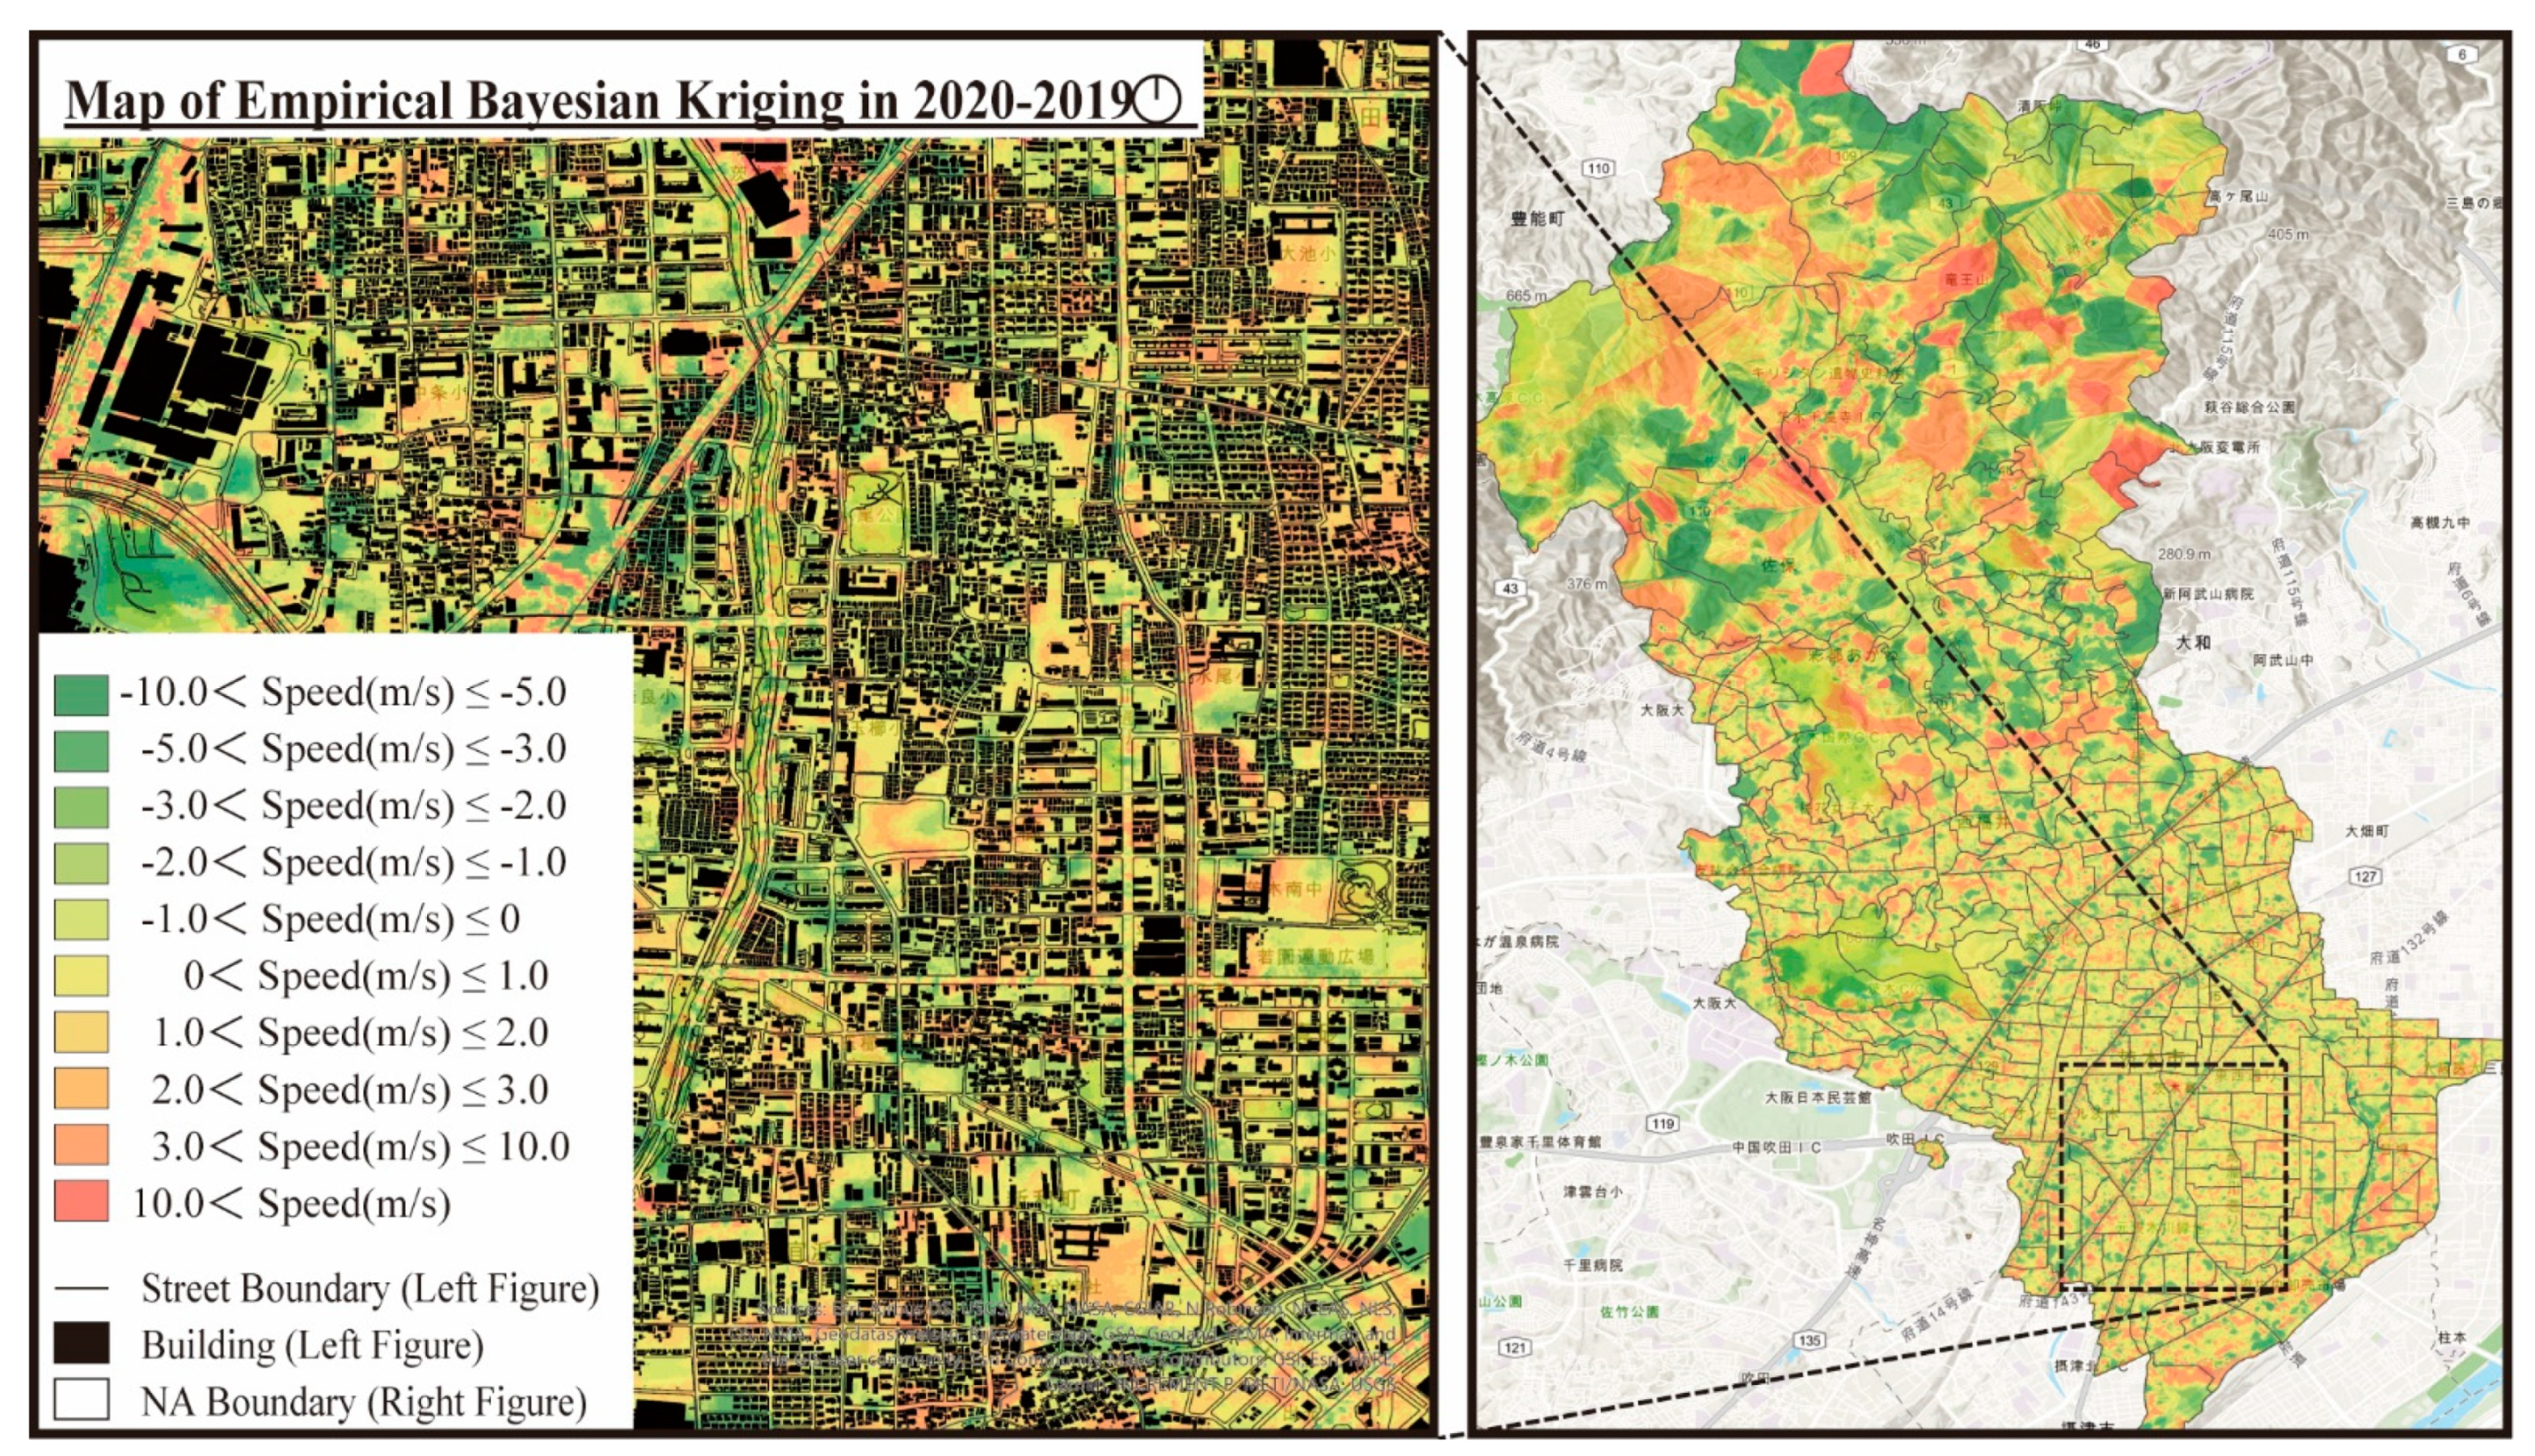
3.1. EBK-Speed Map
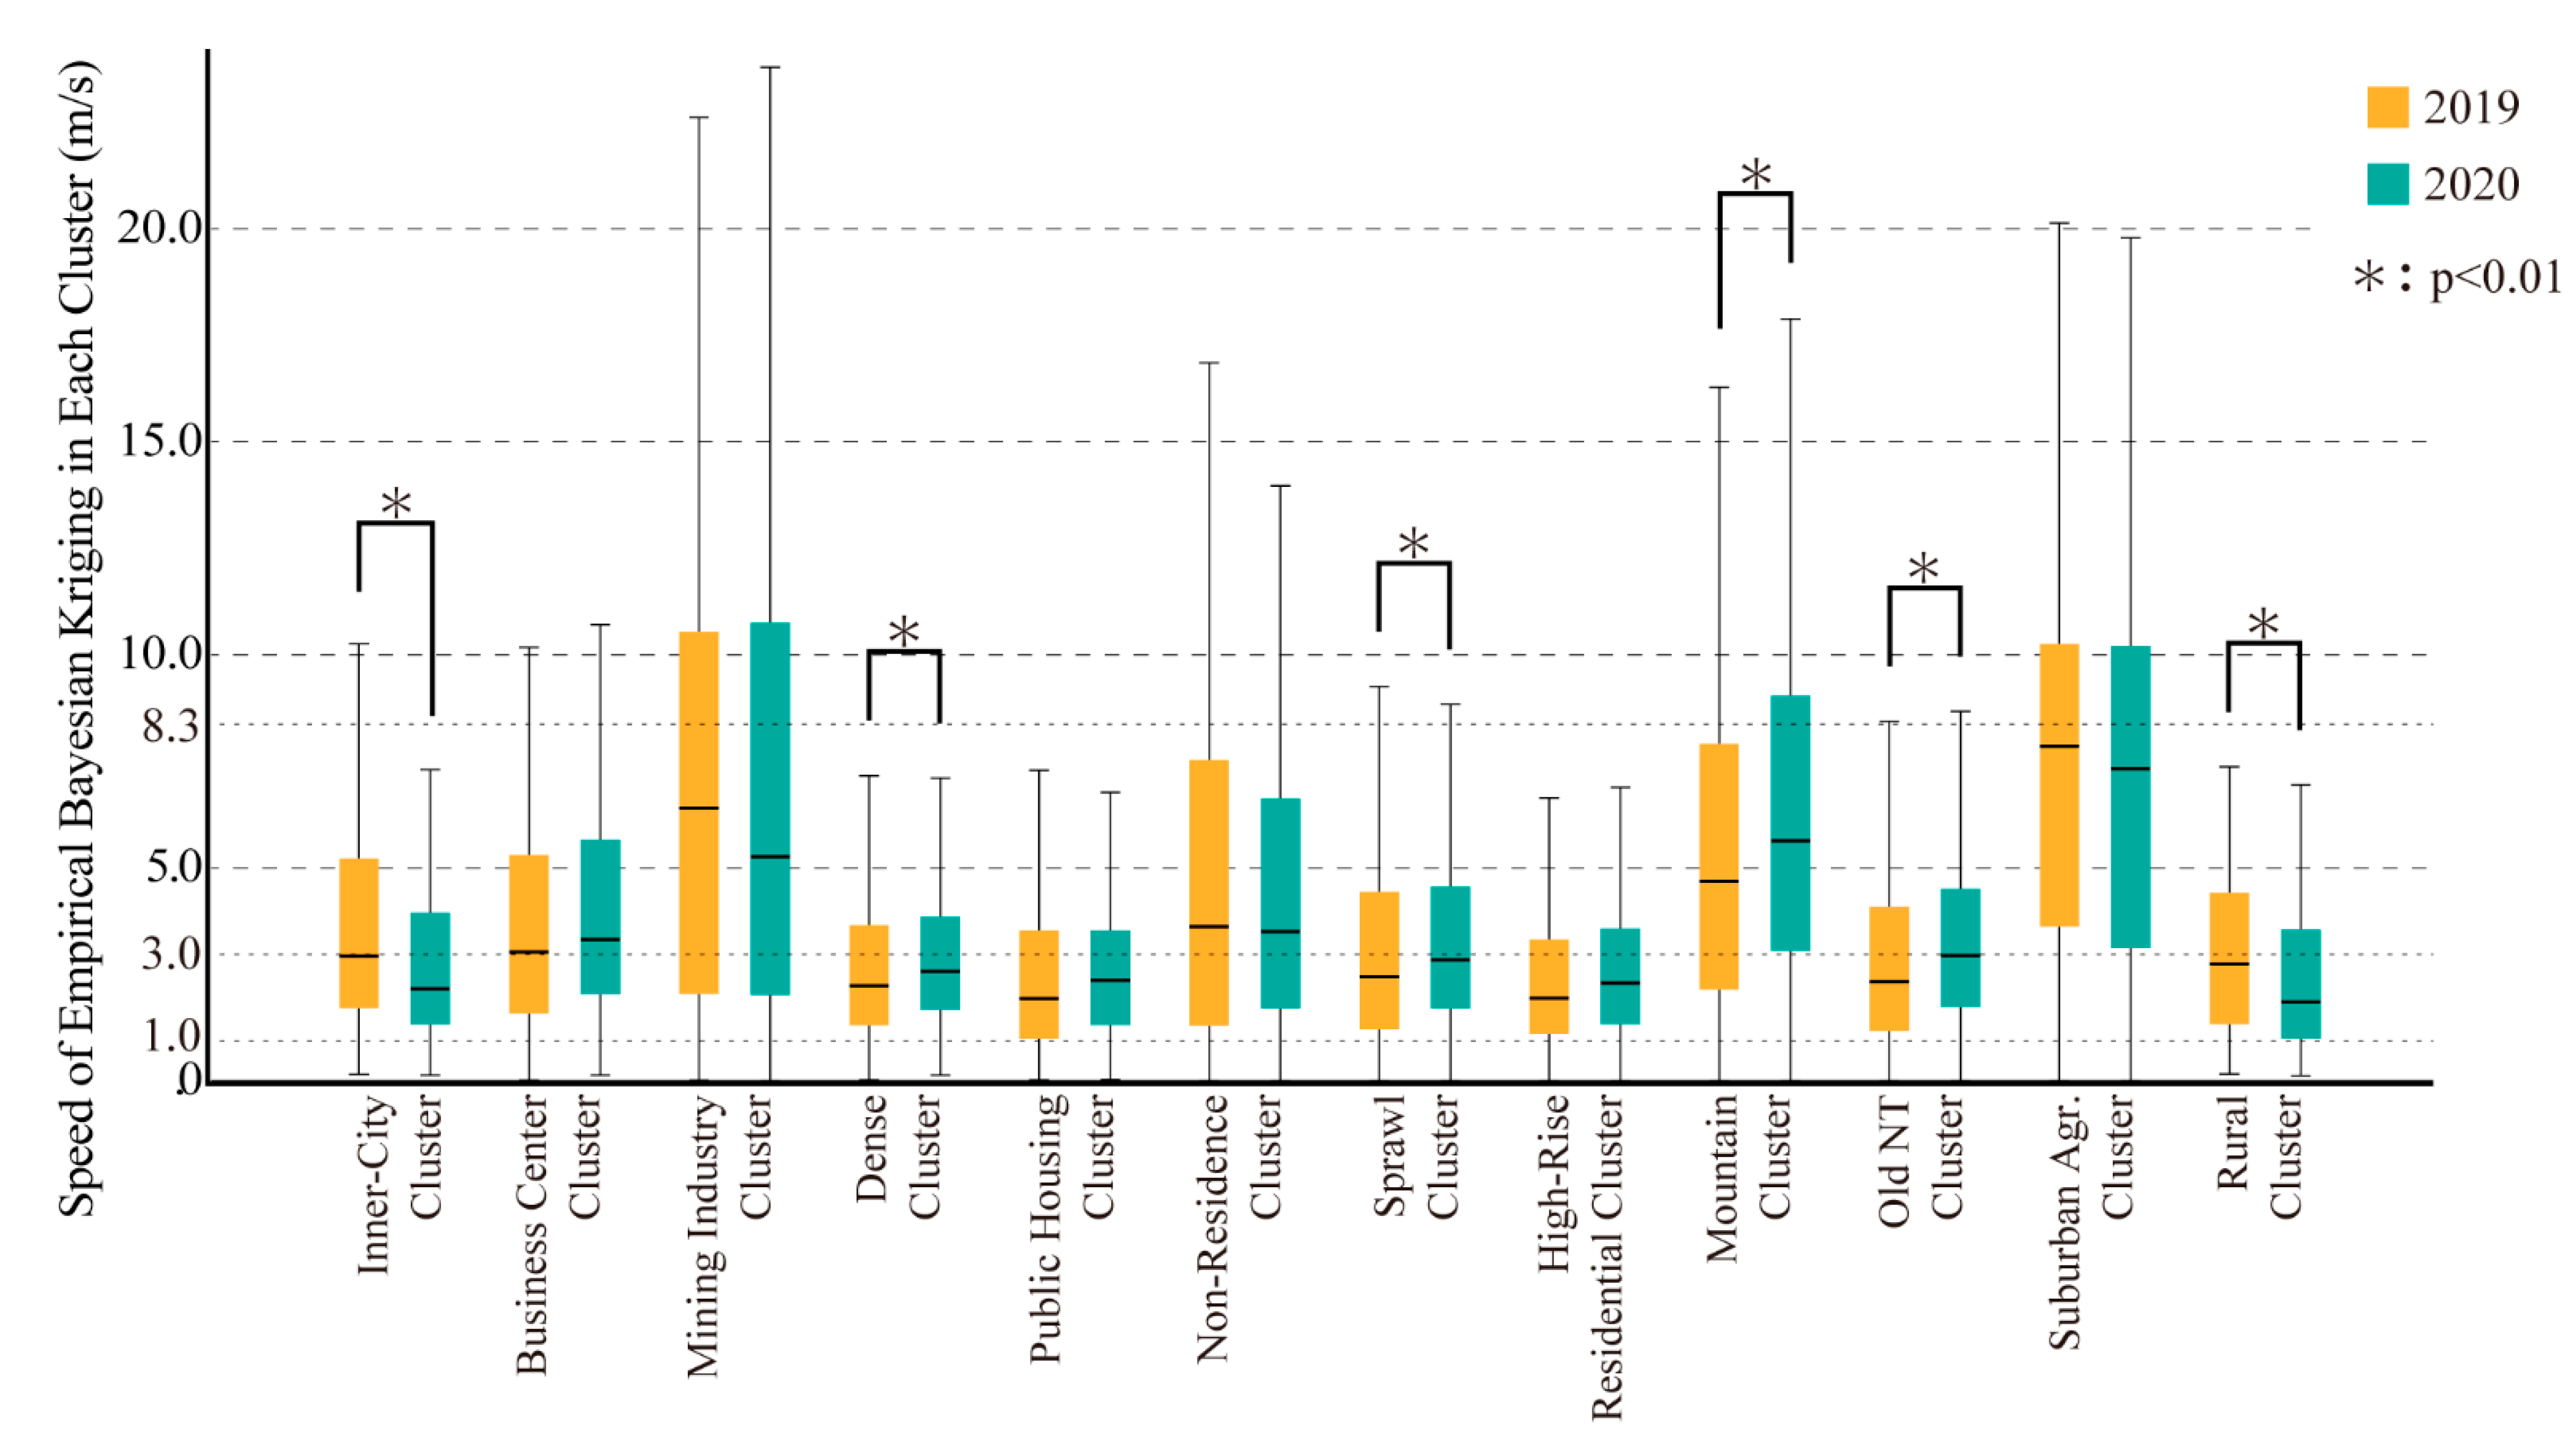
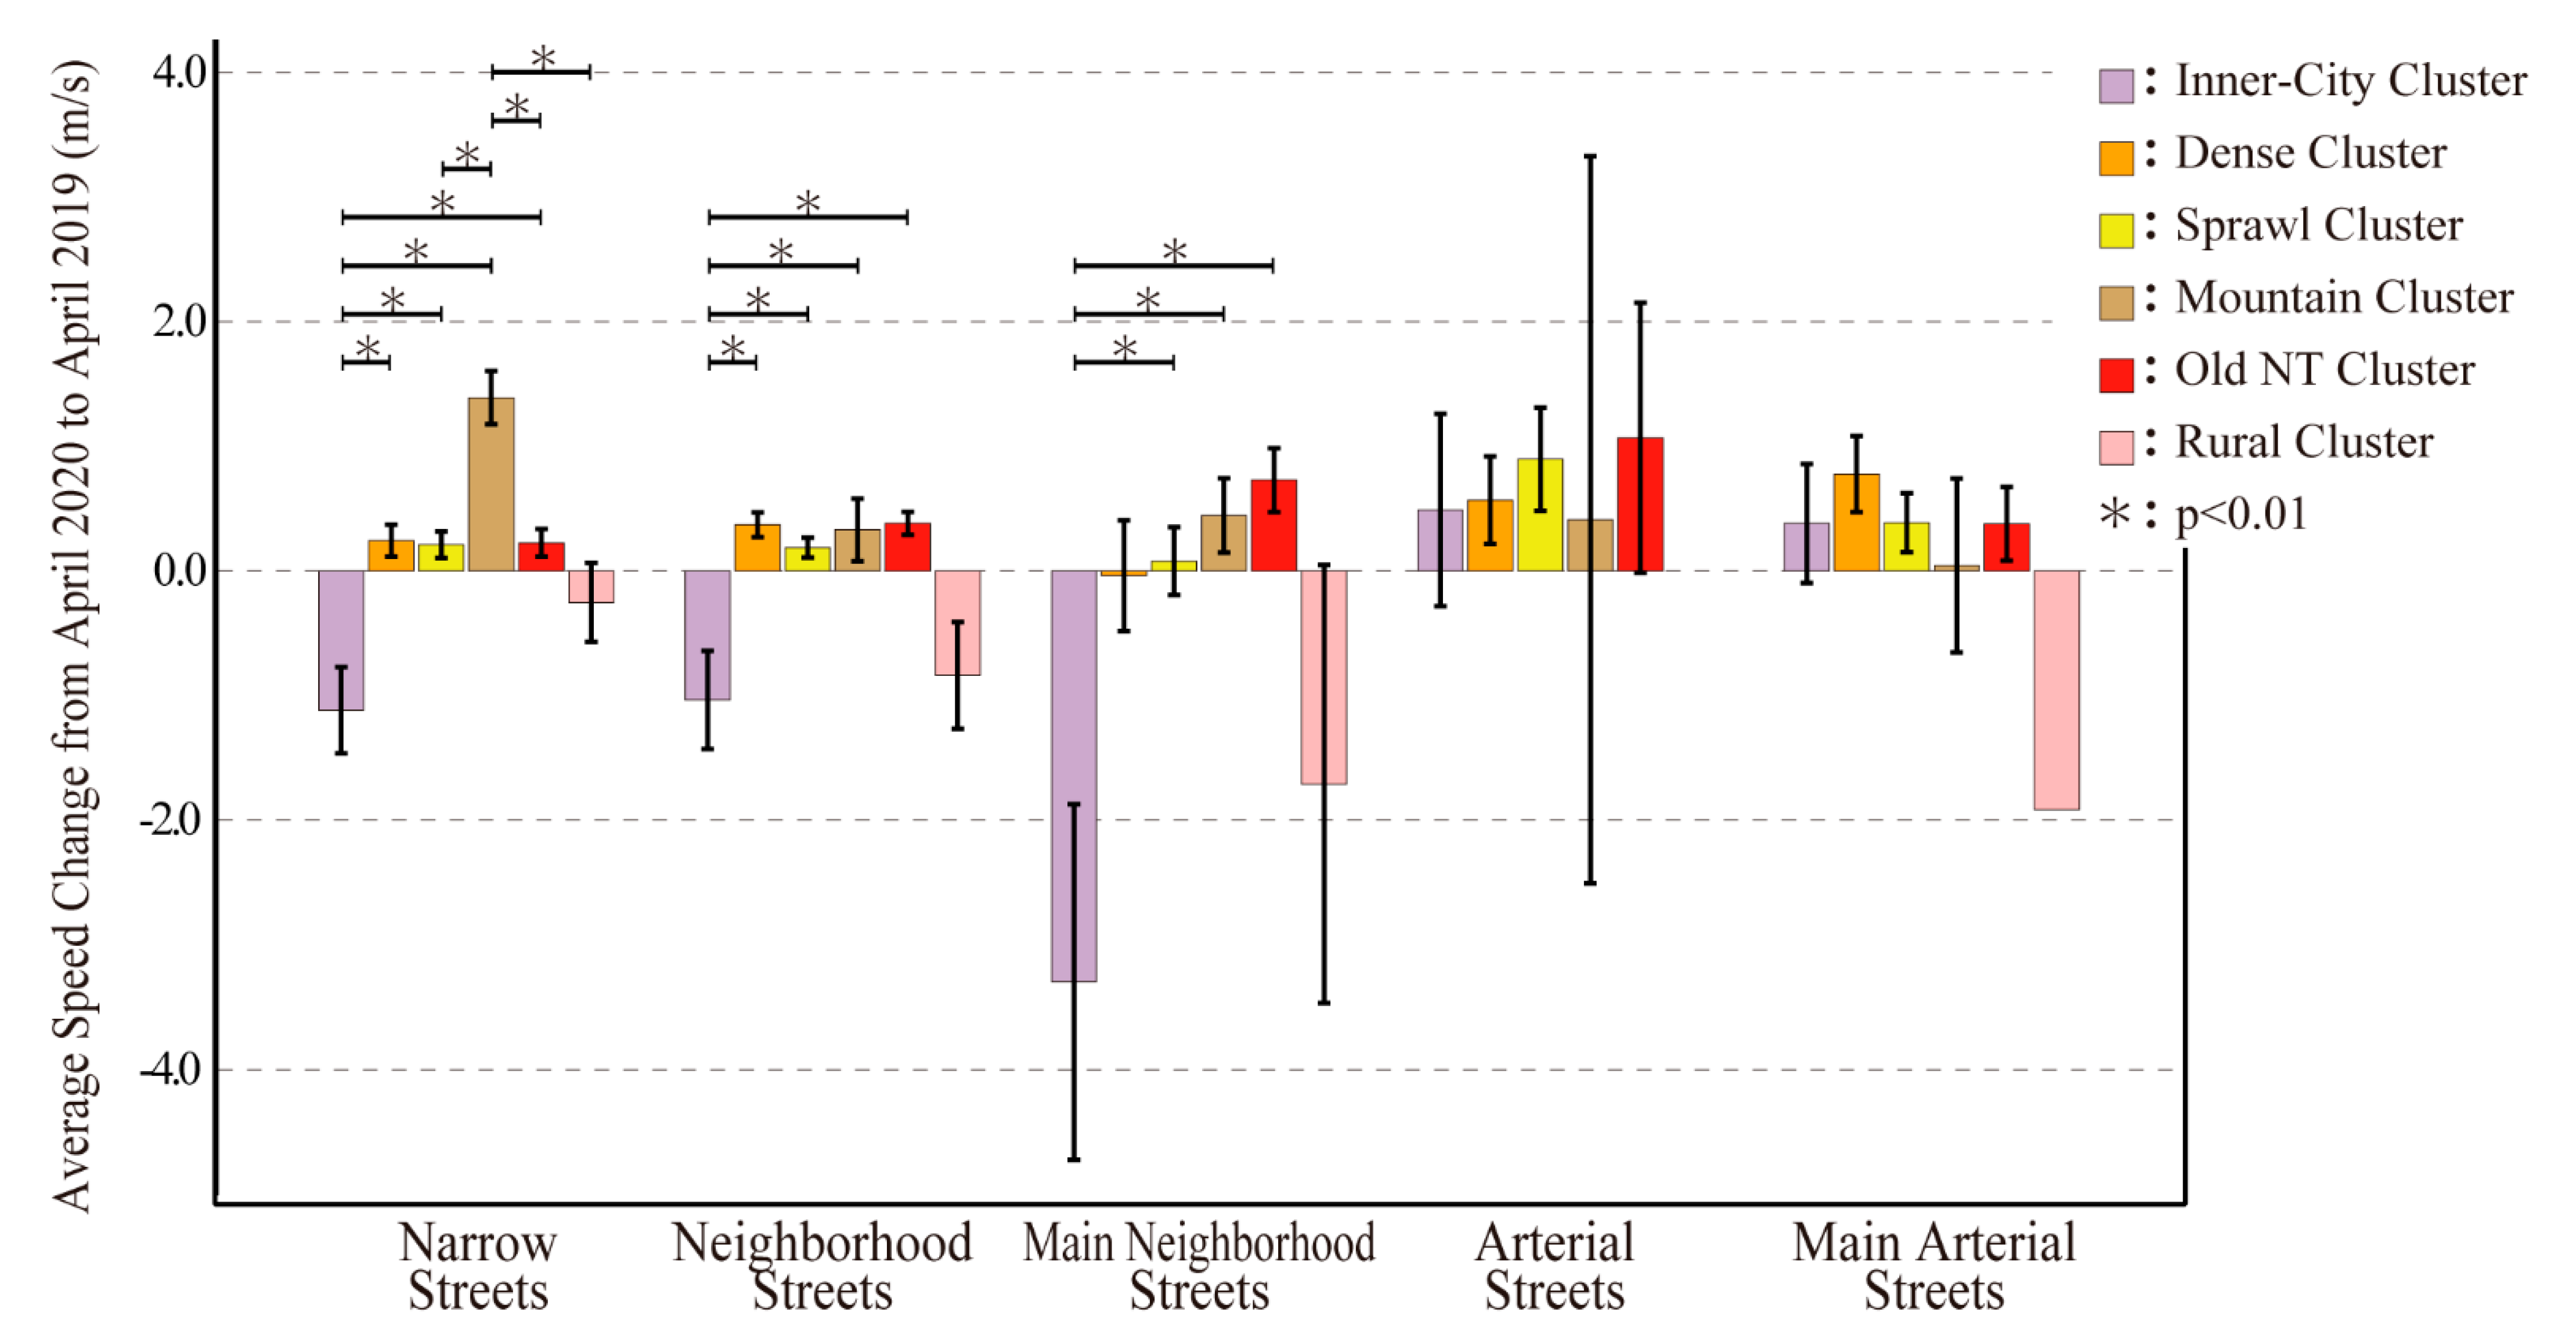
3.2. EBK-Speed-Change of Each Residential Cluster
3.3. Mobility Change of Each Residential Cluster
4. Discussion
5. Conclusions
Author Contributions
Funding
Institutional Review Board Statement
Informed Consent Statement
Data Availability Statement
Acknowledgments
Conflicts of Interest
Appendix A

| Heading | Inner-City Cluster | Business Center Cluster | Mining Industry Cluster | Dense Cluster | Public Housing Cluster | Non-Residential Cluster | Agriculture Cluster | Sprawl Cluster | High-Rise Residential Cluster | Mountain Cluster | Old New-Town Cluster | Suburban Agriculture Cluster | Rural Cluster |
|---|---|---|---|---|---|---|---|---|---|---|---|---|---|
| Number of residential areas in the cluster (N) | 1937 | 5472 | 728 | 672 | 889 | 7403 | 297 | 4998 | 628 | 7251 | 2546 | 2914 | 1033 |
| Urbanized area ratio (%) | 84.5 | 86.2 | 45.1 | 77.1 | 72.4 | 55.2 | 23.6 | 66.2 | 61.8 | 40.7 | 59.1 | 21.3 | 24.9 |
| Average distance from the center (km) | 19.3 | 34.5 | 59.9 | 31.2 | 26.7 | 43.9 | 71.6 | 38.2 | 25.9 | 56.1 | 26.7 | 63.1 | 52.1 |
| Population under 15 years old (%) | 0.06 | 0.01 | 0.03 | 0.06 | 0.05 | 0.00 | 0.04 | 0.02 | 0.09 | 0.01 | 0.03 | 0.01 | 0.10 |
| Population between 16 and 64 years old (%) | 0.09 | 0.02 | 0.04 | 0.09 | 0.08 | 0.00 | 0.06 | 0.03 | 0.12 | 0.01 | 0.05 | 0.02 | 0.14 |
| Population over 65 years old (%) | 0.10 | 0.02 | 0.04 | 0.07 | 0.12 | 0.00 | 0.09 | 0.04 | 0.11 | 0.01 | 0.05 | 0.03 | 0.15 |
| Population of foreigners (%) | 0.09 | 0.02 | 0.02 | 0.04 | 0.07 | 0.00 | 0.01 | 0.02 | 0.03 | 0.00 | 0.01 | 0.00 | 0.05 |
| Population who live in their own houses (%) | 0.09 | 0.02 | 0.04 | 0.07 | 0.05 | 0.00 | 0.07 | 0.03 | 0.13 | 0.01 | 0.05 | 0.02 | 0.15 |
| Population who live in public housing (%) | 0.01 | 0.00 | 0.00 | 0.01 | 0.12 | 0.00 | 0.01 | 0.00 | 0.01 | 0.00 | 0.00 | 0.00 | 0.01 |
| Population who live in private rented houses (%) | 0.10 | 0.02 | 0.02 | 0.10 | 0.02 | 0.00 | 0.02 | 0.03 | 0.05 | 0.00 | 0.02 | 0.00 | 0.07 |
| Population who live in houses for employees (%) | 0.02 | 0.00 | 0.01 | 0.08 | 0.01 | 0.00 | 0.01 | 0.01 | 0.02 | 0.00 | 0.01 | 0.00 | 0.02 |
| Population who live in shared houses (%) | 0.08 | 0.02 | 0.02 | 0.05 | 0.03 | 0.00 | 0.04 | 0.03 | 0.06 | 0.01 | 0.03 | 0.01 | 0.09 |
| Households who live outside of houses (%) | 0.00 | 0.00 | 0.00 | 0.03 | 0.00 | 0.00 | 0.00 | 0.00 | 0.00 | 0.00 | 0.00 | 0.00 | 0.01 |
| Households who live in detached houses (%) | 0.07 | 0.02 | 0.05 | 0.05 | 0.03 | 0.00 | 0.10 | 0.04 | 0.09 | 0.02 | 0.06 | 0.03 | 0.19 |
| Households who live in traditional nagaya houses (%) | 0.08 | 0.01 | 0.02 | 0.03 | 0.02 | 0.00 | 0.02 | 0.03 | 0.02 | 0.00 | 0.01 | 0.00 | 0.07 |
| Households who live in apartments (%) | 0.08 | 0.02 | 0.02 | 0.08 | 0.10 | 0.00 | 0.01 | 0.02 | 0.08 | 0.00 | 0.02 | 0.00 | 0.04 |
| Households who live in 1- or 2-storey buildings (%) | 0.05 | 0.02 | 0.04 | 0.07 | 0.02 | 0.00 | 0.04 | 0.05 | 0.05 | 0.00 | 0.03 | 0.01 | 0.16 |
| Households who live in 3- to 5-storey buildings (%) | 0.05 | 0.01 | 0.01 | 0.07 | 0.11 | 0.00 | 0.01 | 0.02 | 0.05 | 0.00 | 0.01 | 0.00 | 0.03 |
| Households who live in 6- to 10-storey buildings (%) | 0.06 | 0.01 | 0.01 | 0.06 | 0.04 | 0.00 | 0.00 | 0.01 | 0.05 | 0.00 | 0.01 | 0.00 | 0.02 |
| Households who live in 11(or more)-storey buildings (%) | 0.03 | 0.00 | 0.00 | 0.02 | 0.04 | 0.00 | 0.00 | 0.00 | 0.04 | 0.00 | 0.01 | 0.00 | 0.00 |
| Population who work in agriculture and forestry (%) | 0.00 | 0.00 | 0.01 | 0.00 | 0.00 | 0.00 | 0.13 | 0.00 | 0.01 | 0.01 | 0.00 | 0.03 | 0.03 |
| Population who work in a fishery (%) | 0.00 | 0.00 | 0.01 | 0.00 | 0.00 | 0.00 | 0.04 | 0.00 | 0.00 | 0.00 | 0.00 | 0.00 | 0.00 |
| Population who work in the mining industry (%) | 0.00 | 0.00 | 0.09 | 0.00 | 0.00 | 0.00 | 0.05 | 0.00 | 0.00 | 0.00 | 0.00 | 0.00 | 0.01 |
| Population who work in the construction industry (%) | 0.08 | 0.01 | 0.04 | 0.06 | 0.07 | 0.00 | 0.07 | 0.04 | 0.09 | 0.01 | 0.04 | 0.02 | 0.15 |
| Population who work in the manufacturing industry (%) | 0.05 | 0.01 | 0.03 | 0.07 | 0.05 | 0.00 | 0.05 | 0.03 | 0.08 | 0.01 | 0.03 | 0.02 | 0.12 |
| Population who work in the electricity, gas, and water supply industries (%) | 0.01 | 0.00 | 0.01 | 0.02 | 0.01 | 0.00 | 0.01 | 0.01 | 0.03 | 0.00 | 0.01 | 0.00 | 0.03 |
| Population who work in the information industry (%) | 0.08 | 0.01 | 0.02 | 0.08 | 0.04 | 0.00 | 0.01 | 0.02 | 0.12 | 0.00 | 0.04 | 0.00 | 0.06 |
| Population who work in the transport industry (%) | 0.08 | 0.02 | 0.03 | 0.07 | 0.10 | 0.00 | 0.05 | 0.04 | 0.09 | 0.01 | 0.04 | 0.02 | 0.14 |
| Population who work in the retail industry (%) | 0.09 | 0.02 | 0.03 | 0.08 | 0.07 | 0.00 | 0.06 | 0.03 | 0.12 | 0.01 | 0.04 | 0.02 | 0.13 |
| Population who work in the financial industry (%) | 0.06 | 0.01 | 0.02 | 0.08 | 0.04 | 0.00 | 0.03 | 0.02 | 0.12 | 0.00 | 0.04 | 0.01 | 0.08 |
| Population who work in the real estate business (%) | 0.09 | 0.02 | 0.03 | 0.08 | 0.06 | 0.00 | 0.02 | 0.03 | 0.12 | 0.01 | 0.04 | 0.01 | 0.08 |
| Population who work as researchers or professionals (%) | 0.06 | 0.01 | 0.02 | 0.07 | 0.04 | 0.00 | 0.03 | 0.02 | 0.11 | 0.01 | 0.04 | 0.01 | 0.07 |
| Population who work in the service industry (%) | 0.09 | 0.02 | 0.03 | 0.07 | 0.07 | 0.00 | 0.06 | 0.03 | 0.09 | 0.01 | 0.04 | 0.01 | 0.12 |
| Population who work in the entertainment industry (%) | 0.06 | 0.01 | 0.02 | 0.05 | 0.05 | 0.00 | 0.04 | 0.02 | 0.07 | 0.01 | 0.03 | 0.01 | 0.09 |
| Population who work in education (%) | 0.06 | 0.02 | 0.03 | 0.08 | 0.04 | 0.00 | 0.05 | 0.02 | 0.13 | 0.01 | 0.05 | 0.02 | 0.10 |
| Population who work in the medical/welfare industry (%) | 0.07 | 0.02 | 0.03 | 0.07 | 0.07 | 0.00 | 0.06 | 0.03 | 0.11 | 0.01 | 0.04 | 0.02 | 0.13 |
| Population who work in a joint service industry (%) | 0.05 | 0.01 | 0.05 | 0.06 | 0.05 | 0.00 | 0.18 | 0.03 | 0.09 | 0.02 | 0.04 | 0.05 | 0.18 |
| Population who work in another service industry (%) | 0.09 | 0.02 | 0.04 | 0.08 | 0.10 | 0.00 | 0.06 | 0.04 | 0.11 | 0.01 | 0.04 | 0.02 | 0.14 |
| Population who work as civil servants (%) | 0.02 | 0.00 | 0.01 | 0.05 | 0.01 | 0.00 | 0.02 | 0.01 | 0.04 | 0.00 | 0.01 | 0.01 | 0.04 |
| Population who work at home (%) | 0.08 | 0.02 | 0.04 | 0.06 | 0.04 | 0.00 | 0.18 | 0.03 | 0.07 | 0.01 | 0.03 | 0.05 | 0.13 |
| Population who work in their own city (%) | 0.06 | 0.01 | 0.04 | 0.07 | 0.06 | 0.00 | 0.07 | 0.03 | 0.07 | 0.01 | 0.03 | 0.02 | 0.14 |
| Population who work in other cities (%) | 0.07 | 0.01 | 0.03 | 0.07 | 0.06 | 0.00 | 0.04 | 0.02 | 0.11 | 0.01 | 0.04 | 0.01 | 0.10 |
| Population who work in other wards of their own cities (%) | 0.07 | 0.01 | 0.01 | 0.01 | 0.03 | 0.00 | 0.00 | 0.00 | 0.01 | 0.00 | 0.00 | 0.00 | 0.00 |
| Population who work in other cities of their own prefectures (%) | 0.03 | 0.00 | 0.02 | 0.07 | 0.05 | 0.00 | 0.05 | 0.03 | 0.09 | 0.01 | 0.04 | 0.01 | 0.12 |
| Population who work in other prefectures (%) | 0.03 | 0.01 | 0.02 | 0.07 | 0.03 | 0.00 | 0.01 | 0.01 | 0.15 | 0.00 | 0.05 | 0.01 | 0.05 |
| Population who go to school in their own city (%) | 0.04 | 0.01 | 0.02 | 0.06 | 0.04 | 0.00 | 0.04 | 0.02 | 0.07 | 0.01 | 0.03 | 0.01 | 0.09 |
| Population who go to school in other cities (%) | 0.07 | 0.01 | 0.03 | 0.06 | 0.06 | 0.00 | 0.04 | 0.03 | 0.14 | 0.01 | 0.05 | 0.01 | 0.11 |
| Population who go to school in other wards of their own cities (%) | 0.07 | 0.02 | 0.01 | 0.01 | 0.03 | 0.00 | 0.00 | 0.00 | 0.01 | 0.00 | 0.00 | 0.00 | 0.00 |
| Population who go to school in other cities of their own prefectures (%) | 0.04 | 0.01 | 0.03 | 0.06 | 0.06 | 0.00 | 0.06 | 0.03 | 0.13 | 0.01 | 0.05 | 0.02 | 0.13 |
| Population who go to school in other prefectures (%) | 0.04 | 0.01 | 0.02 | 0.06 | 0.03 | 0.00 | 0.03 | 0.02 | 0.16 | 0.01 | 0.05 | 0.01 | 0.08 |
| Population who have lived in the area since birth (%) | 0.07 | 0.02 | 0.05 | 0.06 | 0.05 | 0.00 | 0.13 | 0.04 | 0.10 | 0.02 | 0.04 | 0.05 | 0.17 |
| Population who have lived in the area for 1 year (%) | 0.06 | 0.02 | 0.02 | 0.10 | 0.05 | 0.00 | 0.03 | 0.03 | 0.07 | 0.00 | 0.03 | 0.01 | 0.08 |
| Population who have lived in the area for the past 5 years (%) | 0.06 | 0.01 | 0.02 | 0.08 | 0.06 | 0.00 | 0.03 | 0.02 | 0.08 | 0.00 | 0.03 | 0.01 | 0.09 |
| Population who have lived in the area for the past 10 years (%) | 0.07 | 0.01 | 0.03 | 0.07 | 0.07 | 0.00 | 0.04 | 0.03 | 0.12 | 0.01 | 0.04 | 0.01 | 0.11 |
| Population who have lived in the area for the past 20 years (%) | 0.08 | 0.02 | 0.03 | 0.07 | 0.08 | 0.00 | 0.05 | 0.03 | 0.15 | 0.01 | 0.05 | 0.01 | 0.13 |
| Population who have lived in the area for over 20 years (%) | 0.07 | 0.02 | 0.04 | 0.05 | 0.08 | 0.00 | 0.08 | 0.03 | 0.09 | 0.01 | 0.05 | 0.02 | 0.15 |
| Heading | Inner-City Cluster | Business Center Cluster | Mining Industry Cluster | Dense Cluster | Public Housing Cluster | Non-Residential Cluster | Agriculture Cluster | Sprawl Cluster | High-Rise Residential Cluster | Mountain Cluster | Old New-Town Cluster | Suburban Agriculture Cluster | Rural Cluster |
|---|---|---|---|---|---|---|---|---|---|---|---|---|---|
| Public facilities land (m2) | 39,637 | 18,936 | 24,393 | 65,205 | 32,639 | 40,830 | 32,143 | 33,208 | 41,080 | 17,951 | 23,897 | 19,784 | 34,391 |
| Low-rise residential land (m2) | 32,789 | 13,485 | 35,363 | 28,848 | 19,301 | 3504 | 111,001 | 26,419 | 48,553 | 17,373 | 39,973 | 41,492 | 72,239 |
| High-rise residential land (m2) | 9053 | 1632 | 4380 | 14,971 | 39,734 | 583 | 525 | 3654 | 21,313 | 807 | 4928 | 701 | 6887 |
| Park green land (m2) | 11,649 | 5947 | 9426 | 10,631 | 14,580 | 13,580 | 41,421 | 7421 | 14,513 | 7716 | 7405 | 15,447 | 17,434 |
| Commercial facilities land (m2) | 17,635 | 7810 | 10,736 | 20,405 | 10,950 | 11,914 | 31,938 | 11,282 | 13,067 | 6388 | 7436 | 14571 | 24,132 |
| Dense residential land (m2) | 5531 | 1619 | 5025 | 3073 | 2458 | 265 | 4379 | 4163 | 2633 | 1325 | 3540 | 933 | 11,780 |
| Mountain forest land (m2) | 109,634 | 205,136 | 419,545 | 196,341 | 56,359 | 652,836 | 2,742,099 | 66,609 | 216,845 | 676,535 | 272,460 | 2120,660 | 628,045 |
| Industrial land (m2) | 6192 | 3303 | 7430 | 8553 | 5245 | 18,729 | 34,147 | 7846 | 5047 | 5513 | 3327 | 12,189 | 15,315 |
| Rice field (m2) | 4655 | 3102 | 11,091 | 5342 | 3631 | 10,420 | 248,038 | 5034 | 3573 | 14,977 | 3650 | 107,506 | 46,223 |
| Farm land (m2) | 3541 | 1619 | 7553 | 2688 | 3490 | 3963 | 175,850 | 4020 | 3076 | 9034 | 2929 | 73,126 | 35,252 |
| Vacant land (m2) | 7493 | 3565 | 9145 | 11,319 | 7761 | 7413 | 60,975 | 6932 | 12,634 | 6345 | 9059 | 23,757 | 23,063 |
| developing land (m2) | 275 | 745 | 3244 | 283 | 64 | 5920 | 3203 | 1890 | 355 | 1699 | 2028 | 5318 | 2704 |
References
- Kato, H.; Kanki, K. Development of walkability indicator for visualising smart shrinking—A case study of sprawl areas in North Osaka Metropolitan Region. Int. Rev. Spat. Plan. Sustain. Dev. 2020, 8, 39–58. [Google Scholar] [CrossRef] [Green Version]
- Cerin, E.; Saelens, B.E.; Sallis, J.F.; Frank, L.D. Neighborhood environment walkability scale: Validity and development of a short form. Med. Sci. Sports Exerc. 2006, 38, 1682–1691. [Google Scholar] [CrossRef] [Green Version]
- Inoue, S.; Murase, N.; Shimomitsu, T.; Ohya, Y.; Odagiri, Y.; Takamiya, T.; Ishii, K.; Katsumura, T.; Sallis, J.F. Association of physical activity and neighborhood environment among Japanese adults. Prev. Med. 2009, 48, 321–325. [Google Scholar] [CrossRef]
- Kato, H. Effect of Walkability on Urban Sustainability in the Osaka Metropolitan Fringe Area. Sustainability 2020, 12, 9248. [Google Scholar] [CrossRef]
- Leung, N.H.L.; Chu, D.K.W.; Shiu, E.Y.C.; Chan, K.H.; McDevitt, J.J.; Hau, B.J.P.; Yen, H.L.; Li, Y.G.; Ip, D.K.M.; Peiris, J.S.M.; et al. Respiratory virus shedding in exhaled breath and efficacy of face masks. Nat. Med. 2020, 26, 676–680. [Google Scholar] [CrossRef] [PubMed] [Green Version]
- Iacus, S.M.; Santamaria, C.; Sermi, F.; Spyratos, S.; Tarchi, D.; Vespe, M. Human mobility and COVID-19 initial dynamics. Nonlinear Dyn. 2020, 101, 1901–1919. [Google Scholar] [CrossRef] [PubMed]
- Muto, K.; Yamamoto, I.; Nagasu, M.; Tanaka, M.; Wada, K. Japanese citizens’ behavioral changes and preparedness against COVID-19: An online survey during the early phase of the pandemic. PLoS ONE 2020, 15, e0234292. [Google Scholar] [CrossRef]
- Barbieri, D.M.; Lou, B.W.; Passavanti, M.; Hui, C.; Hoff, I.; Lessa, D.A.; Sikka, G.; Chang, K.; Gupta, A.; Fang, K.; et al. Impact of COVID-19 pandemic on mobility in ten countries and associated perceived risk for all transport modes. PLoS ONE 2021, 16, e0245886. [Google Scholar] [CrossRef]
- Hong, J.; McArthur, D.; Raturi, V. Did Safe Cycling Infrastructure Still Matter During a COVID-19 Lockdown? Sustainability 2020, 12, 8672. [Google Scholar] [CrossRef]
- World Health Organization (WHO). Moving around during the COVID-19 Outbreak. Available online: https://who.canto.global/v/coronavirus/s/MFSQ0?viewIndex=1&column=document&id=94covo1rdl4snc0dvh3f7uc956 (accessed on 2 April 2021).
- Prime Minister of Japan and His Cabinet [COVID-19] Declaration of a State of Emergency in Response to the Novel Coronavirus Disease (7 April 2020). Available online: https://japan.kantei.go.jp/ongoingtopics/_00018.html (accessed on 2 April 2021).
- The Japan Times. The Coronavirus and Japan’s Constitution (14 April 2020). Available online: https://www.japantimes.co.jp/opinion/2020/04/14/commentary/japan-commentary/coronavirus-japans-constitution/ (accessed on 9 June 2021).
- Google. COVID-19 Community Mobility Reports. Available online: https://www.google.com/covid19/mobility/ (accessed on 2 April 2021).
- Mizuno Laboratory. COVID-19 Special Site: Visualization of the Percentage of People Who Refrain from Going Out. Available online: http://research.nii.ac.jp/~mizuno/ (accessed on 2 April 2021). (In Japanese).
- European Parliament. National COVID-19 Contact Tracing Apps. Available online: https://www.europarl.europa.eu/RegData/etudes/BRIE/2020/652711/IPOL_BRI(2020)652711_EN.pdf (accessed on 19 December 2020).
- González, M.C.; Hidalgo, C.A.; Barabási, A.L. Understanding individual human mobility patterns. Nature 2008, 453, 779–782. [Google Scholar] [CrossRef]
- Seike, T.; Mimaki, H.; Hara, Y.; Odawara, R.; Nagata, T.; Terada, M. Research on the applicability of “mobile spatial statistics” for enhanced urban planning. J. City Plan. Inst. Jpn. 2011, 46, 451–456. (In Japanese) [Google Scholar] [CrossRef]
- Yamaguchi, H.; Okumura, M.; Kaneda, H.; Habu, K. Damage and recovery process of Kumamoto earthquake in daily staying patterns: Observation by mobile phone GPS data. J. Jpn. Soc. Civ. Eng. Ser. D3 2017, 73, I_105–I_117. (In Japanese) [Google Scholar] [CrossRef]
- Jia, J.S.S.; Lu, X.; Yuan, Y.; Xu, G.; Jia, J.M.; Christakis, N.A. Population flow drives spatio-temporal distribution of COVID-19 in China. Nature 2020, 582, 389–394. [Google Scholar] [CrossRef]
- Badr, H.S.; Du, H.R.; Marshall, M.; Dong, E.S.; Squire, M.M.; Gardner, L.M. Association between mobility patterns and COVID-19 transmission in the USA: A mathematical modelling study. Lancet Infect. Dis. 2020, 20, 1247–1254. [Google Scholar] [CrossRef]
- Yabe, T.; Tsubouchi, K.; Fujiwara, N.; Wada, T.; Sekimoto, Y.; Ukkusuri, S.V. Non-compulsory measures sufficiently reduced human mobility in Tokyo during the COVID-19 epidemic. Sci. Rep. 2020, 10, 18053. [Google Scholar] [CrossRef] [PubMed]
- Oishi, S.; Cha, Y.J.; Schimmack, U. The Social Ecology of COVID-19 Cases and Deaths in New York City: The Role of Walkability, Wealth, and Race. Soc. Psychol. Pers. Sci. 2021, 1–10. [Google Scholar] [CrossRef]
- Doubleday, A.; Choe, Y.; Isaksen, T.B.; Miles, S.; Errett, N.A. How did outdoor biking and walking change during COVID-19?: A case study of three US cities. PLoS ONE 2021, 16, e0245514. [Google Scholar] [CrossRef]
- World Economic Forum. Paris Is Planning to Become a ’15-Minute City’. Available online: https://www.weforum.org/videos/paris-is-planning-to-become-a-15-minute-city-897c12513b (accessed on 2 April 2021).
- Balletto, G.; Ladu, M.; Milesi, A.; Borruso, G. A Methodological Approach on Disused Public Properties in the 15-Minute City Perspective. Sustainability 2021, 13, 593. [Google Scholar] [CrossRef]
- Speck, J. Walkable City Rules: 101 Steps to Making Better Places; Island Press: Washington, DC, USA, 2018. [Google Scholar]
- National Association of City Transportation Officials. Streets for Pandemic Response & Recovery. Available online: https://nacto.org/wp-content/uploads/2020/06/NACTO_Streets-for-Pandemic-Response-and-Recovery_2020-05-26.pdf (accessed on 2 April 2021).
- Ministry of Health, Labour and Welfare (MHLW). Press: Ministry of Health, Labour and Welfare and Agoop Sign Agreement on Provision of Information Conducive to COVID-19 Cluster Response. Available online: https://www.mhlw.go.jp/stf/newpage_11116.html (accessed on 9 June 2021). (In Japanese).
- Kato, H. Development of a Spatio-temporal Analysis Method to Support the Prevention of COVID-19 Infection: Space-Time Kernel Density Estimation Using GPS Location History Data. In Urban Informatics for Future Cities; Geertman, S., Pettit, C., Goodspeed, R., Staffans, A., Eds.; Springer Nature: Cham, Switzerland, 2021; pp. 51–67. ISBN 978-3-030-76058-8. (In Press). [Google Scholar] [CrossRef]
- Agoop Corporation. Homepage. Available online: https://www.agoop.co.jp/en/ (accessed on 2 April 2021).
- LBMA Japan. Guidelines for the Use of Device Location Data. Available online: https://www.lbmajapan.com/guideline (accessed on 2 April 2021). (In Japanese).
- Osaka Prefecture Government. Outline of Emergency Measures of Osaka Prefecture. Available online: http://www.pref.osaka.lg.jp/attach/38687/00000000/0407_(EN)Emergency%20Measures%20of%20Osaka%20Prefecture.pdf (accessed on 9 April 2021).
- Cressie, N. The origins of kriging. Math. Geol. 1990, 22, 239–252. [Google Scholar] [CrossRef]
- Requia, W.J.; Coull, B.A.; Koutrakis, P. Evaluation of predictive capabilities of ordinary geostatistical interpolation, hybrid interpolation, and machine learning methods for estimating PM2.5 constituents over space. Environ. Res. 2019, 175, 421–433. [Google Scholar] [CrossRef]
- Amobi, O.; Akinyemi, A.; Abiye, K.; Obanubi, C.; James, E.; Gado, P.; Odezugo, G.; Ogundehin, D.; Magaji, D.; Russell, M. Using Supervised Machine Learning and Empirical Bayesian Kriging to Reveal Correlates and Patterns of COVID-19 Disease Outbreak in Sub-Saharan Africa: Exploratory Data Analysis (19 April 2020). Available online: https://ssrn.com/abstract=3580721 (accessed on 5 April 2021). [CrossRef]
- Gribov, A.; Krivoruchko, K. New Flexible Non-parametric Data Transformation for Trans-Gaussian Kriging. In Geostatistics Oslo 2012 Quantitative Geology and Geostatistics; Springer: Dordrecht, The Netherlands, 2012; Volume 17, pp. 51–65. [Google Scholar]
- Gribov, A.; Krivoruchko, K. Empirical Bayesian kriging implementation and usage. Sci. Total Environ. 2020, 772, 137290. [Google Scholar] [CrossRef]
- Krivoruchko, K.; Gribov, A. Evaluation of empirical Bayesian kriging. Spat. Stat. 2019, 32, 100368. [Google Scholar] [CrossRef]
- Conservation GIS-Consortium Japan. GIS Data. Available online: http://cgisj.jp/download_type_list.php (accessed on 14 April 2020). (In Japanese).
- E-Stat. Japanese Census Data in 2015. Available online: https://www.e-stat.go.jp/ (accessed on 14 June 2020). (In Japanese).
- Kato, H. How Does the Location of Urban Facilities Affect the Forecasted Population Change in the Osaka Metropolitan Fringe Area? Sustainability 2021, 13, 110. [Google Scholar] [CrossRef]
- Ibaraki City Government. Change of Bus Schedule Due to the Spread of COVID-19 Infection. Available online: https://www.city.ibaraki.osaka.jp/kurashi/machi/doro_kotsu/kokyokotsu/1332902719970.html (accessed on 5 April 2021). (In Japanese).
- au Insurance Company. A Survey on Bicycle Use During the COVID-19 Pandemic. Available online: https://www.au-sonpo.co.jp/corporate/news/detail-248.html (accessed on 5 April 2021). (In Japanese).
- Ibaraki City Government. Bicycle Tour in the Northern Ibaraki City. Available online: https://www.city.ibaraki.osaka.jp/kikou/toshiseibi/hokubuseibi/menu/hokubumiryoku/ibakitameguri/cycling.html (accessed on 5 April 2021). (In Japanese).
- Mobile Marketing Data Labo. Survey on Food Delivery Services on the Internet in 2020. Available online: https://mmdlabo.jp/investigation/detail_1871.html (accessed on 5 April 2021). (In Japanese).
- IBAR EATS. About IBAR EATS. Available online: https://ibar-eats.com/ (accessed on 5 April 2021). (In Japanese).
- Transport for London. Streetspace for London. Available online: https://tfl.gov.uk/travel-information/improvements-and-projects/streetspace-for-london (accessed on 5 April 2021).
- Chapman, R.; Keall, M.; Howden-Chapman, P.; Grams, M.; Witten, K.; Randal, E.; Woodward, A. A Cost Benefit Analysis of an Active Travel Intervention with Health and Carbon Emission Reduction Benefits. Int. J. Environ. Res. Public Health 2018, 15, 962. [Google Scholar] [CrossRef] [PubMed] [Green Version]
- Osaka Prefectural Police. Location of Traffic Accidents in the Southern Part of Ibaraki City [Map of All Traffic Accidents]. Available online: https://www.police.pref.osaka.lg.jp/kotsu/jiko/3/1/10143.html (accessed on 5 April 2021). (In Japanese).
- Zhang, J.; Feng, B.; Wu, Y.; Xu, P.; Ke, R.; Dong, N. The effect of human mobility and control measures on traffic safety during COVID-19 pandemic. PLoS ONE 2021, 16, e0243263. [Google Scholar] [CrossRef]
- Portland Plan. 20-Minute Neighborhoods. Available online: https://www.portlandonline.com/portlandplan/index.cfm?a=288098&c=52256 (accessed on 5 April 2021).
- Japanese MILT (Ministry of Land, Infrastructure, Transport and Tourism). National Land Information Download Service. Available online: http://nlftp.mlit.go.jp/ksj/index.html (accessed on 14 March 2020).
- Geospatial Information Authority of Japan. The Numerical Map 5000 in Japan (in Osaka Metropolitan Area). Available online: https://www.gsi.go.jp/kankyochiri/lum-5k.html (accessed on 1 April 2020). (In Japanese).


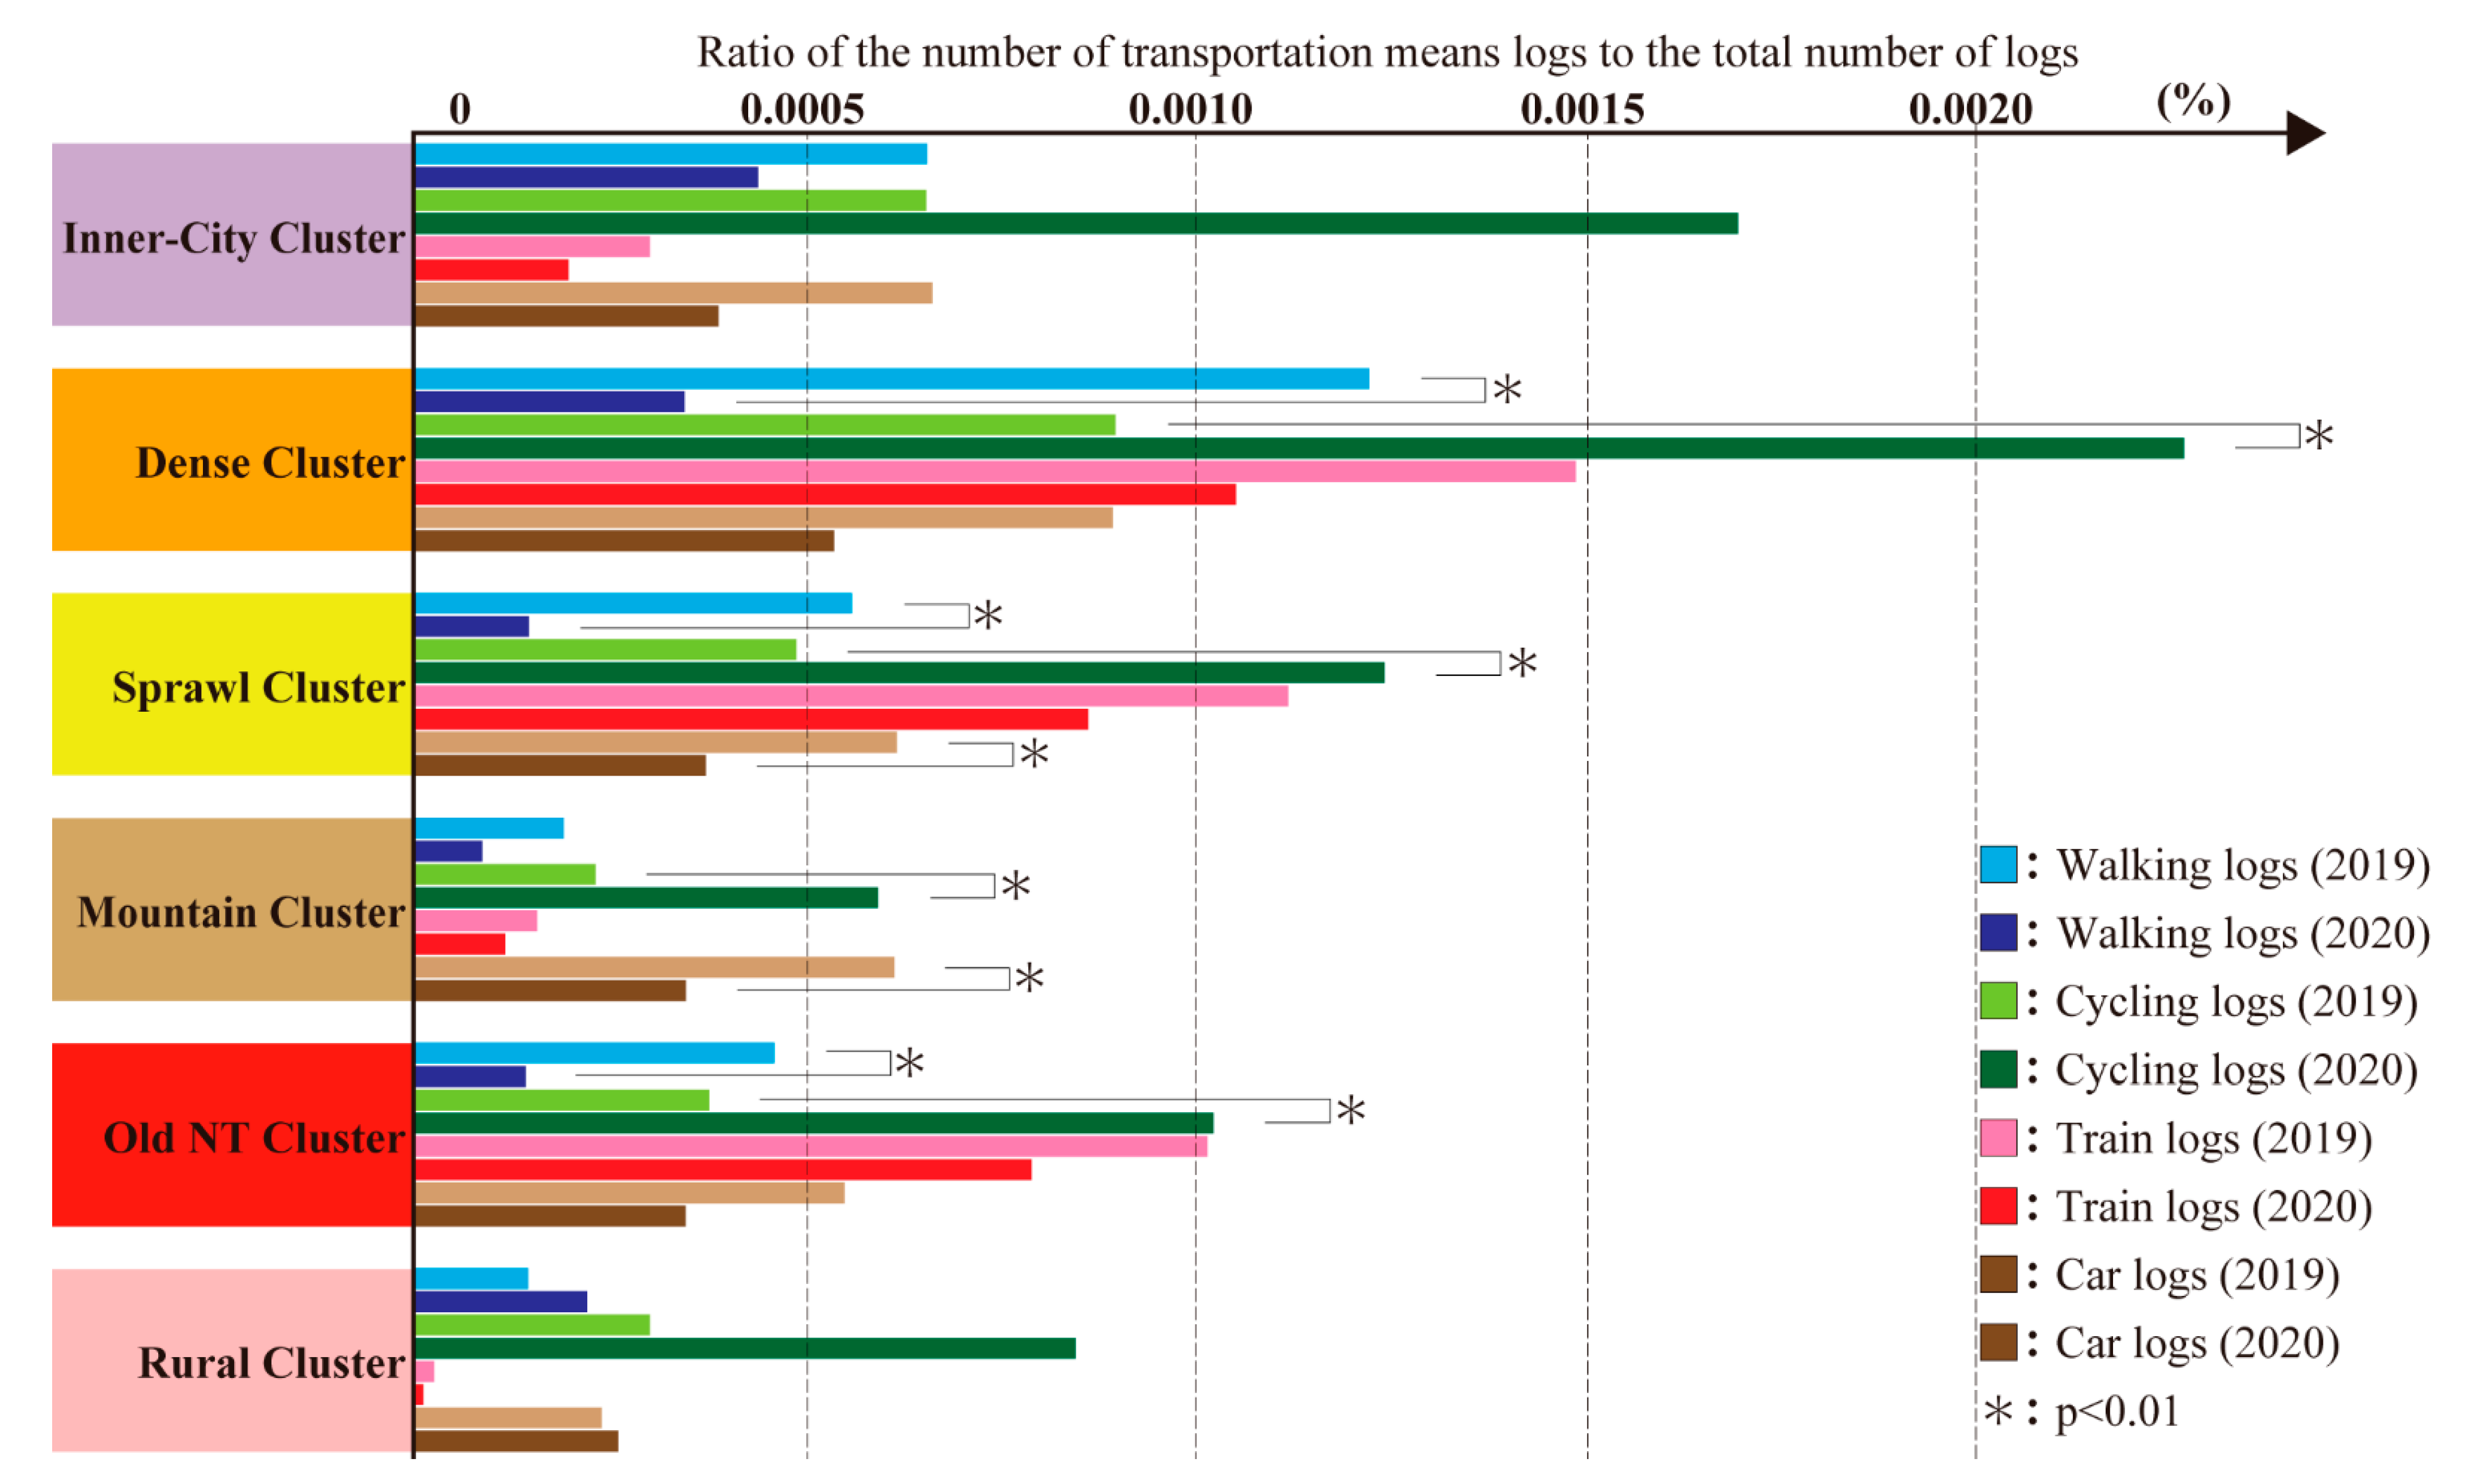
| Cluster | Speed Change (Figure 7) | Streets (Figure 8) | Transportation Means (Figure 9) |
|---|---|---|---|
| Inner-city cluster | Decreased | Narrow streets (decrease in speed) Neighborhood streets (decrease in speed) Main neighborhood streets (decrease in speed) | |
| Dense cluster | Increased | Narrow streets (increase in speed) Neighborhood streets (increase in speed) | Walking (decrease in logs) Cycling (increase in logs) |
| Sprawl cluster | Increased | Narrow streets (increase in speed) Neighborhood streets (increase in speed) Main neighborhood streets (increase in speed) | Walking (decrease in logs) Cycling (increase in logs) Car (decrease in logs) |
| Mountain cluster | Increased | Narrow streets (increase in speed) Neighborhood streets (increase in speed) Main neighborhood streets (increase in speed) | Cycling (increase in logs) Car (decrease in logs) |
| Old NT cluster | Increased | Narrow streets (increase in speed) Neighborhood streets (increase in speed) Main neighborhood streets (increase in speed) | Walking (decrease in logs) Cycling (increase in logs) |
| Rural cluster | Decreased | Narrow streets (decrease in speed) |
Publisher’s Note: MDPI stays neutral with regard to jurisdictional claims in published maps and institutional affiliations. |
© 2021 by the authors. Licensee MDPI, Basel, Switzerland. This article is an open access article distributed under the terms and conditions of the Creative Commons Attribution (CC BY) license (https://creativecommons.org/licenses/by/4.0/).
Share and Cite
Kato, H.; Matsushita, D. Changes in Walkable Streets during the COVID-19 Pandemic in a Suburban City in the Osaka Metropolitan Area. Sustainability 2021, 13, 7442. https://doi.org/10.3390/su13137442
Kato H, Matsushita D. Changes in Walkable Streets during the COVID-19 Pandemic in a Suburban City in the Osaka Metropolitan Area. Sustainability. 2021; 13(13):7442. https://doi.org/10.3390/su13137442
Chicago/Turabian StyleKato, Haruka, and Daisuke Matsushita. 2021. "Changes in Walkable Streets during the COVID-19 Pandemic in a Suburban City in the Osaka Metropolitan Area" Sustainability 13, no. 13: 7442. https://doi.org/10.3390/su13137442
APA StyleKato, H., & Matsushita, D. (2021). Changes in Walkable Streets during the COVID-19 Pandemic in a Suburban City in the Osaka Metropolitan Area. Sustainability, 13(13), 7442. https://doi.org/10.3390/su13137442