1. Introduction
Plastic waste is ubiquitous around the world, with its myriad types and forms being found in freshwater systems, the oceans, the soil, and even floating in the air [
1,
2,
3,
4,
5,
6,
7]. As of 2018, the US alone produced over 37 million tons of plastic waste, while recycling only 8.7% of that waste [
8]. Plastics in the environment eventually break down into smaller and smaller pieces through processes of physical degradation, mechanical abrasion, and photo-degradation, but plastic can persist in these progressively smaller pieces for thousands of years [
9,
10,
11,
12]. The smallest of these pieces comprise a category of plastics known as microplastics—pieces, particles, and fibers less than 5 mm in size [
7,
13,
14,
15,
16]. Due to their small size, microplastics disperse through water bodies, the soil, and, in the case of microfibers, throughout the air in enormous quantities [
5,
7,
13,
17,
18]. Once released into the environment, plastics negatively affect organisms throughout aquatic [
7,
13,
16,
19,
20,
21,
22,
23] and terrestrial [
2,
13,
19,
20,
22,
23,
24,
25,
26] ecosystems.
Single use water bottles are one of the largest sources of plastic use globally [
27], and their presence in the waste stream is increasing as only 27.9% of all beverage bottles made of polyethylene terephthalate, including water bottles, were recycled in 2019 [
28]. Bottled water first overtook carbonated soft drinks as the top beverage consumed in the US in 2016, and the volume of consumption has continued to grow, with 13.8 billion gallons of water being bottled and consumed in the US by 2018 [
29]. Consumers choose to purchase single-use plastic water bottles rather than relying on tap water due to health and safety concerns, as well as taste and odor preferences, to name the most common reasons [
30,
31,
32,
33,
34,
35,
36,
37,
38,
39,
40,
41]. In a study of Dutch college students, van der Linden [
31] found that students used single-use water bottles due to barriers, or even the perception of barriers, on campuses that make it difficult to utilize reusable bottles. Princeton University found that providing their students with free reusable water bottles decreased the likelihood that students would purchase single-use water bottles and increased support among students for a campus ban on single-use water bottles [
42]. In recent years, colleges and universities across the United States have been increasing the number of water bottle refill stations on their campuses in an effort to shrink the usage of disposable water bottles. After installing fifty water bottle refill stations across campus, Duke University reduced the number of single-use water bottles entering campus waste and recycling streams by approximately 400,000 in 2014 [
43].
The connection between convenience and disposable water bottle usage affects the behaviors of the public at large, not just students on college campuses. Researchers in Australia examined the impact of newly installed water bottle refill stations near litter “hotspots” along the Brisbane River in Queensland, finding that plastic bottle litter in the area downstream of the refill station locations decreased after their installations [
44]. However, Willis et al. [
44] indicate that the positive impact of the refill stations was negated by the relatively long distance that people had to walk in order to refill a bottle at a station. These findings highlight both the effectiveness of providing safe reusable bottle refill options, while at the same time demonstrating the importance of placement and accessibility to maximize the convenience of water refill stations.
Allegheny College is a small liberal arts college located in Meadville, Pennsylvania with a student population of nearly 1700 in 2019. During the study period, the four largest majors at the college were Environmental Science, Biology, Psychology, and Economics. As part of a multifaceted, multi-year effort to improve campus sustainability, Allegheny College has undertaken initiatives aimed at reducing the consumption of water from single-use bottles on its campus since 2015. In 2014, Choate et al. [
45] conducted a survey of Allegheny College students to identify effective ways to encourage students to reduce their disposable bottled water consumption on campus. Findings from that effort revealed that the Allegheny students purchase the majority of disposable water bottles off campus, indicating that a ban on the sale of disposable plastic water bottles on campus would not effectively reduce disposable water bottle consumption [
45]. The study also found that there was a significant difference in disposable water bottle consumption based on student class year, with first year students consuming greater amounts of bottled water than fourth year students [
45]. In response to those survey findings, the college added water bottle refill stations to 28 water fountains across campus, provided every first-year student with a free reusable water bottle, and educated students on the benefits of reusable water bottles through pamphlets and posters in an effort to reduce the disposable bottled water consumption of the campus [
45]. While the college does continue to sell bottled water on campus in the dining halls and via a small number of vending machines across campus, the amount of bottled water purchased on campus—as seen in 2014—remains exceptionally low. Nearly all of the bottled water used by students continues to be purchased in bulk from off-campus retailers, which is a more cost-friendly option than the higher priced single bottles sold on campus.
Studies have shown that undergraduate students are more likely to consume disposable bottled water than staff and faculty on college campuses [
33,
46,
47]. Determining the type of approaches that are successful in reducing disposable water bottle usage among college students can substantially reduce the amount of plastic waste generated by college communities. As college and university campuses can house thousands of students, such reductions can help to reduce single use plastics in the overall waste streams of communities around the world. The current study investigates the effect of the post-2014 measures that Allegheny College instituted to reduce the use of disposable water bottles on its campus by examining the perspectives and behaviors of students after the full introduction of those measures.
2. Materials and Methods
We conducted two online surveys of students attending Allegheny College in 2018 and 2019 with the aim of determining the habits of students regarding the use of both disposable and reusable water bottles. These surveys were a follow-up to an original survey of Allegheny students in 2014, which was conducted prior to the implementation of several initiatives focused on reducing disposable water bottle use on campus [
45]. As such, the two surveys in this study were designed to assess whether the initiatives begun in 2014 have resulted in reductions in disposable water bottle use among students following their full implementation. The 2018 survey development process utilized a group of 16 Allegheny College students serving as a preliminary focus group [
48] tasked with discussing their comprehension of the issues associated with this project and their experiences with regard to bottled water and other drinking water options at the college. Pre-existing survey questions carried over from 2014 were discussed during this process, and were edited as a result of focus group feedback. Additionally, new survey questions not contained in the 2014 survey were generated as a result of focus group feedback in 2018. The focus group process was not utilized in the development of the 2019 survey, as it was created specifically to both update crucial information from 2018 through the use of the same questions, and to capture a small amount of additional information that was not obtained via the 2018 questionnaire. Both the 2018 and 2019 surveys were pilot tested [
48] among approximately 40 randomly chosen Allegheny College students, and the feedback gained from the follow-up discussions with pilot testers was used to refine and clarify the questions contained in each survey before each was administered to the student body as a whole.
Consisting of 31 questions, the first survey questionnaire was administered between 16 October–13 November 2018 and asked students about their habits regarding disposable and reusable water bottle usage, opinions on water quality and safety, and on drinking habits with regard to bottled beverages. Crucial questions from the 2018 survey are highlighted in the results section below. The second survey questionnaire, administered between 17 October–20 November 2019, consisted of 22 questions and was similarly designed and was used to supplement the 2018 survey by including additional questions designed to gauge student awareness of sustainability measures enacted on the Allegheny College campus, and the perspectives that students had of those measures. Crucial questions from the 2019 survey are highlighted in the results section below.
Both surveys were created and housed online using Google Forms, and were distributed electronically using a convenience sampling approach designed to maximize response numbers from students throughout the college in a fashion that approximated full representation. The primary method of survey distribution and data collection occurred via tabling at locations around campus, which were selected to strategically both capture high traffic areas, such as the college campus center during different meal times, as well as academic buildings on campus that house different departments within the college. During tabling, members of the research team provided laptops through which potential respondents could access the survey. Links to the surveys were also posted to a college-wide daily email that goes to all students enrolled at the college, and the same link was posted to multiple student group social media pages, residence hall email lists, and sports teams email lists. Instructors of multiple courses at the college distributed the link to students in their classes. Participation in both surveys was incentivized by offering the chance to enter a raffle to win a $25 Visa gift card.
Data Analysis
For all questions, the percentage of individuals selecting each response was calculated. For questions that allowed respondents to select more than one answer, multiple answers per individual were tallied as separate responses and recorded. A linear regression was conducted to analyze the percentage of respondents from each class year who selected bottled water as their main source of drinking water. Chi-squared analyses were conducted to determine if there was an association between class year and the number of individuals who drink bottled water, between the setting in which the student grew up and water type preference, and between student’s region of origin and water type preference. A t-test was used to determine if there was significant variation between males and females, and the amount of bottled water consumed per week.
3. Results
Thirty-one percent of the Allegheny College student body completed the 2018 survey, while twenty-three percent completed the survey in 2019.
Table 1 shows the detailed summary of student demographics on campus, as well as respondents to the survey. In both years, there were more females than males on campus and this is reflected in the fact that a greater percentage of females than males took the survey both years. The percentage of respondents by class year is similar to the percentage of each year on campus, and the percentage of respondents by major is reflective of the overall percentage of the four largest majors on campus for both 2018 and 2019 (
Table 1).
In 2014 and 2018 surveys, students were asked “What is the approximate number of bottles of water you buy per month?” The majority of students during both years selected between 0–10 bottles. In 2014, 37% of students selected 0 bottles and 34% of students selected 1–10 bottles. In 2018, the categories for selection were broken down to gather additional data. Twenty-four percent of students identified that they purchase 0 bottles of water per month. When the 1–10 bottles per month category was divided into 1–3 bottles and 4–10 bottles, 31% identified that they purchase 1–3 bottles per month, and 23% 4–10 bottles. In the 2019 survey students were asked to provide a numerical value when asked, “Approximately how many disposable bottles of water do you consume per week?”. The average number of bottles consumed by all surveyed students was 1.5 (± 0.17). Males stated that they consume more bottles of water per week than females (Males = 2.0 ± 0.29; Females = 1.3 ± 0.22). The variation was not statistically significant.
In the 2018 survey students were asked to provide information on a number of demographic characteristics. There was no statistically significant relationship between the region of the US where students grew up and type of water preference (Pearson Chi-Square = 23.25, df = 18, p = 0.18). International students represented a minute portion of the survey responses and the data obtained from those few students was not analyzed. Students were also asked in 2018 to characterize the setting in which they grew up as being either urban, suburban, small town, or rural, but no statistically significant relationship was found between setting and type of water preference (Pearson Chi-Square = 16.87, df = 14, p = 0.26). The non-response rate regarding the income demographic was too high to allow for statistical analysis on the relationship between income and water preferences or behaviors.
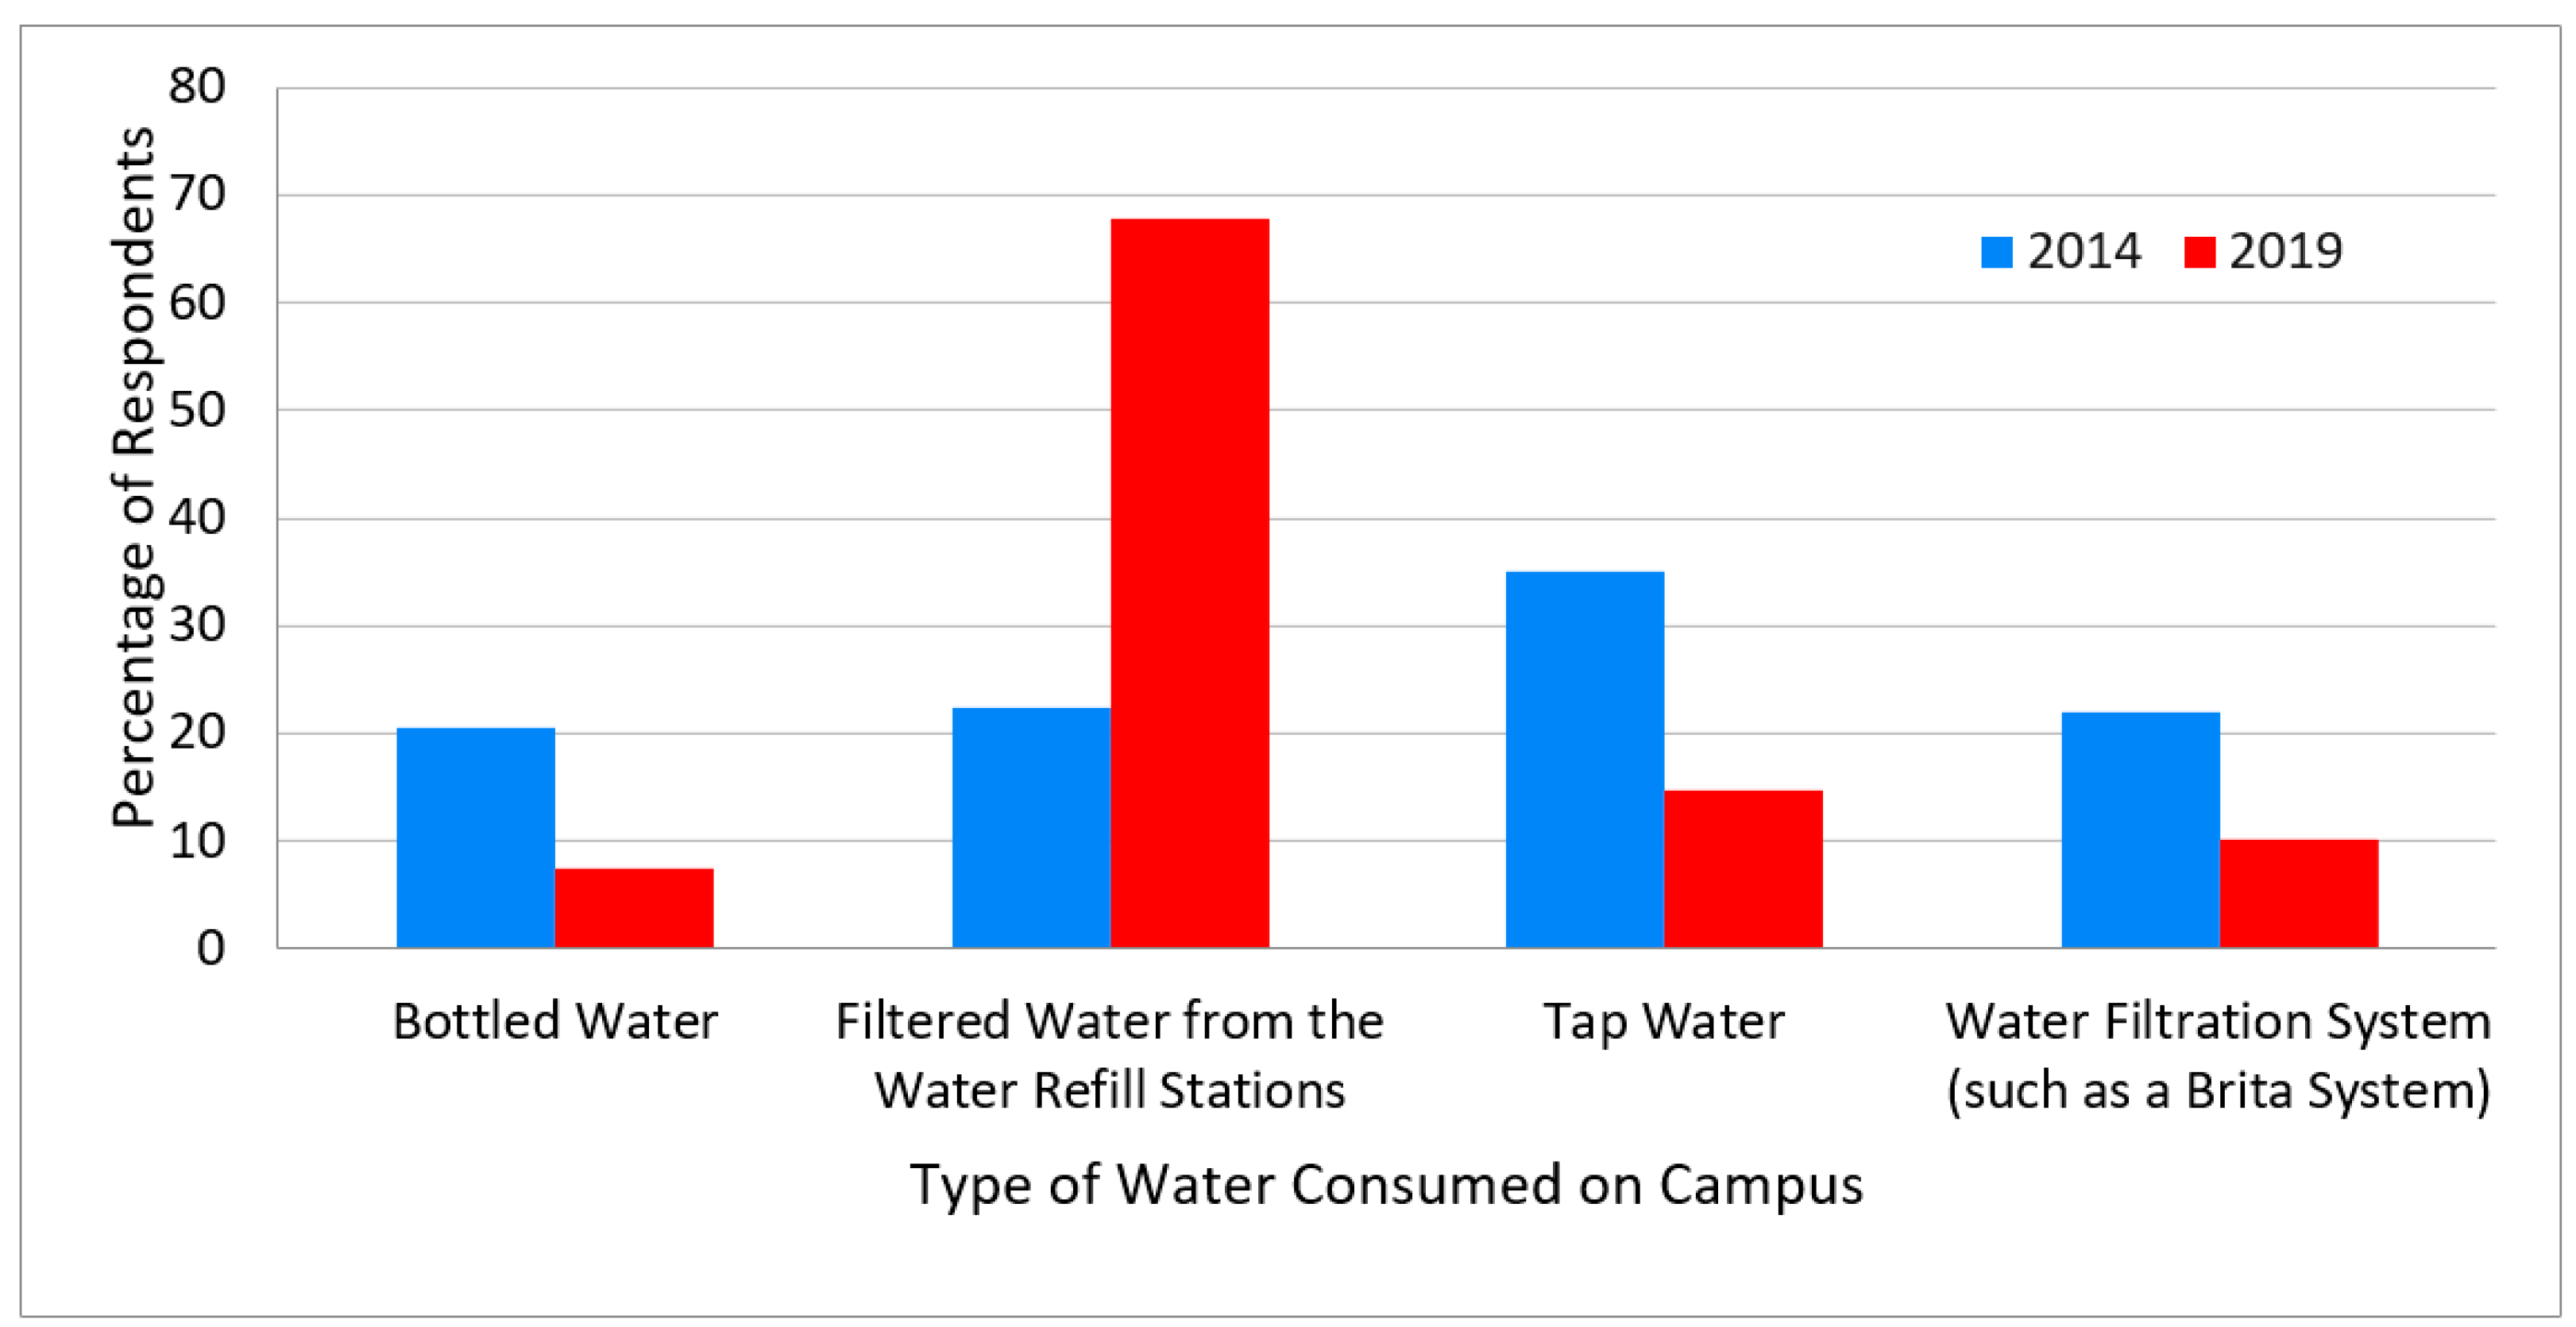
Most Allegheny College students have four primary options for drinking water on campus: bottled water, unfiltered tap water, filtered water from bottle refill stations, and a personal filtration system such as a Brita filter.
Figure 1 compares the drinking water choices that students were making in 2014 before the campus-wide initiative to reduce bottled water use and 2019 after those initiatives had been in place for a full cohort of the college’s student body. Students reporting that they primarily drink bottled water on campus declined from 21% in 2014 to 7.5% in 2019. Unfiltered tap water use among students also declined substantially during this period, as did the use of personal filtration systems. The number of students stating that they mostly drink water from bottle refill stations increased from 22% in 2014 to 68% in 2019. This increase coincides with an increase in bottle refill stations from 2 in 2014 to more than 2 dozen in 2019. Tap water consumption also decreased from 35% of respondents in 2014 to 15% in 2019. Finally, the number of students using in-room water filtration systems, such as a Brita pitcher, decreased over the 5-year period from 22% in 2014 to 10% in 2019 (
Figure 1).
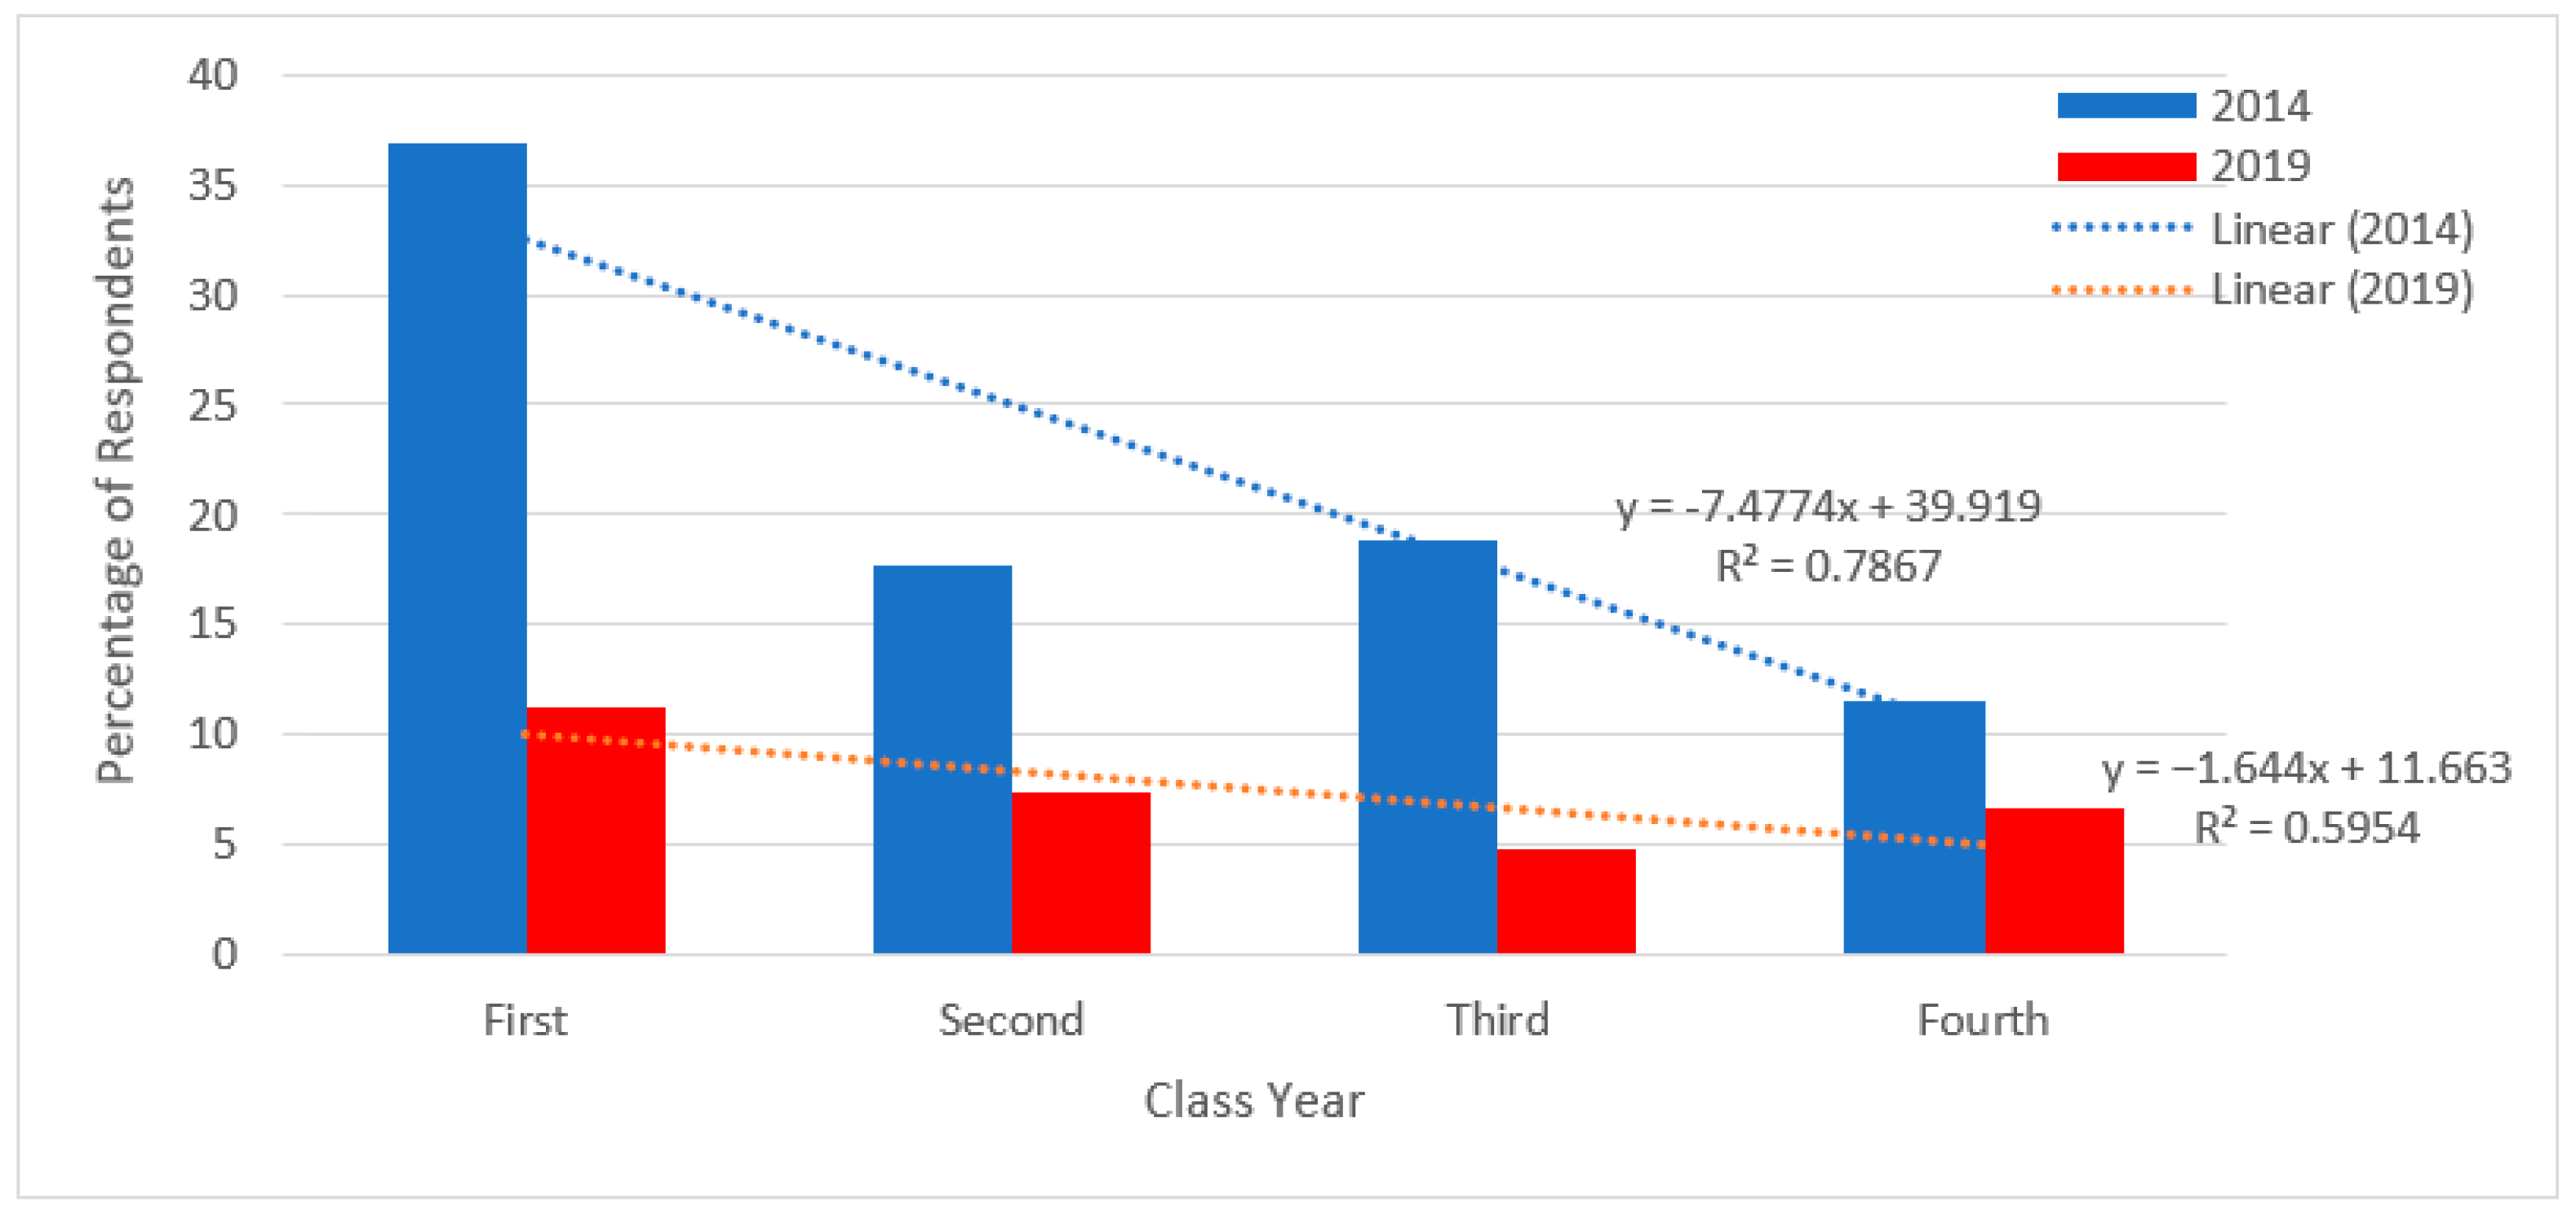
Figure 2 presents a comparison between student class year for both 2014 and 2019 regarding the proportion of students who identified bottled water as their primary source of drinking water on campus. In 2014, first year students consumed significantly more bottled water than fourth year students (Pearson Chi-Square = 31.2, df = 3,
p < 0.0001), with over 35% of first year students responding that they mainly drink bottled water while on campus. In 2019, just over 10% of first year students stated bottled water is their main source of drinking water. A test of independence indicated that consumption of bottled water was not related to class year in 2019 (Pearson Chi-Square = 2.931, df = 3,
p = 0.40). Linear regressions for both 2014 and 2019 reveal a negative trend in the consumption of bottled water as students progress from their first year to their final year (
Figure 2).
Students were asked to indicate the main reasons that led them to choose bottled water over the other drinking water options available (
Table 2). In 2014, 2018, and 2019, convenience (2014: 31%, 2018: 28%; 2019: 40%) and taste (2014: 14%, 2018: 20%; 2019: 24%) were selected most frequently as a reason that students consumed bottled water. When survey respondents were asked “What would make it easier for you to use a reusable bottle or container?” students revealed that the lack of water refill stations in and near dorm buildings was a substantial obstacle. One student noted that the college needs “Water bottle fillers at all water fountains! The water fountain in my hall has no pressure and I can not [sic] fill my water bottle all the way.” Another noted that it would be easier “If there were more of the water stations around campus (specifically in Dorms).” A less frequent, but strongly emphasized, response to the same question centered on the difficulties with cleaning a reusable bottle on campus. One student stated that it would be easier for them to use a reusable bottle if they owned “a cleaning tool to make cleaning my water bottles easier.” Another student similarly indicated that using a reusable bottle would be easier “if they were easier to clean.”
Open responses to the question “Under what circumstances do you use disposable bottled water?” similarly reveal a convenience issue related to the lack of drinking water options in dormitories. In response to this question, one respondent indicated that they used single-use bottled water “When I am in my room and I am not close to a water refill station, I have bottled water in my room.” Another student definitively spoke to this issue by noting that “I will only purchase if I cannot find a water refill station. If there is one, then I will choose not to buy [a] water bottle”. Again, barriers to cleaning reusable bottles were generally highlighted by multiple students as a primary reason for using disposable bottled water. One student indicated that “I use disposable water bottles anytime I am drinking water. I own reusable water bottles, but do not like that they become gross and uncleanly [sic]”.
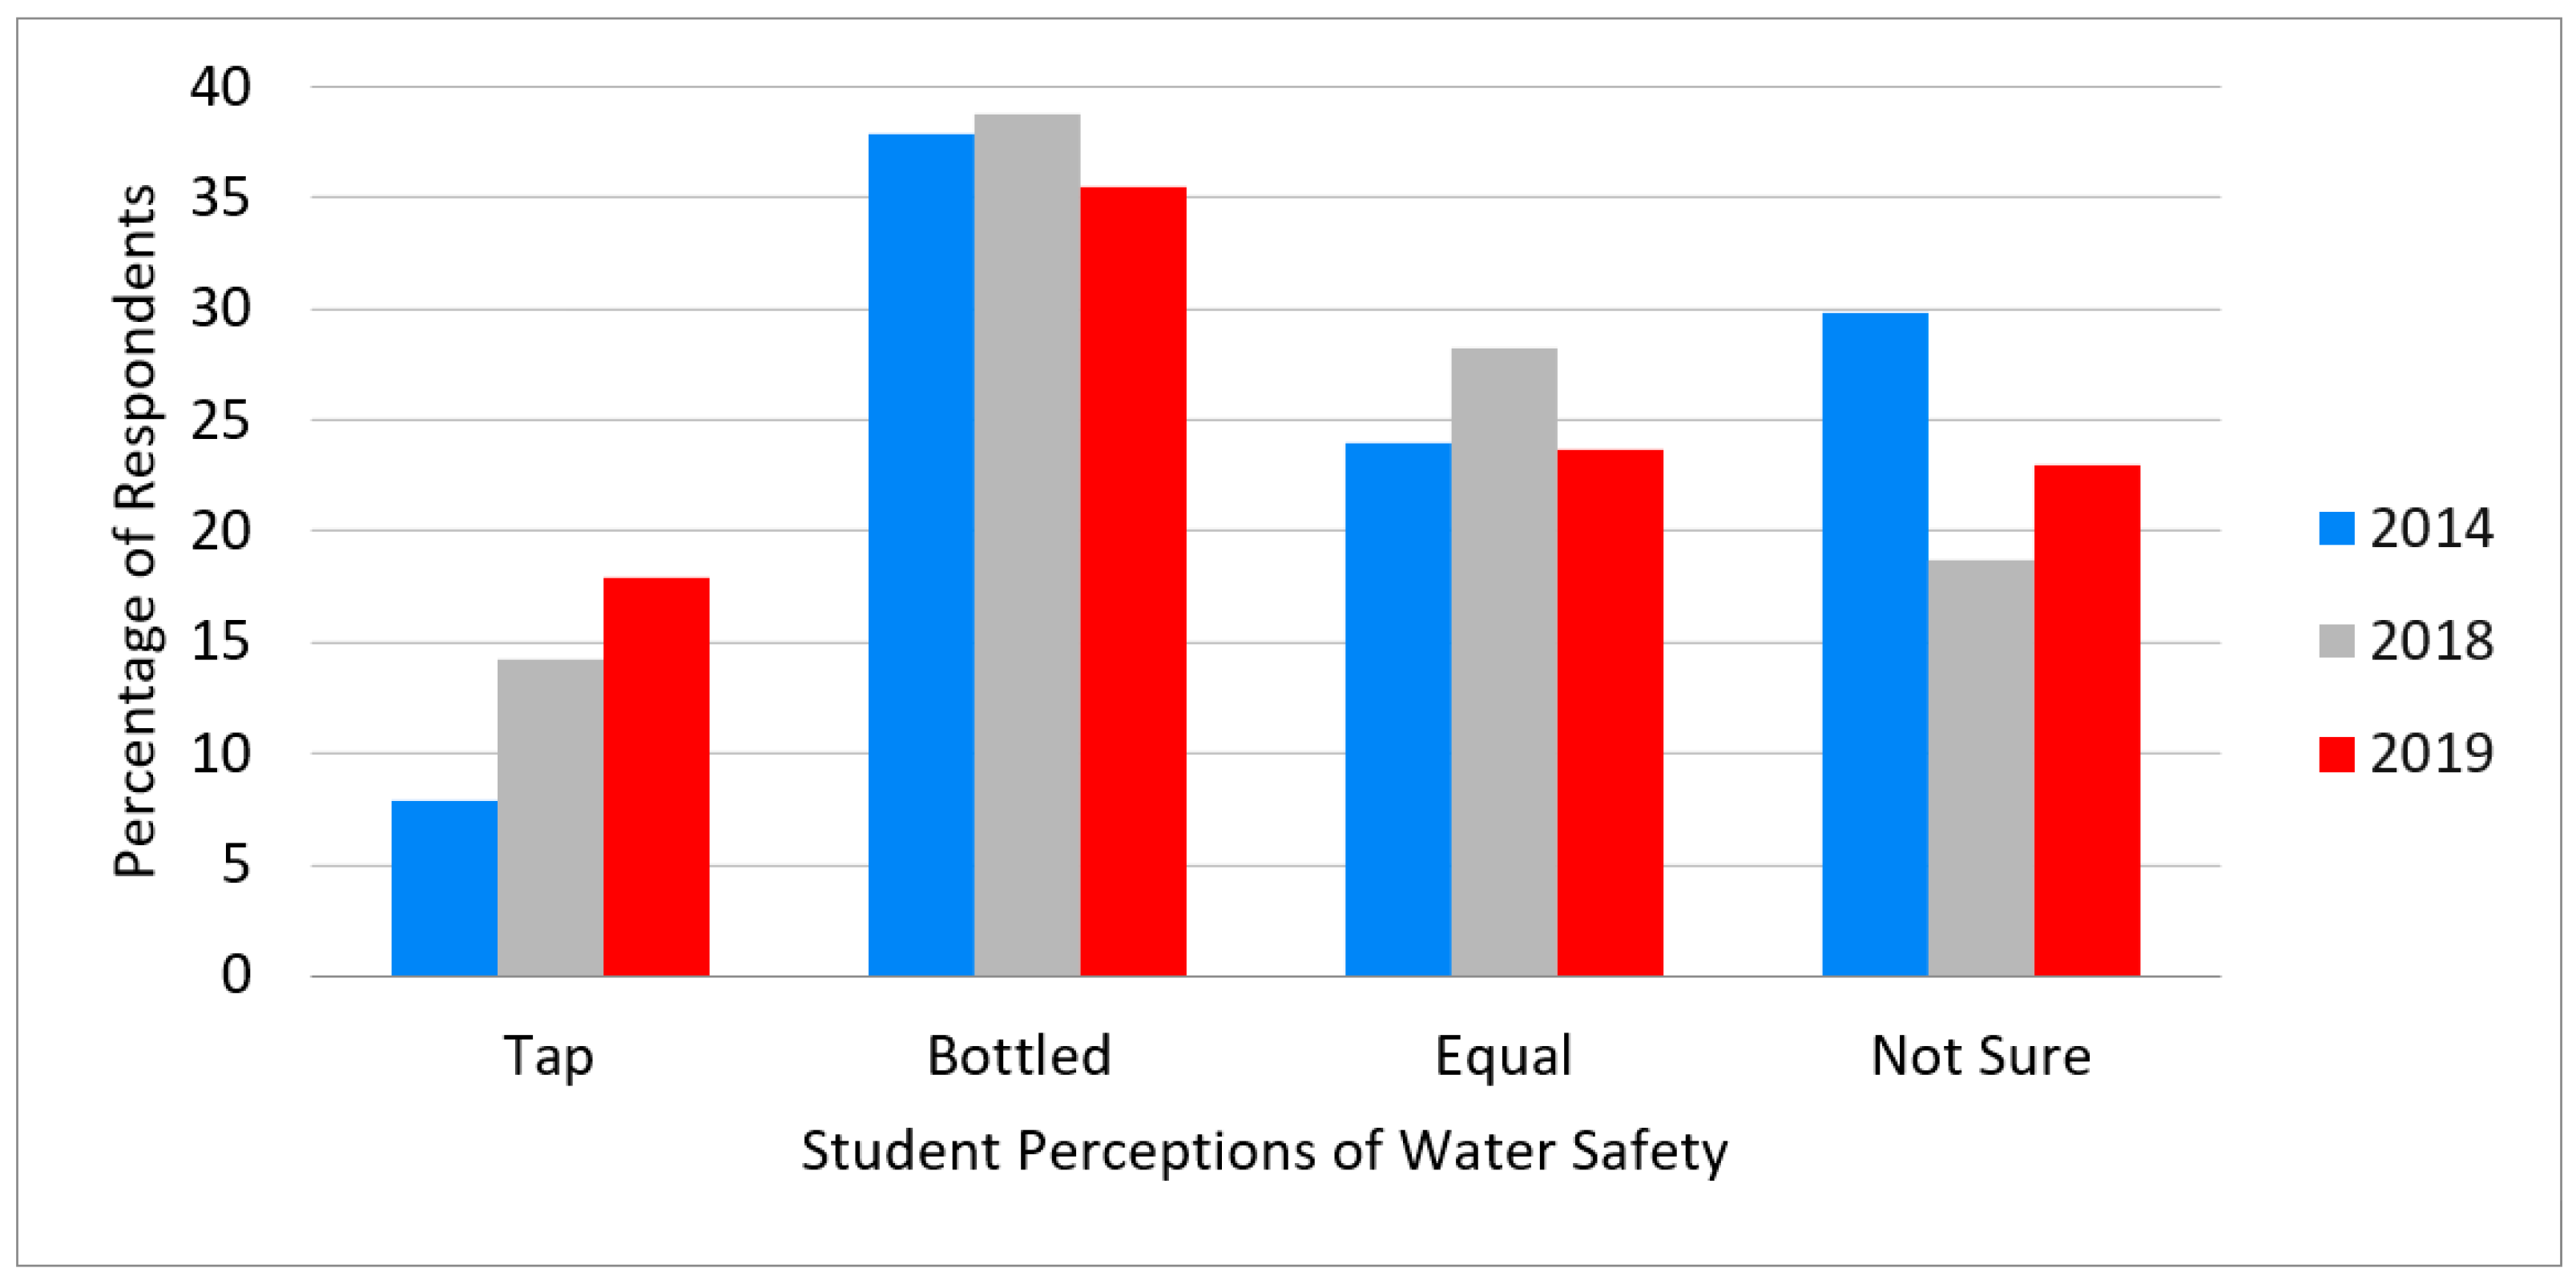
In all three survey years, students were asked, “Which is safer to drink: Meadville tap water or bottled water?”
Figure 3 shows that a greater proportion of students believed that tap water was safest in 2018 (14%) and 2019 (18%), than in 2014 (8%). However, bottled water was overwhelmingly the top choice of the greatest proportion of students in all three years (2014: 38%, 2018: 39%, 2019: 36%), indicating that very little change with regard to perspectives on safety has taken place in the aftermath of the college initiatives.
The original survey, as well as the 2018 and 2019 surveys contained differing questions aimed at learning more about student ownership of a reusable bottle. The 2014 study [
34] asked students “Do you own and regularly use a water bottle?”. Of respondents, 78.6% indicated that they both owned a bottle and used it regularly, while 21.4% indicated that they did not. In 2018, when survey respondents were asked “Do you own a reusable water bottle?”, 92.7% of students answered “Yes” and 7.3% answered “No”. In order to determine whether the reusable water bottles owned by respondents in 2018 were largely representative of the college’s free water bottle program, or whether students were coming to college with a previously purchased reusable water bottle, the 2019 survey asked “Did you bring a reusable water bottle to college?”. Of survey respondents, 94.4% in 2019 stated that they did bring a reusable bottle with them when first coming to college, with only 5.6% of those surveyed indicating that they did not already have a reusable bottle when they entered college. In both 2018 and 2019, the majority of students indicated that they do not use the reusable water bottle given to them by the college (
Table 3).
4. Discussion
This study sought to assess the impacts of sustainability initiatives targeting the reduction of single use plastic water bottles among students at Allegheny College (AC). Precise tonnage of disposable water bottle waste reduction—including the associated cash savings and the embodied energy, water, and emissions—were not calculated, as Allegheny College does not track either solid waste or recyclables by type. Additionally, the student population at Allegheny College has declined during the study period, furthering the difficulty of the calculations needed to determine precise plastic waste reduction since 2015. As such, assessing the self-reported behaviors of students with regard to disposable water bottle use on campus is crucial to understanding whether actions taken by the college in recent years have made a positive impact. The results of the survey conducted for this study indicate that elements of the initiatives put in place at AC to reduce disposable water bottle usage on its campus have been effective. Disposable bottled water usage among Allegheny students declined substantially among all class years between 2014 and 2019 in the aftermath of three sustainability initiatives: the installation of additional filtered water refill stations across campus, the institution of a free water bottle give away initiative that targeted incoming first year students, and the outreach of an education campaign aimed at providing information about the safety of Meadville, PA tap water, and the negative implications of disposable water bottles. During that same time period the use of water refill stations increased by 46% among all students. This supports van der Linden’s [
31] study of Dutch college campuses, where it was found that removing barriers to the convenient use of reusable water bottles is correlated with the reduction of disposable water bottles on college campuses. AC students revealed a strong desire to see additional water bottle refill stations installed across campus, with a particular emphasis on refill stations being placed in and near the dormitories where most students at AC reside. Survey respondents frequently noted that not having easy access to a water bottle refill station while in their dorms was a primary reason for why they chose to purchase bottled water. Having bottled water in their dorm rooms is a much more convenient option for many students when compared to walking some distance across campus to a water bottle refill station, and students will likely continue to purchase bottled water until additional water bottle refill stations are added to campus in locations that are easier for students to access when they need drinking water. The installation of more water bottle refill stations across campus in 2015 led to a decline in disposable water bottle use by students and a substantial increase in the number of students regularly utilizing the refill stations. This strongly indicates that more refill stations located in more convenient locations across the AC campus would reduce the number of disposable water bottles used by students even further.
Unlike the results of the Princeton University study conducted by Santos and van der Linden [
41], our findings indicate that providing college students with a free reusable water bottle was not an effective method of increasing the use of reusable water bottles at AC. Santos and van der Linden [
42] found that the free water bottle program at Princeton established an institutional “norm-signaling” focused on making reusable water bottle usage the norm on campus by showing students that using the bottles was desired behavior. However, that program began in 2009 at a time when owning a reusable water bottle may have been less common among college students than it would become in the years that followed, and thus the free bottle may have been a more desired and used item at that time. Students surveyed at Allegheny College in 2019 overwhelmingly revealed that they already owned at least one reusable water bottle when arriving on campus (94.4%), and only a small minority of students in both 2018 and 2019 indicated that they were regularly using the free water bottle given to them by the college. Many students noted that they preferred the aesthetics, functionality, or both features of the bottles they already owned when compared to the free bottle given to them by the college. This suggests that the resources used to purchase and distribute the free water bottles to incoming students at AC could be better used to fund the installation of additional water bottle refill stations on campus, particularly in and around student dormitories, or for other measures to improve the convenience-related elements of reusable bottle use on campus.
Our findings also reveal that barriers to reusable water bottle use remain in place on the AC campus. These barriers are likely keeping students from more often making the choice to use reusable water bottles instead of choosing disposable water bottles, even when options for doing so conveniently exist. Perceptions of the safety of tap water in Meadville, PA have improved among students since 2014, which indicates some success associated with the campus education campaign begun in 2015 to highlight tap water quality in Meadville. The addition of water bottle filtration stations to water fountains across campus beginning in 2015 also likely acted to boost the confidence of students in the tap water that they are able to drink on campus. However, as of 2019 only 18% of students believed that tap water on campus was a safer option for drinking water when compared to disposable bottled water. At the same time, only a relatively small minority of students in all three survey years indicated that safety concerns were directly responsible for their decision to primarily drink bottled water on campus, though the number climbs to roughly one-third of students in each year when accounting for those who indicated “taste” as a primary reason for choosing bottled water instead of tap water. It has been shown that perceptions of tap water safety are instrumental in the decision of whether to forego tap water in favor of bottled water, and people often link safety concerns with water that they perceive as having a bad or odd taste [
30,
31,
32,
33,
34,
35,
36,
37,
38,
39,
40,
41,
49]. A small, but emphatic, number of students revealed that they do not like the taste of the tap water on the AC campus. This may be an opinion shared by larger numbers of students who did not feel strongly enough about the issue to comment, but who nevertheless equate a taste that they do not like with at least some concerns about tap water safety. This would help explain why such a relatively small number of students surveyed believed that the campus tap water was safer than bottled water. Saylor et al. [
47] found that the drinking water behavior of students at Purdue University was heavily influenced by perceptions of both the safety and taste of water, and that taste is often seen as a primary indicator of water quality. Comparable results were found when students at a major university in West Virginia were surveyed to assess perceptions of water quality and the use of disposable bottled water [
50]. Similarly, a study of students at the University of South Florida found that concerns about water quality were important in shaping student behaviors regarding bottled water, particularly among females and racial and ethnic minority groups [
33]. These findings could indicate a shift in perceptions about tap water safety in the aftermath of the drinking water catastrophe in Flint, Michigan beginning in 2014. Rosinger and Young [
51] examined perceptions on tap water safety among both children and adults across the US, and found a higher prevalence of tap water avoidance among children, Hispanic and African American populations, and low-income populations than among adults, Caucasian populations, and higher-income populations. Students surveyed for this study would likely have been aware of the long-running crisis in Flint given the extensive media coverage that occurred beginning in 2015, and it is conceivable that safety concerns have resulted in hesitancy to trust the tap water on the Allegheny College campus, particularly tap water originating from non-filtered sources like sinks and standard water fountains. This background concern could be one important factor explaining why only 18% of surveyed students in 2019 believed that campus tap water was safer than bottled water, despite the ongoing awareness campaign about water safety and filtered refill stations.
A lack of options to easily clean reusable bottles was another important barrier cited by students as a reason for why they do not more regularly use a reusable water bottle. Bottles that are not cleaned regularly and thoroughly are problematic, as studies have shown that they can harbor potentially harmful microbial loads [
52,
53]. Even general awareness of this issue through personal experience with bottles that have a bad smell or look unclean is likely an important factor in driving water bottle behavior among college students without convenient and effective cleaning options. Some student dormitories at AC do not offer sinks that make it convenient for students to clean large water bottles, which indicates that the installation of bottle cleaning stations on campus could increase the number of students who regularly use reusable bottles. However, as most of the dormitories on the campus do offer sinks that can accommodate large water bottles, a more impactful initiative to make bottle cleaning easier for students could be the institution of a free bottle brush program to replace the free water bottle program that the college has had in place since 2015. This simple but impactful switch in initiatives would remove a barrier cited by numerous students, making it considerably more convenient to use a reusable water bottle on campus regardless of dormitory conditions.
Through this study we have gained an understanding of the effectiveness of several initiatives aimed at reducing single use water bottles among students on the campus of Allegheny College. The installation of numerous water bottle refill stations across campus has made it more convenient for students to use reusable bottles, which has helped to drive down disposable water bottle use since 2015. However, study results also reveal that substantial barriers to reusable water bottle usage continue to be in place at the college, primarily in the form of a lack of convenient access to refill stations in dormitories, and, to a lesser extent, barriers to cleaning reusable water bottles on campus and perceptions about tap water safety. While the feasibility of addressing these barriers is beyond the bounds of this study, Allegheny College has been proactive in addressing sustainability issues in a number of ways over the last decade. The installation of additional water bottle refill stations and the institution of a free bottle brush program for students, along with revamped efforts to alleviate concerns about tap water safety on campus, are all in keeping with efforts that the college has previously made. Engaging in these initiatives could considerably reduce the use of disposable water bottles on campus even further, helping to contribute to overall institutional sustainability goals.


