
Use of a Hybrid Wind—Solar—Diesel—Battery Energy System to Power Buildings in Remote Areas: A Case Study

 ,
,  ,
,  ,
, 
Abstract
:1. Introduction
2. Review of Literature
3. Materials and Methods
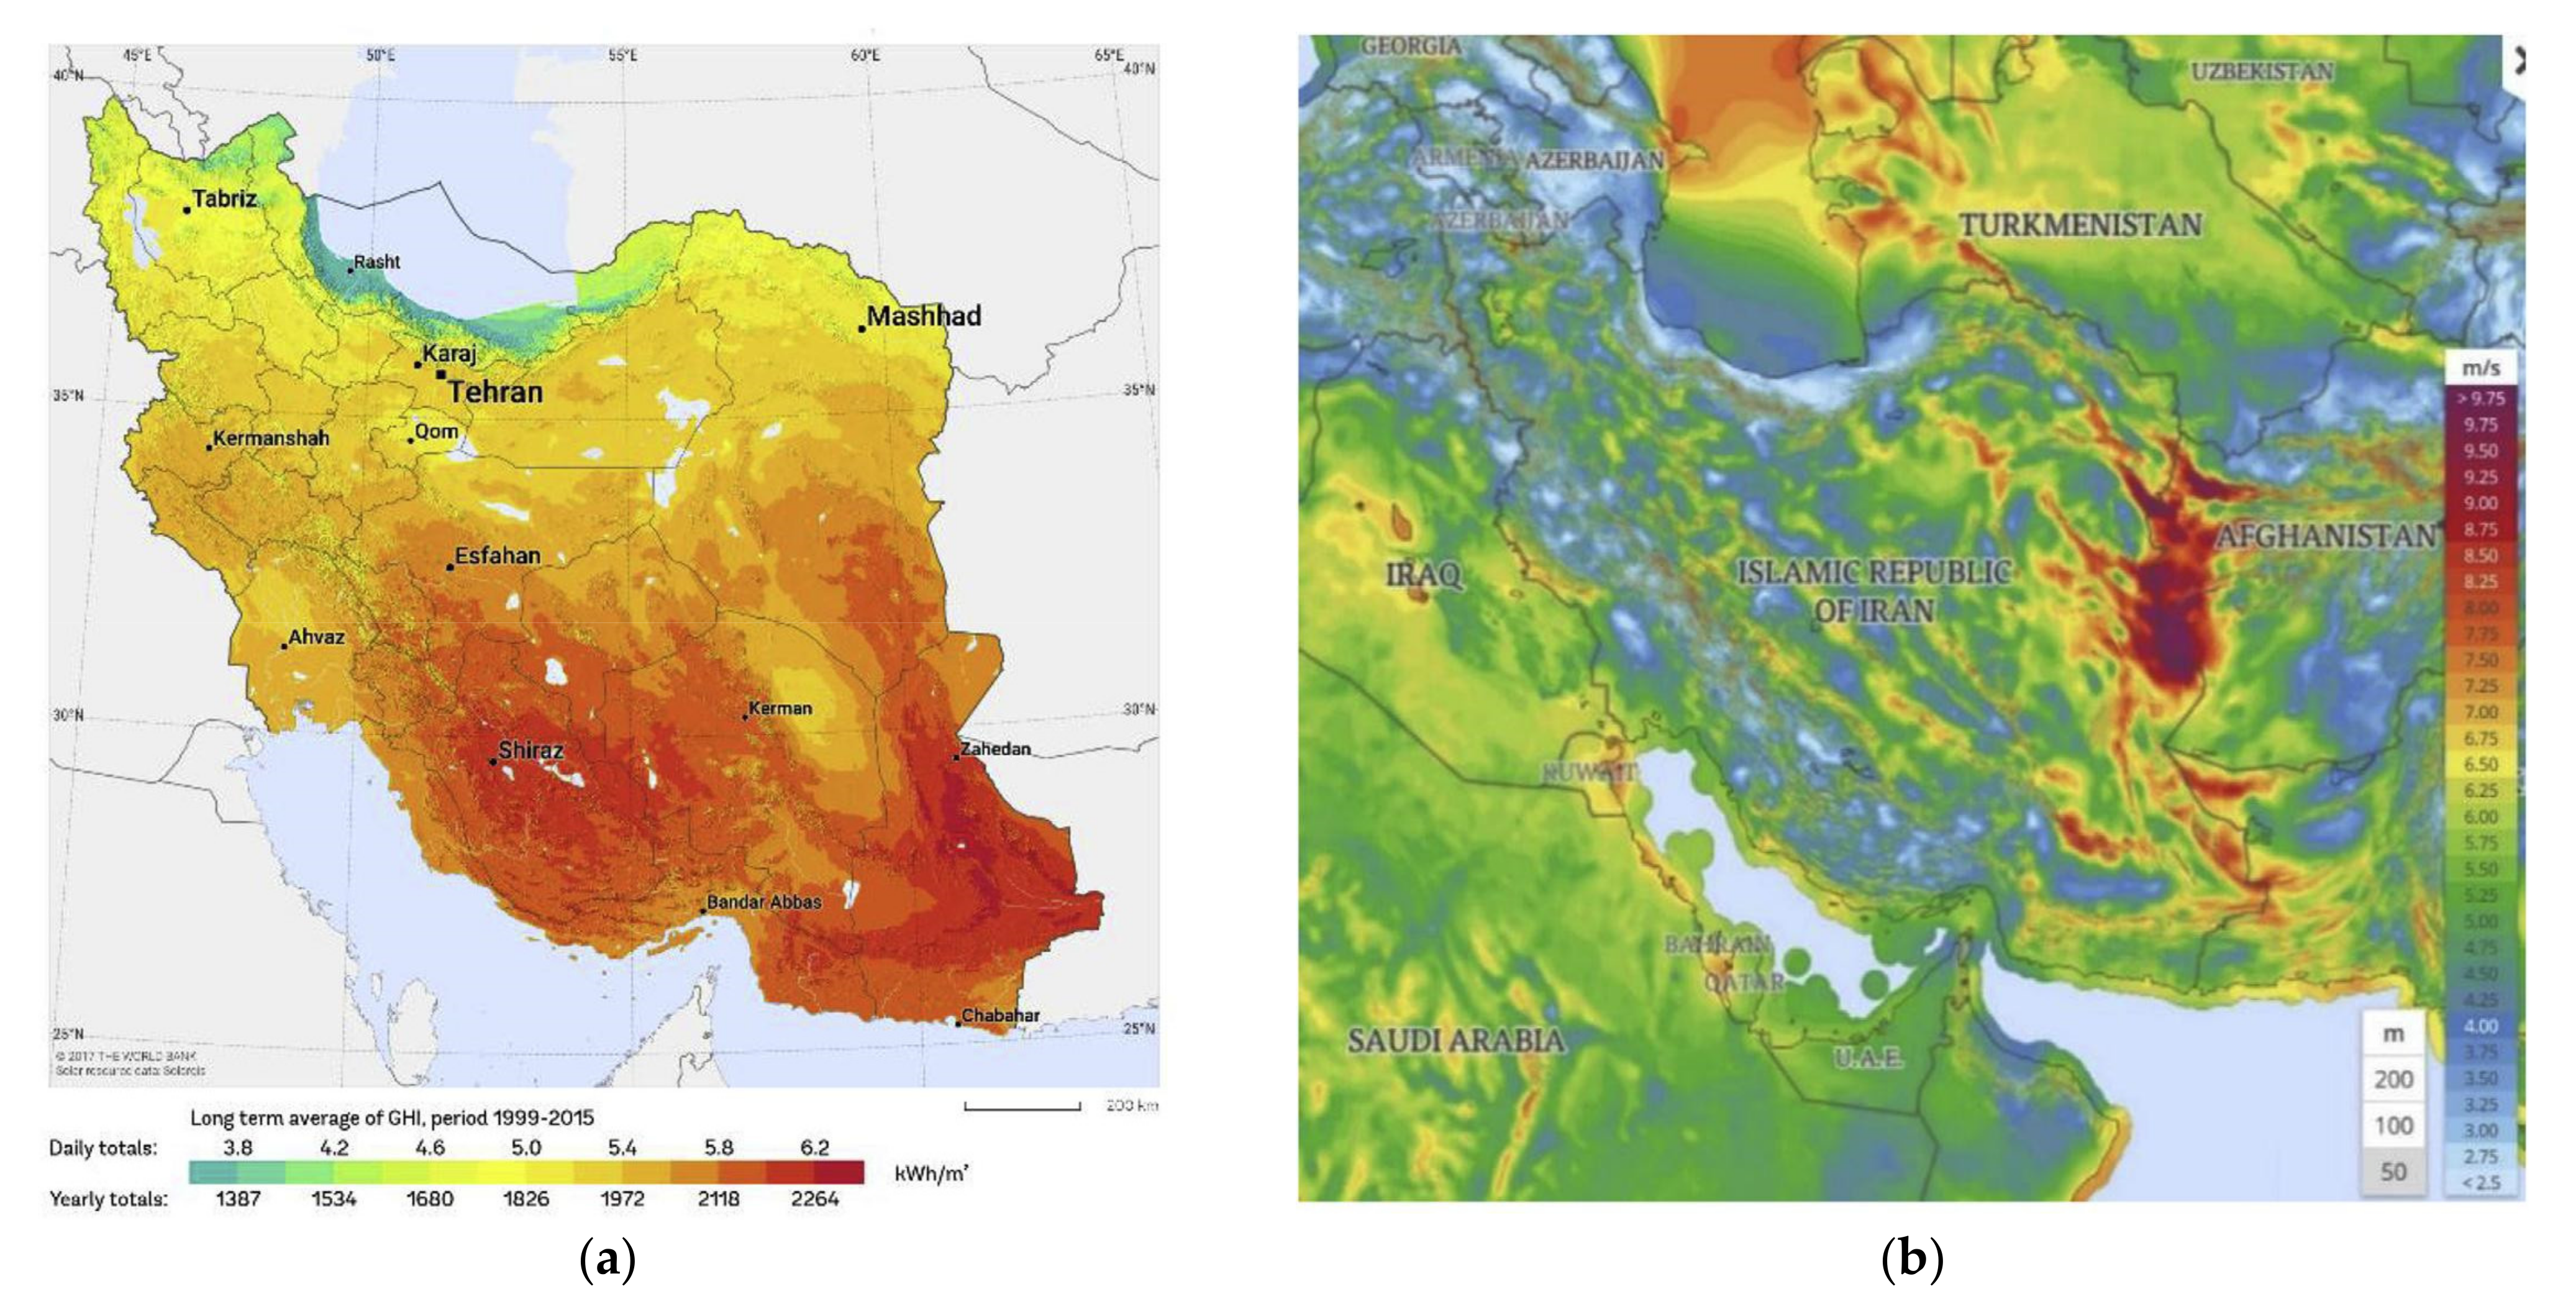
3.1. Study Area
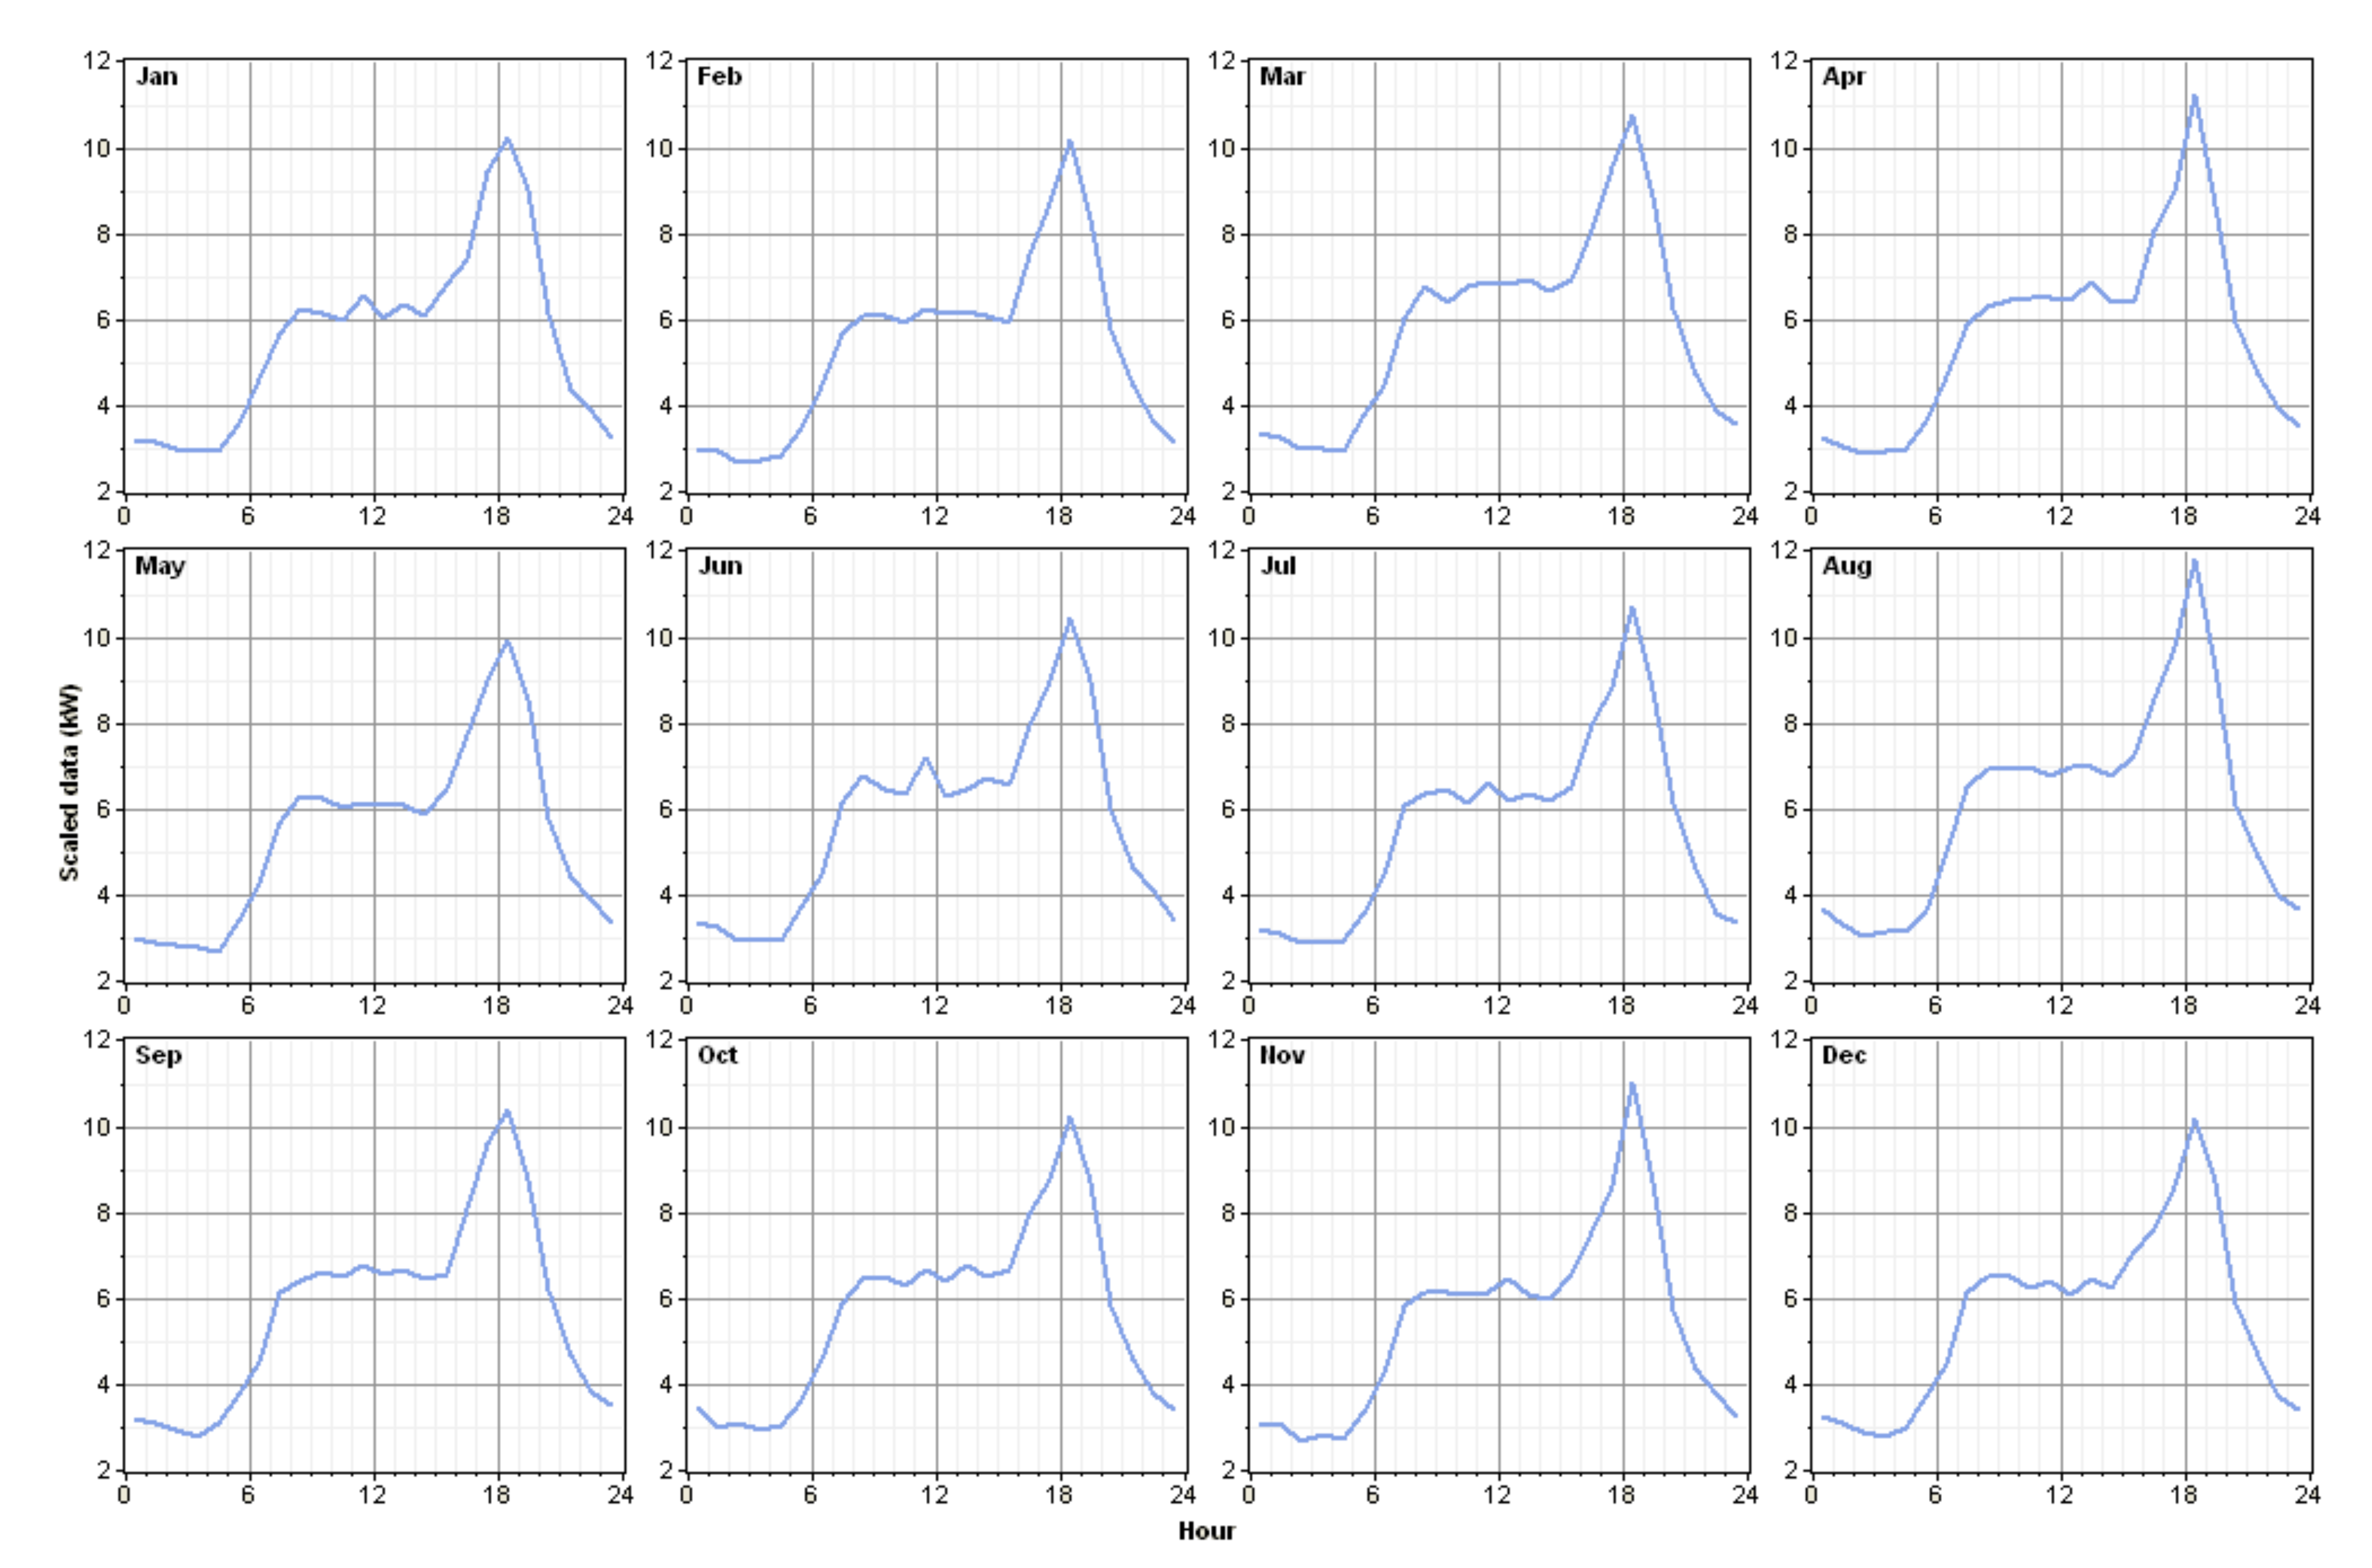
3.2. Estimation of Electricity Consumption
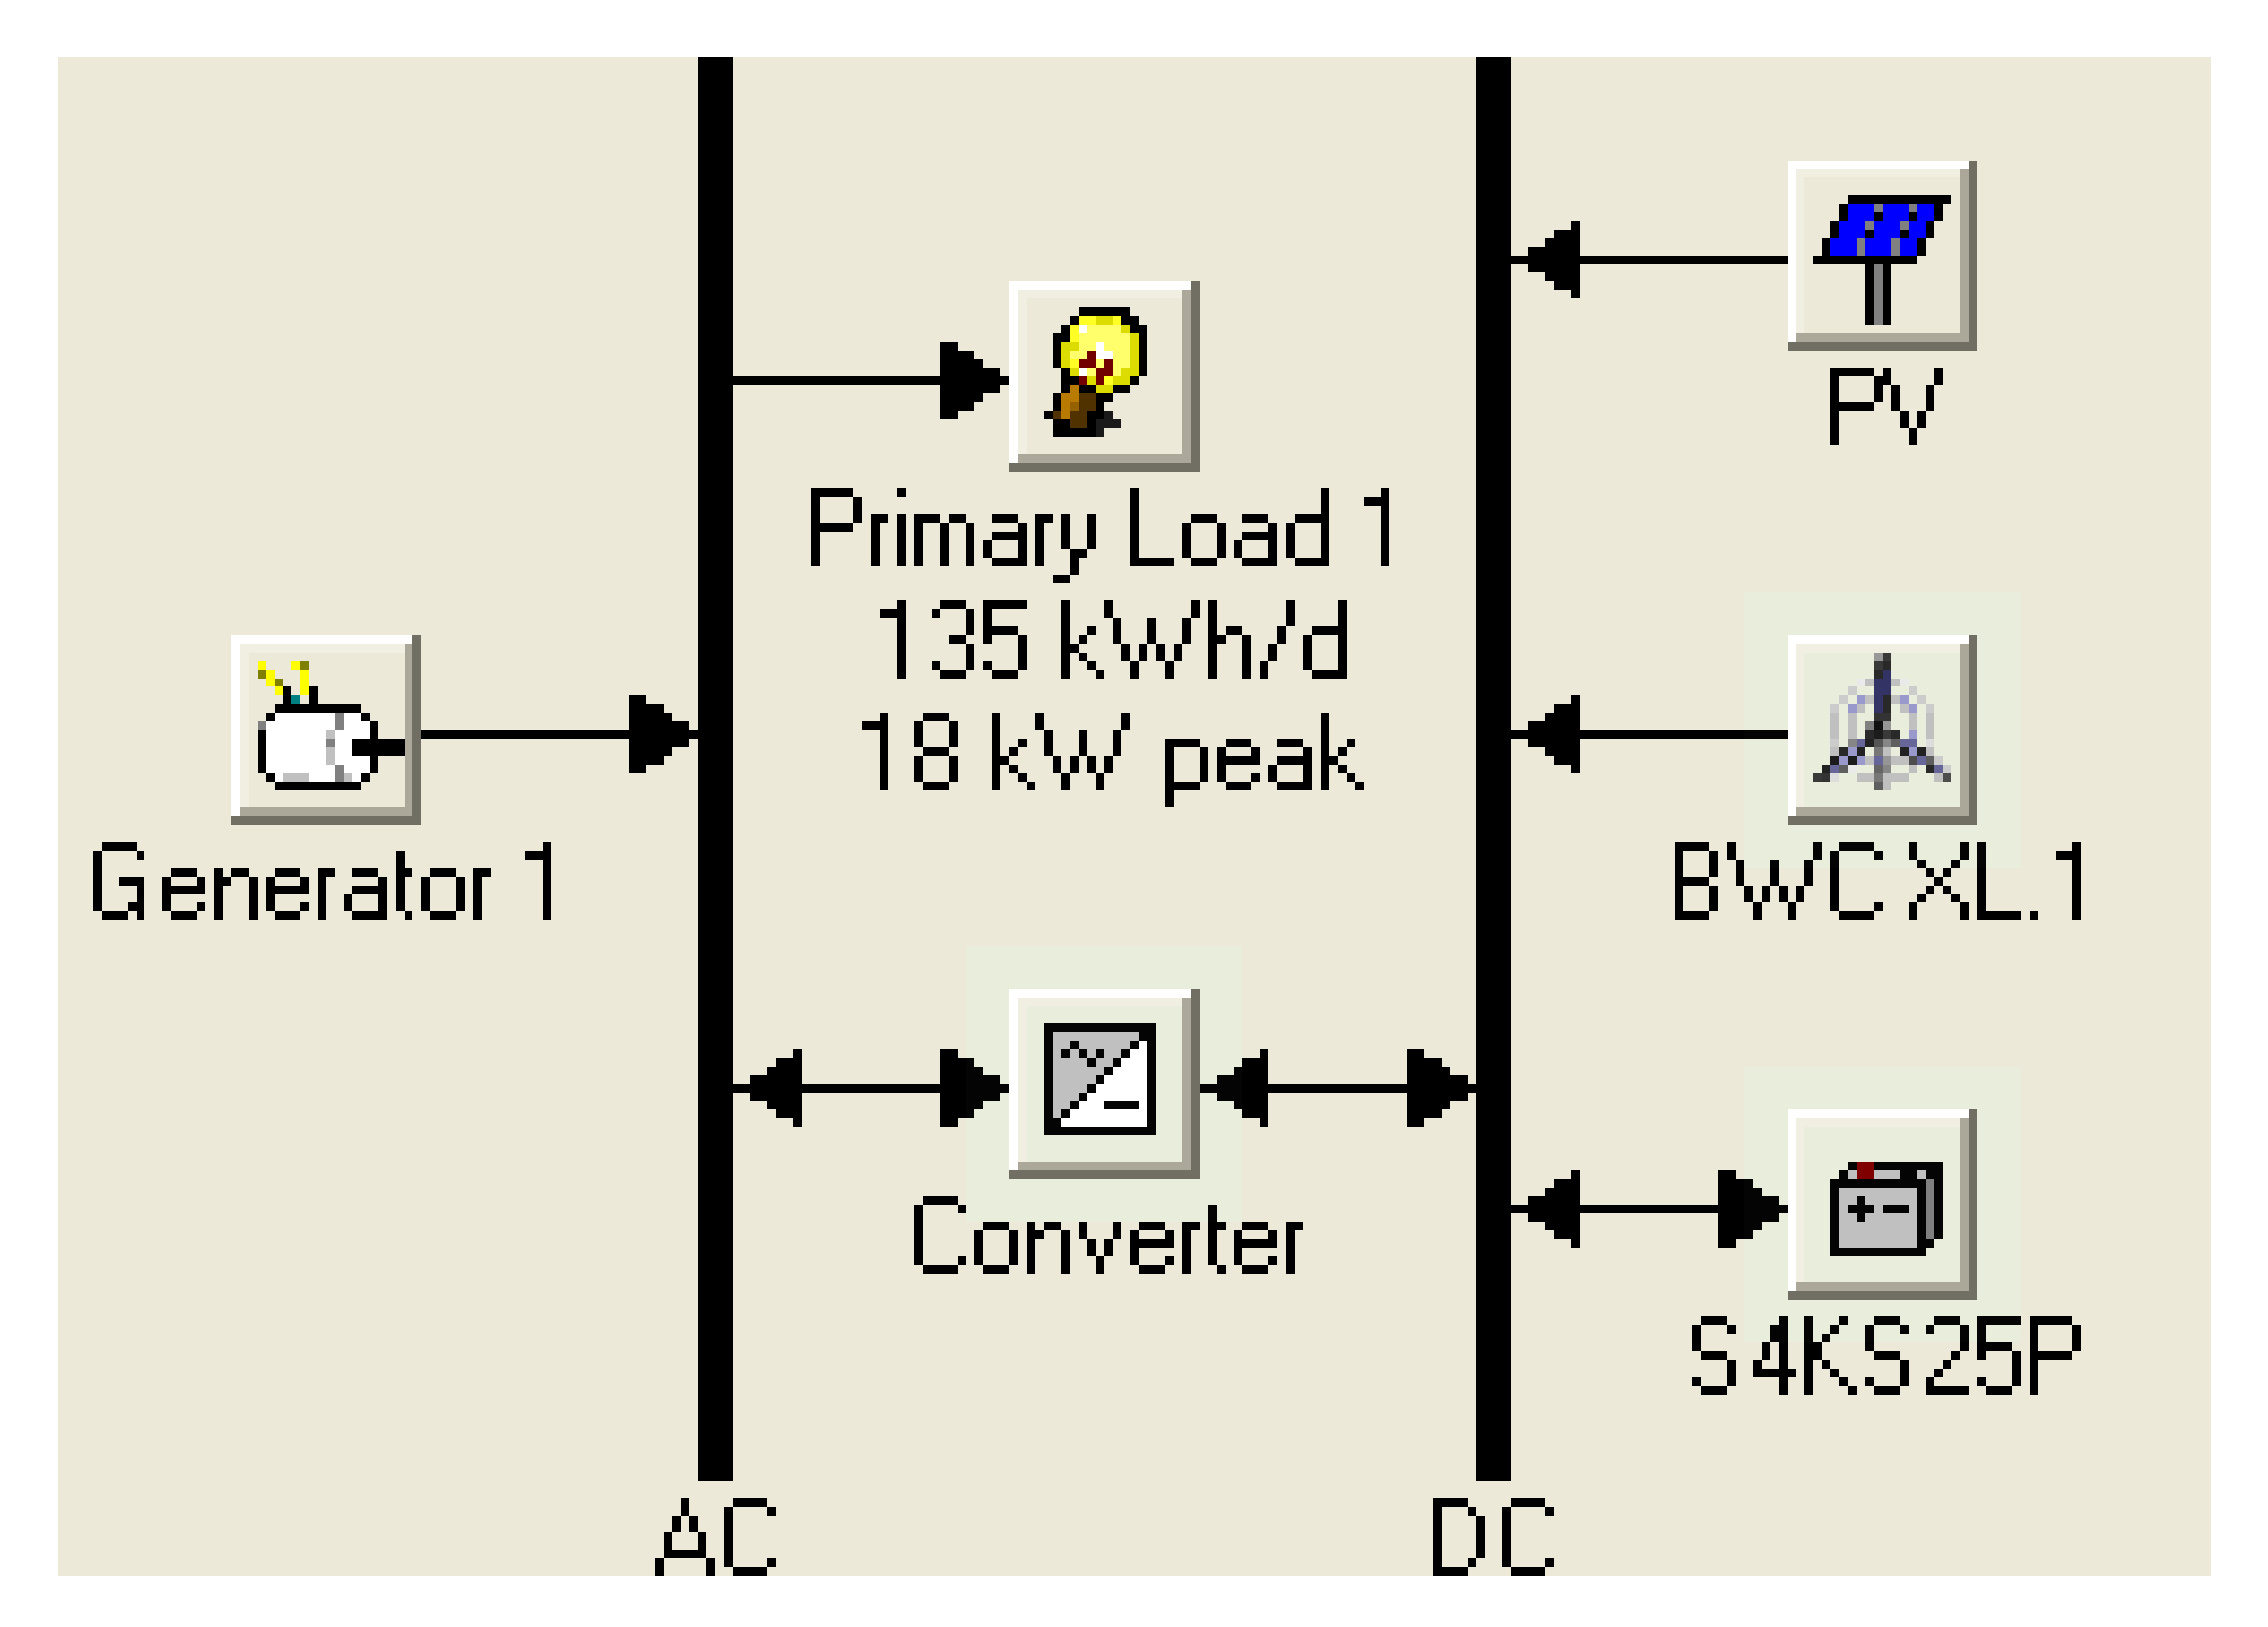
3.3. Specifications of the Considered Hybrid Energy System
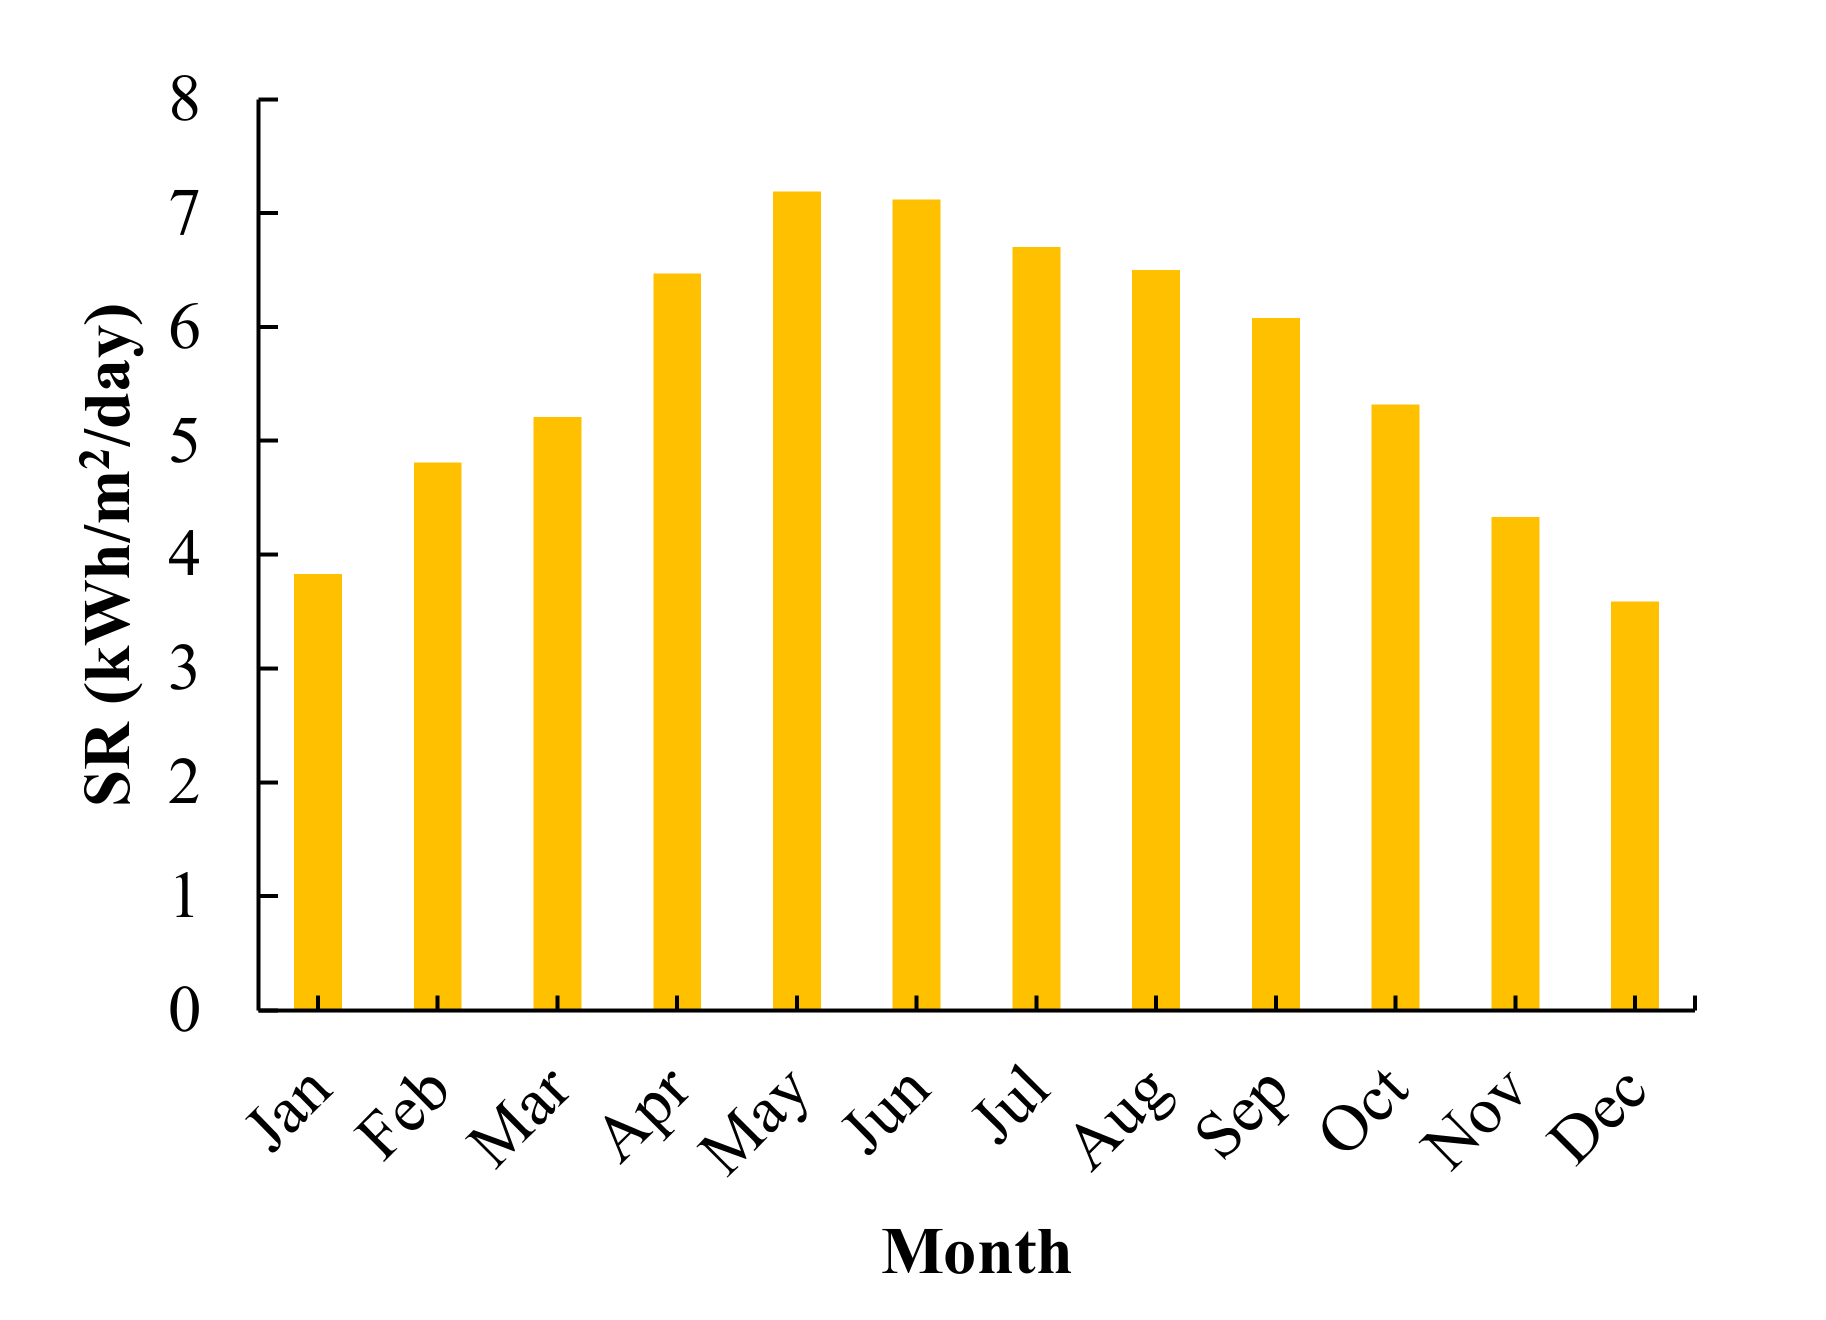
3.4. Solar Panel
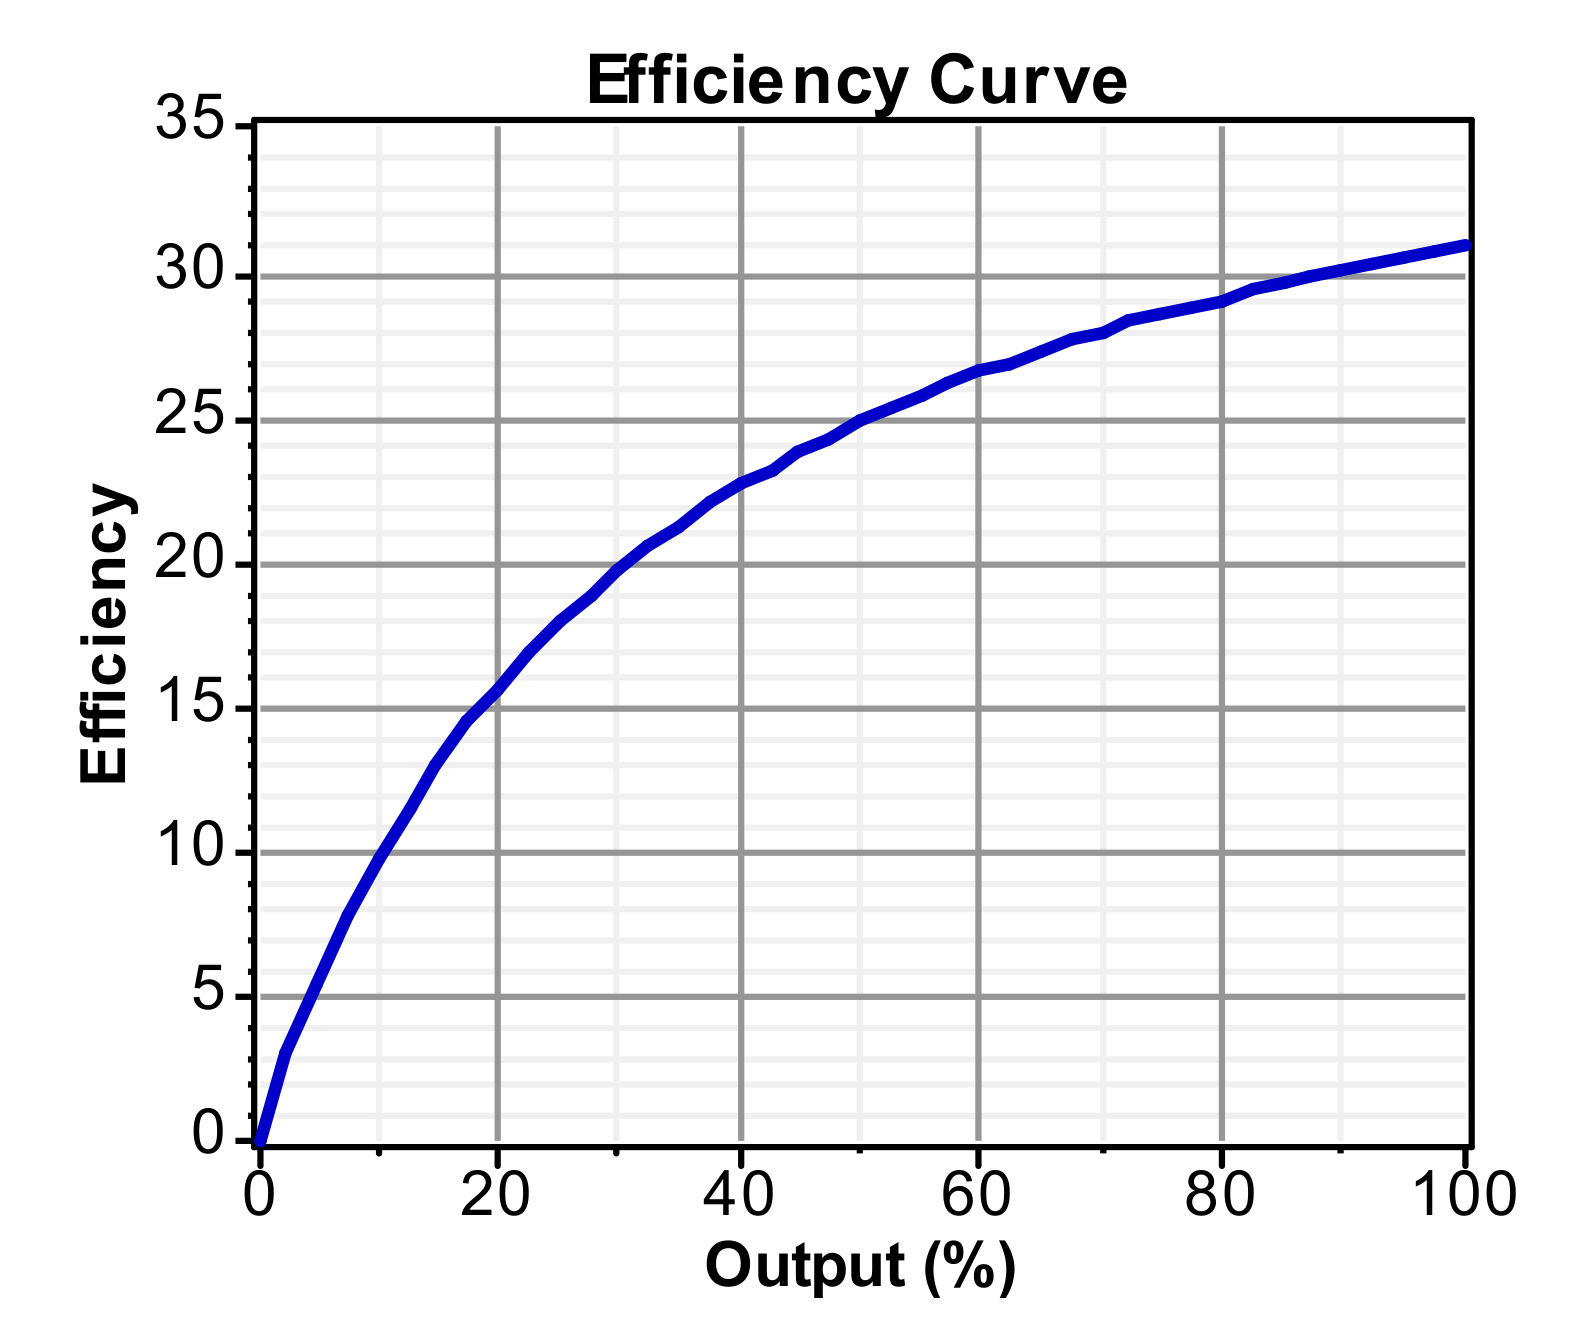
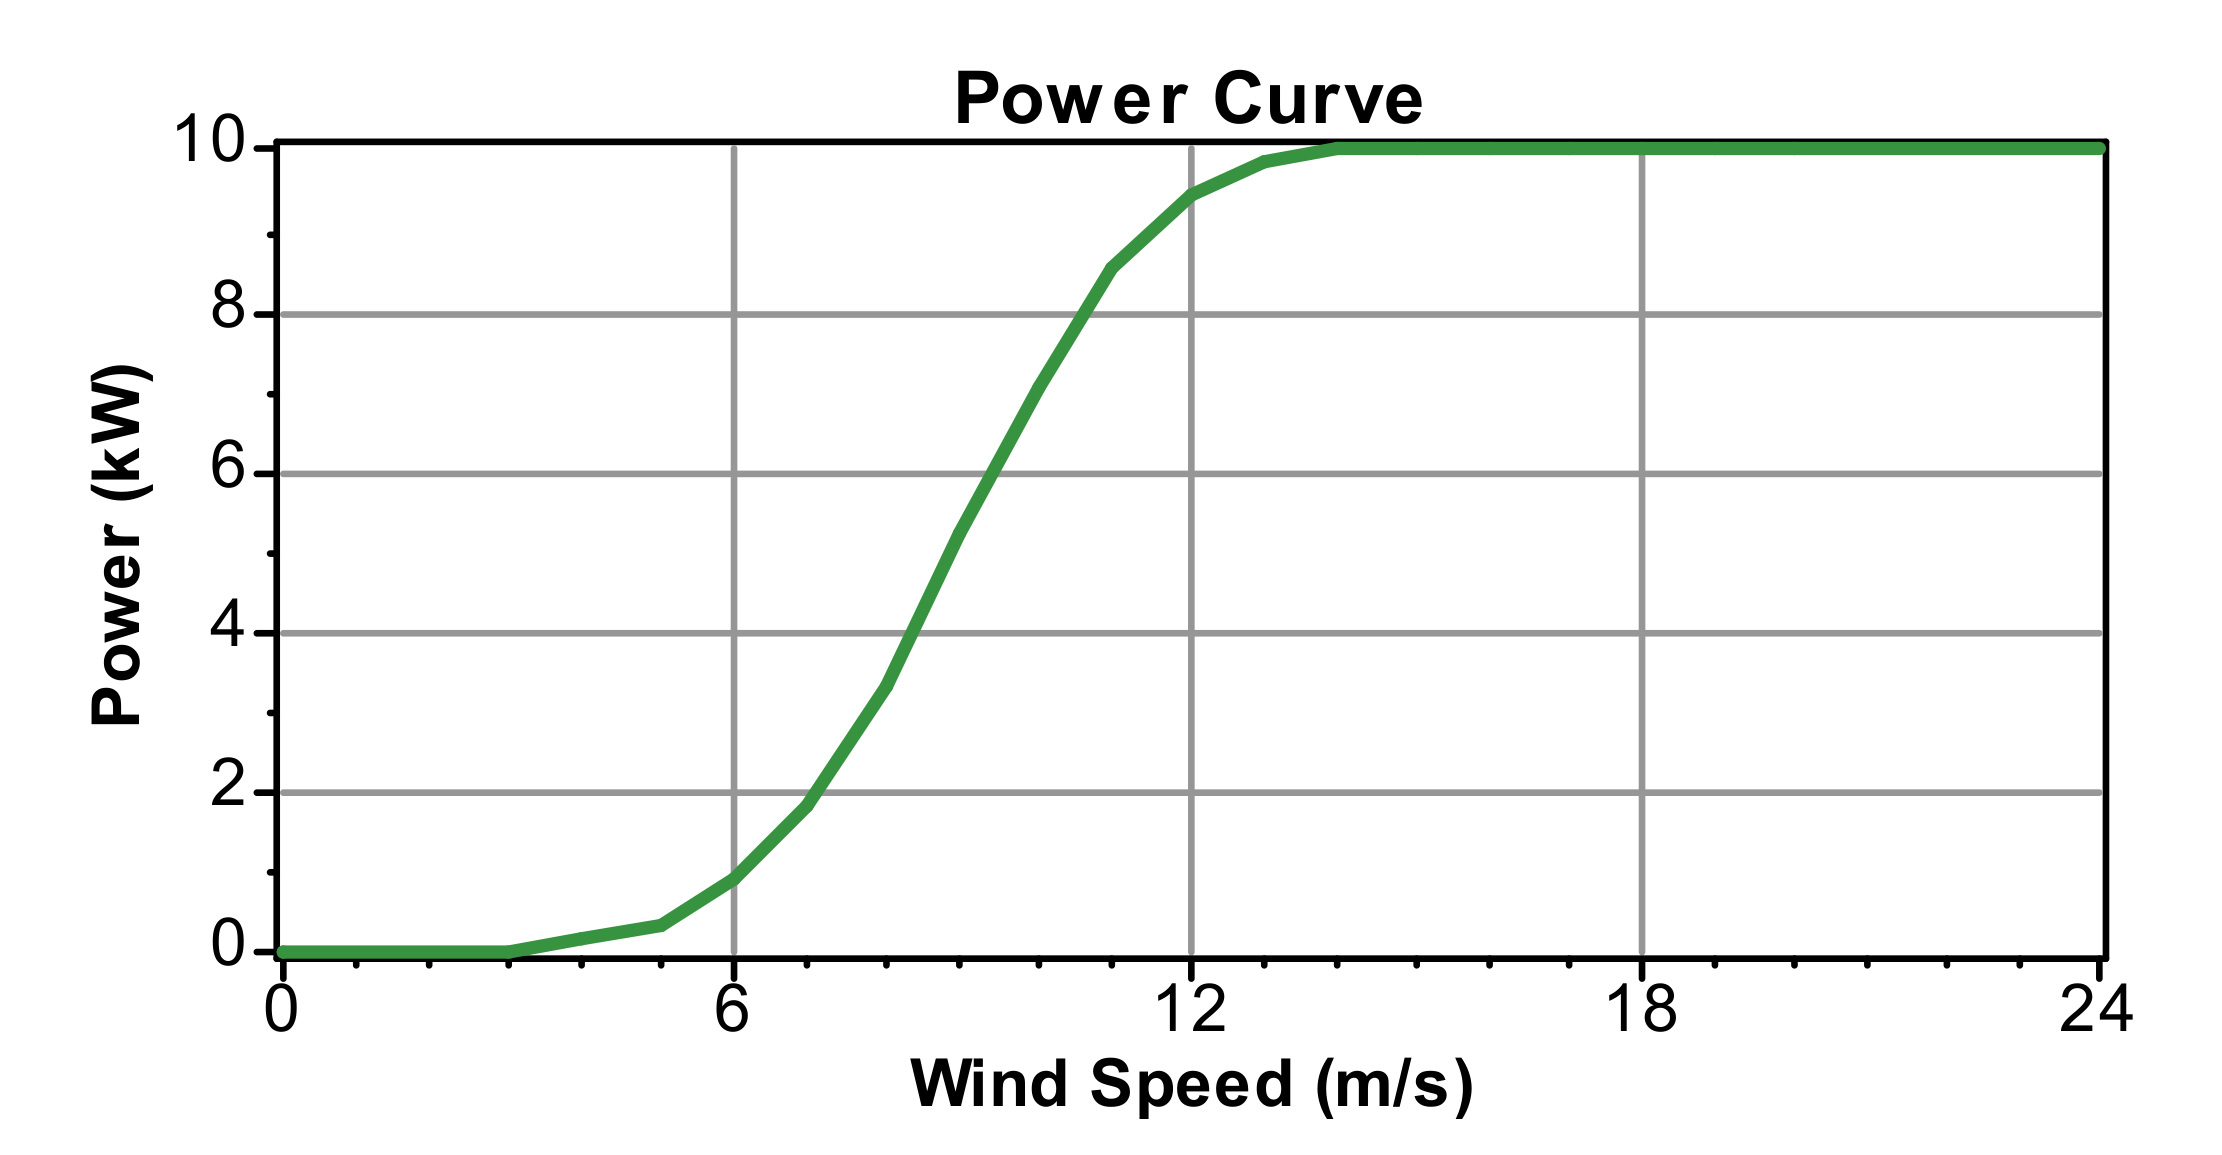
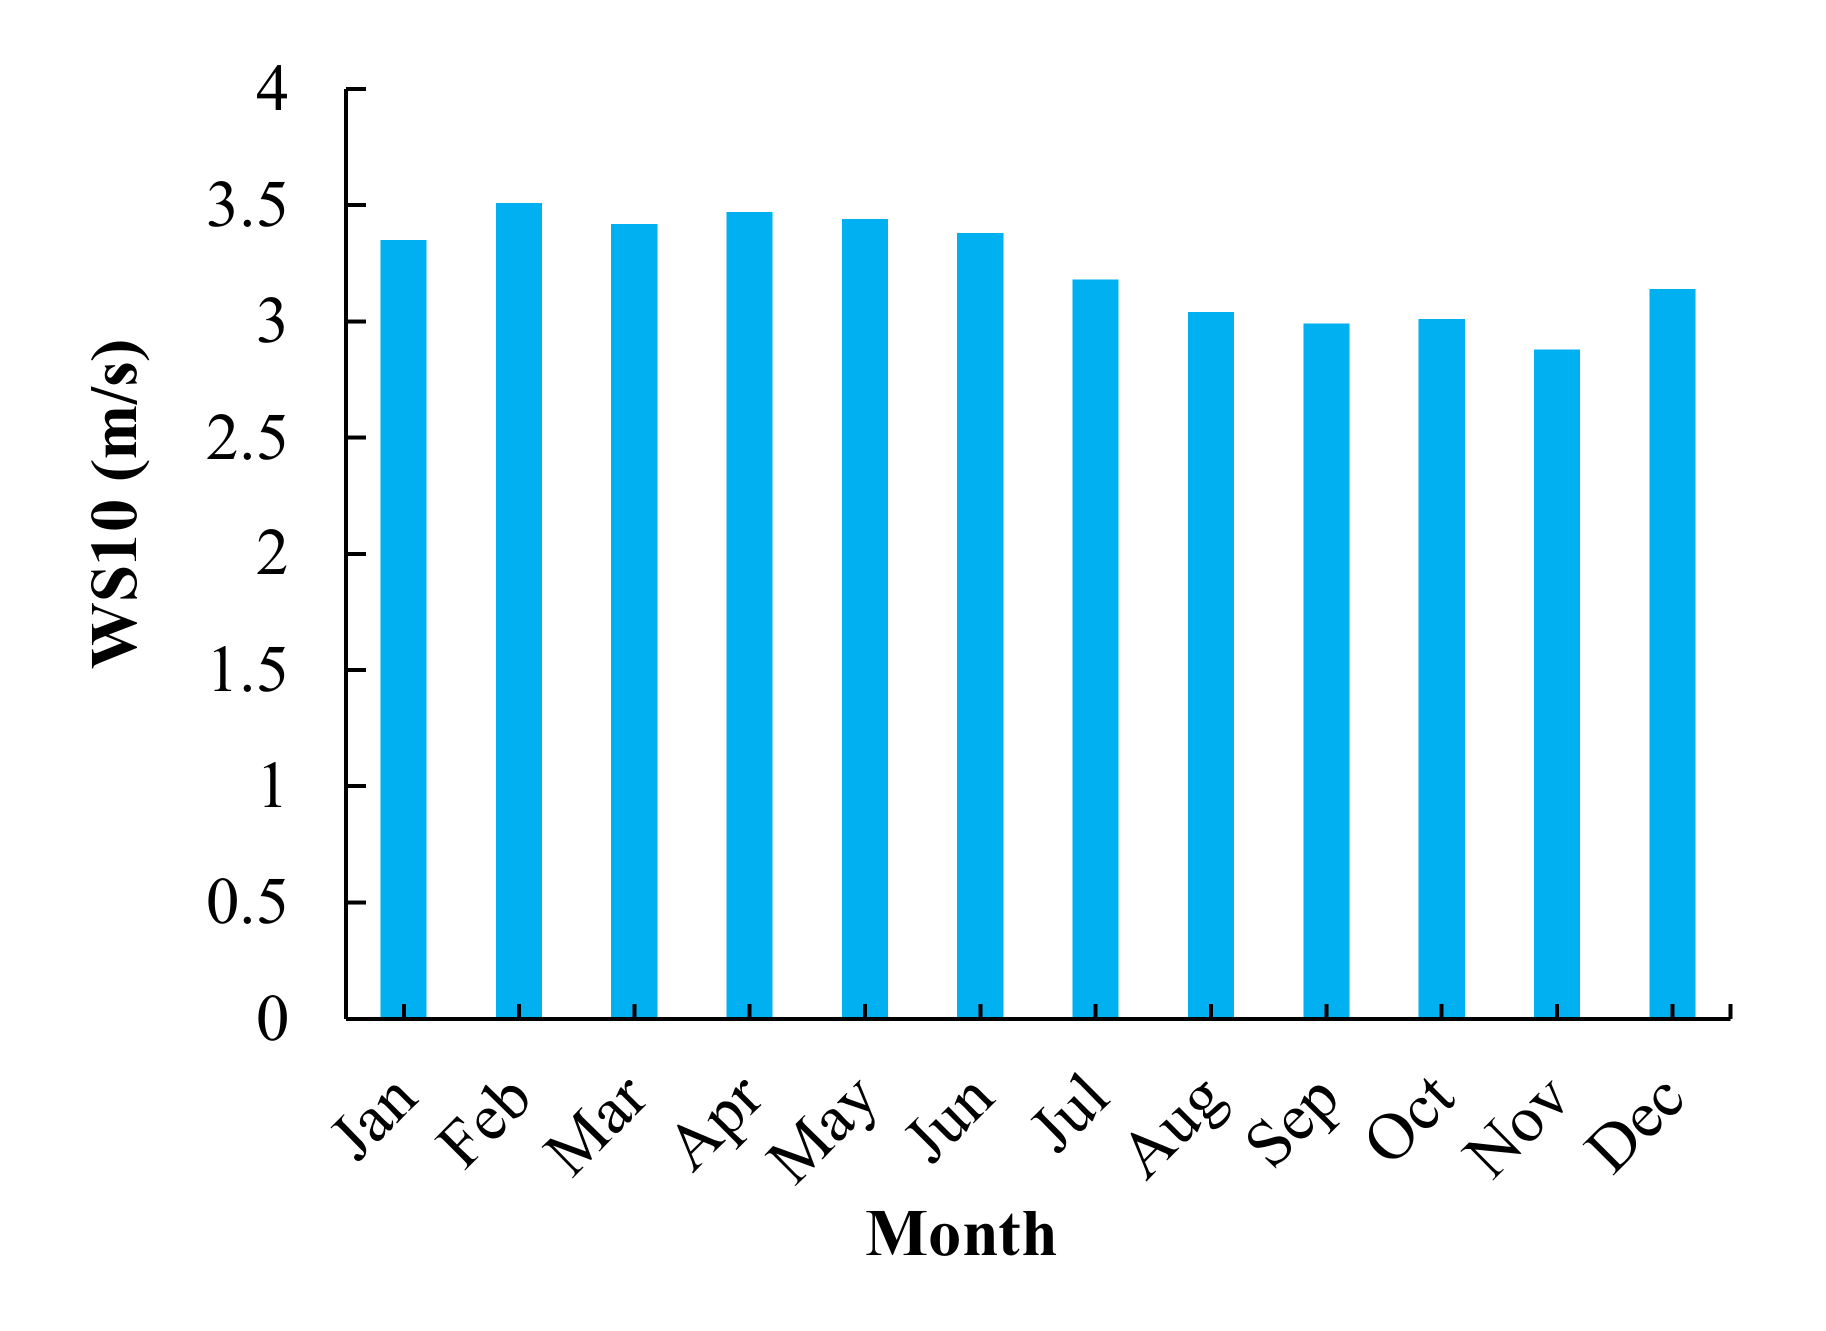
3.5. Wind Turbine
3.6. Converter
3.7. Diesel Generator
3.8. Battery

| System Components | Parameters | Value |
|---|---|---|
| Solar PV [51,52,53] | Operational lifetime | 25 Years |
| Ground reflectance | 20% | |
| Capital cost per KW | $6900 | |
| Replacement cost | $6900 | |
| O & M cost per year | 0 | |
| Derating factor | 90% | |
| Sizes considered | 0–100 kW | |
| Wind turbine (BWC XL. 1) [51] | Operational lifetime | 25 Years |
| Capital cost per KW | $1900/kW | |
| Replacement cost | $1900/kW | |
| O & M cost | $48/year | |
| Size considered | 0–100 kW | |
| Converter [51,52,53] | Operational lifetime | 15 years |
| Capital cost per KW | $800/kW | |
| Replacement cost | $700/kW | |
| Efficiency | 95% | |
| Size considered | 0–100 kW | |
| Diesel generator [51,52,53] | Operational lifetime | 15,000 h |
| Capital cost per KW | $3500 | |
| Replacement cost | $3500 | |
| O & M cost | $0.023/h | |
| Minimum load ratio | 30% | |
| Size considered | 0–100 kW | |
| Battery [2] | Operational lifetime | 12 years |
| Capital cost per KW | $1000 | |
| Replacement cost | $800 | |
| O & M cost | $10 | |
| Size considered | 0–100 unit |
3.9. Economic Assessment
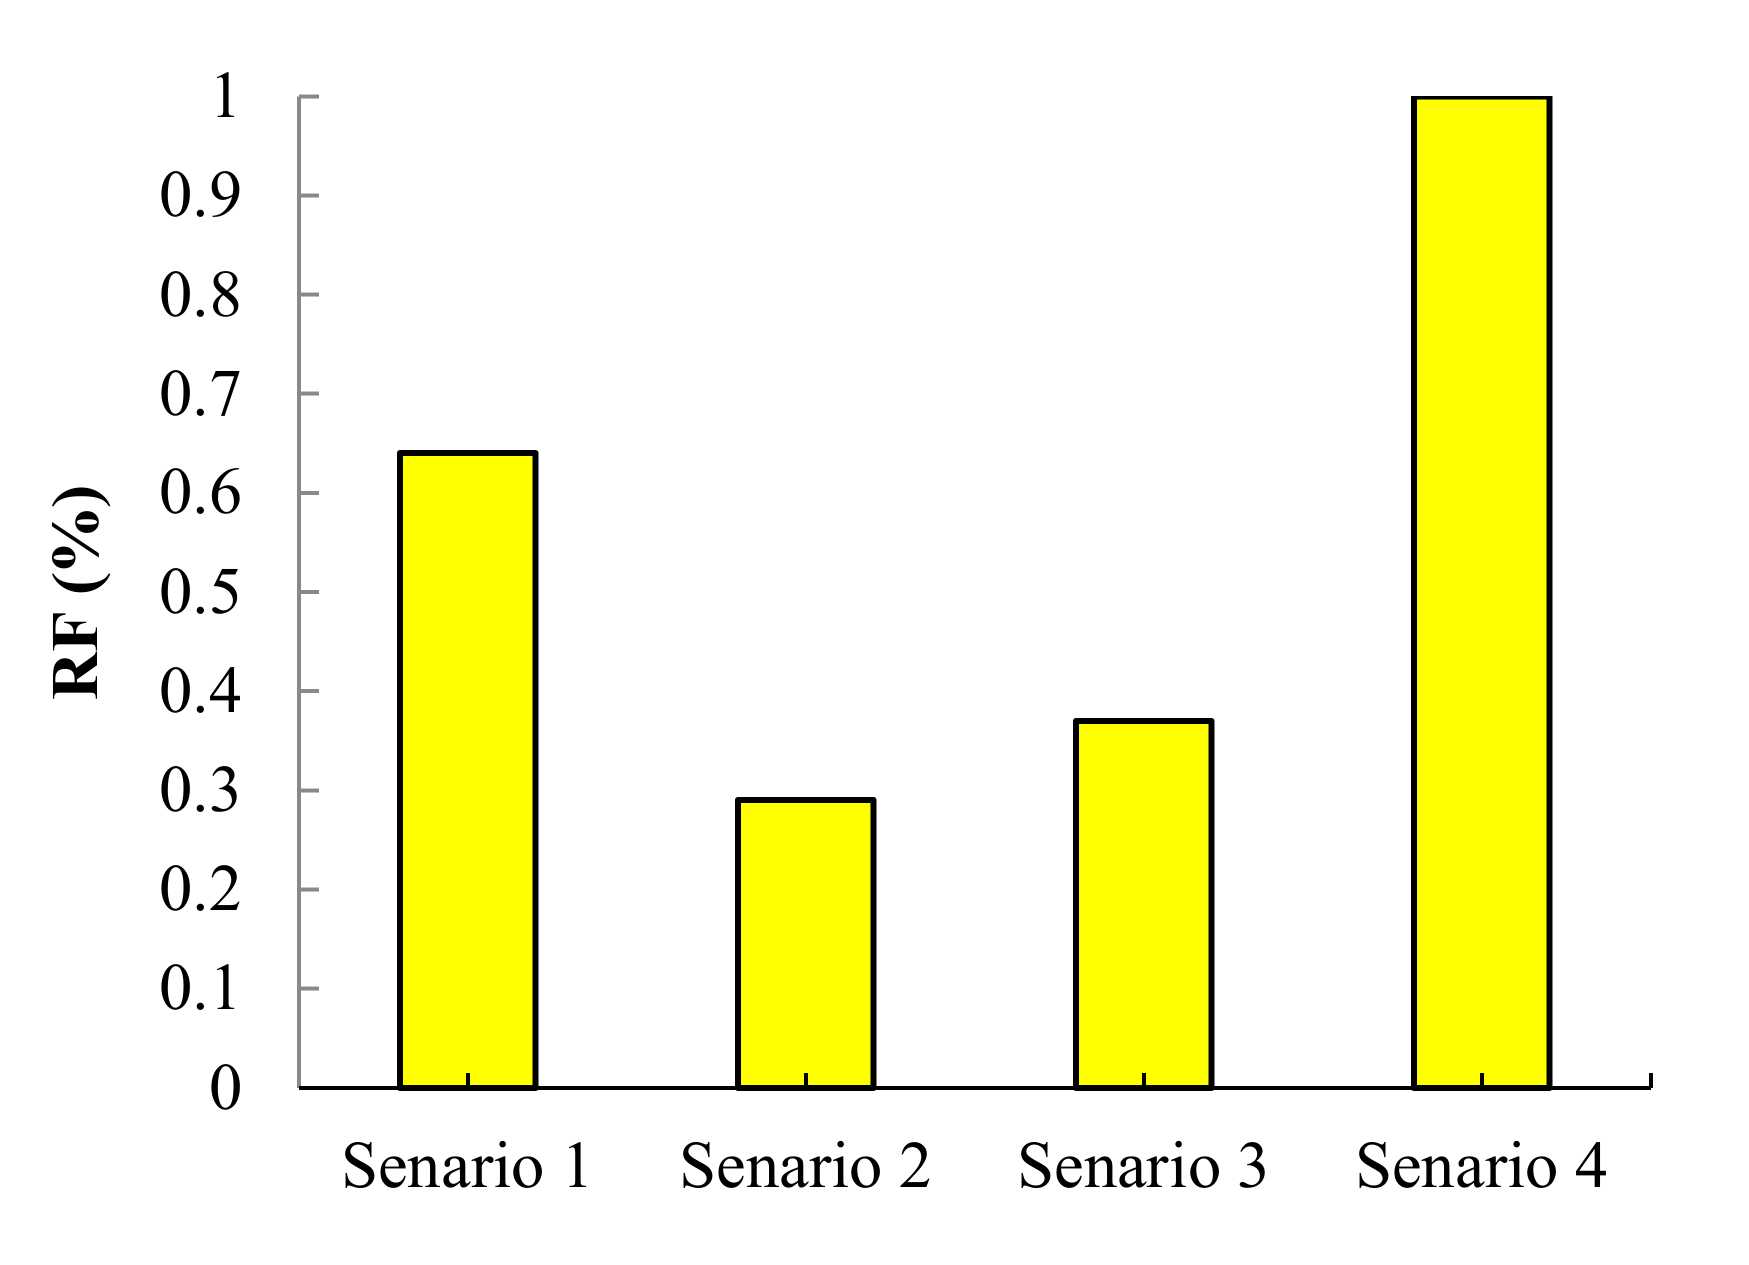
3.10. Renewable Fraction (RF)
3.11. Emission
3.12. Sensitivity Analysis
3.13. Multi-Criteria Decision-Making Methods
Stepwise Weight Assessment Ratio Analysis (SWARA)
Weighted Aggregated Sum Product Assessment (WASPAS)
4. Results and Analysis
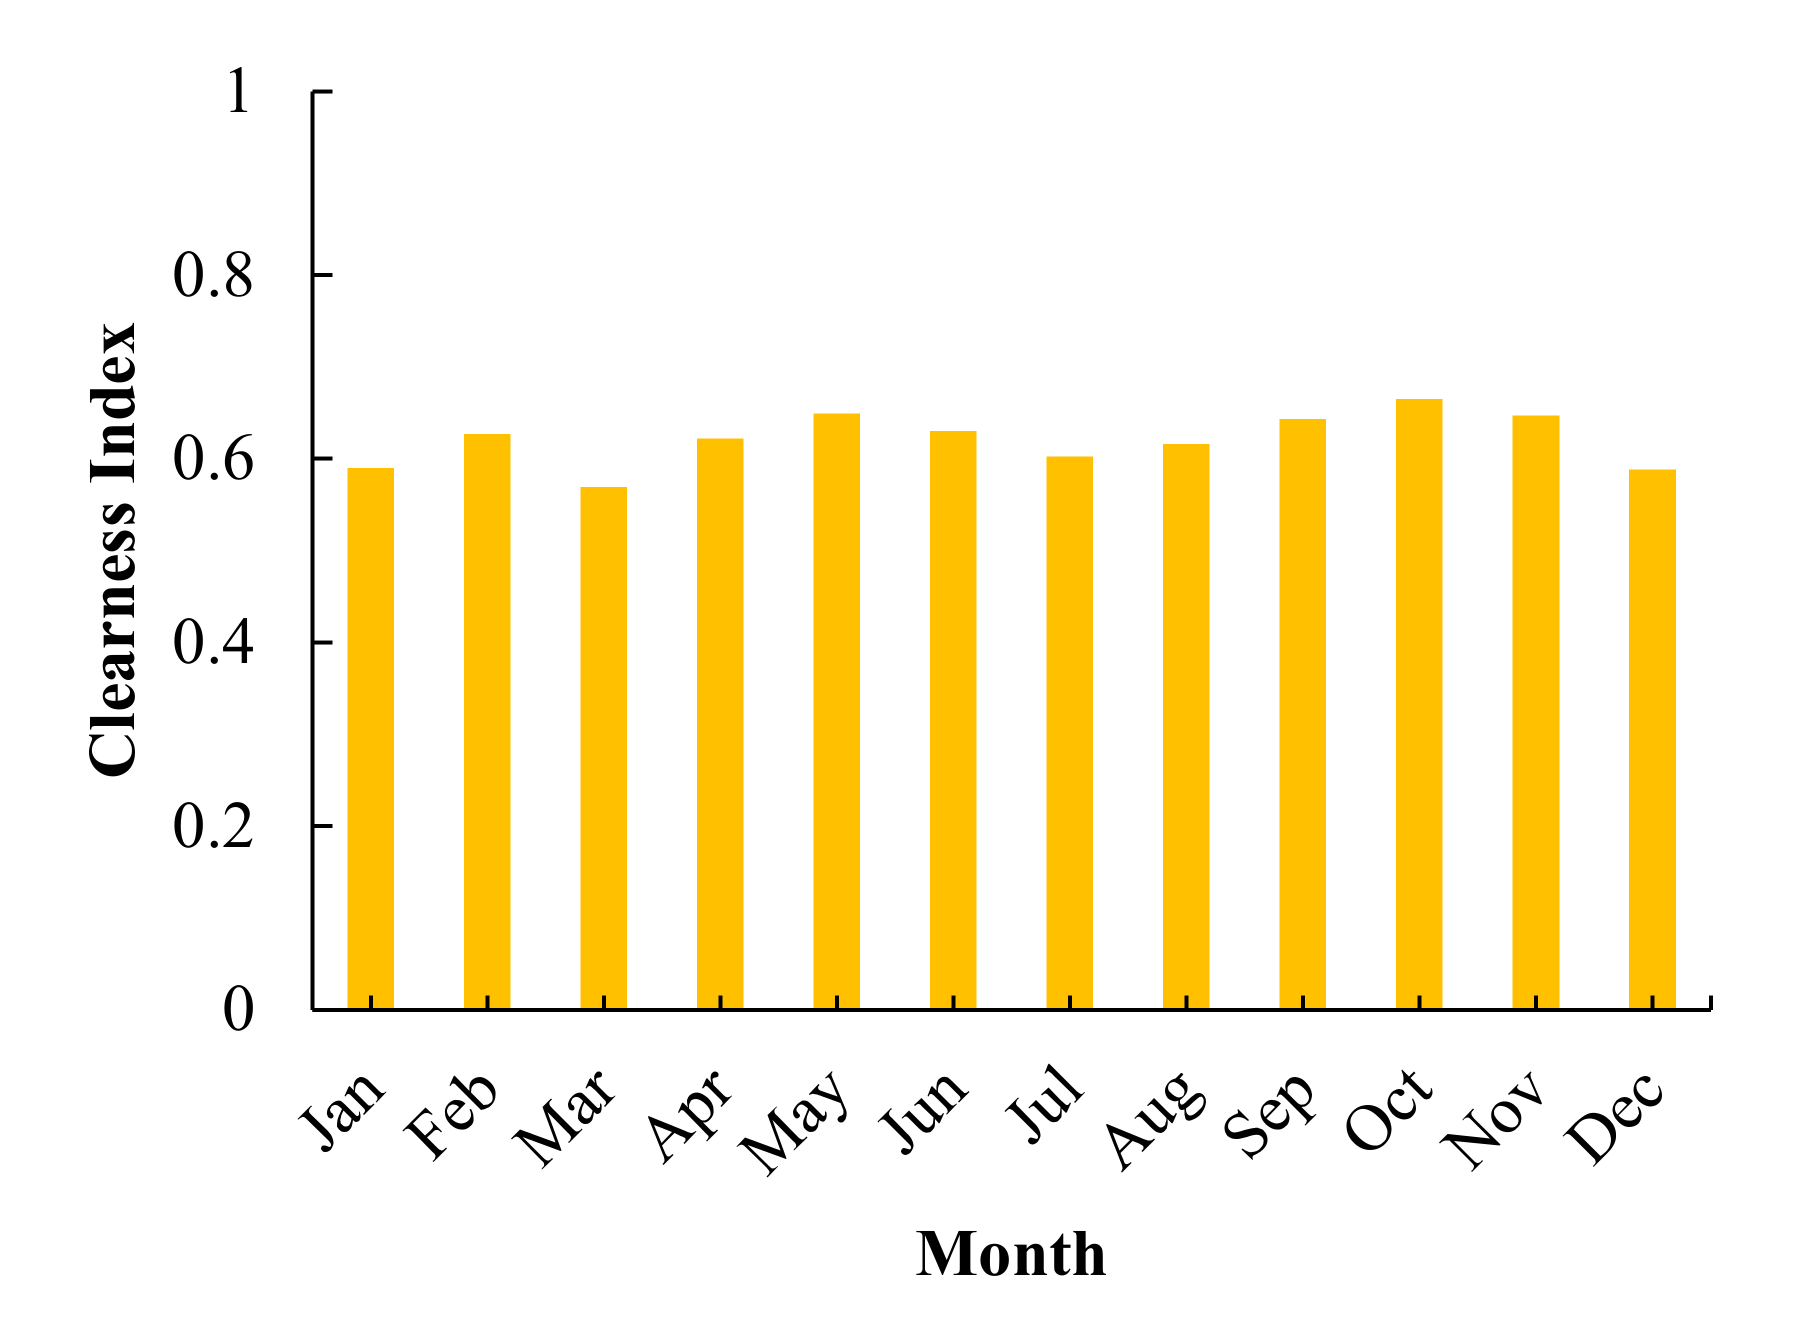
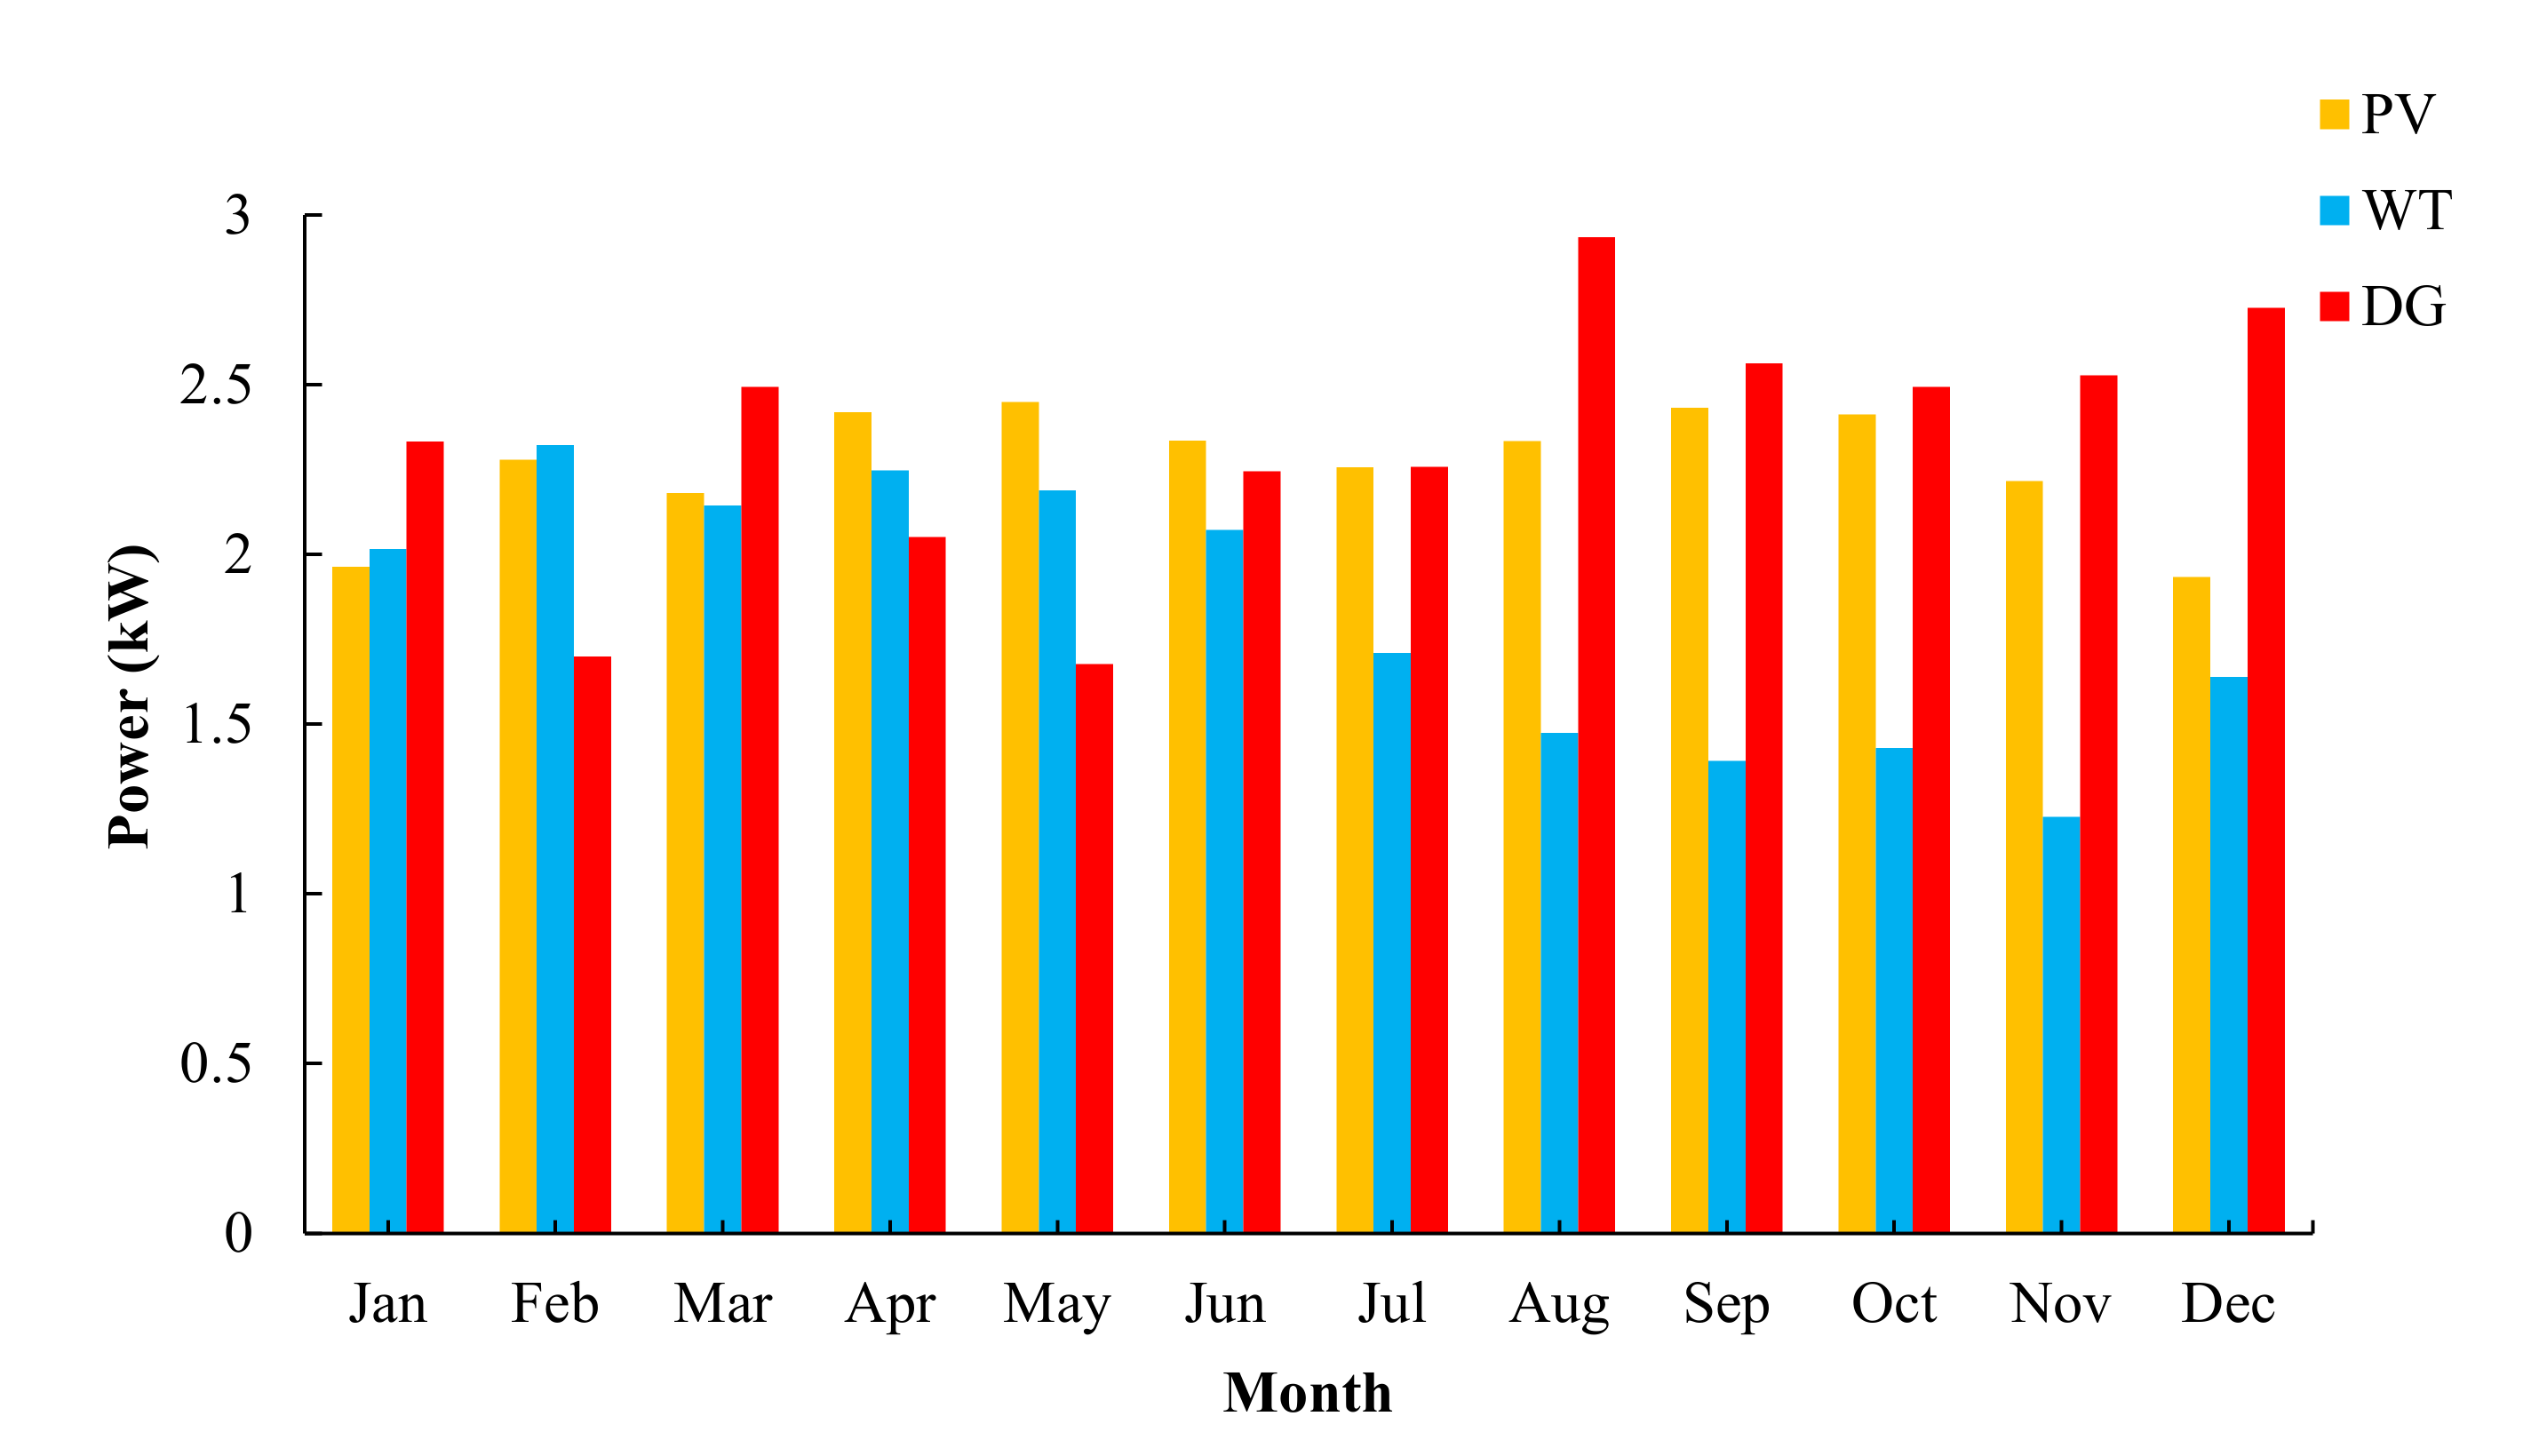
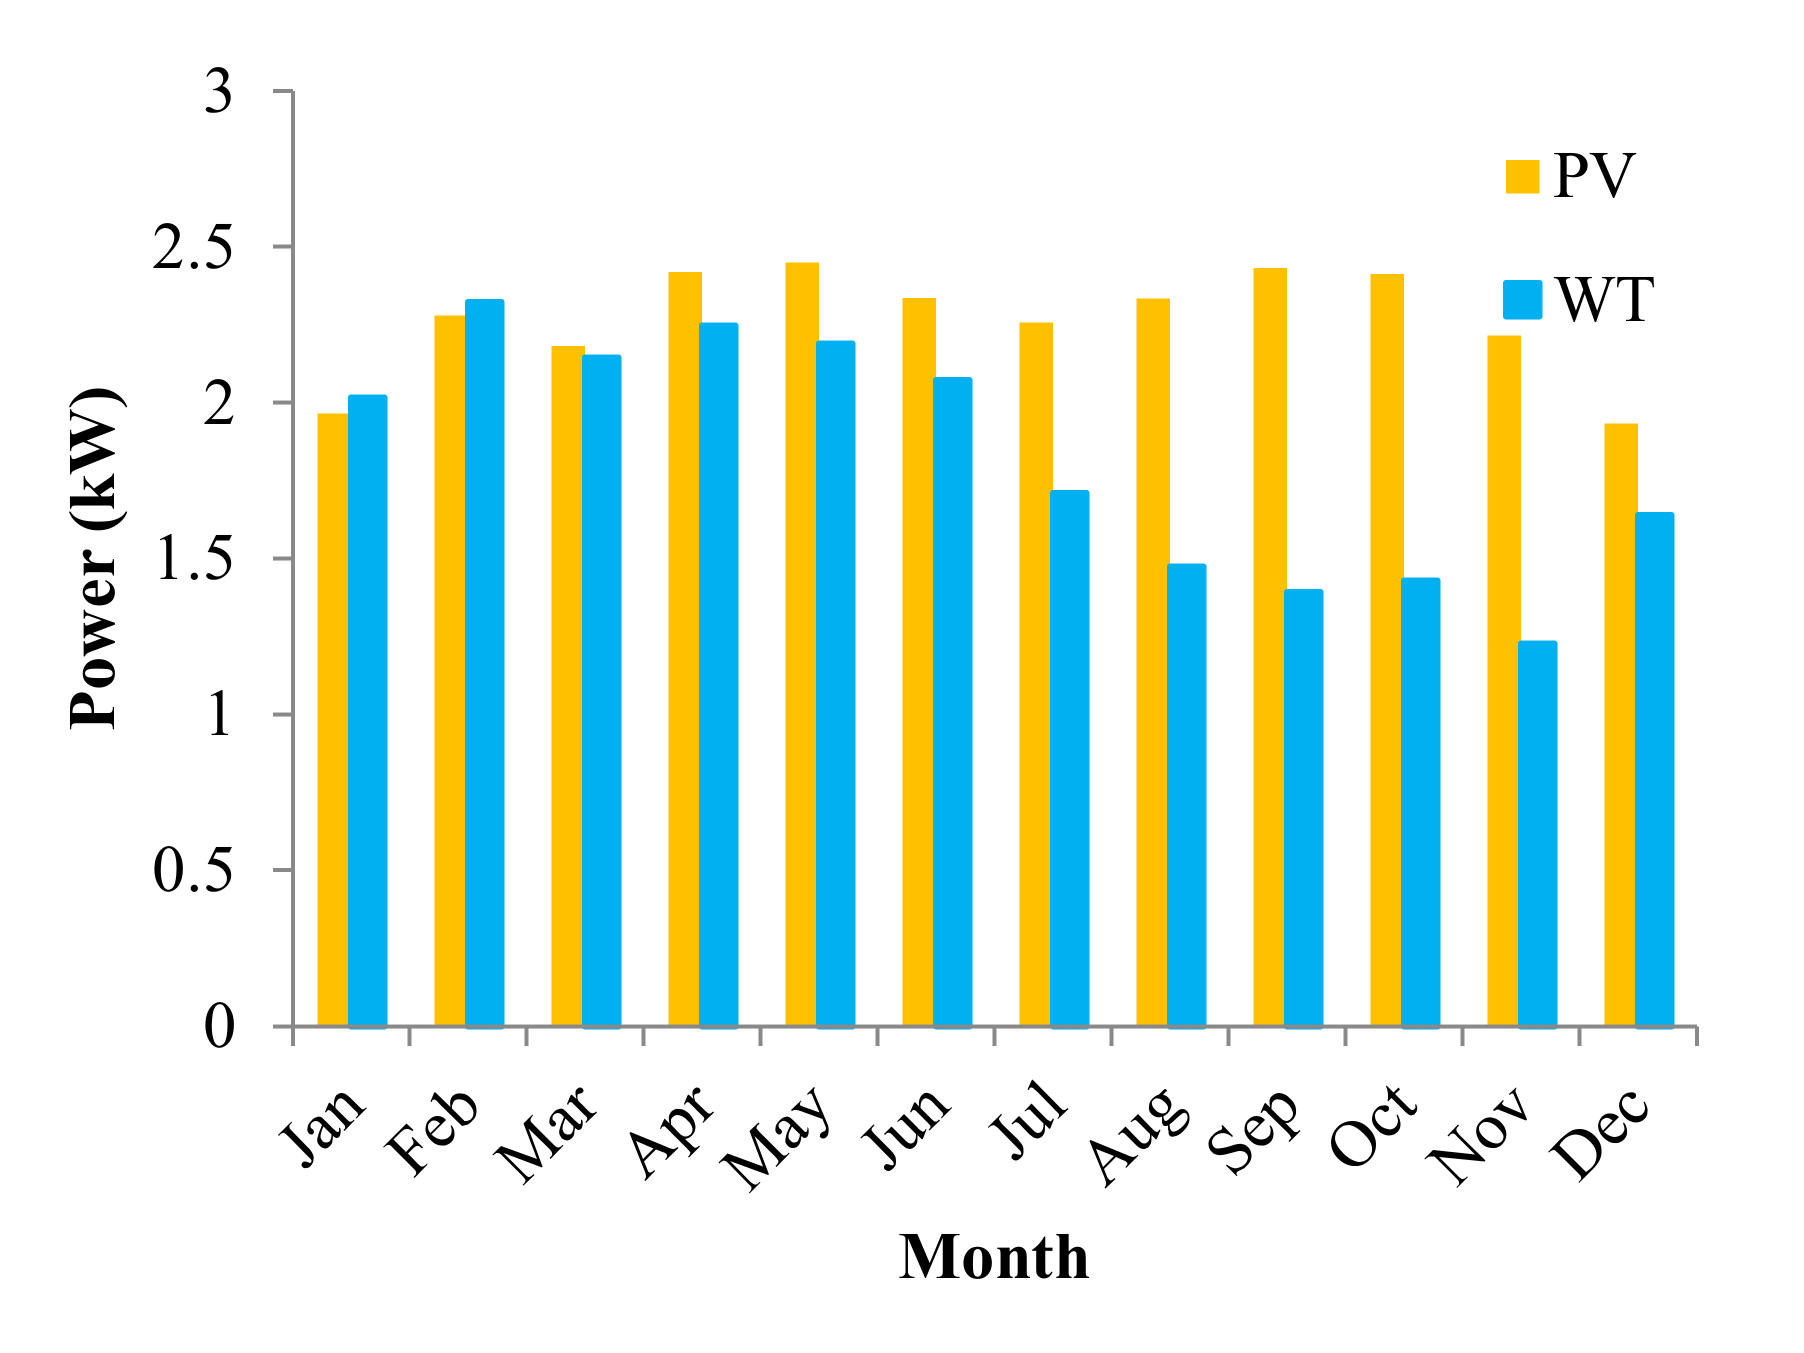
4.1. Potential of Renewable Energy Sources
4.2. Optimization of System Configuration
- 1-
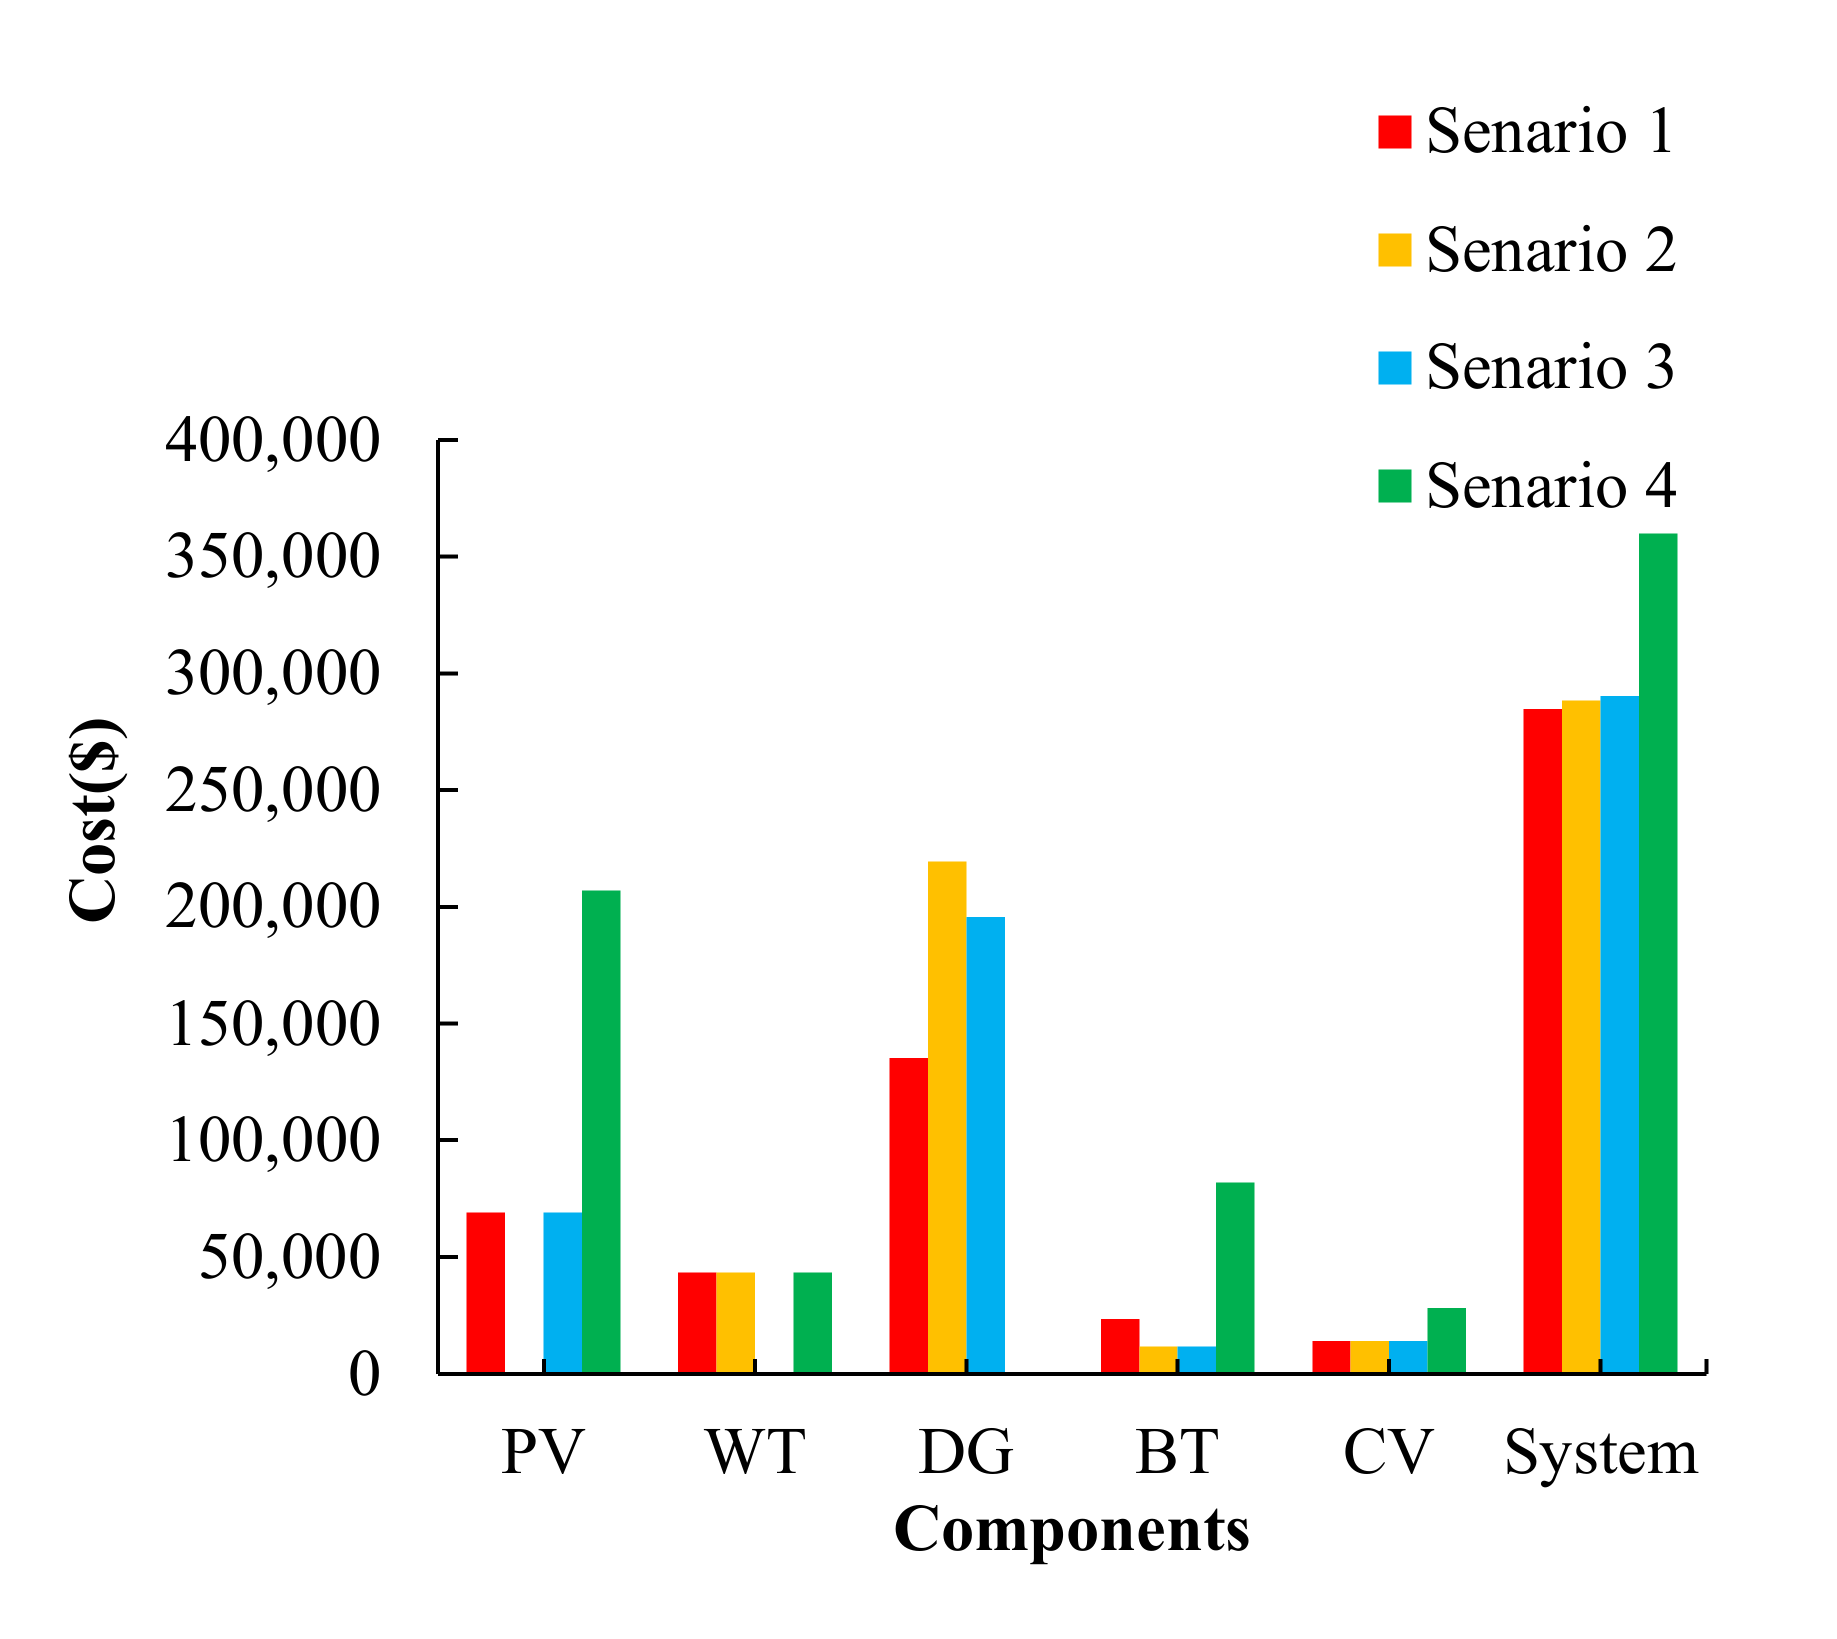
- Scenario I: using the PV–WT–DG–BT–CV system,
- 2-
- Scenario II: using the WT–DG–BT–CV system,
- 3-
- Scenario III: using PV–DG–BT–CV system,
- 4-
- Scenario IV: using the PV–WT–BT–CV system.
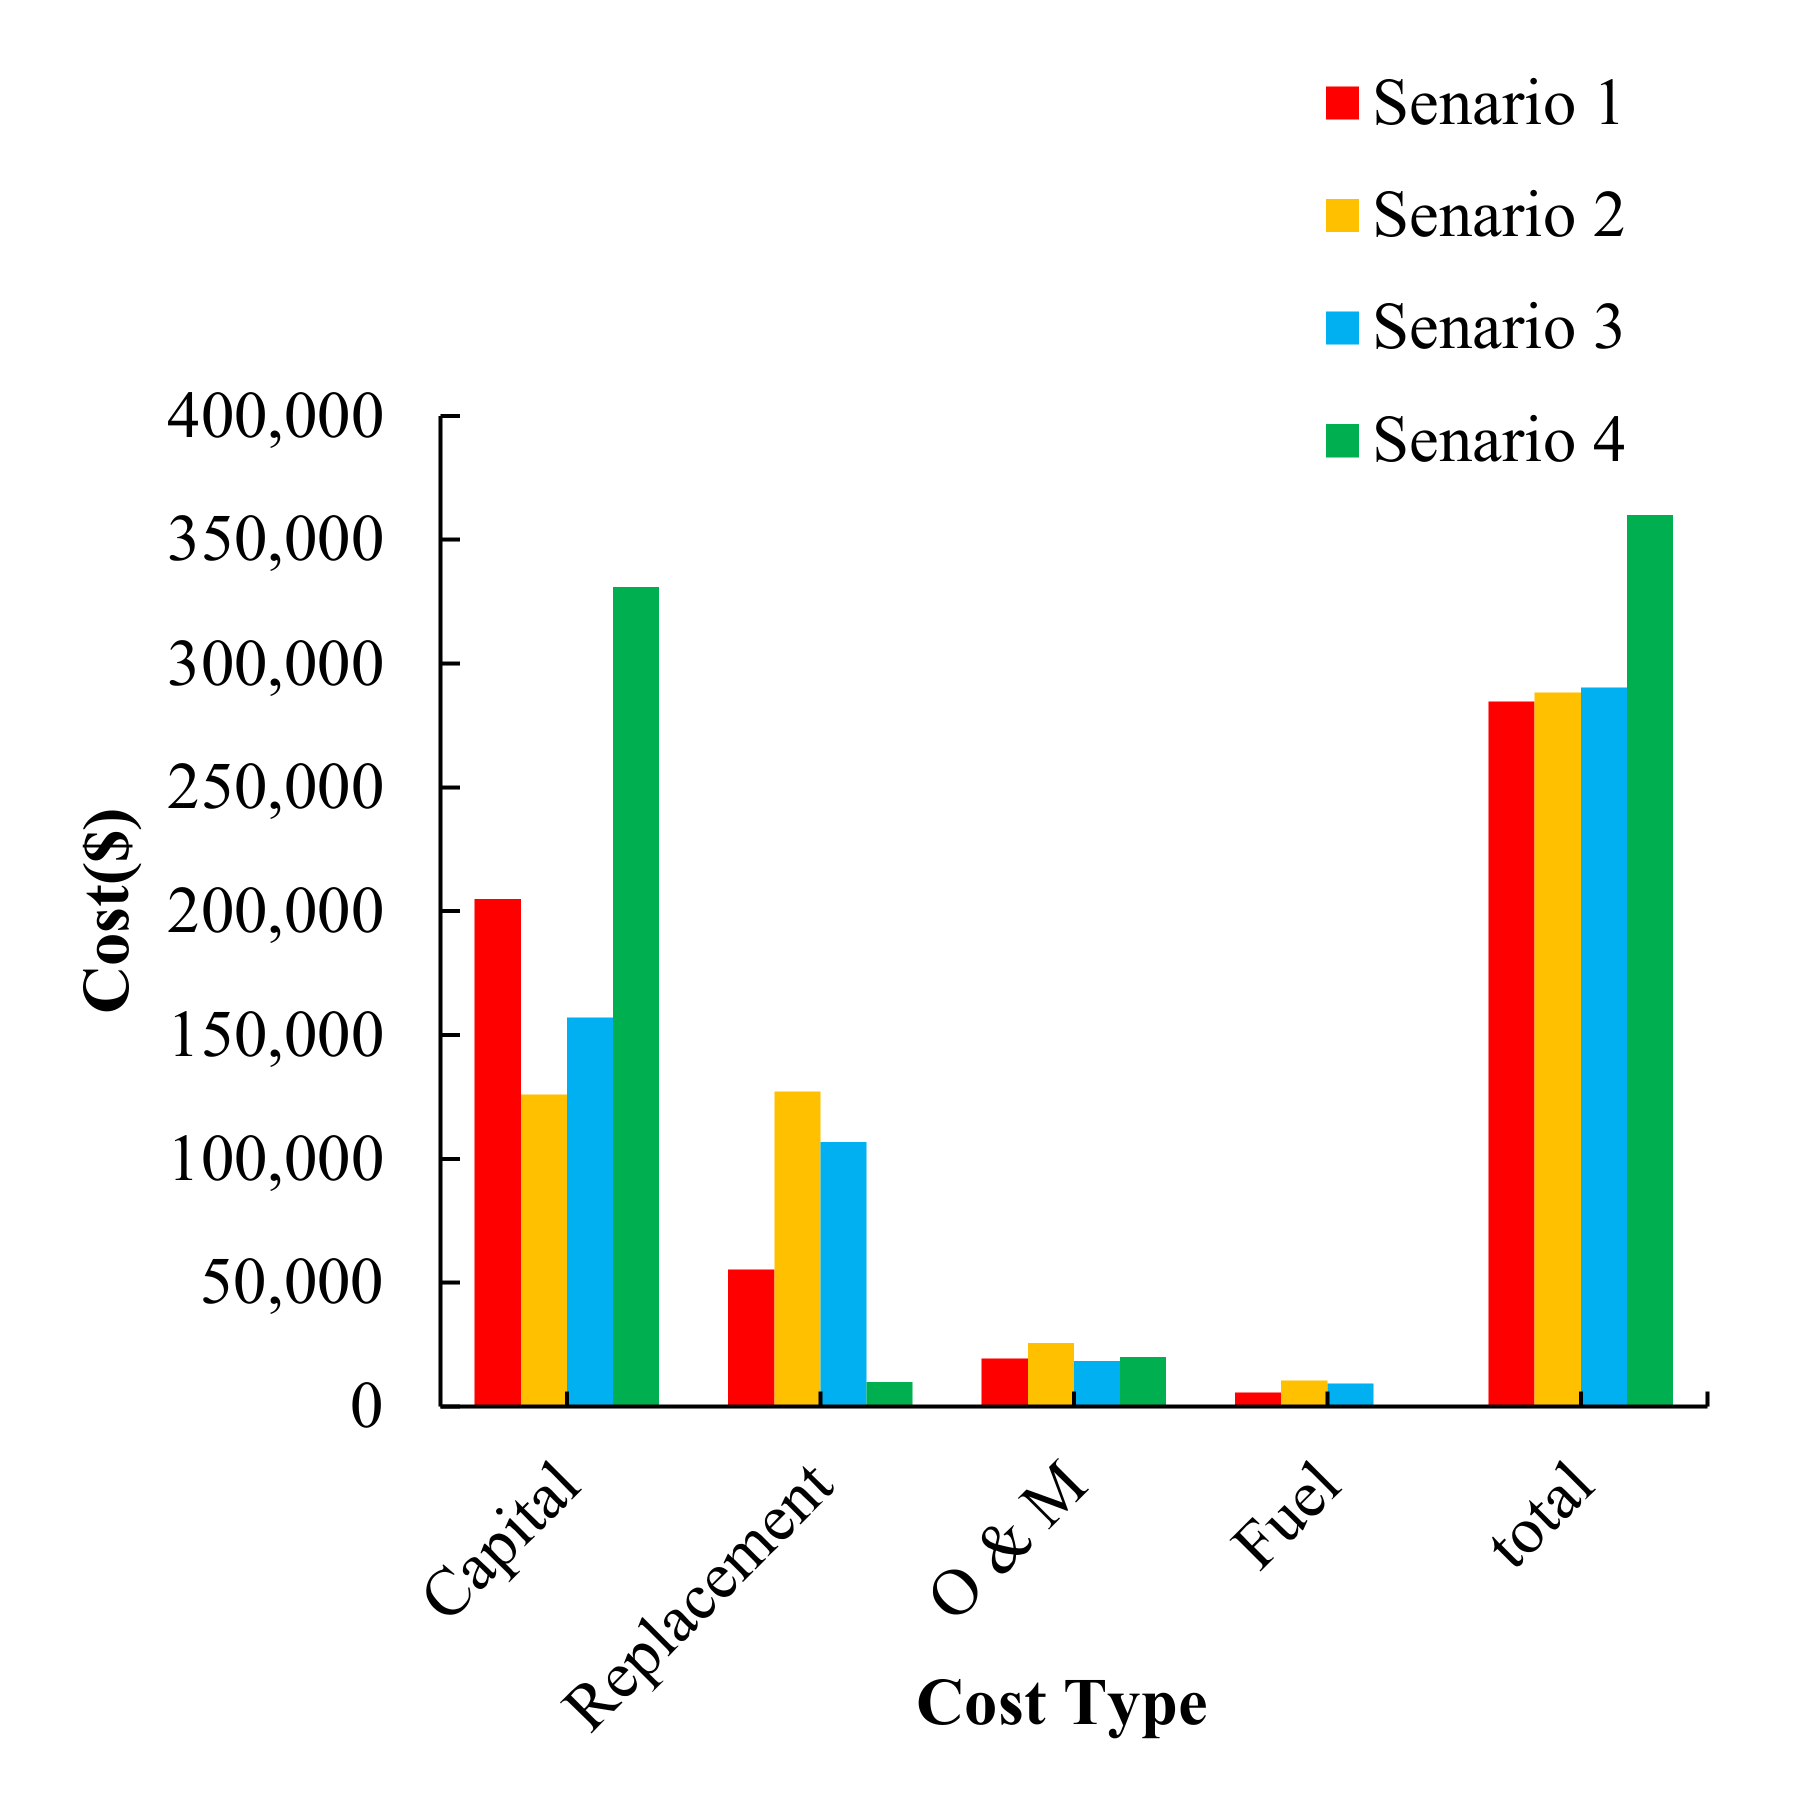
4.3. Economic Assessment
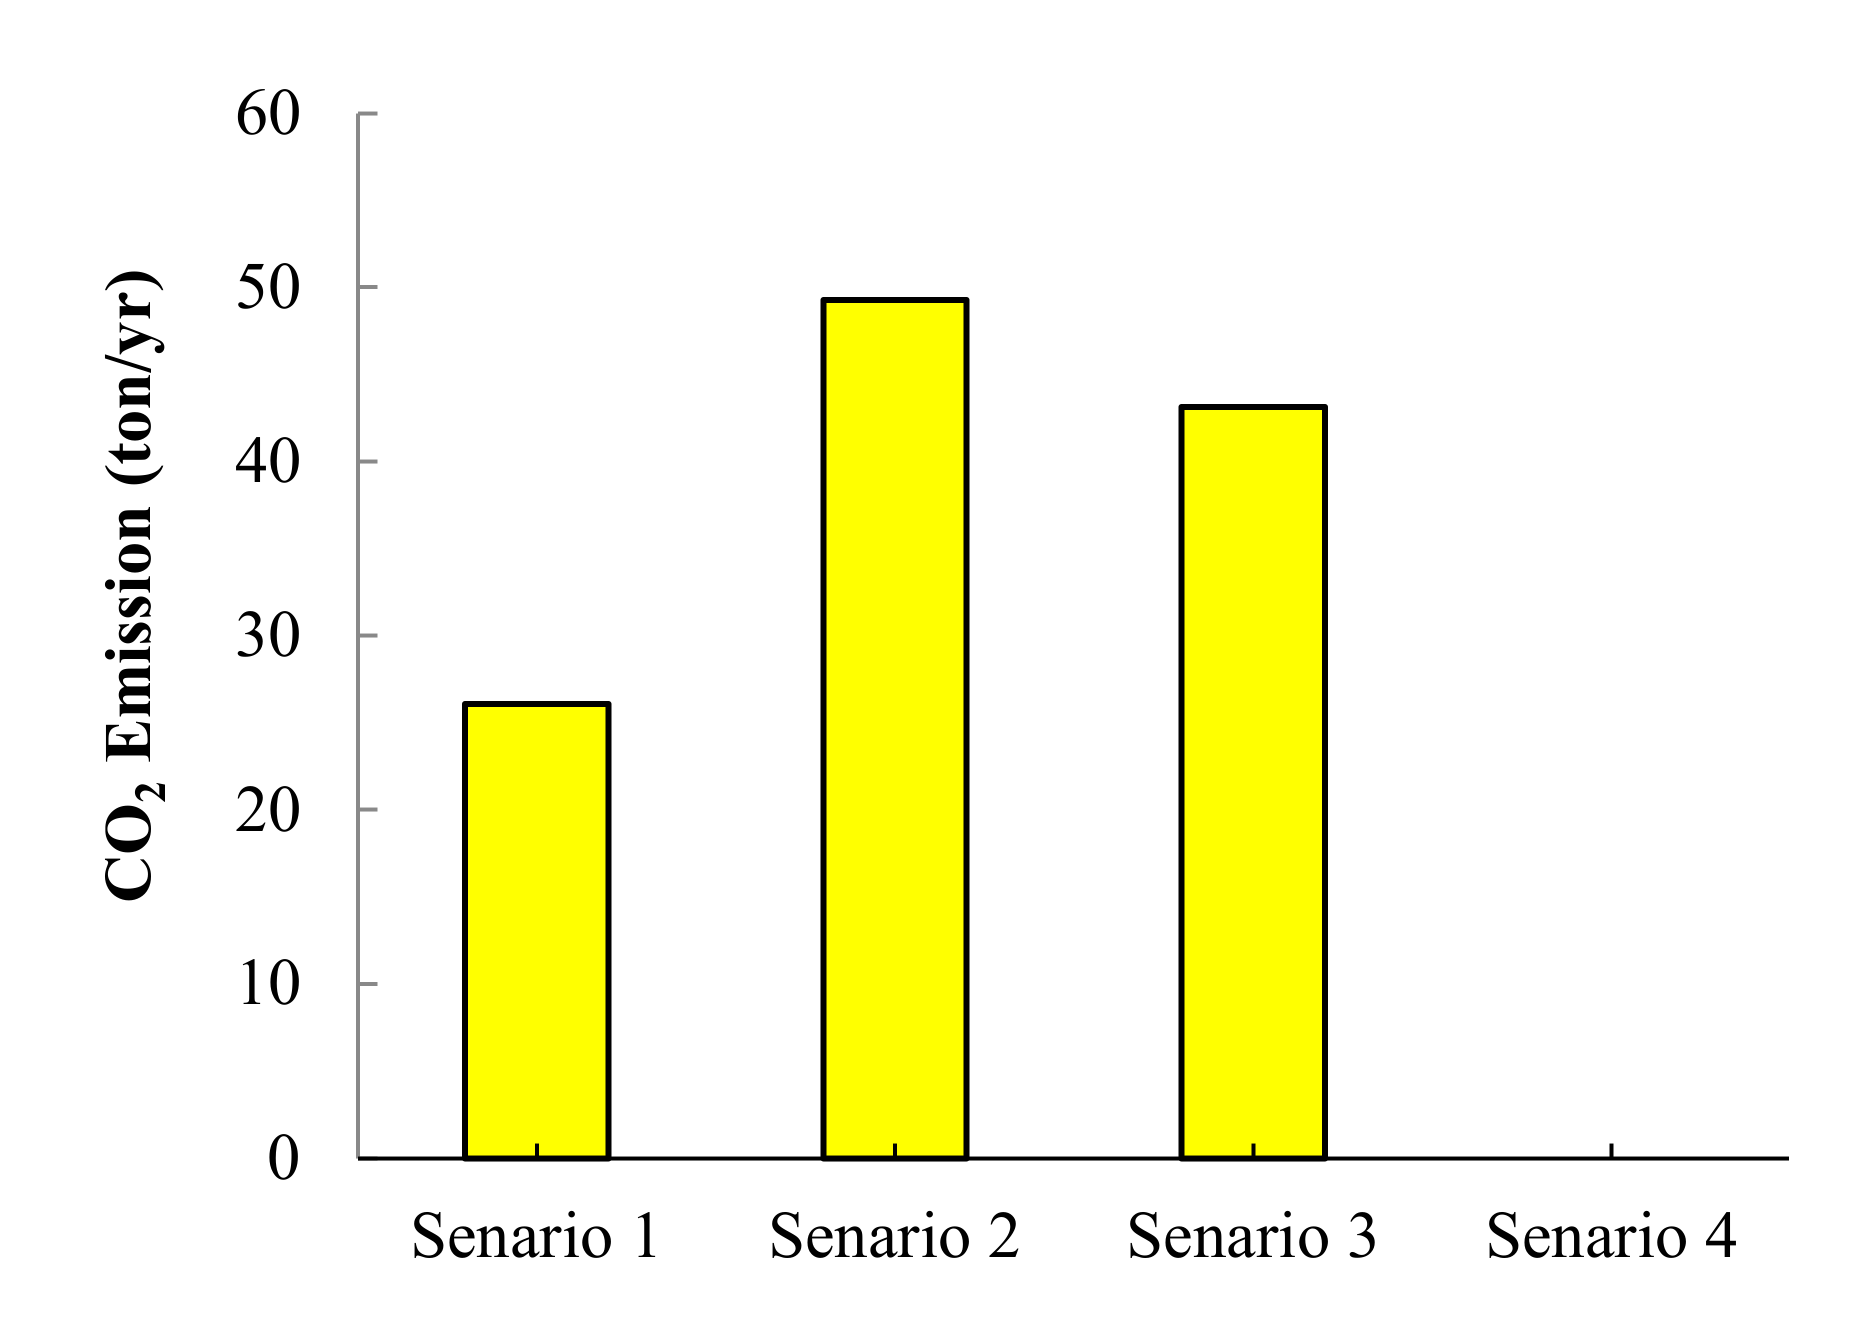
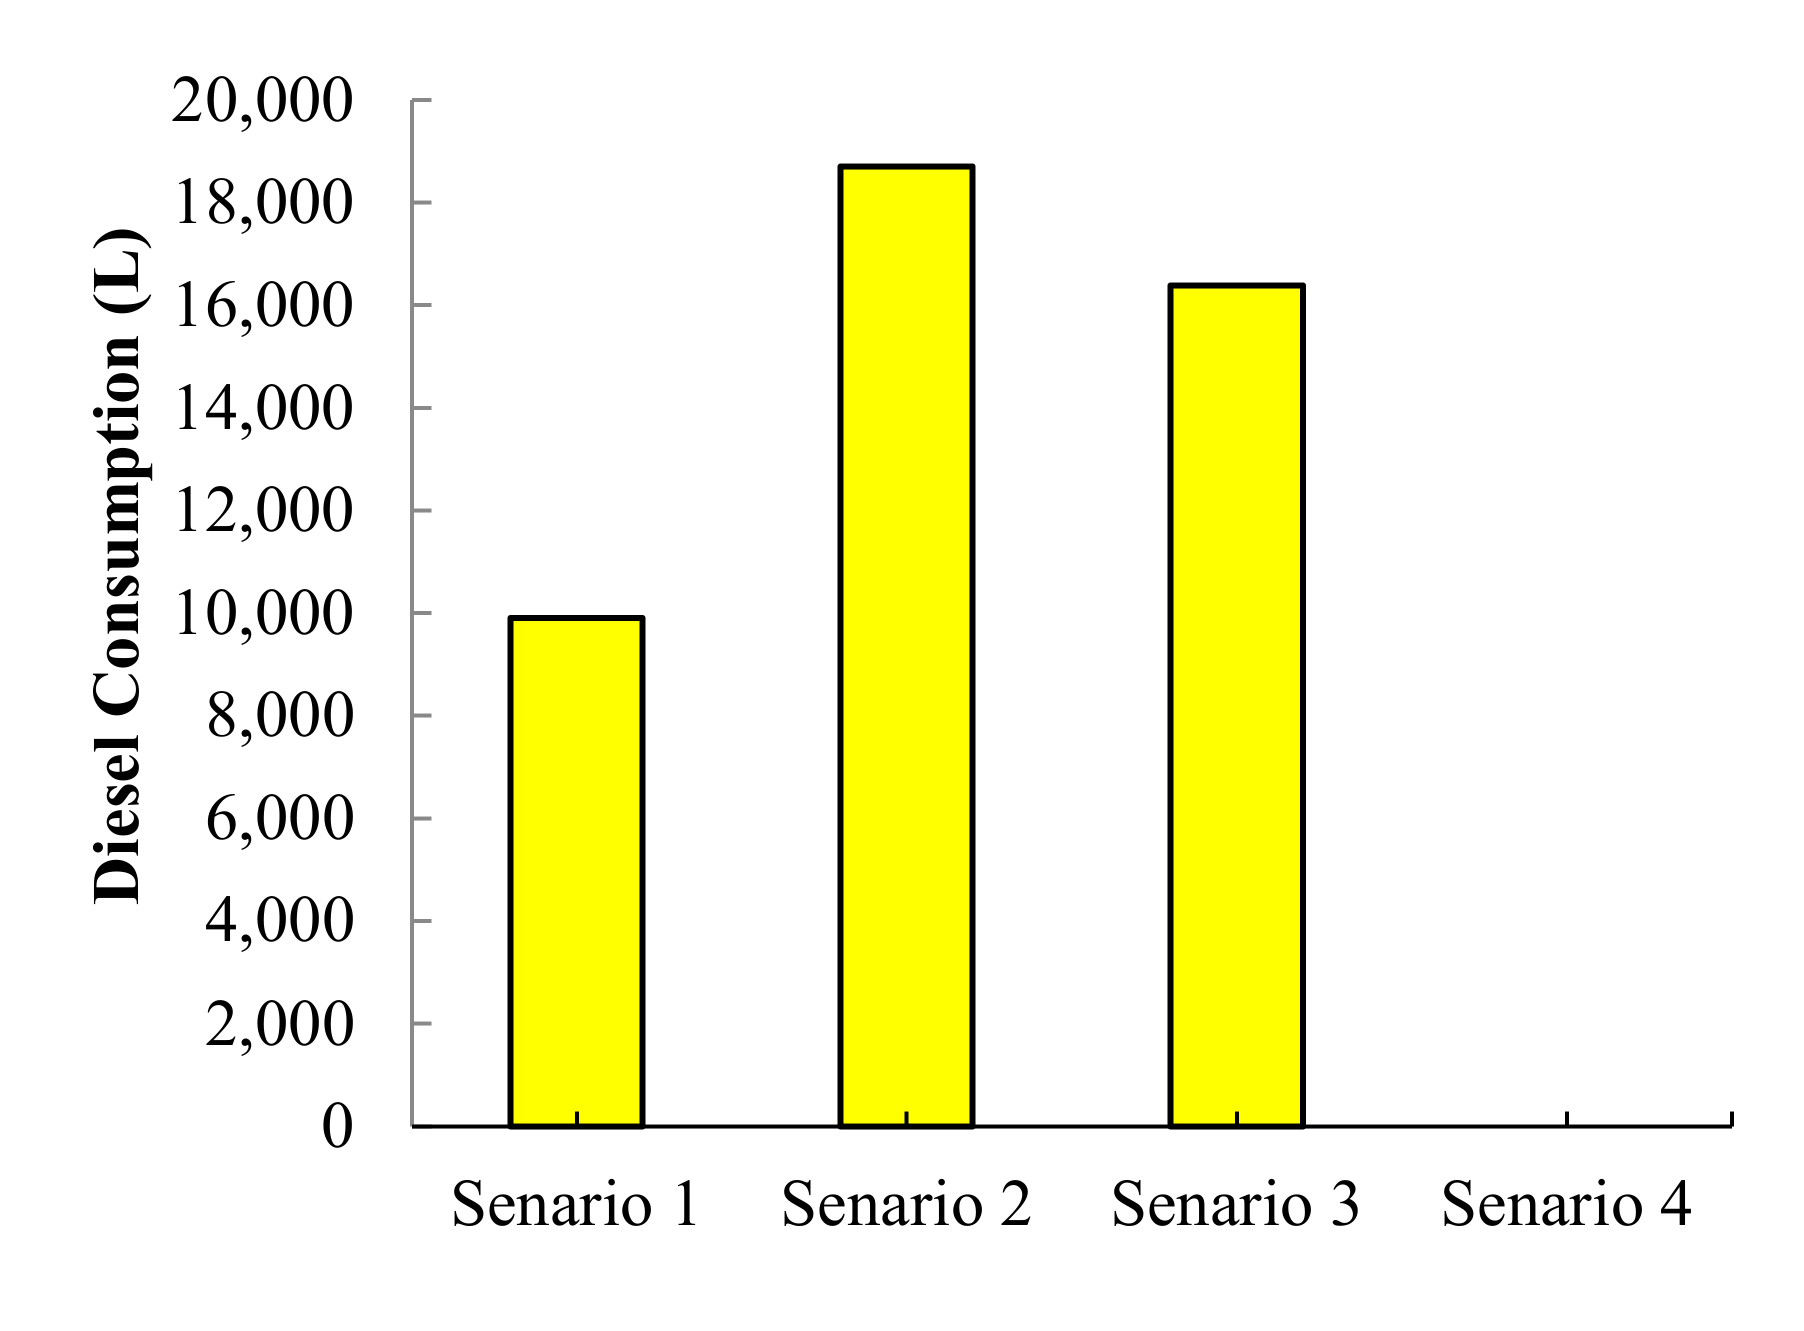
4.4. Environmental Assessment
4.5. Selecting the Best Scenario Using MCDM Methods
4.6. Assessment of Electricity Generation in the Best Scenario
4.7. Sensitivity Analysis
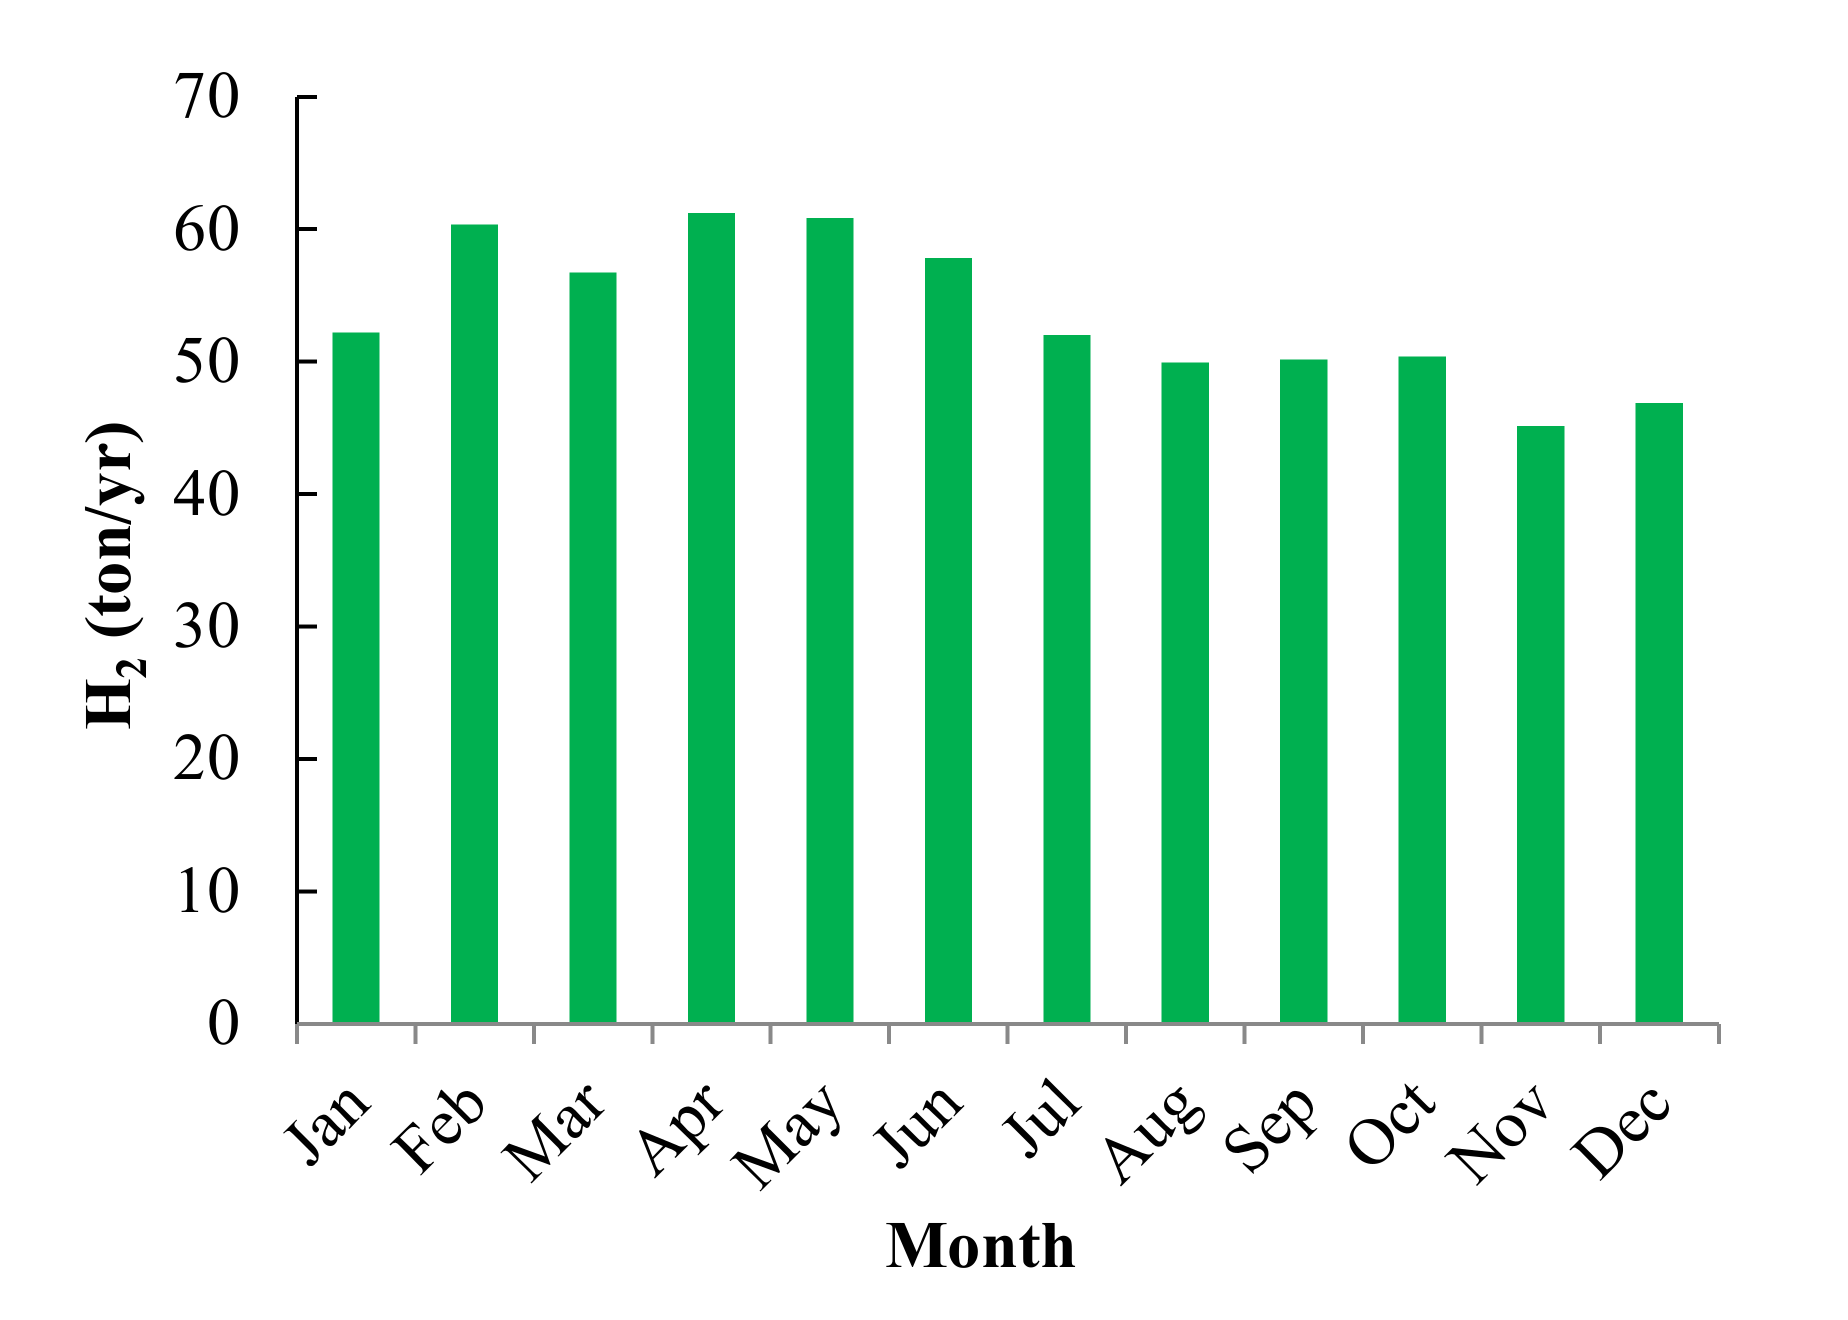
4.8. Hydrogen Production Potential
5. Conclusions and Recommendations
- The most suitable system configuration was found to be the one consisting of all defined components, specifically solar panels with a capacity of 10 kW, a wind turbine with a capacity of 20 kW, a converter with a capacity of 10 kW, 20 batteries, and a diesel generator with a capacity of 20 kW. For this configuration, NPC and LCOE were estimated to be $284,724 and 1.058 $/kWh respectively.
- The highest LCOE, 1.478 $/kWh, was related to the scenario in which no diesel generator was used, a result that can be attributed to the low price of diesel fuel in Iran and the necessity of using larger more expensive equipment in the renewable sub-systems of HRES to meet the demand without the diesel generator.
- The renewable fraction (RF) of the proposed PV–WT–CV–DG–BT system is 64%, and it consumes 19,175 L (approximately 34%) less fuel than the diesel system.
- The first scenario, i.e., the simultaneous use of the wind–solar system with a battery and converter and diesel generator support system, was recognized as the best scenario using SWARA–WASPAS hybrid methods.
- The results of sensitivity analysis showed that an increase in the price of diesel or a decrease in the area’s renewable energy potential will increase the final price of electricity (at worst, LCOE = 1.343 $/kWh), but the proposed system can still meet the demand of the region with high reliability.
- If the village becomes depopulated, the government can use the investment in the area’s renewable potential to produce hydrogen for the refineries of Hormozgan province. The hydrogen production potential of this area is about 643.63 ton-H2/year.
Author Contributions
Funding
Institutional Review Board Statement
Informed Consent Statement
Data Availability Statement
Acknowledgments
Conflicts of Interest
References
- Rashidi, M.; Sedaghat, A.; Misbah, B.; Sabati, M.; Vaidyan, K.; Mostafaeipour, A.; Dehshiri, S.S.H.; Almutairi, K.; Issakhov, A.; Oloomi, S.A.A.; et al. Simulation of Wellbore Drilling Energy Saving of Nanofluids Using an Experimental Taylor–Couette Flow System. J. Pet. Explor. Prod. Technol. 2021, 1–7. [Google Scholar] [CrossRef]
- Almutairi, K.; Mostafaeipour, A.; Baghaei, N.; Chowdhury, S.; Techato, K.; Jahangiri, M.; Rezaei, M.; Hosseini Dehshiri, S.J.; Goudarzi, H. Techno-Economic Investigation of using Solar Energy for Heating Swimming Pools in Buildings and Producing Hydrogen: A case study. Front. Energy Res. 2021, 9, 171. [Google Scholar] [CrossRef]
- Kalbasi, R.; Jahangiri, M.; Mosavi, A.; Dehshiri, S.J.; Dehshiri, S.S.; Ebrahimi, S.; Etezadi, Z.A.; Karimipour, A. Finding the best station in Belgium to use residential-scale solar heating, One-year dynamic simulation with considering all system losses: Economic analysis of using ETSW. Sustain. Energy Technol. Assess. 2021, 45, 101097. [Google Scholar] [CrossRef]
- Mostafaeipour, A.; Dehshiri, S.J.; Dehshiri, S.S.; Jahangiri, M. Prioritization of potential locations for harnessing wind energy to produce hydrogen in Afghanistan. Int. J. Hydrogen Energy 2020, 45, 33169–33184. [Google Scholar] [CrossRef]
- Mostafaeipour, A.; Jahangiri, M.; Haghani, A.; Dehshiri, S.J.H.; Dehshiri, S.S.H.; Issakhov, A.; Sedaghat, A.; Saghaei, H.; Akinlabi, E.T.; Sichilalu, S.M.; et al. Statistical evaluation of using the new generation of wind turbines in South Africa. Energy Rep. 2020, 6, 2816–2827. [Google Scholar] [CrossRef]
- Zarezade, M.; Mostafaeipour, A. Identifying the effective factors on implementing the solar dryers for Yazd province, Iran. Renew. Sustain. Energy Rev. 2016, 57, 765–775. [Google Scholar] [CrossRef]
- Mostafaeipour, A.; Dehshiri, S.J.; Dehshiri, S.S. Ranking locations for producing hydrogen using geothermal energy in Afghanistan. Int. J. Hydrog. Energy 2020, 45, 15924–15940. [Google Scholar] [CrossRef]
- Mostafaeipour, A.; Hosseini Dehshiri, S.J.; Hosseini Dehshiri, S.S.; Jahangiri, M.; Techato, K. A Thorough Analysis of Potential Geothermal Project Locations in Afghanistan. Sustainability 2020, 12, 8397. [Google Scholar] [CrossRef]
- Bahramara, S.; Moghaddam, M.P.; Haghifam, M. Optimal planning of hybrid renewable energy systems using HOMER: A review. Renew. Sustain. Energy Rev. 2016, 62, 609–620. [Google Scholar] [CrossRef]
- Almutairi, K.; Dehshiri, S.S.; Mostafaeipour, A.; Issakhov, A.; Techato, K.; Dhanraj, J.A. Performance optimization of a new flash-binary geothermal cycle for power/hydrogen production with zeotropic fluid. J. Therm. Anal. Calorim. 2021, 1–8. [Google Scholar] [CrossRef]
- Almutairi, K.; Hosseini Dehshiri, S.S.; Hosseini Dehshiri, S.J.; Mostafaeipour, A.; Jahangiri, M.; Techato, K. Technical, economic, carbon footprint assessment, and prioritizing stations for hydrogen production using wind energy: A case study. Energy Strategy Rev. 2021, 36, 100684. [Google Scholar] [CrossRef]
- HOMER V. 2. National Renewable Energy Laboratory (NREL), 1617 Cole Boulevard. Golden. CO 80401–3393. Available online: http://www.nrel.gov/homer (accessed on 14 January 2021).
- Almutairi, K.; Dehshiri, S.S.; Dehshiri, S.J.; Mostafaeipour, A.; Issakhov, A.; Techato, K. A thorough investigation for development of hydrogen projects from wind energy: A case study. Int. J. Hydrogen Energy 2021, 46, 18795–18815. [Google Scholar] [CrossRef]
- Olateju, B.; Monds, J.; Kumar, A. Large scale hydrogen production from wind energy for the upgrading of bitumen from oil sands. Appl. Energy 2014, 118, 48–56. [Google Scholar] [CrossRef]
- Alavi, O.; Mostafaeipour, A.; Qolipour, M. Analysis of hydrogen production from wind energy in the southeast of Iran. Int. J. Hydrog. Energy 2016, 41, 15158–15171. [Google Scholar] [CrossRef]
- Rezaei, M.; Mostafaeipour, A.; Qolipour, M.; Arabnia, H.R. Hydrogen production using wind energy from sea water: A case study on Southern and Northern coasts of Iran. Energy Environ. 2018, 29, 333–357. [Google Scholar] [CrossRef]
- Mostafaeipour, A.; Qolipour, M.; Goudarzi, H. Feasibility of using wind turbines for renewable hydrogen production in Firuzkuh, Iran. Front. Energy 2019, 13, 494–505. [Google Scholar] [CrossRef]
- Rezaei-Shouroki, M.; Mostafaeipour, A.; Qolipour, M. Prioritizing of wind farm locations for hydrogen production: A case study. Int. J. Hydrogen Energy 2017, 42, 9500–9510. [Google Scholar] [CrossRef]
- Guleria, A.; Bajaj, R.K. A robust decision-making approach for hydrogen power plant site selection utilizing (R, S)-Norm Pythagorean Fuzzy information measures based on VIKOR and TOPSIS method. Int. J. Hydrogen Energy 2020, 45, 18802–18816. [Google Scholar] [CrossRef]
- Muradov, N.Z.; Veziroǧlu, T.N. From hydrocarbon to hydrogen–carbon to hydrogen economy. Int. J. Hydrogen Energy 2005, 30, 225–237. [Google Scholar] [CrossRef]
- Abbasi, T.; Abbasi, S.A. Renewable hydrogen: Prospects and challenges. Renew. Sustain. Energy Rev. 2011, 15, 3034–3040. [Google Scholar] [CrossRef]
- AlZaharani, A.A.; Dincer, I.; Naterer, G.F. Performance evaluation of a geothermal based integrated system for power, hydrogen and heat generation. Int. J. Hydrogen Energy 2013, 38, 14505–14511. [Google Scholar] [CrossRef]
- Alamdari, P.; Nematollahi, O.; Alemrajabi, A.A. Solar energy potentials in Iran: A review. Renew. Sustain. Energy Rev. 2013, 21, 778–788. [Google Scholar] [CrossRef]
- Firouzjah, K.G. Assessment of small-scale solar PV systems in Iran: Regions priority, potentials and financial feasibility. Renew. Sustain. Energy Rev. 2018, 94, 267–274. [Google Scholar] [CrossRef]
- Alamdari, P.; Nematollahi, O.; Mirhosseini, M. Assessment of wind energy in Iran: A review. Renew. Sustain. Energy Rev. 2012, 16, 836–860. [Google Scholar] [CrossRef]
- Saeidi, D.; Mirhosseini, M.; Sedaghat, A.; Mostafaeipour, A. Feasibility study of wind energy potential in two provinces of Iran: North and South Khorasan. Renew. Sustain. Energy Rev. 2011, 15, 3558–3569. [Google Scholar] [CrossRef]
- Mostafaeipour, A.; Sedaghat, A.; Ghalishooyan, M.; Dinpashoh, Y.; Mirhosseini, M.; Sefid, M.; Pour-Rezaei, M. Evaluation of wind energy potential as a power generation source for electricity production in Binalood, Iran. Renew. Energy 2013, 52, 222–229. [Google Scholar] [CrossRef]
- Nematollahi, O.; Alamdari, P.; Jahangiri, M.; Sedaghat, A.; Alemrajabi, A.A. A techno-economical assessment of solar/wind resources and hydrogen production: A case study with GIS maps. Energy 2019, 175, 914–930. [Google Scholar] [CrossRef]
- Mostafaeipour, A.; Rezaei, M.; Moftakharzadeh, A.; Qolipour, M.; Salimi, M. Evaluation of hydrogen production by wind energy for agricultural and industrial sectors. Int. J. Hydrogen Energy 2019, 44, 7983–7995. [Google Scholar] [CrossRef]
- Mirhosseini, M.; Sharifi, F.; Sedaghat, A. Assessing the wind energy potential locations in province of Semnan in Iran. Renew. Sustain. Energy Rev. 2011, 15, 449–459. [Google Scholar] [CrossRef]
- Mostafaeipour, A. Feasibility study of harnessing wind energy for turbine installation in province of Yazd in Iran. Renew. Sustain. Energy Rev. 2010, 14, 93–111. [Google Scholar] [CrossRef]
- Mostafaeipour, A. Economic evaluation of small wind turbine utilization in Kerman, Iran. Energy Convers. Manag. 2013, 73, 214–225. [Google Scholar] [CrossRef]
- Rezaei, M.; Salimi, M.; Momeni, M.; Mostafaeipour, A. Investigation of the socio-economic feasibility of installing wind turbines to produce hydrogen: Case study. Int. J. Hydrogen Energy 2018, 43, 23135–23147. [Google Scholar] [CrossRef]
- Adaramola, M.S.; Agelin-Chaab, M.; Paul, S.S. Analysis of hybrid energy systems for application in southern Ghana. Energy Convers. Manag. 2014, 88, 284–295. [Google Scholar] [CrossRef]
- Bhakta, S.; Mukherjee, V. Performance indices evaluation and techno economic analysis of photovoltaic power plant for the application of isolated India’s island. Sustain. Energy Technol. Assess. 2017, 20, 9–24. [Google Scholar] [CrossRef]
- Olatomiwa, L.; Mekhilef, S.; Huda, A.; Ohunakin, O.S. Economic evaluation of hybrid energy systems for rural electrification in six geo-political zones of Nigeria. Renew. Energy 2015, 83, 435–446. [Google Scholar] [CrossRef]
- Rehman, S.; Al-Hadhrami, L.M. Study of a solar PV–diesel–battery hybrid power system for a remotely located population near Rafha, Saudi Arabia. Energy 2010, 35, 4986–4995. [Google Scholar] [CrossRef]
- Mahmoud, M.M.; Ibrik, I.H. Techno-economic feasibility of energy supply of remote villages in Palestine by PV-systems, diesel generators and electric grid. Renew. Sustain. Energy Rev. 2006, 10, 128–138. [Google Scholar] [CrossRef]
- Jahangiri, M.; Khosravi, A.; Raiesi, H.A.; Mostafaeipour, A. Analysis of standalone PV-based hybrid systems for power generation in Rural area. In Proceedings of the International Conference on Fundamental Research in Electrical Engineering, Tehran, Iran, 21 July 2017; pp. 1–10. [Google Scholar]
- Mostafaeipour, A.; Qolipour, M.; Rezaei, M.; Goudarzi, H. Techno-economic assessment of using wind power system for tribal region of Gachsaran in Iran. J. Eng. Des. Technol. 2019, 18, 293–307. [Google Scholar] [CrossRef]
- Das, B.K.; Hoque, N.; Mandal, S.; Pal, T.K.; Raihan, M.A. A techno-economic feasibility of a stand-alone hybrid power generation for remote area application in Bangladesh. Energy 2017, 134, 775–788. [Google Scholar] [CrossRef]
- Al-Sharafi, A.; Sahin, A.Z.; Ayar, T.; Yilbas, B.S. Techno-economic analysis and optimization of solar and wind energy systems for power generation and hydrogen production in Saudi Arabia. Renew. Sustain. Energy Rev. 2017, 69, 33–49. [Google Scholar] [CrossRef]
- Aghapouramin, K. Technical, Economical, and Environmental Feasibility of Hybrid Renewable Electrification Systems for off-Grid Remote Rural Electrification Areas for East Azerbaijan Province, Iran. Technol. Econ. Smart Grids Sustain. Energy 2020, 5, 1–20. [Google Scholar] [CrossRef]
- Razmjoo, A.; Kaigutha, L.G.; Rad, M.A.V.; Marzband, M.; Davarpanah, A.; Denai, M. A Technical analysis investigating energy sustainability utilizing reliable renewable energy sources to reduce CO2 emissions in a high potential area. Renew. Energy 2020, 164, 46–57. [Google Scholar] [CrossRef]
- Jahangiri, M.; Haghani, A.; Heidarian, S.; Mostafaeipour, A.; Raiesi, H.A.; Alidadi Shamsabadi, A. Sensitivity analysis of using solar cells in regional electricity power supply of off-grid power systems in Iran. J. Eng. Des. Technol. 2020, 18, 1849–1866. [Google Scholar] [CrossRef]
- Duffie, J.A.; Beckman, W.A. Solar Engineering of Thermal Processes; Wiley: New York, NY, USA, 1980. [Google Scholar]
- Ganoe, R.D.; Stackhouse, P.W., Jr.; DeYoung, R.J. RETScreen ® Plus Software Tutorial; Natl. Aeronaut. Space Adm. (NASA): Washington, DC, USA, 2014; pp. 3–27. [Google Scholar]
- Jahangiri, M.; Haghani, A.; Mostafaeipour, A.; Khosravi, A.; Raeisi, H.A. Assessment of solar-wind power plants in Afghanistan: A review. Renew. Sustain. Energy Rev. 2019, 99, 169–190. [Google Scholar] [CrossRef]
- Chang, T.P.; Liu, F.J.; Ko, H.H.; Cheng, S.P.; Sun, L.C.; Kuo, S.C. Comparative analysis on power curve models of wind turbine generator in estimating capacity factor. Energy 2014, 73, 88–95. [Google Scholar] [CrossRef]
- Salisu, S.; Mustafa, M.W.; Olatomiwa, L.; Mohammed, O.O. Assessment of technical and economic feasibility for a hybrid PV-wind-diesel-battery energy system in a remote community of north central Nigeria. Alex. Eng. J. 2019, 58, 1103–1118. [Google Scholar] [CrossRef]
- Jahangiri, M.; Haghani, A.; Shamsabadi, A.A.; Mostafaeipour, A.; Pomares, L.M. Feasibility study on the provision of electricity and hydrogen for domestic purposes in the south of Iran using grid-connected renewable energy plants. Energy Strategy Rev. 2019, 23, 23–32. [Google Scholar] [CrossRef]
- Jahangiri, M.; Nematollahi, O.; Sedaghat, A.; Saghafian, M. Techno-economical assessment of renewable energies integrated with fuel cell for off grid electrification: A case study for developing countries. J. Renew. Sustain. Energy 2015, 7, 023123. [Google Scholar] [CrossRef]
- Jahangiri, M.; Rizi, R.A.; Shamsabadi, A.A. Feasibility study on simultaneous generation of electricity and heat using renewable energies in Zarrin Shahr, Iran. Sustain. Cities Soc. 2018, 38, 647–661. [Google Scholar] [CrossRef]
- Global Petrol Prices. Available online: http://www.globalpetrolprices.com/diesel_prices (accessed on 4 January 2021).
- Hosseini Dehshiri, S.J. Using Gray Numbers Theory in Multi-Attribute Decision Making Methods for the Evaluation the Risk of Outsourcing of Information Technology Projects. IT Manag. Stud. 2019, 7, 167–198. [Google Scholar]
- Chaghooshi, A.; Arab, A.; Dehshiri, S. A fuzzy hybrid approach for project manager selection. Decis. Sci. Lett. 2016, 5, 447–460. [Google Scholar] [CrossRef]
- Hosseini Dehshiri, S.J.; Aghaei, M.; Taghavifard, M.T. Schematic Design of Hotel Recommendation Systems by user Precedence on Twitter. IT Manag. Stud. 2018, 7, 119–146. [Google Scholar] [CrossRef]
- Heidary, D.J.; Hosseini, D.S.J. Identify and prioritize Strategies to Reduce Plant Power Equipments Supply Chain Costs Through Value Engineering. J. Ind. Manag. Stud. 2019, 17, 125–152. [Google Scholar] [CrossRef]
- Hosseini Dehshiri, S.J.; Arab, A. ERP System Selection Using the Combination of SWARA and Gray ARAS Methods. IT Manag. Stud. 2017, 5, 73–103. [Google Scholar]
- Hoseini Dehshiri, S.J.; Aghaei, M. Identifying and Prioritizing Human Resources Risks through the Combination of SWARA and Gray ARAS. J. Hum. Resour. Stud. 2020, 10, 53–78. [Google Scholar]
- Amiri, M.; Hosseini Dehshiri, S.J.; Yousefi Hanoomarvar, A. Determining the Optimal Combination of Larg Supply Chain Strategies Using SWOT Analysis, Multi-criteria Decision-making Techniques and Game Theory. Ind. Manag. J. 2018, 10, 221–246. [Google Scholar]
- Heydari Dehooei, J.; Hosseini Dehshiri, S.J. Selecting project manager based on competency model using SWARA and WASPAS combined methods: Case of Pishgaman Kavir Yazd Cycas Park Project. Manag. Res. Iran 2019, 22, 47–72. [Google Scholar]
- Dahooie, J.H.; Dehshiri, S.J.; Banaitis, A.; Binkytė-Vėlienė, A. Identifying and prioritizing cost reduction solutions in the supply chain by integrating value engineering and gray multi-criteria decision-making. Technol. Econ. Dev. Econ. 2020, 26, 1311–1338. [Google Scholar] [CrossRef]
- Almutairi, K.; Mostafaeipour, A.; Jahanshahi, E.; Jooyandeh, E.; Himri, Y.; Jahangiri, M.; Issakhov, A.; Chowdhury, S.; Hosseini Dehshiri, S.J.; Hosseini Dehshiri, S.S.; et al. Ranking Locations for Hydrogen Production Using Hybrid Wind-Solar: A Case Study. Sustainability 2021, 13, 4524. [Google Scholar] [CrossRef]
- Mohaghar, A.; Hosseini Dehshiri, J.; Arab, A. Investigation and evaluation of project risks based on BWM. Organ. Resour. Manag. Res. 2017, 7, 157–173. [Google Scholar]
- Keršuliene, V.; Zavadskas, E.K.; Turskis, Z. Selection of rational dispute resolution method by applying new step-wise weight assessment ratio analysis (SWARA). J. Bus. Econ. Manag. 2010, 11, 243–258. [Google Scholar] [CrossRef]
- Zavadskas, E.K.; Turskis, Z.; Antucheviciene, J.; Zakarevicius, A. Optimization of weighted aggregated sum product assessment. Elektronika Elektrotechnika 2012, 122, 3–6. [Google Scholar] [CrossRef]
- Douak, M.; Settou, N. Estimation of hydrogen production using wind energy in Algeria. Energy Procedia 2015, 74, 981–990. [Google Scholar] [CrossRef] [Green Version]
- Viktorsson, L.; Heinonen, J.T.; Skulason, J.B.; Unnthorsson, R. A step towards the hydrogen Economy—A life cycle cost analysis of A hydrogen refueling station. Energies 2017, 10, 763. [Google Scholar] [CrossRef]
- Gökçek, M.; Kale, C. Techno-economical evaluation of a hydrogen refuelling station powered by Wind-PV hybrid power system: A case study for İzmir-Çeşme. Int. J. Hydrogen Energy 2018, 43, 10615–10625. [Google Scholar] [CrossRef]
- Moser, M.; Pecchi, M.; Fend, T. Techno-economic assessment of solar hydrogen production by means of thermo-chemical cycles. Energies 2019, 12, 352. [Google Scholar] [CrossRef] [Green Version]
- Moraes, T.S.; da Silva, H.N.C.; Zotes, L.P.; Mattos, L.V.; Borges, L.E.P.; Farrauto, R.; Noronha, F.B. A techno-economic evaluation of the hydrogen production for energy generation using an ethanol fuel processor. Int. J. Hydrogen Energy 2019, 44, 21205–21219. [Google Scholar] [CrossRef]
- Minutillo, M.; Perna, A.; Forcina, A.; Di Micco, S.; Jannelli, E. Analyzing the levelized cost of hydrogen in refueling stations with on-site hydrogen production via water electrolysis in the Italian scenario. Int. J. Hydrogen Energy 2021, 46, 13667–13677. [Google Scholar] [CrossRef]
- Niaz, H.; Lakouraj, M.M.; Liu, J. Techno-economic feasibility evaluation of a standalone solar-powered alkaline water electrolyzer considering the influence of battery energy storage system: A Korean case study. Korean J. Chem. Eng. 2021, 1–4. [Google Scholar] [CrossRef]
- Hacke, P.; Terwilliger, K.; Koch, S.; Weber, T.; Berghold, J.; Hoffmann, S.; Koehl, M.; Dietrich, S.; Ebert, M.; Mathiak, G. Results of IEC 62804 draft round robin testing. NREL Rep. 2013. Available online: https://www.osti.gov/biblio/1095398 (accessed on 4 January 2021).


| Parameters | Value |
|---|---|
| Project lifetime | 25 Years |
| Diesel price [54] | 0.102 $/L |
| Annual real interest rate [51] | 18% |
| Configuration | PV (kW) | WT (kW) | DG (kW) | BT (Unit) | CV (kW) | Initial Cost ($) | Operating Cost ($/Year) | NPC ($) | LCOE ($/kWh) | RF (%) |
|---|---|---|---|---|---|---|---|---|---|---|
| PV–WT–DG–BT–CV | 10 | 20 | 20 | 20 | 10 | $205,000 | 14,583 | $284,724 | 1.058 | 0.64 |
| WT–DG–BT–CV | 20 | 20 | 10 | 10 | $126,000 | 29,695 | $288,338 | 1.072 | 0.29 | |
| PV–DG–BT–CV | 10 | 20 | 10 | 10 | $157,000 | 24,391 | $290,343 | 1.079 | 0.37 | |
| DG | 20 | $70,000 | 45,253 | $317,394 | 1.18 | 0 | ||||
| WT–DG | 10 | 20 | 10 | $97,000 | 46,622 | $351,877 | 1.308 | 0.12 | ||
| PV–WT-BT–CV | 30 | 20 | 70 | 20 | $331,000 | 5309 | $360,023 | 1.338 | 1 | |
| PV–DG–CV | 10 | 20 | 10 | $147,000 | 44,187 | $388,569 | 1.444 | 0.27 | ||
| PV-BT–CV | 40 | 80 | 20 | $372,000 | 4656 | $397,453 | 1.478 | 1 |
| Criteria | Average Relative Importance | |||
|---|---|---|---|---|
| NPC | 1 | 1 | 1 | 0.42 |
| LCOE | 0.6 | 1.6 | 0.625 | 0.263 |
| Total investment | 0.7 | 1.7 | 0.368 | 0.154 |
| Replacement | 0.76 | 1.76 | 0.209 | 0.088 |
| RF | 0.8 | 1.8 | 0.116 | 0.049 |
| CO2 (ton/yr) | 0.86 | 1.86 | 0.062 | 0.026 |
| City | Qi | Pi | WPSi | Rank |
|---|---|---|---|---|
| Scenario I | 0.8257 | 5.6842 | 3.2550 | 1 |
| Scenario II | 0.8501 | 5.6349 | 3.2425 | 2 |
| Scenario III | 0.8203 | 5.6236 | 3.2220 | 4 |
| Scenario IV | 0.7615 | 5.7077 | 3.2346 | 3 |
| Sensitive Code | SR (kWh/m2/d) | WS10 m (m/s) | Diesel Price ($/L) | Operating Cost ($/yr) | NPC ($) | LCOE ($/kWh) | RF(%) |
|---|---|---|---|---|---|---|---|
| 1 | 5.6 | 3.232 | 0.102 | 14,583 | $284,724 | 1.058 | 0.64 |
| 2 | 5.6 | 3.232 | 0.133 | 14,890 | $286,402 | 1.064 | 0.64 |
| 3 | 5.6 | 3.232 | 0.202 | 15,573 | $290,137 | 1.078 | 0.64 |
| 4 | 5.6 | 2.75 | 0.102 | 18,439 | $305,806 | 1.136 | 0.54 |
| 5 | 5.6 | 2.75 | 0.133 | 18,816 | $307,864 | 1.144 | 0.54 |
| 6 | 5.6 | 2.75 | 0.202 | 19,654 | $312,446 | 1.161 | 0.54 |
| 7 | 5.6 | 2.262 | 0.102 | 21,588 | $323,020 | 1.2 | 0.46 |
| 8 | 5.6 | 2.262 | 0.133 | 22,022 | $325,392 | 1.209 | 0.46 |
| 9 | 5.6 | 2.262 | 0.202 | 22,988 | $330,673 | 1.229 | 0.46 |
| 10 | 4.76 | 3.232 | 0.102 | 16,708 | $296,340 | 1.101 | 0.59 |
| 11 | 4.76 | 3.232 | 0.133 | 17,052 | $298,221 | 1.108 | 0.59 |
| 12 | 4.76 | 3.232 | 0.202 | 17,818 | $302,407 | 1.124 | 0.59 |
| 13 | 4.76 | 2.75 | 0.102 | 20,793 | $318,674 | 1.184 | 0.48 |
| 14 | 4.76 | 2.75 | 0.133 | 21,210 | $320,955 | 1.193 | 0.48 |
| 15 | 4.76 | 2.75 | 0.202 | 22,139 | $326,034 | 1.212 | 0.48 |
| 16 | 4.76 | 2.262 | 0.102 | 24,134 | $336,941 | 1.252 | 0.4 |
| 17 | 4.76 | 2.262 | 0.133 | 24,612 | $339,553 | 1.262 | 0.4 |
| 18 | 4.76 | 2.262 | 0.202 | 25,676 | $345,367 | 1.283 | 0.4 |
| 19 | 3.92 | 3.232 | 0.102 | 19,102 | $309,431 | 1.15 | 0.53 |
| 20 | 3.92 | 3.232 | 0.133 | 19,488 | $311,539 | 1.158 | 0.53 |
| 21 | 3.92 | 3.232 | 0.202 | 20,346 | $316,231 | 1.175 | 0.53 |
| 22 | 3.92 | 2.75 | 0.102 | 23,423 | $333,049 | 1.238 | 0.42 |
| 23 | 3.92 | 2.75 | 0.133 | 23,885 | $335,578 | 1.247 | 0.42 |
| 24 | 3.92 | 2.75 | 0.202 | 24,915 | $341,207 | 1.268 | 0.42 |
| 25 | 3.92 | 2.262 | 0.102 | 26,904 | $352,079 | 1.308 | 0.34 |
| 26 | 3.92 | 2.262 | 0.133 | 27,429 | $354,951 | 1.319 | 0.34 |
| 27 | 3.92 | 2.262 | 0.202 | 28,598 | $361,342 | 1.343 | 0.34 |
| Research | Case Study | Resource | LCOH |
|---|---|---|---|
| Viktorsson, Heinonen [69] | Halle, Belgium | Wind–solar–grid | 10.3 €/kg |
| Gökçek and Kale [70] | İzmir-Çeşme, Turkey | Wind–solar | 7.526–7.866 $/kg |
| Moser, Pecchi [71] | Almeria, Spain | Solar–CSP | 13.06–38.83 €/kg |
| Moraes, Cozendey da Silva [72] | Brazil | Ethanol fuel processor | 8.87 $/kg |
| Minutillo, Perna [73] | Italy | Solar–PV | 9.29–12.48 €/kg |
| Niaz, Lakouraj [74] | Korean | Solar–PV | 9.55–11.67 $/kg |
| Present scenario | Remote area in Iran | Wind–solar | 5.53 $/kg |
Publisher’s Note: MDPI stays neutral with regard to jurisdictional claims in published maps and institutional affiliations. |
© 2021 by the authors. Licensee MDPI, Basel, Switzerland. This article is an open access article distributed under the terms and conditions of the Creative Commons Attribution (CC BY) license (https://creativecommons.org/licenses/by/4.0/).
Share and Cite
Almutairi, K.; Hosseini Dehshiri, S.S.; Hosseini Dehshiri, S.J.; Mostafaeipour, A.; Issakhov, A.; Techato, K. Use of a Hybrid Wind—Solar—Diesel—Battery Energy System to Power Buildings in Remote Areas: A Case Study. Sustainability 2021, 13, 8764. https://doi.org/10.3390/su13168764
Almutairi K, Hosseini Dehshiri SS, Hosseini Dehshiri SJ, Mostafaeipour A, Issakhov A, Techato K. Use of a Hybrid Wind—Solar—Diesel—Battery Energy System to Power Buildings in Remote Areas: A Case Study. Sustainability. 2021; 13(16):8764. https://doi.org/10.3390/su13168764
Chicago/Turabian StyleAlmutairi, Khalid, Seyyed Shahabaddin Hosseini Dehshiri, Seyyed Jalaladdin Hosseini Dehshiri, Ali Mostafaeipour, Alibek Issakhov, and Kuaanan Techato. 2021. "Use of a Hybrid Wind—Solar—Diesel—Battery Energy System to Power Buildings in Remote Areas: A Case Study" Sustainability 13, no. 16: 8764. https://doi.org/10.3390/su13168764
APA StyleAlmutairi, K., Hosseini Dehshiri, S. S., Hosseini Dehshiri, S. J., Mostafaeipour, A., Issakhov, A., & Techato, K. (2021). Use of a Hybrid Wind—Solar—Diesel—Battery Energy System to Power Buildings in Remote Areas: A Case Study. Sustainability, 13(16), 8764. https://doi.org/10.3390/su13168764