Article

Measurements of the Emissions of a “Golden” Vehicle at Seven Laboratories with Portable Emission Measurement Systems (PEMS)

1
European Commission—Joint Research Centre (JRC), via E. Fermi 2749, 21027 Ispra, Italy
2
Innovhub-Stazioni Sperimentali per l’Industria, via G. Galilei 1, 20097 San Donato Milanese, Italy
3
CUNA, Corso Galileo Ferraris 61, 10128 Torino, Italy
*
Author to whom correspondence should be addressed.
Sustainability 2021, 13(16), 8762; https://doi.org/10.3390/su13168762
Submission received: 16 July 2021 / Revised: 22 July 2021 / Accepted: 2 August 2021 / Published: 5 August 2021
(This article belongs to the Special Issue Emissions from Road Transportation and Vehicle Management)

Abstract

:
In the last years, the in-use emissions of vehicles are measured on the road with portable emissions measurement systems (PEMS). PEMS cannot measure as accurately as the laboratory grade equipment, and studies on their measurement uncertainty have continued since their appearance in the market. In this study we compared PEMS to laboratory grade equipment in Italian laboratories testing a diesel “Golden” (i.e., reference) vehicle for two consecutive years. The results showed equal means of PEMS and laboratory grade equipment for carbon dioxide (CO2), nitrogen oxides (NOx), and particle number (PN), with a variability of ±5 g/km for CO2, ±10 mg/km for NOx, and ±1 × 10¹¹ p/km for PN, which further decreased in the second year. For carbon monoxide (CO), the PEMS were on average 5–20 mg/km higher than the bags (variability ±40 mg/km). The main conclusion of this study is that PEMS are accurate under controlled laboratory ambient conditions, without any indications of significant bias.

1. Introduction

Before entering the market, vehicles have to be type-approved, demonstrating that they fulfill the emission limits set in the regulations. The emissions under real-life operation, though, are typically assessed by tunnel measurements [1], chasing tests (i.e., following cars with a mobile laboratory), on-road measurements with portable systems, or even laboratory measurements simulating real-world routes [2]. The differences between type-approval and on-road values of vehicles was a big topic a few years ago in the European Union (EU), not only for pollutants emissions [3,4], but also for fuel consumption and CO2 [5]. The situation significantly improved with the assessment of the vehicles on the road [6]. As outlined in the European Green Deal, a 90% cut in emissions by 2050 is planned, delivered by a smart, competitive, safe, accessible, and affordable transport system. By 2030 at least 30 million zero-emission cars will be in operation on European roads, and by 2050 nearly all cars, vans, buses as well as new heavy-duty vehicles will be zero-emission. For transport to become sustainable, boosting the uptake of zero-emission vehicles, renewable and low-carbon fuels and related infrastructure are necessary, among other strategies, along with an improved urban mobility [7,8,9]. As announced in the recent Communication on the Sustainable and Smart Mobility Strategy, the Commission will strengthen the carbon dioxide standards for cars and vans and will propose more stringent air pollutant emissions standards for combustion-engine vehicles (Euro 7). The on-road assessment of the vehicle emissions with portable emissions measurement systems (PEMS) for regulatory purposes started in the United States of America (USA) in 2005 for the in-use testing of heavy-duty engines. In Europe, on-road testing of heavy-duty vehicles with PEMS was introduced with Regulation (EU) No 582/2011, and of light-duty vehicles with Regulation (EU) No 2016/427 [10].
In the EU, since 2017, vehicles have to respect the respective (laboratory) limits also on the road and under a normal operation of use. However, the limits take into account the additional measurement uncertainty of PEMS compared to the laboratory equipment, with a so-called conformity factor. There have been different approaches to assess the measurement uncertainty of PEMS. For example, in the USA all expected sources of PEMS measurement errors were quantified using a series of controlled laboratory experiments [11]. Later, in the USA, a portable dilution tunnel with laboratory grade equipment was used to assess PEMS on the road [12]. In Europe, a theoretical approach was used considering the technical specifications in the regulation [13]. Others have compared PEMS with laboratory grade equipment on chassis dynamometers [14]. A few years ago, we conducted an inter-laboratory comparison exercise including a “Golden” gasoline vehicle and a “Golden” PEMS (i.e., a reference vehicle and a reference system tested at all laboratories) [15]. In some of these approaches the conclusions cannot be easily extrapolated due to the limited number of PEMS used. The PEMS uncertainty topic is of high importance not only for the latest technology vehicles, but also for future technologies. The reason is that the future Euro 7 limits will be lower, and it has been argued that they will approach the PEMS measurement accuracy. A theoretical study showed that at 20 mg/km (one fourth of the current nitrogen oxides NOx limit), the uncertainty could be 12–27 mg/km [13].
In this study we followed a slightly different approach to assess the PEMS uncertainty. A “Golden” diesel vehicle was tested in many laboratories, and the participating laboratories measured the emissions of the vehicle with the laboratory grade equipment and their own PEMS. The novelty of the study is that using the same vehicle at all laboratories, but different PEMS, the accuracy of the equipment can be better determined. In particular, the analysis of the data will give repeatability and reproducibility values for both laboratory grade equipment and PEMS. Furthermore, by using the differences between PEMS and laboratory grade equipment, the PEMS uncertainty will be estimated. The results of this study can help regulators to better assess the current permissible differences between PEMS and laboratory equipment, and can help researchers to better interpret the results of their PEMS when conducting on-road tests.

2. Materials and Methods

The inter-laboratory comparison exercises (ILCEs) with PEMS were conducted in 2018 (November 2018 to July 2019) and 2019 (September 2019 to June 2020) with the same diesel “Golden” reference vehicle. They were part of larger exercises with more participants measuring only with the regulated method (bags from the dilution tunnel), organized by CUNA (Commissione Tecnica di Unificazione nell’Autoveicolo). CUNA is the Italian standardization body for automotive, federated to UNI (Ente Nazionale Italiano di Unificazione), the Italian standardization body. CUNA, as a proficiency testing provider, organizes annually inter-laboratory activities among Italian laboratories.

2.1. Laboratories

Table 1 summarizes the number of participating laboratories at the larger ILCEs (in 2018 and 2019) and the laboratories that additionally used their own PEMS. They were all located in Italy and included OEMs (original equipment manufacturer), institutes, and universities. Due to confidentiality issues, the critical topic of PEMS uncertainty, and the many laboratories involved, it took one year from the last test until the publication of results.

2.2. Test Protocol

All laboratories conducted three repetitions of the cold start worldwide harmonized light-duty test cycle (WLTC) with pre-defined road-loads and gear shift strategy, as described in the European Union (EU) regulation. The emissions were determined from bags collecting diluted exhaust gas from the dilution tunnel during the test cycle. For particle number emissions, real time analyzers have been used directly at the dilution tunnel. Some of the laboratories (7 in 2018 and 6 in 2019) connected their own PEMS at the tailpipe during the measurements. The Regulation (EU) 2017/1151 defines the permissible tolerances of the differences of gas PEMS to the bag results (e.g., for CO2 the limits are 10 g/km or 10%, whichever is larger) and Regulation (EU) 2017/1154 for particle number (50% or 1 × 10¹¹ p/km, whichever is larger). This “validation” test is done optionally to confirm the proper installation and operation of the PEMS. To verify the vehicle stability, the first laboratory conducted tests at the start, in the middle, and at the end of the exercises. No statistically significant differences were found.

2.3. PEMS

Only one laboratory (from the five that were common in the two ILCEs) used the Horiba (Kyoto, Japan) OBS-ONE, which measures CO2 and carbon monoxide CO with heated NDIR (non-dispersive infrared detection), NOx with heated CLD (chemiluminescence detection), and particle number with CPC (condensation particle counter) after a hot catalytic stripper [16].
The other laboratories used the AVL (Graz, Austria) MOVE, which measures CO2 and CO with NDIR, NOx with NDUV (non-dispersive ultraviolet) [12], and particle number with DC (diffusion charger) after a hot catalytic stripper [10]. Exhaust flow meters of 2 or 2.5 inches were fitted. It should be mentioned that the laboratory particle number systems have only evaporation tubes (i.e., no catalytic stripper), but for the size range of this study (>23 nm) no differences are expected [17].

2.4. Golden Vehicle and Fuel
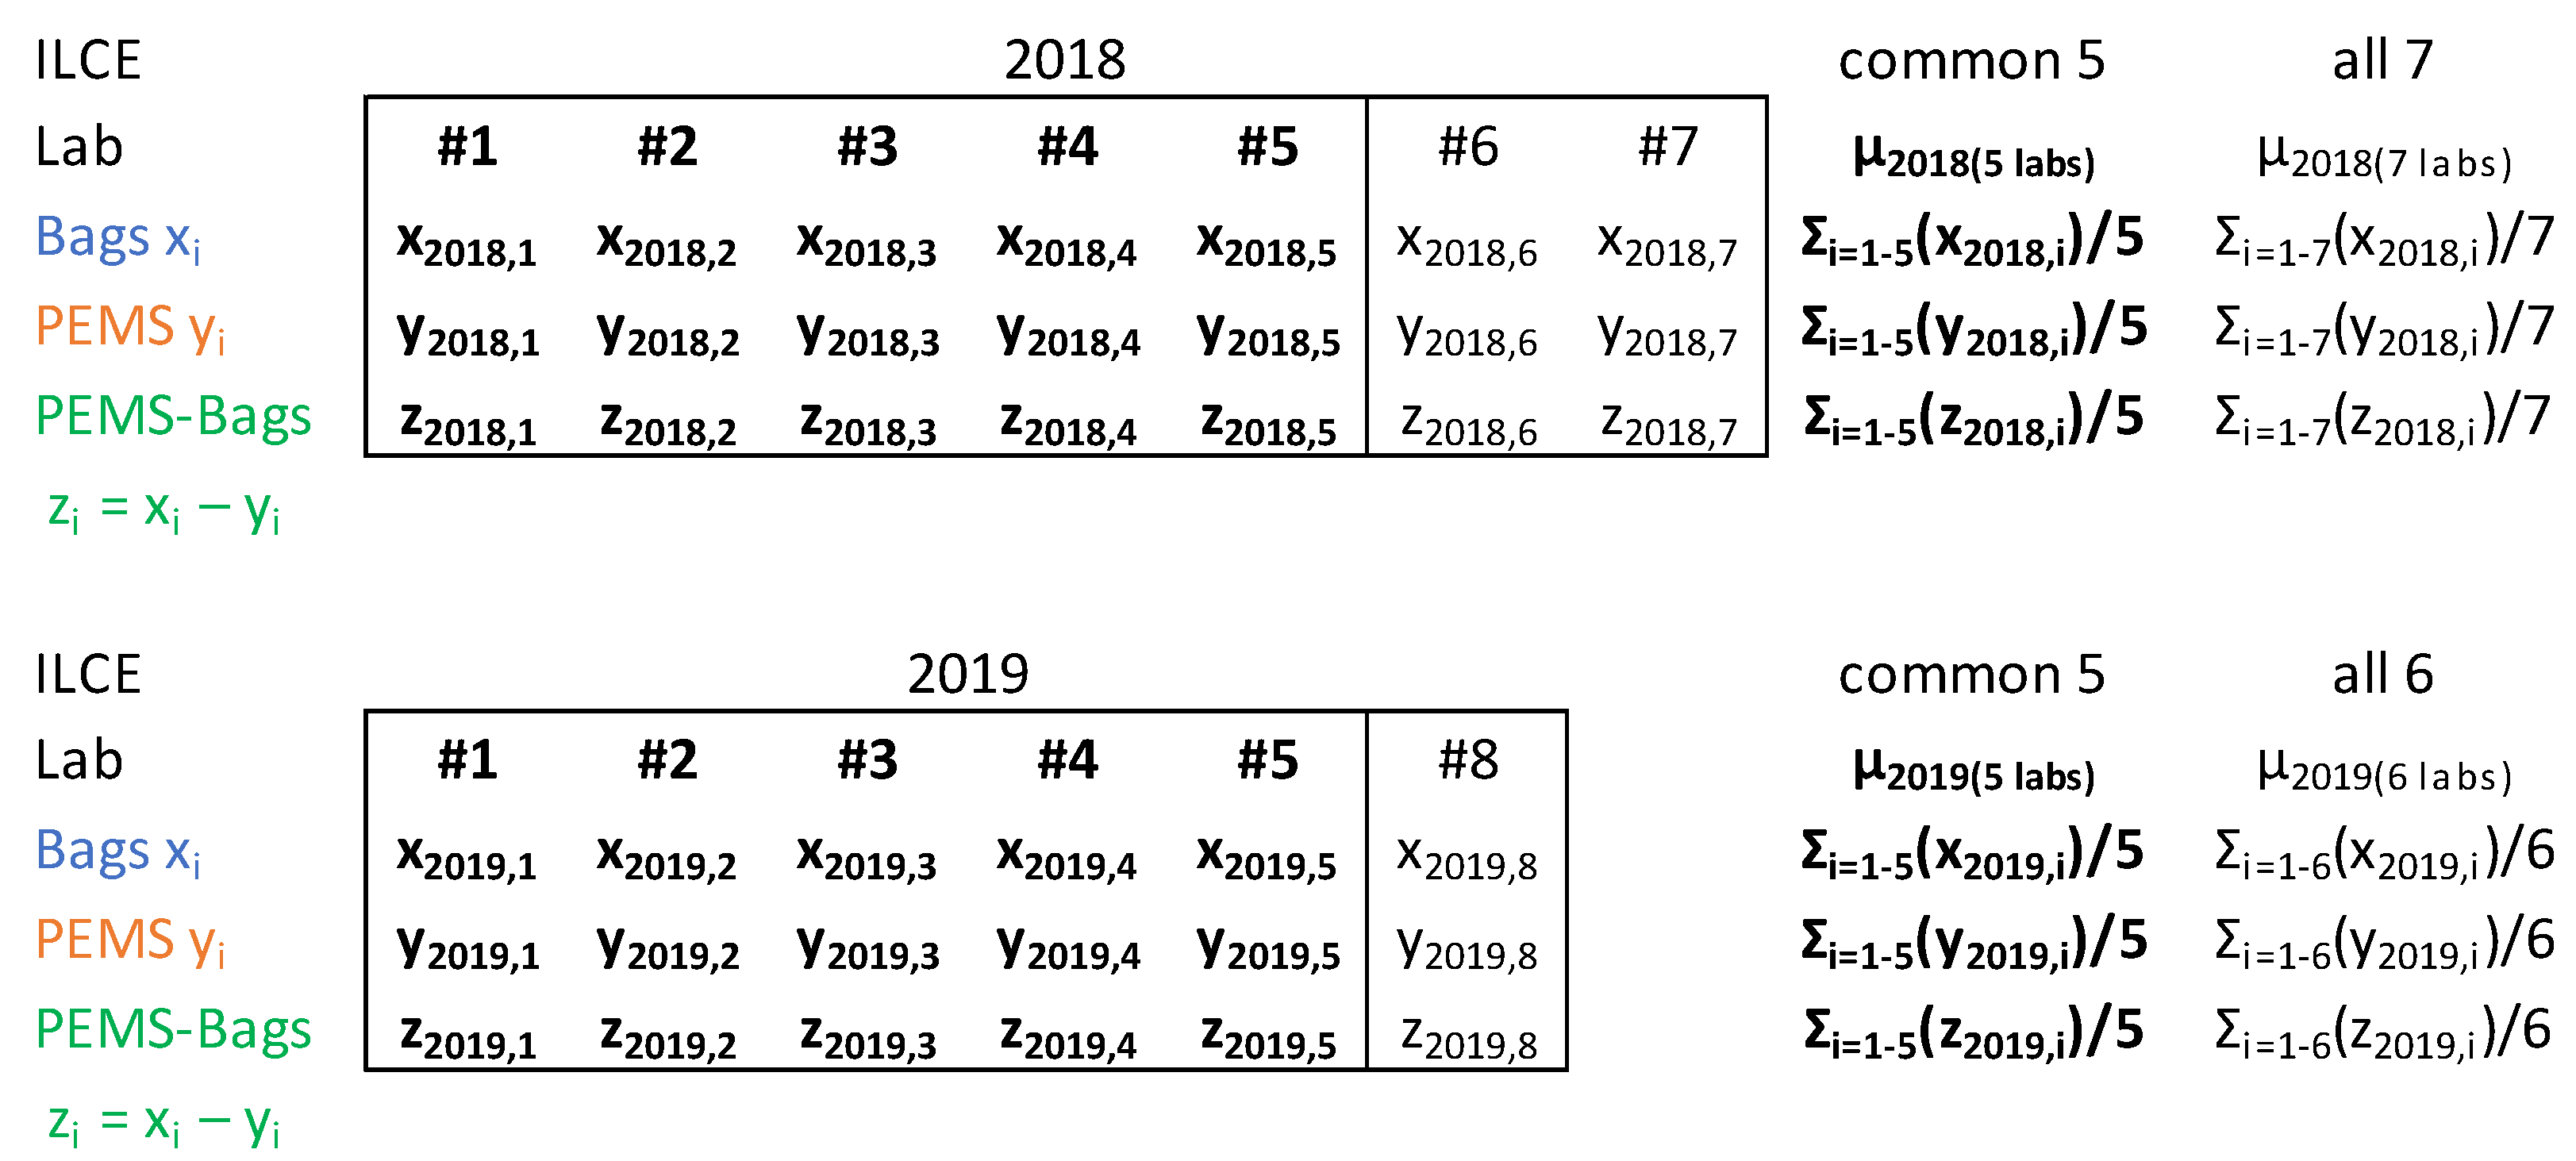
The Golden vehicle was a Euro 6d-temp 1.6 L diesel vehicle (max power approximately 90 kW) with diesel oxidation catalyst (DOC), diesel particulate filter (DPF), and selective catalytic reduction (SCR) for NOx. No maintenance or repair took place during and between the two ILCEs. For each ILCE, all laboratories used reference fuel from the same batch, fulfilling EN 590:2013 specifications, which is the European Standard specifying requirements and test methods for automotive diesel fuel. The analysis of the fuels of the two ILCEs showed minor differences (Table 2).
The B5 (with 5% biodiesel) and B7 (with 7% biodiesel) fuel specifications of the regulations are also given for comparison. The 2019 fuel was also compliant with the B7 reference fuel specifications (Regulation 2017/1151, Annex IX). The density at 15 °C, the PAH (polycyclic aromatic hydrocarbons), and the FAME (fatty acid methyl esters) content of the 2018 fuel were slightly lower than the limits for B5 reference fuel (Regulation 692/2008, Annex IX), and the distillation 95% point was slightly higher (Table 2).

2.5. Calculations

From the data, only the PEMS PN results of one lab were excluded, because it was found that there was condensation in the sampling tube of the instrument. For each lab the arithmetic mean (μ) of the three repetitions was calculated for each pollutant for the bags and the PEMS (Figure A1 in the Appendix A, Bags xi, PEMS yi). Then, the mean of the means with the maximum and minimum values were used for graphical purposes for all laboratories or the common five laboratories for both exercises, in 2018 and 2019. Furthermore, for each pollutant and test, the difference between PEMS and bags was calculated (zi). Then, for each lab, the mean difference of the three tests was calculated. Finally, the mean of the laboratory PEMS-bags differences (along with the minimum and maximum values) were plotted and compared with the permissible tolerances set in the regulation for the “validation” checks. The repeatability and reproducibility following ISO 5725 were also calculated [18].

3. Results

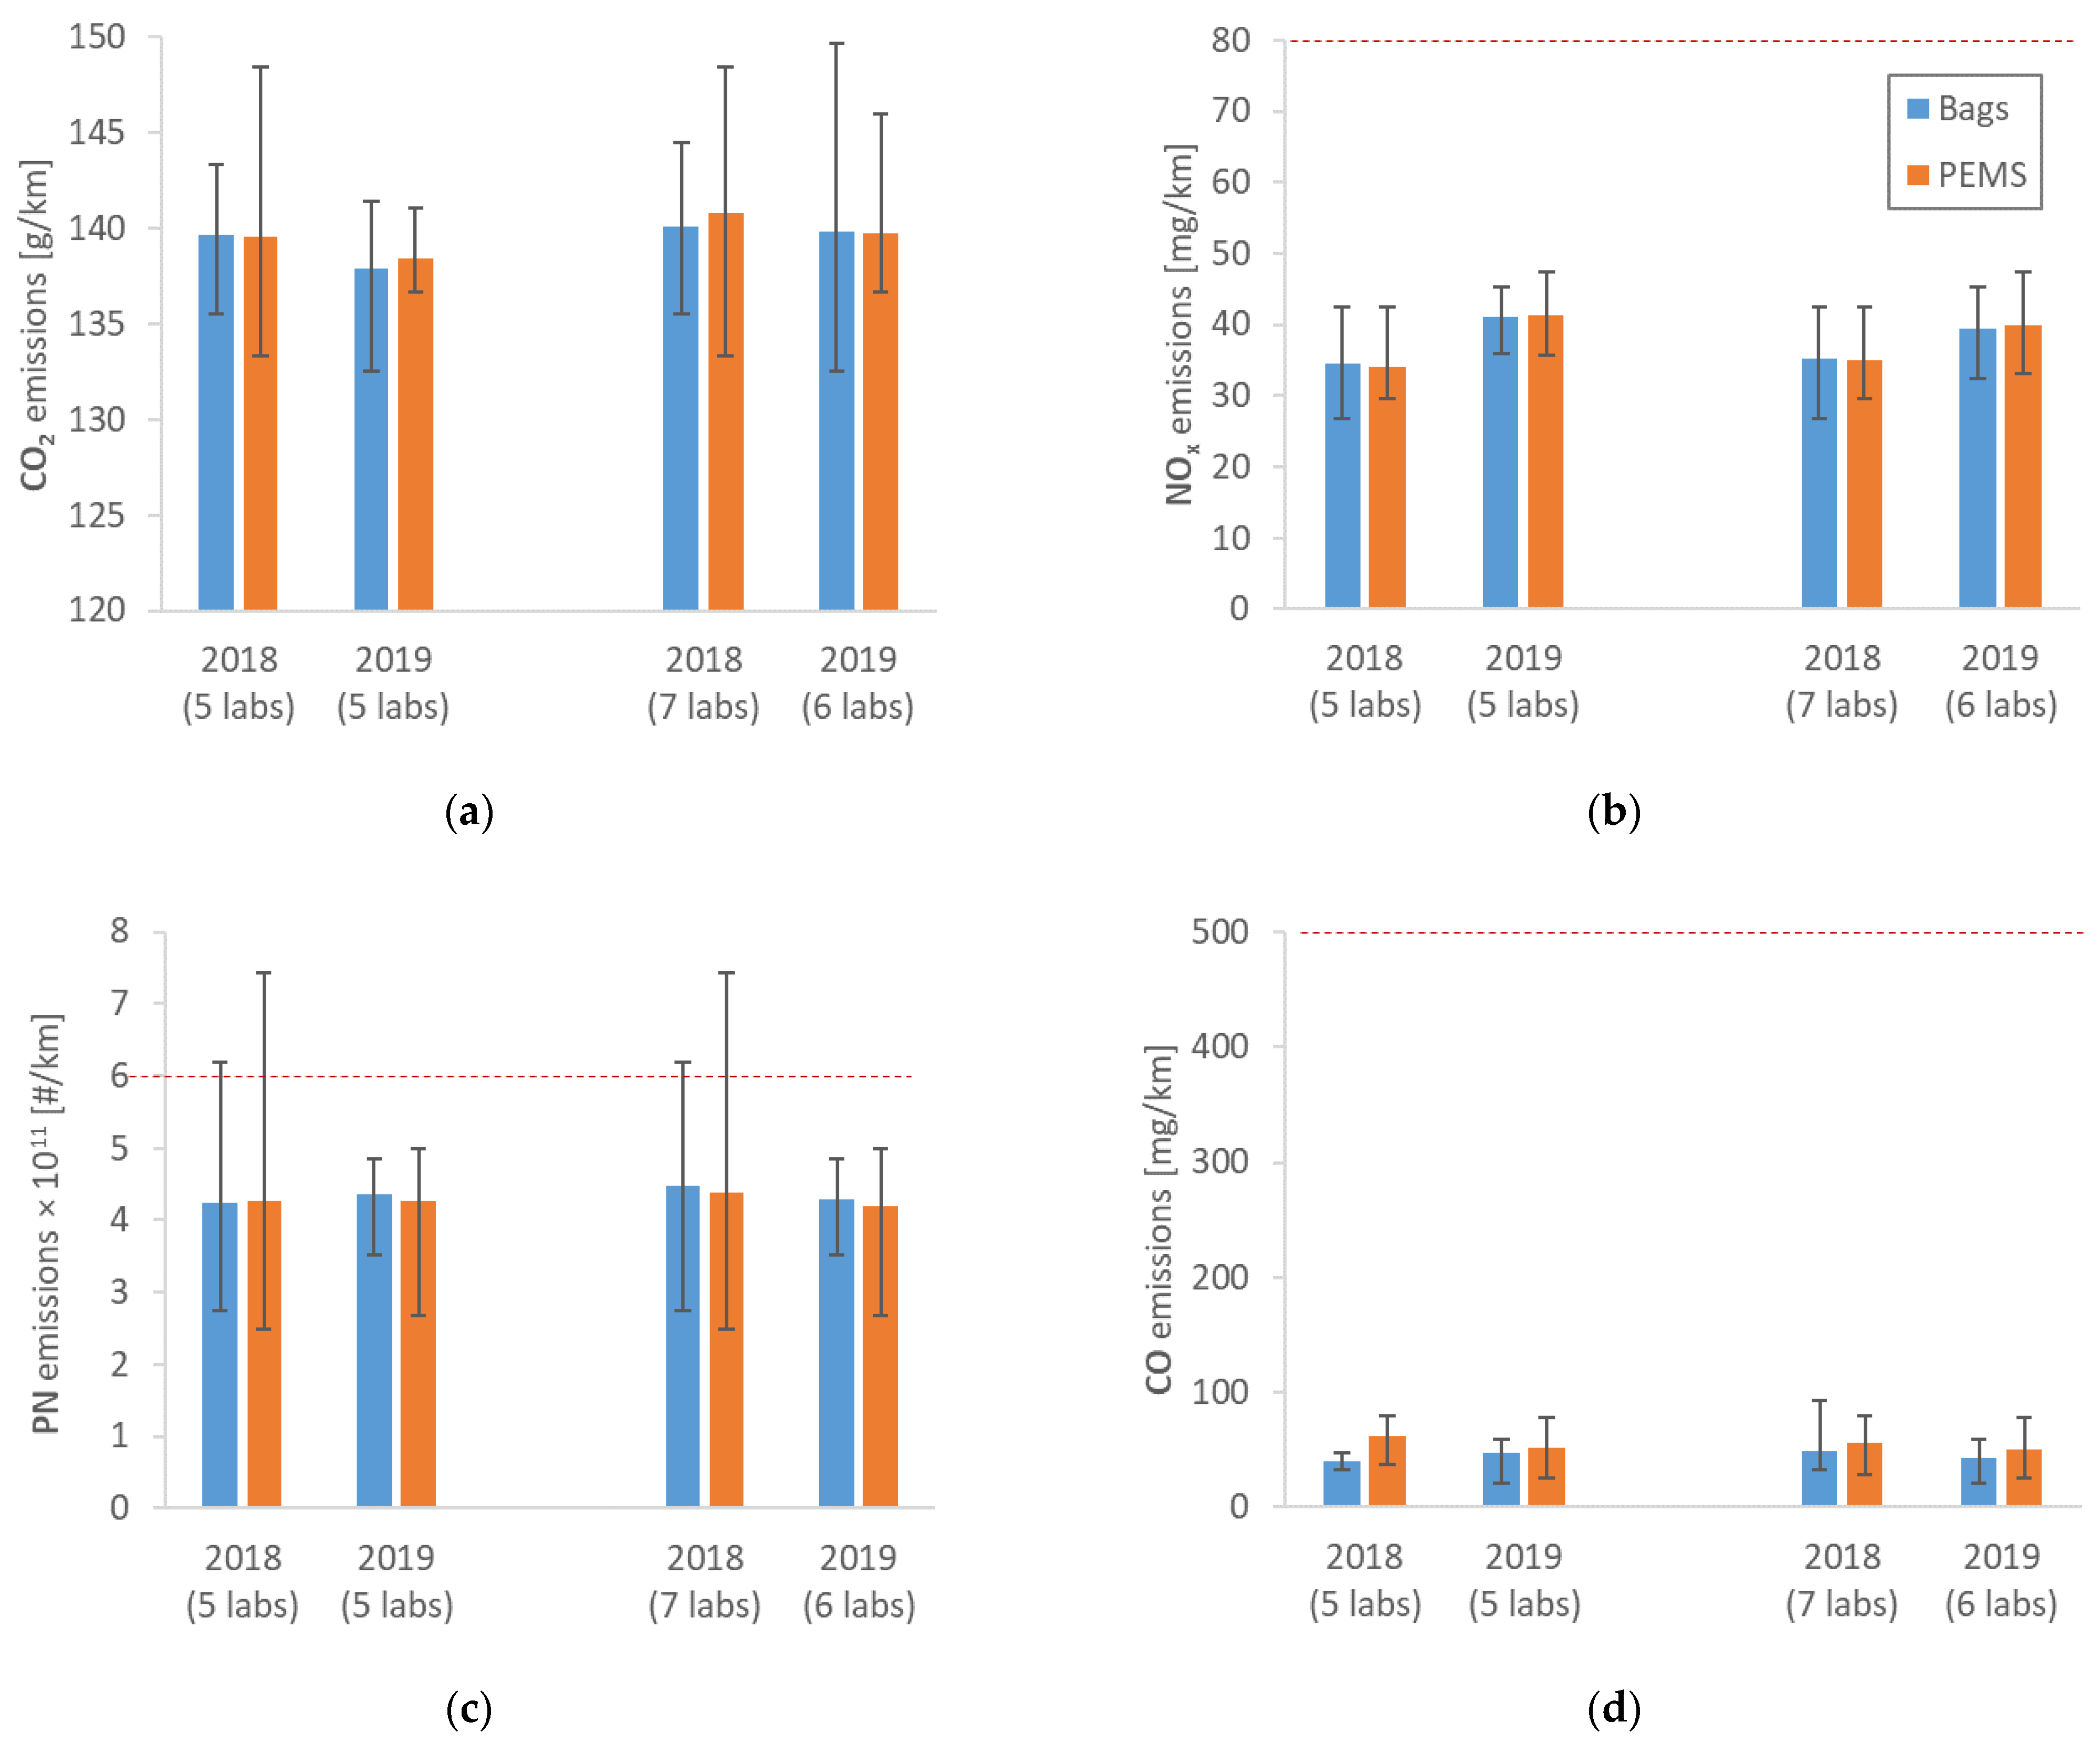
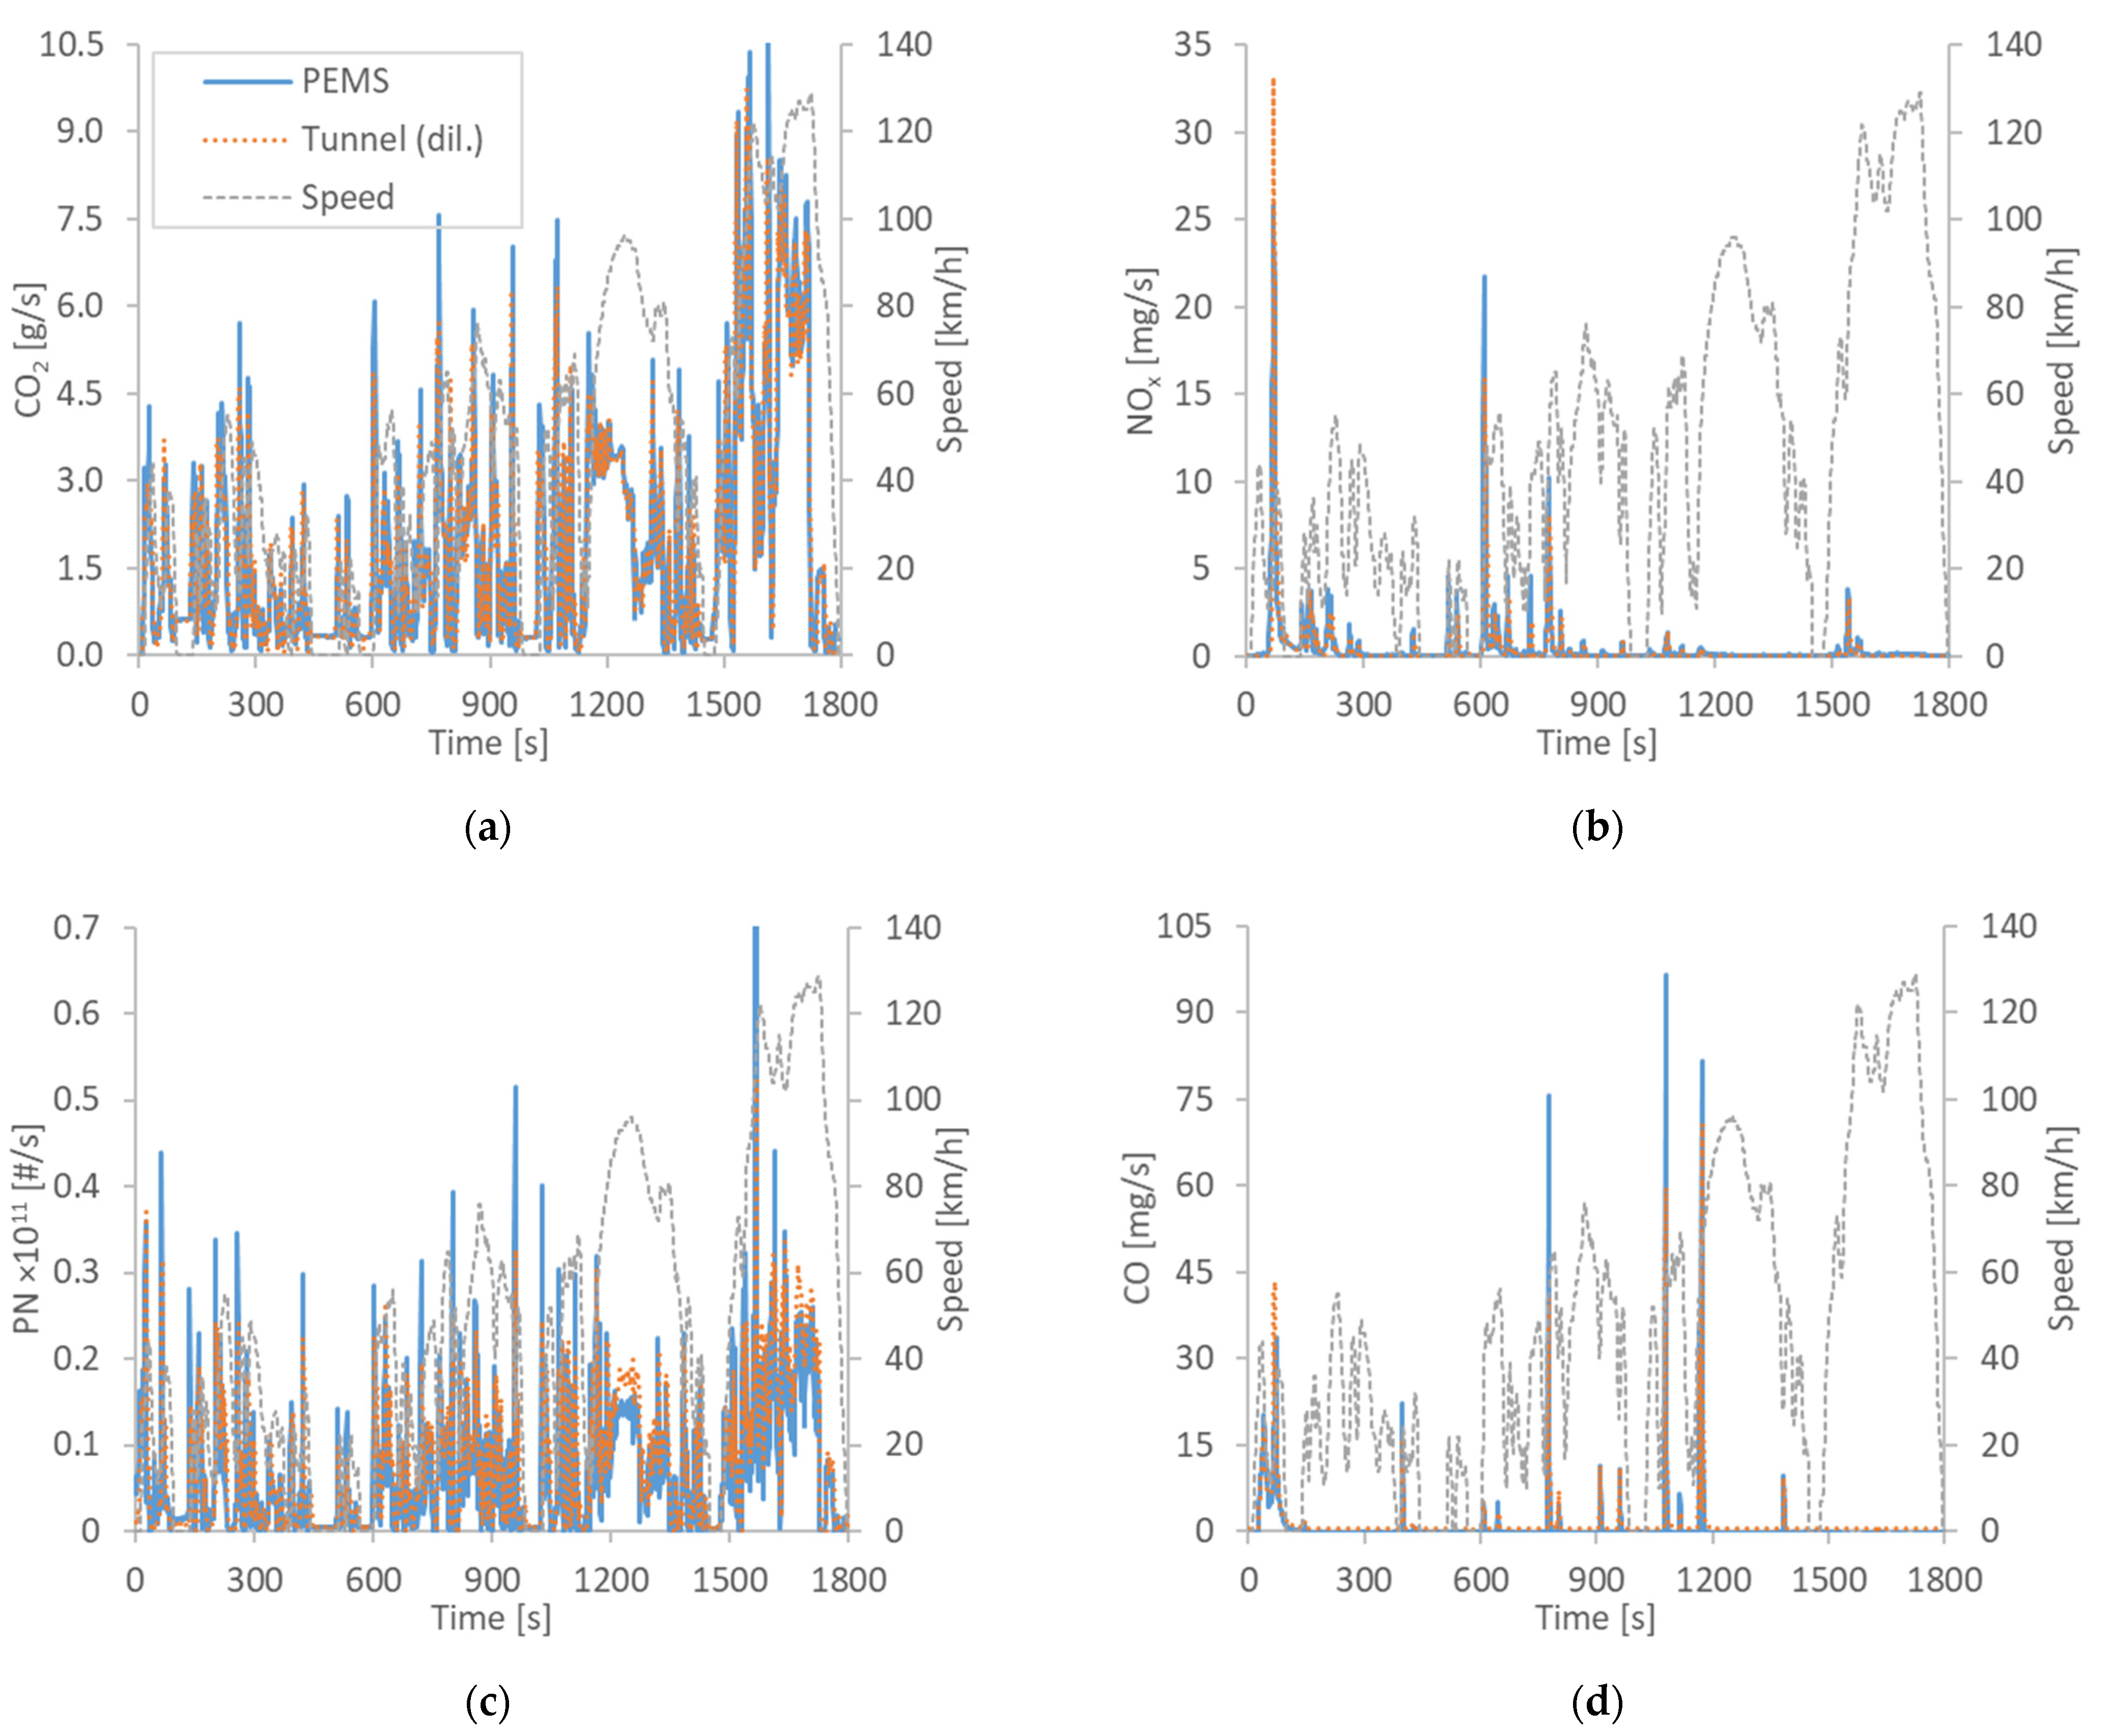
3.1. Absolute Emission Levels

Figure 1 presents the mean emissions of the vehicle from all laboratories, as measured with the laboratory regulated method with bags (or the real-time signal from the tunnel for PN) (blue bars) and their own PEMS (orange bars). The results are separately given for the 5 labs that were common in both ILCEs (left side of each panel) and all labs that used PEMS (right side of each panel). The error bars give the min–max values of the mean laboratory values. Figure A2 in the Appendix A gives real-time examples.
The CO2 emissions (Figure 1a) were around 140 g/km with a variability of approximately ±3 g/km up to ±7 g/km, with the bag results typically on the lower variability range (the exception was 2019, with 6 labs). The PEMS had a low variability (±2 g/km) only in 2019 within 5 labs. No limit is shown in the figure because the EU monitoring CO2 approach is fundamentally different from the not-to-exceed approach for pollutants. The topic will be analyzed in the Section 4.
The NOx emissions (Figure 1b) were approximately half of the applicable limit for this vehicle (40 mg/km). In the 2018 ILCE they were slightly less (5 mg/km) compared to the 2019 ILCE. The variability was ±5 mg/km to ±8 mg/km without a particular trend for the ILCE year or the measurement method.
The PN emissions (4 × 10¹¹ p/km) were close to the applicable limit for this car (6 × 10¹¹ p/km). The variability was large (1–3 × 10¹¹ p/km), with PEMS at the larger end of the variability. The 2019 ILCE had a lower variability for both the laboratory and PEMS, typically 1 × 10¹¹ p/km (25% of the emission level).
The CO emissions were very low (50 mg/km), 10 times below the limit. The variability was similar between bags and PEMS, typically 25 mg/km (50% of the emissions).
In general, the variability of PEMS was similar to the variability of the laboratory equipment. The variability presented includes the variability of the instruments, but also of the vehicle and the laboratories’ facilities and procedures.

3.2. PEMS Differences

The high variability of the emission levels may mask any bias between PEMS and bags. For this reason, the differences of the two methods for each test and pollutant were calculated. The average differences are plotted in Figure 2.
The differences between PEMS and bags were within 5 g/km for CO2 (Figure 2a), with practically equal means. The differences marginally decreased in the 2019 ILCE (±4 g/km). The differences were well within the permissible tolerance of 14 mg/km for CO2 (±10 g/km or 10%, whatever is larger) allowed in the regulation.
The differences for NOx were less than ±10 mg/km in the 2019 ILCE and ±5 mg/km in 2018 (Figure 2b), with almost equal means. The higher variability in 2019 had to do with the high difference at one laboratory (PEMS almost 10 mg/km lower than bags). The reason is not clear because there were no real time NOx data from that laboratory. In any case, all differences were well within the permissible tolerance of 15 mg/km for NOx (±15 g/km or 15%, whichever is larger).
The differences for PN were around ±1 × 10¹¹ p/km (Figure 2c), but the mean differences were almost equal. The higher variability in 2018 had to do with the high difference at one laboratory (1.2 × 10¹¹ p/km) (note that one laboratory was excluded from the analysis due to condensation issues). The reason is not clear, but it is possible that there were higher particle losses in the connecting tube from the vehicle to the dilution tunnel. Still, the differences were within the permissible tolerance of 2.2 × 10¹¹ p/km for PN (±1 × 10¹¹ p/km or 50%, whichever is larger).
The differences for CO were less than ±40 mg/km in the 2018 ILCE and ±25 mg/km in 2019 (Figure 2d). The PEMS means were 5–20 mg/km higher than the bags. The differences were well within the ±150 mg/km permissible tolerance prescribed in the regulation.

4. Discussion

This study presented the emissions of a vehicle during two ILCEs, determined with bags from the full dilution tunnel or PEMS measuring from the tailpipe. The mean measured CO2 value was around 140 g/km. Each vehicle registered in the EU has its own (vehicle-specific) OEM-declared CO2 value stated in its Certificate of Conformity (CoC). As this vehicle was not type-approved, but only calibrated to the Euro 6d-temp standards, the official CO2 value was not available. The type-approval documentation of this vehicle model (interpolation family) declared that in the best case (officially called vehicle low) the CO2 emissions were 138 g/km and in the worst case (officially called vehicle high) 152 g/km. Our tests were conducted with values (mass, road load coefficients) similar to the low case. Hence, the mean value of 140 g/km measured in this campaign is in agreement with the expected value of 138 g/km.
To put the results into perspective, the measured value is higher than the target value of 130 g/km for the fleet of each vehicle manufacturer in the 2015–2019 period (Regulation (EC) 443/2009). It should be highlighted, though, that the targets were applicable to another test cycle: the NEDC (new European driving cycle). Furthermore, other differences, for example the road load determination, and the weight of the vehicle can further influence the CO2 emissions in the order of 11–25% [19,20,21]. In 2019, for the third consecutive year, the average CO2 emissions from light-duty vehicles in EU increased, reaching 122.4 g/km, making the 2021 target of 95 g/km challenging [22]. This means that the share of hybrids and electric vehicles has to be increased. The recent announcement of the European Commission requires a 55% average CO2 reduction of new cars from 2030 and 100% from 2035 compared to 2021 levels. As a result, all new cars registered as of 2035 will be zero-emission [23]. Considering that the average age of vehicles in EU is 11.5 years, the end-of-life vehicle recycling policies become very important [24,25,26,27].
Regarding the other pollutants, the results follow a not-to-exceed approach. The CO emissions were ten times below the respective limit, while the NOx emissions were half. The results are in good agreement with other studies which showed that the emissions of Euro 6d-temp (or, since September, 2020 Euro 6d) vehicles are much lower than the limits for typical environmental and driving conditions [6]. The market share of these vehicles is still low (around 11% of diesel vehicles), as they entered into force in 2017 [28]. Nevertheless, the future Euro 7 limits are expected to be very low, as they will be referring to near-zero-emission vehicles.
Comparing the emissions of the 2018 and 2019 ILCEs, the mean emissions of PN and CO were the same. The mean emissions of the vehicle were slightly lower in the 2019 ILCE for CO2 (around −1 g/km), and slightly higher for NOx (+5 mg/km). The differences between the two ILCEs were not statistically significant (two independent group tests, T-student test). The stability tests of the first laboratory at the start, middle, and at the end of the exercise did not show any trend for the CO2 (+0.5 g/km), while there was a small increase for NOx (not statistically significant) (+3 mg/km). Nevertheless, we cannot exclude a possible effect of the higher FAME content and the higher density in the 2019 ILCE on NOx and CO2 [29,30,31]. Measurable differences have been reported between no, 5%, or 10% biodiesel content in the fuel [32], or even between 2% and 4% for NOx [33].
In order to exclude the vehicle variability from the PEMS and bags comparisons, for each test and pollutant the PEMS and bags difference was calculated, and then the mean and the standard deviation of the differences were evaluated. This study clearly showed that the PEMS results are equivalent with the bags results, under laboratory conditions (30 min test duration, constant temperature and pressure, no vibrations). This conclusion is based on the similar emission levels measured for all pollutants, but also on test-by-test differences, which did not reveal any bias. What is important is that the differences between PEMS and bags were much lower than the permissible tolerances prescribed in the regulation, indicating that the permissible tolerances could be reduced. For example, for NOx the 15 mg/km tolerance could be reduced to 10 mg/km. Similarly, the CO tolerance of 150 mg/km could be reduced to at least 100 mg/km. A reduction of the 50% permissible tolerance of PN to 40% also seems feasible. These results are in agreement with our older study with a gasoline car, where similar differences were found, except for PN (where the differences were close to the tolerance) [15]. They are also in agreement with our recent review that summarized tests from different laboratories [34]. Other researchers found ±8% CO differences for a gasoline vehicle and 15% on average for a 6.7 L diesel vehicle [35]. For NOx the differences were ±15% (absolute emission levels were not reported). For PN, recent studies also found differences <25%, on average, with maximum differences <40% [36,37,38]. The main message from all these results is that the permissible tolerances in the regulation regarding differences between PEMS and laboratory equipment should be tighter. On the one hand, the PEMS perform well; on the other hand, as the emission limits will be lower toward near-zero-emission vehicles, the error margin of the PEMS needs to be lower.
CO2 is the gas with the smallest variability. Table 3 summarizes the results from the two ILCEs with the vehicle of this study considering a different number of laboratories. In 2018 the bags mean was between 139.1 g/km (16 labs) and 140 g/km (7 labs), and in 2019 between 137.8 g/km (5 labs) and 139.8 g/km (6 labs). With PEMS the means varied between 139.6 g/km (5 labs) and 140.8 g/km (7 labs) in 2018 and 138.4 g/km (5 labs) and 139.7 g/km (6 labs) in 2019. The variability (reproducibility in these cases) was 2.1% to 3.8% for bags and 2.1% to 4.7% for PEMS, indicating no increase with PEMS in 2019. The larger PEMS CO2 variability in 2018 was due to two laboratories. One of them used a more suitable (smaller) flow meter in 2019, and the variability decreased.
The variability of CO2 is an indirect measure of the exhaust flow meter (EFM) variability and uncertainty, because typically CO2 measurements agree within 2%. The measured variability of ±5 g/km translates into 3.5% for the 140 g/km CO2 emission of this vehicle. Other researchers also found the agreement between PEMS and bags to be better than 5% [35,39]. This uncertainty is much lower than the 7.5–10% currently assumed for PEMS in the JRC assessment of the measurement uncertainty of PEMS [13,34]. This result indicates that the EFM uncertainty should be re-assessed with more and newer data.
Table 4 summarizes the reproducibility results of inter-laboratory exercises with diesel-fueled vehicles and our 2018 and 2019 exercise (our detailed results are given in Table A1 of Appendix A). The CO2 reproducibility was typically 1.5–2.5%, 10–40% for CO, 10% for NOx, and >25% for PN. Some exceptions (e.g., 58% for PN and 29% for NOx) have to do with the particularities of the specific vehicles, the vehicle pre-conditioning, and the low emission levels. The reproducibility levels of this study are in line with the previous values.
Even though we are moving toward sustainable technologies, such as electric vehicles, the internal combustion engine will remain at least for another 15 years. It is necessary that the emissions reach near-zero levels. The question that arises is how accurately the instruments can measure at such low levels. This study assessed levels ten times lower than the limit for CO, half for NOx, but close to the limit for PN. Especially for NOx and PN, further studies are necessary at much lower levels. The CO2 (and fuel consumption), which is an important greenhouse gas, can still be measured very accurately. This study clearly showed that PEMS measure accurately at levels below the current limits, and the values of this study can be used as an input for researchers and regulators for the future assessment of the limits.

5. Conclusions

In this study two inter-laboratory comparison exercises (in 2018 and 2019) were conducted with a 1.6 L diesel Euro 6d-temp vehicle. The test cycle was the WLTC (worldwide harmonized light vehicles test cycle). Seven labs in 2018 and six in 2019, in addition to the regulated procedures with bags, used their own PEMS (portable emissions measurement systems) to measure the emissions.
The emissions of the vehicle were 140 g/km for CO2, 40 mg/km for NOx, 4 × 10¹¹ p/km for PN, and 50 mg/km for CO. The laboratory reproducibility values were 2.1–3.8% for CO2, 41–45% for CO, 16–17% for NOx, and 16–27% for PN, while for PEMS they were 2.8–4.7% for CO2, 39–57% for CO, 14–17% for NOx, and 36–38% for PN. The mean differences between PEMS and bags were almost zero for CO2 (variability ±5 g/km), NOx (variability ±10 mg/km), and PN (variability ±1 × 10¹¹ p/km). For CO the PEMS was on average 5–20 mg/km higher than the bags (variability ±40 mg/km). The variability slightly improved in the 2019 ILCE.
The results of this study showed that PEMS can accurately measure the emissions with a variability quite similar to that of the laboratory grade equipment, at least under controlled laboratory ambient conditions. Furthermore, they support a reduction of the permissible tolerances in the regulation for the differences between PEMS and laboratory grade equipment.

Author Contributions

Conceptualization, B.G. and A.D.D.; methodology, A.D.D.; formal analysis, B.G.; data curation, A.D.D.; writing—original draft preparation, B.G.; writing—review and editing, S.C., T.R., F.F. and A.D.D. All authors have read and agreed to the published version of the manuscript.

Funding

This research received no external funding.

Institutional Review Board Statement

Not applicable.

Informed Consent Statement

Not applicable.

Data Availability Statement

The anonymized data are available from the corresponding author upon request.

Acknowledgments

The authors would like to thank the laboratories that participated.

Conflicts of Interest

The authors declare no conflict of interest.

Disclaimer

The opinions expressed in this manuscript are those of the authors and should in no way be considered to represent an official opinion of the European Commission and their organizations. Mention of trade names or commercial products does not constitute endorsement or recommendation by the European Commission, the authors, or their organizations.

Appendix A

Figure A1 is the schematic of the calculations applied in this study. Table A1 summarizes the within-lab (repeatability) and between-labs variability, and the reproducibility.
The real time emissions of the vehicle are plotted in Figure A2. The graphs are based on one measurement of one laboratory, where real-time signals from the dilution tunnel were also available. The agreement between PEMS and laboratory analyzers from the dilution tunnel is very good.
Figure A1. Calculations scheme.
Sustainability 13 08762 g0a1
Figure A2. Real-time emissions measured with PEMS from the tailpipe and analyzers from the dilution tunnel: (a) CO2; (b) NOx; (c) PN (particle number); (d) CO.
Sustainability 13 08762 g0a2
The CO2 emissions followed the speed trace. The NOx emissions were relatively high at the beginning of the cycle, but gradually decreased to very low levels, especially when the SCR (selective catalytic reduction for NOx) was at the appropriate temperature. Some spikes stand out during accelerations around 600–900 s because the SCR was not fully warmed up. The PN emissions were relatively high, close to the PN limit, which is not so typical for DPF-equipped vehicles. For this reason, the PN emissions followed the speed signal. The CO emissions were low, with some emissions at the cold start and during accelerations and incomplete combustion.
Table A1. Mean values, within-lab variability (repeatability) (sr), between-labs variability (sL), and reproducibility (sR) for the laboratory equipment (bags) and the PEMS. The values are given separately for the two ILCEs in 2018 (7 labs) and 2019 (6 labs) for various pollutants.
Pollutant:
μ (sr/sL/sR)
2018 (Bags)2018 (PEMS)2019 (Bags)2019 (PEMS)
CO2 [g/km]140.0 (1.1%/1.9%/2.1%)140.8 (3.3%/3.4%/4.7%)139.8 (1.2%/3.6%/3.8%)139.7 (1.7%/2.2%/2.8%)
CO [mg/km]49.2 (23%/33%/41%)57.0 (17%/35%/39%)43.8 (36%/28%/45%)50.2 (42%/38%/57%)
NOx [mg/km]35.2 (7.7%/15.4%/17.2%)34.9 (6.9%/12.3%/14.1%)39.6 (13.7%/7.5%/15.6%)40.0 (11.4%/12.0%/16.6%)
PN ×1011 [p/km]4.5 (5%/26%/27%)4.4 (8%/37%/38%)4.3 (14%/9%/16%)3.8 (18%/31%/36%)

References

  1. Marinello, S.; Lolli, F.; Gamberini, R. Roadway Tunnels: A Critical Review of Air Pollutant Concentrations and Vehicular Emissions. Transp. Res. Part D Transp. Environ. 2020, 86, 102478. [Google Scholar] [CrossRef]
  2. Franco, V.; Kousoulidou, M.; Muntean, M.; Ntziachristos, L.; Hausberger, S.; Dilara, P. Road Vehicle Emission Factors Development: A Review. Atmos. Environ. 2013, 70, 84–97. [Google Scholar] [CrossRef]
  3. Andersen, O.; Upham, P.; Aall, C. Technological Response Options after the VW Diesel Scandal: Implications for Engine CO2 Emissions. Sustainability 2018, 10, 2313. [Google Scholar] [CrossRef] [Green Version]
  4. Weiss, M.; Bonnel, P.; Hummel, R.; Provenza, A.; Manfredi, U. On-Road Emissions of Light-Duty Vehicles in Europe. Environ. Sci. Technol. 2011, 45, 8575–8581. [Google Scholar] [CrossRef] [PubMed]
  5. Pavlovic, J.; Anagnostopoulos, K.; Clairotte, M.; Arcidiacono, V.; Fontaras, G.; Rujas, I.P.; Morales, V.V.; Ciuffo, B. Dealing with the Gap between Type-Approval and in-Use Light Duty Vehicles Fuel Consumption and CO2 Emissions: Present Situation and Future Perspective. Transp. Res. Rec. 2018, 2672, 23–32. [Google Scholar] [CrossRef]
  6. Valverde-Morales, V.; Clairotte, M.; Pavlovic, J.; Giechaskiel, B.; Bonnel, P. On-Road Emissions of Euro 6d-TEMP Vehicles: Consequences of the Entry into Force of the RDE Regulation in Europe; SAE Technical Paper 2020-01-2219; SAE International: Warrendale, PA, USA, 2020. [Google Scholar] [CrossRef]
  7. D’Adamo, I.; Rosa, P. A Structured Literature Review on Obsolete Electric Vehicles Management Practices. Sustainability 2019, 11, 6876. [Google Scholar] [CrossRef] [Green Version]
  8. Dahlgren, S.; Ammenberg, J. Sustainability Assessment of Public Transport, Part Ii—Applying a Multi-Criteria Assessment Method to Compare Different Bus Technologies. Sustainability 2021, 13, 1273. [Google Scholar] [CrossRef]
  9. Arribas-Ibar, M.; Nylund, P.; Brem, A. The Risk of Dissolution of Sustainable Innovation Ecosystems in Times of Crisis: The Electric Vehicle during the Covid-19 Pandemic. Sustainability 2021, 13, 1319. [Google Scholar] [CrossRef]
  10. Giechaskiel, B.; Bonnel, P.; Perujo, A.; Dilara, P. Solid Particle Number (SPN) Portable Emissions Measurement Systems (PEMS) in the European Legislation: A Review. Int. J. Environ.Res. Public Health 2019, 16, 4819. [Google Scholar] [CrossRef] [Green Version]
  11. Feist, M.D.; Sharp, C.A.; Spears, M.W. Determination of Pems Measurement Allowances for Gaseous Emissions Regulated under the Heavy-Duty Diesel Engine in-Use Testing Program: Part 1—Project Overview and PEMS Evaluation Procedures. SAE Int. J. Fuels Lubr. 2009, 2, 435–454. [Google Scholar] [CrossRef]
  12. Cao, T.; Durbin, T.D.; Cocker, D.R.; Wanker, R.; Schimpl, T.; Pointner, V.; Oberguggenberger, K.; Johnson, K.C. A Comprehensive Evaluation of a Gaseous Portable Emissions Measurement System with a Mobile Reference Laboratory. Emiss. Control Sci. Technol. 2016, 2, 173–180. [Google Scholar] [CrossRef] [Green Version]
  13. Giechaskiel, B.; Clairotte, M.; Valverde-Morales, V.; Bonnel, P.; Kregar, Z.; Franco, V.; Dilara, P. Framework for the Assessment of PEMS (Portable Emissions Measurement Systems) Uncertainty. Environ. Res. 2018, 166, 251–260. [Google Scholar] [CrossRef]
  14. Varella, R.; Giechaskiel, B.; Sousa, L.; Duarte, G. Comparison of Portable Emissions Measurement Systems (PEMS) with Laboratory Grade Equipment. Appl. Sci. 2018, 8, 1633. [Google Scholar] [CrossRef] [Green Version]
  15. Giechaskiel, B.; Casadei, S.; Mazzini, M.; Sammarco, M.; Montabone, G.; Tonelli, R.; Deana, M.; Costi, G.; Di Tanno, F.; Prati, M.; et al. Inter-Laboratory Correlation Exercise with Portable Emissions Measurement Systems (PEMS) on Chassis Dynamometers. Appl. Sci. 2018, 8, 2275. [Google Scholar] [CrossRef] [Green Version]
  16. Kim, S.; Kondo, K.; Otsuki, Y.; Haruta, K. A New On-Board PN Analyzer for Monitoring the Real-Driving Condition; SAE Technical Paper 2017-01-1001; SAE International: Warrendale, PA, USA, 2017. [Google Scholar] [CrossRef]
  17. Giechaskiel, B.; Woodburn, J.; Szczotka, A.; Bielaczyc, P. Particulate Matter (PM) Emissions of Euro 5 and Euro 6 Vehicles Using Systems with Evaporation Tube or Catalytic Stripper and 23 Nm or 10 Nm Counters; SAE Technical Paper 2020-01-2203; SAE International: Warrendale, PA, USA, 2020. [Google Scholar] [CrossRef]
  18. ISO 5725–2:1994. Accuracy (Trueness and Precision) of Measurement Methods and Results—Part 2: Basic Method for the Determination of Repeatability and Reproducibility of a Standard Measurement Method; International Organization for Standardization: Geneva, Switzerland, 1994. [Google Scholar]
  19. Pavlovic, J.; Marotta, A.; Ciuffo, B. CO2 Emissions and Energy Demands of Vehicles Tested under the NEDC and the New WLTP Type Approval Test Procedures. Appl. Energy 2016, 177, 661–670. [Google Scholar] [CrossRef]
  20. Pavlovic, J.; Ciuffo, B.; Fontaras, G.; Valverde, V.; Marotta, A. How Much Difference in Type-Approval CO2 Emissions from Passenger Cars in Europe Can Be Expected from Changing to the New Test Procedure (NEDC vs. WLTP)? Transp. Res. Part A Policy Pract. 2018, 111, 136–147. [Google Scholar] [CrossRef]
  21. Liu, X.; Zhao, F.; Hao, H.; Chen, K.; Liu, Z.; Babiker, H.; Amer, A.A. From NEDC to WLTP: Effect on the Energy Consumption, NEV Credits, and Subsidies Policies of PHEV in the Chinese Market. Sustainability 2020, 12, 5747. [Google Scholar] [CrossRef]
  22. Joshi, A. Review of Vehicle Engine Efficiency and Emissions; SAE Technical Paper 2021-01-0575; SAE International: Warrendale, PA, USA, 2021. [Google Scholar] [CrossRef]
  23. European Commission European Green Deal: Commission Proposes Transformation of EU Economy and Society to Meet Climate Ambitions. Press Release 14 July 2021. Available online: https://ec.europa.eu/commission/presscorner/detail/en/IP_21_3541 (accessed on 4 August 2021).
  24. Petronijević, V.; Đorđević, A.; Stefanović, M.; Arsovski, S.; Krivokapić, Z.; Mišić, M. Energy Recovery through End-of-Life Vehicles Recycling in Developing Countries. Sustainability 2020, 12, 8764. [Google Scholar] [CrossRef]
  25. Sverko Grdic, Z.; Krstinic Nizic, M.; Rudan, E. Circular Economy Concept in the Context of Economic Development in EU Countries. Sustainability 2020, 12, 3060. [Google Scholar] [CrossRef] [Green Version]
  26. D’Adamo, I.; Gastaldi, M.; Rosa, P. Recycling of End-of-Life Vehicles: Assessing Trends and Performances in Europe. Technol. Forecast. Soc. Chang. 2020, 152, 119887. [Google Scholar] [CrossRef]
  27. Numfor, S.A.; Omosa, G.B.; Zhang, Z.; Matsubae, K. A Review of Challenges and Opportunities for End-of-Life Vehicle Recycling in Developing Countries and Emerging Economies: A SWOT Analysis. Sustainability 2021, 13, 4918. [Google Scholar] [CrossRef]
  28. Eurostat Statistics Explained: Passenger Cars in EU. Available online: https://ec.europa.eu/eurostat/statistics-explained/images/1/11/SE_Passenger_cars_in_the_EU_update2019.xlsx (accessed on 4 August 2021).
  29. Williams, R.; Hamje, H.; Zemroch, P.J.; Clark, R.; Samaras, Z.; Dimaratos, A.; Jansen, L.; Fittavolini, C. Effect of Fuel Properties on Emissions from Euro 4 and Euro 5 Diesel Passenger Cars. Transp. Res. Procedia 2016, 14, 3149–3158. [Google Scholar] [CrossRef] [Green Version]
  30. Tesfa, B.; Gu, F.; Mishra, R.; Ball, A. Emission Characteristics of a CI Engine Running with a Range of Biodiesel Feedstocks. Energies 2014, 7, 334–350. [Google Scholar] [CrossRef]
  31. Wu, G.; Ge, J.C.; Choi, N.J. A Comprehensive Review of the Application Characteristics of Biodiesel Blends in Diesel Engines. Appl. Sci. 2020, 10, 8015. [Google Scholar] [CrossRef]
  32. Valencia Ochoa, G.; Acevedo Peñaloza, C.; Duarte Forero, J. Combustion and Performance Study of Low-Displacement Compression Ignition Engines Operating with Diesel–Biodiesel Blends. Appl. Sci. 2020, 10, 907. [Google Scholar] [CrossRef] [Green Version]
  33. Paredes Rojas, J.C.; Torres San Miguel, C.R.; Vázquez Medina, R.; Leal Naranjo, J.A.; Ortiz Hernàndez, F.E.; Costa Castelló, R. Pollutant Emissions and Combustion Efficiency Assessment of Engines Using Biodiesel. Appl. Sci. 2020, 10, 8646. [Google Scholar] [CrossRef]
  34. Giechaskiel, B.; Valverde, V.; Clairotte, M. Real Driving Emissions (RDE): 2020 Assessment of Portable Emissions Measurement Systems (PEMS) Measurement Uncertainty; Publications Office of the European Commission: Luxembourg, 2021; ISBN 978-92-76-30230-8. [Google Scholar]
  35. Vu, D.; Szente, J.; Loos, M.; Maricq, M. How Well Can MPEMS Measure Gas Phase Motor Vehicle Exhaust Emissions? SAE Technical Paper 2020-01-0369; SAE International: Warrendale, PA, USA, 2020. [Google Scholar] [CrossRef]
  36. Otsuki, Y.; Nakamura, H.; Kojima, K.; Kondo, K.; Haruta, K. Investigation in Calibration Procedures for Portable and Stationary Solid Particle Number Measurement Systems; SAE Technical Paper 2019-01-1187; SAE International: Warrendale, PA, USA, 2019. [Google Scholar] [CrossRef]
  37. Schriefl, M.A.; Nishida, R.T.; Knoll, M.; Boies, A.M.; Bergmann, A. Characterization of Particle Number Counters Based on Pulsed-Mode Diffusion Charging. Aerosol Sci. Technol. 2020, 54, 772–789. [Google Scholar] [CrossRef]
  38. Khan, M.Y.; Patel, M.; Scott, N.; Liew, C.M.; Peng, C.; Luo, W.; Rahman, M.; Gramlich, N.; Eames, J.; Phillips, J.A. Assessment of In-Use Solid Particle Number Measurement Systems against Laboratory Systems; SAE Technical Paper 2020-01-5074; SAE International: Warrendale, PA, USA, 2020. [Google Scholar] [CrossRef]
  39. Akard, M.; Gramlich, N.; Nevius, T.; Porter, S. Comparison of Real-World Urban Driving Route PEMS Fuel Economy with Chassis Dynamometer CVS Results; SAE Technical Paper 2019-01-0762; SAE International: Warrendale, PA, USA, 2019. [Google Scholar] [CrossRef]
  40. Mamakos, A.; Ntziachristos, L.; Samaras, Z. Comparability of Particle Emission Measurements between Vehicle Testing Laboratories: A Long Way to Go. Meas. Sci. Technol. 2004, 15, 1855–1866. [Google Scholar] [CrossRef]
  41. Zervas, E.; Dorlhène, P.; Forti, L.; Perrin, C.; Momique, J.C.; Monier, R.; Ing, H.; Lopez, B. Interlaboratory Test of Exhaust PM Using ELPI. Aerosol Sci. Technol. 2005, 39, 333–346. [Google Scholar] [CrossRef]
  42. Zervas, E.; Dorlhène, P.; Forti, L.; Perrin, C.; Momique, J.C.; Monier, R.; Ing, H.; Lopez, B. Interlaboratory Study of the Exhaust Gas Particle Number Measurement Using the Condensation Particle Counter (Cpc). Energy Fuels 2006, 20, 2426–2431. [Google Scholar] [CrossRef]
  43. Myung, C.-L.; Lee, H.; Kwon, S.; Lee, S.; Jun, J.; Lee, Y.; Woo, Y.; Lee, M.; Bae, G.-N.; Park, S. Inter-Laboratory Correlation Exercise on a Light-Duty Diesel Passenger Vehicle to Verify Nano-Particle Emission Characteristics by Korea Particle Measurement Program. J. Mech. Sci. Technol. 2009, 23, 729–738. [Google Scholar] [CrossRef]
  44. Haniu, T.; Vallaude, C. Asian and European WLTP RRT. In Proceedings of the WLTP 19th Meeting, Geneva, Switzerland, 6 June 2017. [Google Scholar]
Figure 1. Vehicle emissions as measured in 2018 and 2019 with the regulated method with bags (blue column) and the portable emissions measurement systems PEMS (orange columns). The results are given separately for the 5 labs that were common in the two years (left columns in each panel), and for all labs that used PEMS (right columns in each panel). Dashed lines give the emission limits applicable for this vehicle. Error bars give min–max values: (a) CO2; (b) NOx; (c) PN (particle number); (d) CO.
Sustainability 13 08762 g001
Figure 2. Differences of PEMS to bags as measured in 2018 and 2019 inter-laboratory comparison exercises (ILCEs). The results are given separately for the 5 labs that were common in the two years (left columns in each panel) and for all labs that used PEMS (right columns in each panel). Dashed lines give the permissible tolerances applicable for each pollutant. Error bars give min–max values: (a) CO2; (b) NOx; (c) PN (particle number); (d) CO.
Sustainability 13 08762 g002
Table 1. Participating laboratories at the two inter-laboratory comparison exercises (ILCEs) in 2018 and 2019.
Laboratories20182019
All laboratories1613
Laboratories with PEMS76 1
1 Five from the six were the same in 2018 and 2019 PEMS exercises.
Table 2. Fuel characteristics at the two inter-laboratory comparison exercises (ILCEs) in 2018 and 2019 and comparison with reference fuels B5 and B7 and the European standard EN 590:2013. FAME: fatty acid methyl esters; PAH: polycyclic aromatic hydrocarbons. The terms “% m/m” and “% v/” are used to represent the mass fraction and the volume fraction, respectively.
20182019B5B7EN 590:2013
Cetane number [–]53.553.752–5452–56>51
Density at 15 °C [kg/m3]831.4835.6833–837833–837820–845
Distillation 50% point [°C]279.0284.3>245>245
Distillation 95% point [°C]354.1353.0345–350345–360<360
PAH [% m/m]1.42.02.0–6.02.0–4.0<8.0
Sulphur content [mg/kg]7.07.4<10.0<10.0<10.0
FAME [% v/v]3.16.94.5–5.56.0–7.0<7.0
Table 3. CO2 emissions of the vehicle of this study and variability of the two ILCEs in 2018 and 2019.
Laboratories2018 (Bags)2018 (PEMS)2019 (Bags)2019 (PEMS)
All: 16 (2018) and 13 (2019)139.1 (2.4%)-138.1 (3.7%)-
With PEMS: 7 (2018) and 6 (2019)140.0 (2.2%)140.8 (4.7%)139.8 (3.8%)139.7 (2.8%)
With PEMS: the same 5 in 2018 and 2019139.6 (2.1%)139.6 (4.9%)137.8 (2.6%)138.4 (2.1%)
Table 4. Reproducibility levels [%] from inter-laboratory exercises with diesel vehicles. Values based on PEMS are in italics.
Emission LevelCO2CONOxPNComments
Euro 2 (none)4.2129527 labs, NEDC [40]
Euro 3 (with DOC) 10.9116244 labs, NEDC [41]
Euro 3 (with DOC + DPF)1.5589674 labs, NEDC [41]
Euro 3 (with DOC) 1,21.679304 labs, NEDC [42]
Euro 4 (with DOC) 1,21.2127214 labs, NEDC [42]
Euro 3 (with DOC + DPF) 1,22.43381123 labs, NEDC [42]
Euro 4 (with DOC + DPF)3.03410464 labs, NEDC [43]
Euro 5 (DOC + LNT + DPF)3.14272511 EU labs, WLTC [44]
Euro 5 equivalent (DOC + LNT + DPF)2.62829-4 Asian labs, WLTC [44]
Euro 6d-temp (DOC + DPF + SCR) 33.04316226–7 labs, WLTC, this study
As above3.8481537As above (PEMS)
Results of original studies divided by the coverage factor 1.96 to make them comparable with the rest studies of this table. 2 Estimated from graphs. 3 Based on average of 2018 and 2019 (Table A1).
Publisher’s Note: MDPI stays neutral with regard to jurisdictional claims in published maps and institutional affiliations.

