Abstract
This paper addresses the optimal power flow problem in direct current (DC) networks employing a master–slave solution methodology that combines an optimization algorithm based on the multiverse theory (master stage) and the numerical method of successive approximation (slave stage). The master stage proposes power levels to be injected by each distributed generator in the DC network, and the slave stage evaluates the impact of each power configuration (proposed by the master stage) on the objective function and the set of constraints that compose the problem. In this study, the objective function is the reduction of electrical power losses associated with energy transmission. In addition, the constraints are the global power balance, nodal voltage limits, current limits, and a maximum level of penetration of distributed generators. In order to validate the robustness and repeatability of the solution, this study used four other optimization methods that have been reported in the specialized literature to solve the problem addressed here: ant lion optimization, particle swarm optimization, continuous genetic algorithm, and black hole optimization algorithm. All of them employed the method based on successive approximation to solve the load flow problem (slave stage). The 21- and 69-node test systems were used for this purpose, enabling the distributed generators to inject , , and of the power provided by the slack node in a scenario without distributed generation. The results revealed that the multiverse optimizer offers the best solution quality and repeatability in networks of different sizes with several penetration levels of distributed power generation.
1. Introduction
1.1. General Context
Electrical energy is essential for modern daily life because people’s comfort and socioeconomic conditions depend on it [1]. Such energy can be generated and distributed in the form of Alternating Current (AC) and Direct Current (DC). Although most electrical power and electricity distribution systems work with AC, DC electrical energy is as important as its counterpart. Furthermore, DC offers technical-operational advantages; for instance, as most loads used by people are DC, generating and distributing DC eliminates the need for converting electrical energy from AC to DC. This type of electric current promotes the use of clean and environmentally friendly renewable energy sources because most renewable energy is produced in DC, which eliminates the need for power converters. It also eliminates phasors and reactive elements in the electrical network. This reduces the complexity of the mathematical model and the operation and control of electrical networks. This paper focuses on electrical DC systems due to the advantages mentioned above and because more studies should investigate this type of network [2]. To operate the elements that compose DC electrical networks, i.e., (slack and distributed) loads and power generators, solution methodologies should be used to identify the operating points of these devices, mainly the generators, in order to guarantee the technical conditions of the network (power balance, power and voltage limits, penetration levels of the distributed generators, etc.). In addition, such methodologies should enable network operators or owners to meet the objective functions they have established in order to improve the technical conditions of the system (power losses, voltage stability, loadability of the lines, etc.), as well as its environmental characteristics, or to reduce operating costs (buying electricity from the grid) [3]. This problem, known as Optimal Power Flow (OPF), is about finding the reference points for the power of the Distributed Generators (DGs) in a network in order to meet the objective functions that have been defined.
1.2. State-of-the-Art
To solve the OPF problem in DC networks, the first step is interpreting and solving the load flow or power flow problem. As a result, we can determine the existing voltage in each one of the nodes in the network and the current circulating through the transmission lines thanks to the parameters of the electrical power system, e.g., conductance of transmission lines, power demanded by the loads, and electrical topology [4]. To solve the load flow problem, numerical methods should be employed to solve the nonlinear nonconvex problem that it represents [5]. In recent years, different types of methods have been proposed for this purpose. Some of the classical options include Newton–Raphson [6], Gauss–Seidel, and Gauss–Jacobi [7]. More current alternatives are Taylor series approximation [8], successive approximation [9], triangular matrix formulation [8], sweeping based on graph theory [10], and backward/forward sweeping [11]. To solve the load flow and calculate each one of the previously mentioned variables, this study used the Successive Approximation (SA) method [9]. The latter was selected due to its excellent performance in terms of convergence and processing times for radial as well as meshed networks [11].
The load flow method can describe the electrical behavior of a DC network based on known data of power demanded and generated by the DGs. However, in case of any variation in said power, the power flow should be calculated again to establish the effect of the generation and demand inside the network. To find the most adequate power level that the DGs should inject, the OPF problem should be solved by means of optimization techniques in order to meet the objective function proposed by the DC network operator and/or owner [12]. This guarantees that the electrical constraints that compose DC networks in an environment of distributed generation are always respected [12].
Engineering often faces highly difficult problems, which cannot be solved directly; they are called nonlinear nonconvex problems [13]. For this reason, multiple techniques have been developed to offer a good quality solution to these problems by applying intelligent optimization methods. Some of them are the so-called optimization techniques, which are inspired by the behavior of nature. Optimization methods apply mathematical models and strategies to move within a solution space and find good quality solutions in relatively short times. Every optimization method should be adapted to the problem under analysis, and the impact of the solution produced by each type of method will depend on the difficulty of said problem.
Due to the high efficiency and excellent performance of metaheuristic optimization techniques in solving engineering problems, they are widely applied to solve nonlinear nonconvex problems with continuous variables. Optimization techniques are employed in this study to solve the OPF problem because the mathematical model used here requires nonlinear methods to produce a solution [14]. Furthermore, the mathematical modeling of the problem includes continuous variables. To solve the OPF problem by means of optimization techniques, the problem is generally divided into two stages using a master–slave methodology [14]. The master stage determines the optimal power level that the DGs should inject into the DC network, and the slave stage solves the power flow problem. The objective is to calculate the electrical variables that can be used to establish the impact of the objective function and the problem constraints of each one of the solutions proposed by the master stage. This master–slave methodology enables us to find a good quality solution based on an adequate selection of the optimization techniques to be implemented. Importantly, the solution quality greatly depends on the proposed solution method and the parameters assigned to it.
In the last decade, the specialized literature has proposed different solutions to solve the OPF problem in DC networks. Usually, their objective function is the minimization of power losses in the network [15,16]. In [15], the authors proposed a convex relaxation method based on second-order cone programming. In turn, in [16], the authors employed sequential quadratic convex programming to solve the OPF problem. The studies mentioned above used commercial optimization software to solve the OPF problem, which increases the complexity of the problem and the cost of the solution. Additionally, in such studies, the OPF problem was evaluated in small networks only (10, 16, and 21 nodes), thus ignoring the performance of the methods in bigger networks. Likewise, in [16], the standard deviation of the techniques was not taken into account, which is important to establish how dispersed the results obtained are with respect to the average result. In order to propose methods based on sequential programming that can be developed in any programming language and eliminate the need to acquire specialized (commercial) software, different methodologies have been studied and proposed in recent years to solve the problem addressed here. For example, in [17], the authors employed the black hole (BH) algorithm and the Gauss–Seidel numerical method to generate a master–slave solution strategy for the OPF problem. Remarkably, they did not take into consideration the standard deviation of the techniques they used. In [5], the authors employed the vortex search algorithm and the numerical method by SA to solve the OPF problem. In their study, the solution methodology was evaluated in small DC networks (10 and 21 nodes). By contrast, in [18], the authors used the sine cosine optimization algorithm and the SA numerical method as the solution methodology. Nevertheless, they only analyzed the effect of the methodology in the 21-node system and did not consider the standard deviation of the optimization techniques to solve the OPF problem. This analysis of the state-of-the-art of methodologies that have been applied to solve the OPF problem shows that strategies based on sequential programming should be promoted in order to eliminate the need for commercial software and improve the solution quality. Nevertheless, such methodologies should be validated in test systems of different sizes so that the effectiveness of the proposed solution methodology can be guaranteed in a network of any size. For example, in [14,19], the authors employed the master–slave methodology based on sequential programming to solve the OPF problem. Particularly in [19], three metaheuristic optimization algorithms were implemented as strategies to solve the OPF problem. First, the authors used a continuous genetic algorithm (CGA), which had been presented in [20]. The CGA is inspired by the genetic process of living beings, employing the selection, combination, and mutation process in order to transmit information collected by parents to their descendants. Second, they used the black hole (BH) algorithm reported in [17], which is based on the dynamic interaction of stars and black holes and is used to solve optimization problems with continuous variables, such as the OPF problem. Third, they employed the particle swarm optimization (PSO) metaheuristic, an algorithm inspired by the behavior of schools of fish and bird flocks, to explore the solution space and thus solve the OPF problem [21]. They implemented these three methodologies and evaluated different test systems, demonstrating the effectiveness and robustness of each methodology to solve the problem analyzed in this document. In [14], the authors used the techniques described above plus the ant lion optimizer (ALO), which was recently proposed. The ALO imitates the hunting technique of ant lions, which dig a cone-shaped hole in the ground to catch their prey. Importantly, the techniques mentioned above adopted a master–slave methodology to solve the OPF problem. In the master stage, they used optimization algorithms (CGA, BH, PSO, and ALO) to solve the DG sizing problem; in the slave stage, they implemented the SA numerical method to solve the load flow. The approach called “optimal flow” is a cutting-edge topic that requires more analysis and development in order to improve the operating conditions of the system. In the studies described above, optimization techniques were used as solution methods in order to obtain the best solution to the problem, while considering different energy projects to which it can be applied.
1.3. Proposed Solution Methodology and Main Contributions of This Study
Due to the importance of the optimal power flow problem in DC networks and the need to propose new solution methodologies that are more efficient in terms of solution quality and repeatability, this study proposes a new methodology based on a master–slave strategy to solve the OPF problem in DC networks. In the master stage, the proposed methodology applies the technique called multiverse optimizer (MVO) to find the optimal power level to be injected by the DGs in order to minimize electrical power losses in DC networks. In the slave stage, the numerical SA method is employed to solve the load flow problem and evaluate the objective function and the set of constraints related to every possible solution proposed by the master stage [9]. This study used the 21- and 69-node test systems reported in the specialized literature. In addition, it includes three levels of maximum penetration of distributed generation, i.e., , , and of the power supplied by the slack generator in an environment without DGs. The results of the proposed methodology were compared with those of more popular methodologies reported in the literature: CGA [20], PSO [21], BH [17], and ALO [14]. This demonstrated the effectiveness of the MVO and its behavior regarding solution quality. Additionally, in order to evaluate the repeatability of the algorithms in terms of the solution, each simulation was executed 100 times, and the standard deviation obtained was analyzed. This study makes three contributions:
- A new solution methodology based on a master–slave strategy that combines MVO and SA to solve the optimal power flow problem in DC networks of any size
- A methodology based on average solutions and standard deviation to evaluate the effectiveness and repeatability of the solution methods proposed to solve the OPF problem
- Better results in the solution to the OPF problem in DC networks than those reported in the specialized literature.
1.4. Structure of the Paper
This article is organized as follows: Section 2 proposes a mathematical formulation to solve the optimal power flow problem in DC networks, whose objective function is the reduction of power losses associated with energy transport. Section 3 describes the proposed solution methodology, which is composed of a master–slave strategy that combines the multiverse optimizer and the numerical method of successive approximation. Section 4 details the 21- and 69-node systems used for the tests in this study, in addition to other methods used here to compare and validate the proposed solution methodology. Section 5 reports the simulation results obtained by each one of the proposed solution methodologies. Section 6 presents the analysis of the processing times required by the different solution methods used in this paper. Finally, Section 7 draws the conclusions and proposes future research in this field.
2. Mathematical Formulation
Several objective functions to be minimized can be used to mathematically model the OPF problem. Some of them are the minimization of the operating costs of the network, minimization of emissions of polluting substances into the environment, improvement of voltage profiles, improvement of the loadability in distribution lines, and minimization of electrical power losses in the DC network. The selection of the objective function depends on the system owner or the operator of the DC network, and it is subject to the set of constraints that compose DC networks in an environment of distributed generation. The objective function selected in this study is the minimization of the power losses in the network [19], which is presented below along with its set of constraints.
2.1. Objective Function
The objective function is defined as the value to be minimized depending on the constraints that have been determined, in this case, the minimization of power losses. For that purpose, this study used Equation (1):
where denotes the power losses in the electrical network, which directly depend on v and that represent the voltage profiles in each one of the nodes in the DC network calculated based on the load flow and the conductance matrix of the distribution lines, respectively.
2.2. Set of Constraints
The set of equations that compose the constraints of the problem addressed in this paper refer to the technical limits of the pieces of equipment and the operating parameters of the devices that constitute the DC network in an environment of distributed generation. Such equations are detailed below:
The mathematical interpretation of Equations (2) to (5) is the following: Equation (2) represents the power balance in the DC network, where is the power generated by the slack node; , the power supplied by each one of the DGs installed in the DC network; and , the power demanded by the nodes in the network. Additionally, in this equation, denotes a symmetrical positive matrix that contains the nodal voltages of the system in its diagonal, and and are the conductances of the transmission lines and the resistive loads connected to the network, respectively. Equation (3) expresses the minimum and maximum power that each DG installed in the network can supply, where and are the minimum and maximum powers allowed for the DGs, respectively. Equation (4) presents the voltage regulation limits, where and are the minimum and maximum load allowed in each node in the system, respectively. Finally, Equation (5) defines the maximum penetration level allowed for the DGs, where represents the allowable penetration percentage with respect to the power generated by the slack node.
These conditions should be met at all times; for that purpose, the system should be penalized if the aforementioned limits are violated. Equation (6) defines the penalty of the objective function if a constraint is violated.
where to are the penalty factors (which are usually higher than zero). In this study, each one of them is equal to 1000 to force the optimization methods to respect the limits imposed in Equations (2) to (5). This value was obtained heuristically. Moreover, the term is a transposed vector filled with ones that can be used to add together different penalties in the adaptation function. When all these constraints are respected, all the penalty values are null using the and functions, which, in this case, causes z to be equal to .
3. Proposed Solution Methodology
The equations presented in the mathematical formulation above describe a nonlinear optimization problem and represent the OPF problem in DC networks. These equations should be solved using numerical nonlinear methods. Hence, this study proposes dividing the problem into two stages: First, the master stage determines the optimal power level to be injected by the distributed generators located in the DC network. To solve this stage of the problem, this study uses the multiverse optimizer (MVO) [22]. Second, the slave stage calculates the electrical variables that can be used to determine the impact on the objective function, as well as the constraints of the problem of each one of the solutions proposed by the master stage (solves the power flow problem); for this purpose, this methodology implements the SA numerical method. The next subsection describes the master–slave (MVO-SA) methodology proposed in this study:
3.1. Master Stage: Multiverse Optimizer (MVO)
The Big Bang Theory posits that the universe we live in began as a result of a massive explosion [23]. There was nothing before the Big Bang, which was the start of our universe. In turn, the multiverse theory, which is more recent and well known among scientists [24], claims there is more than one Big Bang and that each Big Bang constitutes the beginning of a new universe. In addition, it holds that there are multiple universes that interact and can even clash with each other, and every universe can have different physical laws. The MVO is inspired by this theory, and it uses three of its main concepts: white hole, black hole, and wormhole [22]. A white hole has never been observed in the known universe, but physicists believe that the Big Bang can be considered one of them and the main component for the start of a new universe [25]. White holes expel matter and energy because no object can remain inside them. In turn, black holes, whose behavior is the opposite to that of white holes, have been observed throughout the known universe. They absorb everything that comes close to them: matter and even light. Nothing can escape black holes because their gravitational force is extremely high [26]. Finally, in the multiverse theory, wormholes connect two distant points, i.e., space/time, enabling objects that go through them to travel instantly to any place in the universe and even from one universe to another [27]. Each universe has an inflation rate (cosmic inflation) that causes it to expand in space [28]. One of the cyclic multiverse models [29] holds that multiple universes interact through white holes, black holes, and wormholes to reach a stable situation. This is exactly the inspiration for the MVO algorithm, which is conceptually and mathematically modeled as follows.
The MVO algorithm is based on three concepts of cosmology, i.e., white holes, black holes, and wormholes, which were mentioned above and are mathematically developed to construct the MVO. The search process of the latter can be divided into two stages: exploration and exploitation. White and black holes are used for exploring the search space and discovering regions where the best solutions can potentially be found. In turn, wormholes are used for exploiting the solution space, i.e., a local search around the promising solutions found in the previous stage [22]. The following subsection presents the stages followed in this study for the computational development and to find a solution to the OPF problem using the MVO.
3.1.1. Generation of the Initial Population
Equation (7) is used to generate each one of the objects that compose the initial population of universes, where each universe in the population is a possible solution to the problem (power level to be injected by the DGs). In said equation, the i subindex denotes the i-th universe, and j is the j-th object that composes the i element. In this problem, each one of the objects generated in the different universes is a power level to be injected by each one of the DGs installed in the DC network. The values generated for each one of the objects that make up the universe are located within the solution space, which is limited by the technical constraints of the problem (in this case, the maximum and minimum allowable limits of the power to be injected by the DGs). This is possible by implementing upper and lower bounds , which are assigned to each element in the universe and represent the maximum and minimum power level allowed for each generator in the problem addressed here. In order to explore larger regions of the search space, the first population of universes is generated from random values in the range for each object that composes the different universes. These random numbers multiplied by the difference between the limits can be used to generate a larger distribution of particles over the search space.
The previous equation can be used to find the value of the j object in the i universe. To generate all the universes, this study proposes a matrix of size , where n denotes the number of universes as possible solutions to the problem, and d represents the number of variables in the problem (number of objects that belong to each universe). In (8), is the n-th universe in the matrix. In the specific case of the OPF problem, the number of columns (d) represents the number of DGs that generate the electrical power inside the DC network (different from the slack node), and its value represents the power to be injected by each DG. To obtain the initial population, the values of each were calculated randomly, respecting the limits established in the equations that rule the OPF problem and employing Equation (7) to generate all the objects in the different universes described in the Mathematical Model section.
3.1.2. Calculating the Objective Function
To evaluate the impact of each one of the universes proposed in on the objective function of the problem, the objective function is evaluated for every universe (adaptation function) employing the slave stage (which is described in the following subsection). Subsequently, the values obtained for every solution are stored in the vector called . Thus, we calculate the electrical power losses in every solution for every DG, as well as the penalties in case the constraints established beforehand are not respected.
Finally, the universe that presents the best solution in the matrix (in this case, the lowest power losses) is selected as the incumbent solution, storing the objective function in Equation (10) and the configuration of the variables that compose it during the iterative cycle in Equation (11). To carry out this task, this study proposes to sort the vector of objective functions in ascending order, where the first position represents the best solution that has been found in the current iteration. If during an iteration of the algorithm the incumbent solution is improved, the values of and are updated. In Equation (11), is a vector of , and a denotes the universe that presents the best objective function in each iteration.
3.1.3. Existence of Wormholes
As previously mentioned, the MVO algorithm divides the search process into two stages: exploration and exploitation. This technique uses white and black holes to explore the search space. In this stage, the algorithm tries to discover the most promising regions where the global optimum can be potentially found. In turn, wormholes are used to exploit the promising search spaces obtained in the exploration stage. This stage presents the convergence of the algorithm toward the global optimum (advances toward the best solution). In the MVO method, each solution is assigned an inflation rate that corresponds to the best obtained thus far by each universe, which is proportional to the aptitude function retrieved by the slave stage when the objects proposed by each one of the universes are evaluated (power levels to be injected by the DGs). Additionally, the following rules are applied to the universes of the MVO:
- The higher the , the greater the probability of having a white hole.
- The lower the , the greater the possibility of having a black hole.
- Universes with high tend to send objects through white holes.
- Universes with low tend to receive more objects through black holes.
- Any object in any universe can randomly move toward the best universe through wormholes, regardless of the .
Depending on the specific need, white or black holes can change their behavior if the problem to solve is the maximization or minimization of the objective function. When the movement is toward a higher , it is a maximization problem, where mainly white holes operate. In turn, when it is toward a lower , it is a minimization problem, where mainly black holes operate.
Objects can move between universes through white/black holes (objects can be exchanged inside universes). When a connection is established with a white/black hole between two universes, the universe with the higher is considered to have a white hole, and that with the lower is considered to have black holes. Objects are then transferred from the white holes in the universe of origin to the black holes in the target universe. To exchange objects through universes and carry out the exploitation, all the universes are assumed to have wormholes, regardless of their , in order to randomly transport objects. To provide local changes for each universe and have a high probability of improving the using wormholes, it is assumed that wormhole tunnels are always established between a universe and the best universe formed so far. Two coefficients are fundamental for the optimal operation of the MVO: wormhole existence probability () and travel distance rate ().
Equation (12) below defines as the probability of the existence of wormholes in the universes, which increases linearly over the iterations in order to advance in the exploitation process.
In other words, this equation can generate a rate of change based on the sum of a minimum value and a maximum value , which depend on the algorithm and the iterative process, where l is the current iteration and L is the maximum number of iterations. This enables changes in the exploration and exploitation levels of the optimization technique.
Additionally, in Equation (13), is the factor that defines the rate of variation or distance over which an object can be transported through a wormhole around the best universe obtained thus far. Unlike , increases over the iterations to have a more precise local exploitation/search around the best universe obtained.
where P denotes the level of precision of the exploitation of the algorithm, which aims to guarantee that, the higher its value, the faster and more precise the search (exploitation) of the algorithm. Depending on the problem addressed, and can be considered constant values, and they change according to the needs of each problem. In this study, as indicated at the start of the problem, P must be a variable due to the nonlinear parameters that the equations use.
Figure 1 shows the existing relationship between and . It indicates that grows in a linear fashion from its initial value ( in this case) up to 1 as the iterations increase. starts from an initial value of and falls to its minimum value in an exponential manner . Thus, these factors can be used to control the convergence of the algorithm by controlling the step forward of the universes inside the solution space.
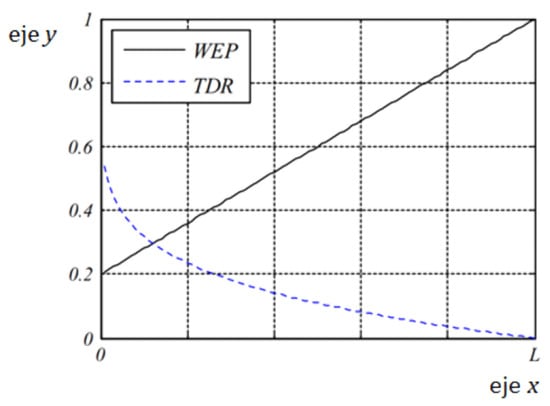
Figure 1.
WEP vs. TDR, taken from [22].
3.1.4. Evolution of the Universes in the Iterative Process
For the evolution of the universes contained in the population, the MVO generates two strategies to alter its universes from one iteration to the next so that they finally converge toward the universe with the best characteristics. The first change made to the universes refers to the interaction between white and black holes; the second one is the generation of wormholes. Each iteration of the algorithm enables each one of the universes contained in the population to apply or not both movement strategies based on the evaluation of the local incumbent (of each universe) and the global incumbent of the set of universes, as well as the generation of random decision numbers. Thus, the objects inside each universe can be changed or not depending on a decision that contains a greedy random factor that boosts the exploration of the algorithm [13].
3.1.5. Updating the Universes Using the Interaction between White and Black Holes
The MVO presents the relationship between white and black holes, which enables the exchange of objects between universes through white/black holes and where a universe can update the value of an object based on the information of the other object from another universe. The interaction between them occurs as a function of . Objects travel from a white hole of origin to a target black hole. Thus, objects in a universe disappear through a black hole and are replaced with others coming from white holes. Equation (14) shows how the normalized inflation rate of the i-th universe is obtained, where the values of calculated for each universe in the population are normalized. When this equation is applied to the set of universes, we obtain the vector of (where n is the number of solutions or universes) with normalized values in a range.
The white/black tunnel is produced by Equation (15), where each j object in the i universe can be replaced with the j object of the k universe, and the position of k is selected by means of a roulette wheel that offers the option of randomly selecting any universe in the solution space. The exchange of objects between universes takes place for the same element, and it is performed by comparing a random number with the normalized inflation rate .
where is the j object of the k universe selected by the roulette wheel, and it is transported through the white/black tunnel to the i universe. An object is transported to the i universe if and only if the random value in the range is lower than the . Otherwise, there is no exchange of objects through white/black tunnels; that is, the object of the universe will not be updated and it will keep its current value. To determine the k-th universe to which the j object will be moved, Equation (16) is implemented. In said equation, k is determined using the roulette wheel function [30], which selects a random number in the range, where n is the number of solutions proposed for the problem.
Algorithm 1 presents the pseudocode to select the k universe by means of Equation (16).
| Algorithm 1 Proposed pseudocode of the roulette wheel to select the k universe to transport the j element to the i universe. |
|
Importantly, as this is a minimization problem, the selection using the roulette wheel should be performed with . If the problem to be solved is a maximization one, should be changed for the positive .
3.1.6. Updating Universes Based on Wormholes
In the MVO algorithm, the optimization process starts with the creation of a set of random universes. When the objects in each one of the universes are updated through the interaction of white and black holes at each iteration, the objects in universes with high tend to move to the universes with low inflation rates through multiple white/black tunnels. Importantly, the represent the evaluation of the objective function, in this case, power losses. As this is a minimization problem, the objects tend to move to universes with a lower (fewer power losses). Meanwhile, each universe experiences random teleportation of its objects through wormholes to the best universe . This process is repeated until a stopping criterion is met (for instance, a maximum number of iterations). To guarantee the changes in each universe, there should be a high probability of improvement of the by means of wormholes, assuming that the wormhole tunnels are always established between new universes randomly generated based on and , i.e., the best universe, which are represented in Equation (17).
This equation can be used to generate new j objects for the i universe at each iteration, which depends on and , i.e., a random number in the range. If is lower than , a new j element will be generated for the i universe as a function of the value that takes, i.e., a random number in the range. If is lower than 0.5, the lower bound is subtracted from the upper bound . The result is multiplied by a random number () in the range. The value thus obtained is added and then multiplied by the parameter. Finally, the outcome of this operation is added together with , which is the j object of the best universe obtained thus far (incumbent solution). If is higher than or equal to 0.5, the lower bound is subtracted from the upper bound , and the result is multiplied by . The resulting value is added to the bound and then multiplied by the parameter. Finally, the value obtained with this operation is subtracted with . However, if is greater than or equal to , a new j object will not be created in the i universe; instead, the current value of the j object will be maintained until is lower than .
Black holes, white holes, and wormholes are updated at each iteration until the algorithm meets the stopping criteria described below.
3.1.7. Stopping Criteria
The master stage uses two stopping criteria: (1) the counter reaches the maximum number of iterations or (2) the algorithm reaches the limit of non-improvement iterations. These stopping criteria are detailed as follows:
- The master stage will finish the iterative process when the incumbent solution (the best obtained thus far) is not updated after an x number of consecutive iterations. This is possible by adding a non-improvement counter to the code .
- The computational analysis will finish the iterative process when the algorithm reaches a maximum number of allowable iterations .
3.2. Slave Stage
The slave stage calculates the adaptation function associated with each solution (universe) provided by the master stage. That is, the slave stage enables us to determine the electrical variables of the system in each possible scenario of power injection by the DGs, which is used to establish the electrical power losses in the DC network (i.e., the objective function to be solved in this study), as well as the set of constraints that composes the problem. For this purpose, it is necessary to solve the load flow in the DC network by means of an iterative method and thus determine the impact of the proposed solution and its compliance with the constraints of the OPF problem. This study aims to solve the load flow using the SA method presented in [4], which was selected thanks to its excellent performance in terms of solution and convergence time. In order to implement said method, the following equation can be used to find the solution to the load flow:
where is a positive symmetrical matrix that contains the conductances of the conducting lines and the resistive loads of the DC network, except for the slack node; is the voltage profile of the slack generator; and is the voltage in the demand nodes of the system. By means of a mathematical development applied to (18), we can obtain the equation that can be used to calculate the nodal voltages in the demand nodes:
In order to calculate the voltage profiles, an iterative process should be implemented to find such values with an almost-null convergence error. For that purpose, a t counter should be added to Equation (19). As a result, the equation is:
Finally, Algorithm 2 presents the pseudocode of the master–slave methodology (MVO-SA) that solves the OPF problem.
| Algorithm 2 Hybrid MVO-SA optimization algorithm. |
|
3.3. Comparison of Methods
To validate the solution method proposed in this paper, it was compared with four other solution methodologies reported in the literature: PSO, BH, CGA, and ALO. They were selected due to their excellent performance and convergence in the solution to the OPF problem in DC networks [14,19]. All these methods employ a master–slave methodology. The master stage employs the respective optimization algorithm, and the slave stage uses the SA method proposed in [4] to solve the load flow. To conduct the tests and improve the impact on the electrical systems, the 21- and 69-node systems presented in [2,21,31] were adapted here. Such impact was evaluated using three percentages of penetration of the electrical power supplied by the slack generator: , , and .
To guarantee the same conditions, each one of the solution methodologies used in this study was tuned in each one of the test systems (21 and 69 nodes). The objective of this step is that each one of the techniques achieves the best possible solution in terms of electrical power losses. To carry out said tuning, this study implemented the PSO optimization algorithm used in [21]. The tuning parameters used in this case were a population size in a [2–100] range, a maximum number of iterations in a [1–1000] range, and a number of non-improvement iterations in a [1–1000] range. In this tuner, the number of particles was 10 and the number of iterations was 300. Additionally, for the MVO, the P parameter was optimized employing a [1–10] range, which represents the level of precision of the algorithm’s exploitation. Table 1 and Table 2 report the results obtained after the tuning of each one of the techniques for the 21- and the 69-node system, respectively.

Table 1.
Parameters of the continuous methods employed here in the master stage for the 21-node system.

Table 2.
Parameters of the continuous methods employed here in the master stage for the 69-node system.
4. Test Scenarios and Considerations
In order to evaluate the effectiveness and robustness of the methodology proposed in this study, two test systems were implemented: a 21-node system [31] and a 69-node system [21]. These systems are widely used in the specialized literature to validate the impact of optimization techniques implemented to solve the OPF problem. Such test systems are composed of constant power loads and a single slack generator in a scenario without DGs, which constitutes the “base case”.
4.1. 21-Node System
Figure 2 presents the 21-node system. The base case of this system employs a base voltage of 1 kV and a base power of 100 kW. In this system, the slack generator produces 581.6 kW, and the power losses amount to 27.603 kW. With respect to the current limits of the branches, homogeneous networks were considered for both systems. A 900-kcmil conductor ( = 520 A) was selected for the 21-bus test system based on the operation of the base case (without DGs installed). The voltage bounds of both test systems were set at +/− 10% of the nominal voltage [32]. Because this study addresses the OPF problem, the location of the DGs here is the same as that reported in [17]; therefore, they are located at nodes 9, 12, and 16 in the network. Importantly, the evaluation of the base case does not consider power injection or the installation of such devices in the network. In this test system, the minimum power was 0 kW for all the DGs at all levels of penetration. In addition, the maximum powers of distributed generation were 116.3207, 232.6414, and 348.9620 kW, which correspond to the , , and of the power provided by the slack generator in the base case, respectively.
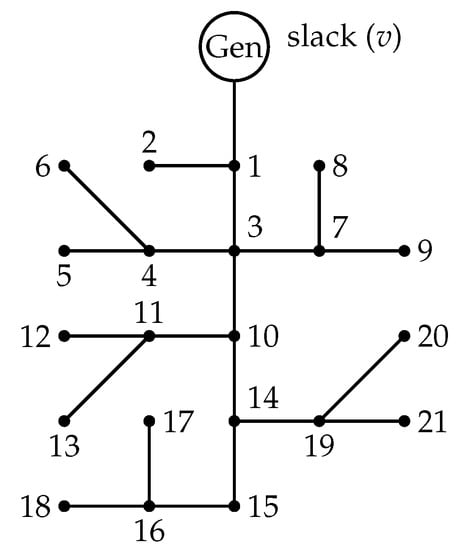
Figure 2.
The 21-node system.
Table 3 shows the connections between the nodes in the 21-node network, specifying the output and input nodes, the resistance of each conduction line, and the powers demanded by each one of the nodes in the system in

Table 3.
Electrical parameters for the 21-node system.
4.2. The 69-Node System
Figure 3 shows the electrical diagram of the 69-node system, which is composed of 68 lines and 69 nodes. Originally, this test system operates in DC [21], but thanks to the adaptation in the previously cited document, it was possible to implement it for DC networks. For such adaptation, the base voltage was 12.66 kV, the power base was 100 kV, and the active elements were disregarded.
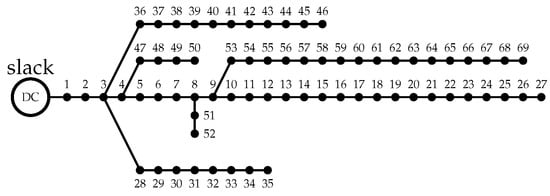
Figure 3.
The 69-node system.
In this test system, the slack generator produces kW, and the power losses equal kW. With respect to the current limits, a 400-kcmil electrical conductor ( = 335 A) was selected for this test system considering a non-telescopic configuration, as well as the same voltage limits used in the 21-bus test system [32]. Finally, the location of the DGs was defined as in [21], i.e., at nodes 26, 61, and 66. In this test system, the minimum power was 0 kW for all the DGs at all levels of penetration. In addition, the maximum powers of distributed generation were 808.6195, 1617.2390, and 2425.8585 kW, which correspond to , , and of the power provided by the slack generator in the base case, respectively. Table 4 details the connection between the nodes in the network of the 69-node system, the output and input nodes, the resistance of each conduction line, and the power demanded by each one of the nodes in the system.

Table 4.
Electrical parameters for the 69-node system.
5. Simulations and Results
This section analyzes the results obtained from the implementation of the solution methods in the two test systems. All the simulations were conducted in Matlab (version 2018b), a numerical computing system, running on a desktop computer with 4GB of RAM, an Intel® Core™ i5-8250U CPU @1.60GHz 1.80GHz processor, a 225-GB solid state drive, and Windows 10 PRO. All the methodologies were executed 100 times in order to evaluate the repeatability of the solutions and the standard deviation of each one of the techniques. The following subsection presents their results in the two test systems.
5.1. 21-Node System
Table 5 reports the results of each one of the methods for the OPF problem in the 21-node system at three maximum levels of penetration of distributed generation: , , and of the power provided by the slack node in the base case. From left to right, said table specifies the proposed solution method; the nodes where the DGs are located and the power each one of them injects into the network in (kW); the minimum power losses in (kW) and the percentage of reduction compared to the base case (%); the average value of in (kW) and the average reduction with respect to the base case (%); the standard deviation in percentage, which was obtained after each solution method was executed 100 times; the worst voltage; and the maximum current in the DC grid employing the distributed power injection proposed by each solution methodology. Figure 4 and Figure 5 are bar charts that show the differences, in percentage, between the algorithms and the new proposed methodology regarding minimum and average , respectively.

Table 5.
Results of the simulations of the 21-node system.
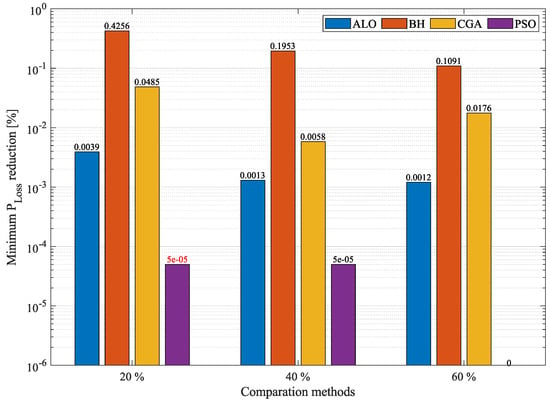
Figure 4.
Percentage of reduction in minimum losses obtained by the MVO in the 21-node system compared to other methodologies.
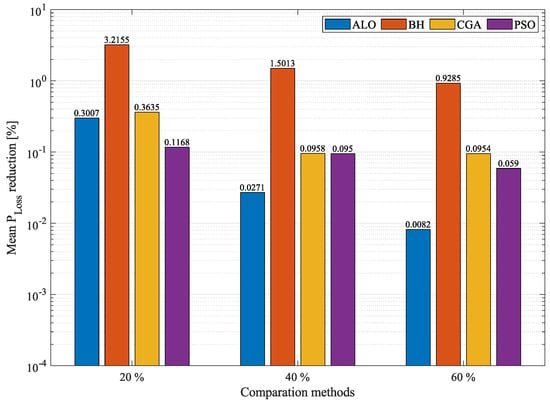
Figure 5.
Percentage of reduction in average losses obtained by the MVO in the 21-node system compared to other methodologies.
Table 5 can be used to compare the results obtained by different solution methodologies proposed for the 21-node system. Columns 6 and 7 in this table indicate that all the solution methods satisfied the voltage and current bounds established here for the 21-bus test system. Figure 4 and Figure 5 were created to analyze the minimum and average reduction of power losses in the system. Figure 4 details the minimum loss reductions obtained by each methodology at different DG penetration levels: , , and . In the first case, i.e., a penetration of DG, PSO reduced the minimum by , outperforming the MVO by only . The MVO took the second place in this regard but outperformed the ALO by . The CGA and BH are in fourth and fifth position, respectively, outperformed by the MVO by and , respectively. The proposed methodology achieved an average reduction in minimum of . In the scenario that allows a power injection, the MVO presented the greatest reduction in minimum with respect to the base case: . It outperformed PSO, ALO, CGA, and BH by 5 × , , , and , respectively. In the case of penetration, the MVO and PSO exhibited the same reduction in minimum , i.e., , thus outperforming the ALO by , the CGA by , and the BH by . In terms of average in the 21-node system, the MVO outperformed all the other solution techniques at the three penetration percentages (see Figure 5). At a penetration, the MVO presented an average reduction in of , thus outperforming PSO, ALO, CGA, and BH by , , , and , respectively. At a penetration of distributed generation, the MVO presented a reduction in average of , thus outperforming ALO by , PSO by , CGA by , and BH by . Finally, at a penetration, the MVO exhibited a reduction in mean of , thus outperforming ALO by , PSO by , CGA by , and BH by . This demonstrates that the MVO is superior to the other techniques in terms of precision and repeatability.
To complete the analysis of the 21-node system, the repeatability of the solutions was examined. For that purpose, Figure 6 presents the reduction in standard deviation obtained by the proposed solution methodology compared to that of its counterparts. This figure indicates that the MVO outperforms all the other optimization techniques at all the penetration levels allowed in the 21-node system. At penetration, the MVO outperforms the CGA, PSO, ALO, and BH by , , , and , respectively. At DG penetration, the MVO outperforms the CGA (in second place) by , which is followed by ALO (in third place) with a difference of . PSO and BH are in fourth and fifth place, outperformed by and , respectively. Finally, at a penetration, the MVO presents an average reduction of with respect to the other techniques. Based on these data, it can be concluded that the solution is highly reproducible in this system, which guarantees that a good solution is obtained every time the algorithm is executed. By contrast, all the other methods exhibit a standard deviation higher than that of the technique proposed in this paper.
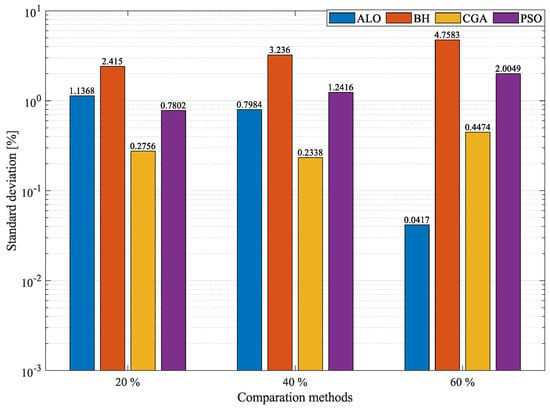
Figure 6.
Percentage of standard deviation obtained by the MVO in the 21-node system compared to other methodologies.
5.2. The 69-Node System
Table 6 presents the results of the techniques used to solve the OPF problem in the simulation of the 69-node system. Columns 6 and 7 in this table indicate that all the solution methods satisfied the voltage and current limits established here for the 69-bus test system. Table 6, which was organized the same way as Table 5, presents the results of the solution methodologies proposed for the 69-node system. As in the case of the 21-node system, Figure 7 and Figure 8 can be used to compare the percentages of minimum and average , respectively. Regarding minimum , Figure 7 reports the reduction in minimum power losses obtained by the MVO compared to the other methods. At a penetration, PSO achieved a reduction percentage of , outperforming the MVO (in second place) by an almost negligible percentage of . In this scenario, the MVO outperformed the ALO, CGA, and BH in terms of minimum losses by , , and , respectively. At a power injection, the MVO achieved the greatest reduction in minimum with respect to the base case: . Hence, it outperformed PSO, ALO, CGA, and BH by , , , and , respectively. In the case of penetration, the MVO and PSO produced the same reduction in minimum , thus outperforming ALO by , CGA by , and BH by . Figure 8, which reports the reduction in average in the 69-node system, indicates that the MVO outperforms all the other techniques at the three penetration percentages, except for PSO at a penetration, where they produced the same result. At a penetration, the MVO achieved a reduction in average of , thus outperforming PSO, ALO, CGA, and BH by , , , and , respectively. At a penetration, the MVO produced a reduction in average of , thus outperforming PSO by , ALO by , CGA by , and BH by . Finally, at a penetration level, the MVO and PSO presented the same reduction in mean , i.e., , thus outperforming ALO by , CGA by , and BH by . Although the results in the 69-node system are similar, in most cases, the MVO outperforms the other techniques employed here for comparison, especially in terms of average .

Table 6.
Results of the simulations of the 69-node system.
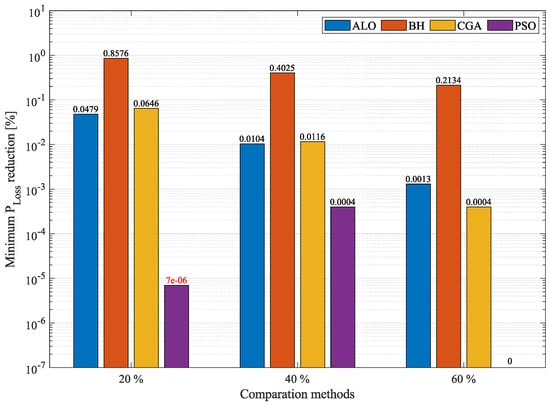
Figure 7.
Percentage of reduction in minimum losses obtained by the MVO in the 69-node system compared to other methodologies.
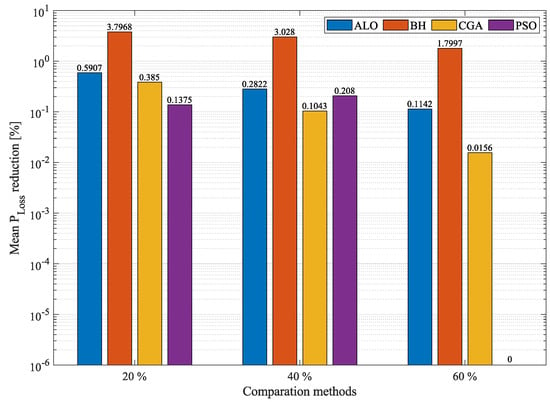
Figure 8.
Percentage of reduction in average losses obtained by the MVO in the 69-node system compared to other methodologies.
To complete the analysis of the 69-node system, the repeatability of the solutions proposed here for the OPF problem was examined using the standard deviation. In Figure 9, the MVO outperforms most of the other optimization techniques in terms of each one of their average standard deviations, except for PSO at a penetration, which produced a result 6 × better, a difference that is almost negligible. At a penetration, the MVO outperforms all the other techniques, with an average standard deviation of ; likewise, at a penetration, the MVO outperforms all the other algorithms, with an average standard deviation of . Finally, although PSO outperformed the MVO at a penetration, the latter presents an average standard deviation of with respect to all the methods used for comparison. These data show that the MVO is the most precise and repeatable technique in different test systems at multiple penetration percentages.
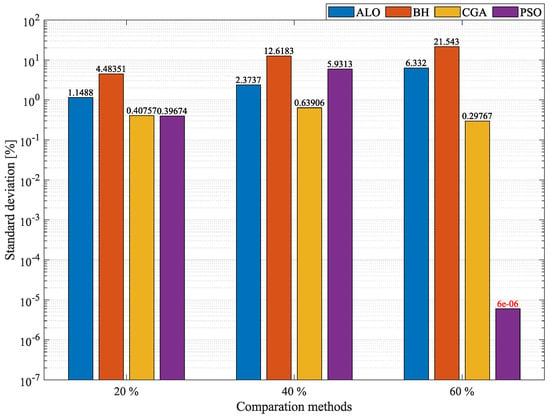
Figure 9.
Percentage of standard deviation obtained by the MVO in the 69-node system compared to other methodologies.
Figure 7, Figure 8 and Figure 9 use a logarithm with base 10 to better visualize the differences between the techniques. In Figure 7 and Figure 9, the number in red indicates that the MVO was outperformed by PSO. In order to clearly establish which optimization technique could provide the best solution to the OPF problem regardless of the size of the DC network, the general behavior of all the algorithms was analyzed by evaluating their results regarding minimum and average . Said results are reported in Figure 10, Figure 11 and Figure 12. These figures can be used to analyze the precision of the algorithms and determine the technique that offers the best behavior in terms of the solution for each system. Figure 10 presents the mean of the minimum and average in the 21-node system. The percentages of reduction of mean at , , and penetration levels were averaged; the same process was applied to the average . This was the procedure followed here to obtain the results in Figure 10, which can be used to determine the algorithm that achieves the best minimum and average in the 21-node system. Additionally, Figure 13 presents the differences between the MVO and the other optimization algorithms in the 21-node system. In said figure, the MVO presents an adequate reduction in average minimum , only outperformed by PSO by 8 × (an almost negligible value). The MVO outperformed ALO, CGA, and BH by , , and , respectively. Regarding the mean values of the average , the MVO worked better than the other solution methodologies, outperforming PSO by , CGA by , ALO by , and BH by . This shows that the MVO is the best solution methodology for the 21-node system.
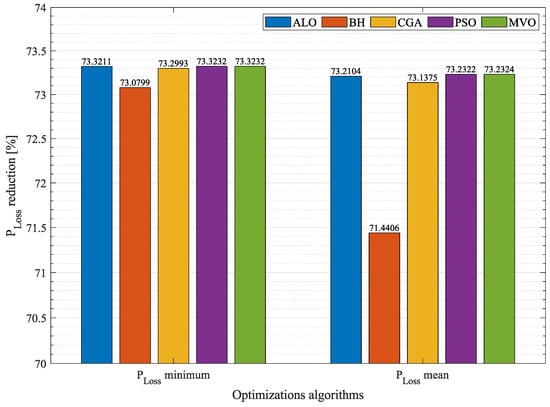
Figure 10.
Average percentage of losses in the 21-node system.
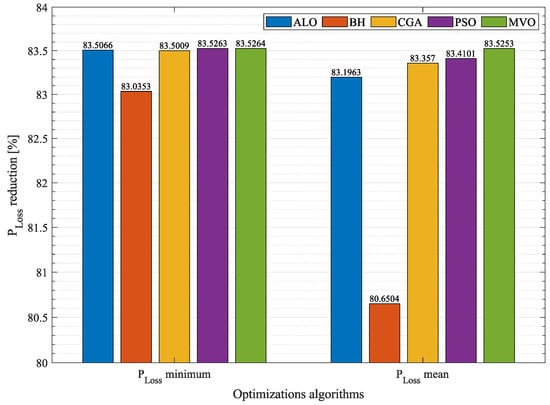
Figure 11.
Average percentage of losses in the 69-node system.
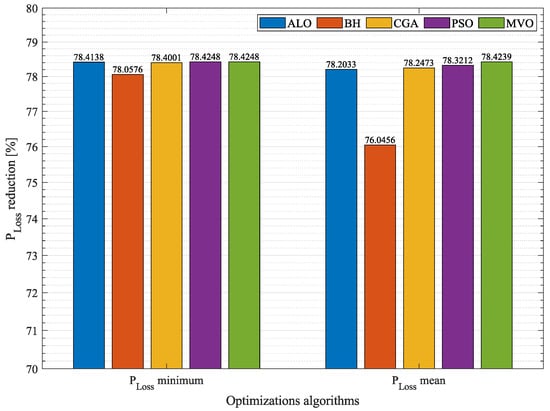
Figure 12.
Robustness of the solution methodologies proposed to solve the OPF problem.
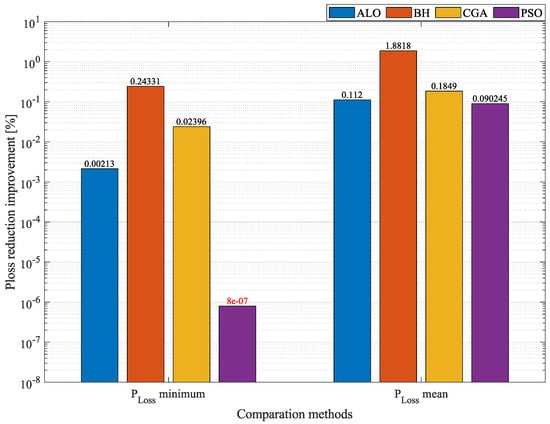
Figure 13.
Percentage of improvement obtained by the MVO in the 21-node system compared to other methodologies.
Figure 11 presents the mean of the minimum and average in the 69-node system. The percentages of reduction in mean and average at , , and injection levels obtained by each one of the optimization techniques were averaged, which produced the results reported in Figure 11. As with the 21-node system, this figure can be used to establish which algorithm can obtain the best minimum and average . Likewise, Figure 14 highlights the differences between the MVO and the other optimization algorithms. In the 69-node system, the MVO achieved the best percentage of reduction in average minimum , outperforming PSO by , ALO by , CGA by , and BH by . Regarding the mean of average , the MVO outperformed PSO, CGA, ALO, and BH by , , , and , respectively. This demonstrates that the MVO is the best solution methodology in the 21- and 69-node systems in terms of solution quality; furthermore, its performance improves as the network grows.
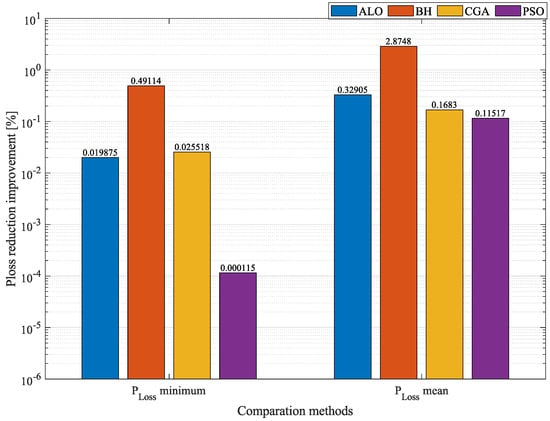
Figure 14.
Percentage of improvement obtained by the MVO in the 69-node system compared to other methodologies.
Finally, to demonstrate the robustness of each one of the optimization techniques, Figure 12 reports the average minimum percentages and average percentages obtained by the solution methods in the two test systems at different DG penetration levels. These values are the result of averaging the values obtained in each scenario and test system. Therefore, the MVO presents the best minimum percentage, with an average reduction of , and the best average level in the two test systems, with a reduction of compared to the other methods tested here. Based on this analysis, it can be concluded that the MVO offers the best solution to the OPF problem in a network of any size. This demonstrates that, compared to other solution methodologies that have achieved a high performance in the specialized literature, the methodology proposed in this study can obtain the highest percentage of reduction in minimum and average by solving the optimal power flow problem of the DGs in the DC network.
6. Processing Time Analysis
The previous sections presented and discussed the excellent results obtained by the MVO in terms of repeatability and solution quality for solving the optimal power problem in DC grids of any size. However, these excellent results also come at a cost: the processing time they require. With respect to the 21-bus test system, the average processing time required by the solution methods were the following: MVO (11.69s), ALO (6.378s), BH (2.73s), CGA (3s), and PSO (3.78s). According to these results, the proposed method presented the longest processing time. Nevertheless, it is less than 13s, which, in real conditions of operation, is considered an excellent time to solve the optimal power flow problem because, in real life, the power flow analysis of electrical networks takes hours or, only in some cases, minutes. In the case of the 69-bus test system, all the processing times required by the solution methods increased: MVO (132s), ALO (9.67s), BH (13.91s), CGA (17.38s), and PSO (13.67s). Again, the MVO exhibited the longest processing time in the 69-bus test system, with an average value close to two minutes [33,34]. Nevertheless, said time is also adequate for solving the problem of optimal power flow in the 69-bus test system because of the same reasons explained regarding its 21-bus counterpart. These results demonstrate that, to obtain the best results in terms of repeatability and quality solution, it is necessary to sacrifice a little time in the search process conducted by the optimization algorithm. Due to this problem (i.e., the fact that the MVO takes longer to solve the optimal power flow problem), future studies should use parallel processing tools to improve the performance of the MVO in terms of processing times so that this solution method offers the best trade-off between quality solution and required processing time.
7. Conclusions
This paper proposed the implementation of a new optimization technique (MVO) to solve the OPF problem in DC networks through a master–slave methodology. In the master stage, the MVO determines the electrical power to be injected by each DG located in the DC network. In the slave stage, the numerical method known as SA establishes the impact of every solution proposed by the master stage on the objective function (reduction in power losses) and the constraints of the problem. In order to prove the efficiency and quality of the new solution methodology employed in this document, it was compared with four other optimization techniques: ALO, BH, CGA, and PSO. Each test was conducted using three levels of distributed generation penetration: , , and . Such percentages represent the power provided by the main generator in the network (slack) in the base case (without DGs). The results and discussion here demonstrated that, when used to find a good quality solution, the MVO presents a higher percentage of reduction in average , as well as an excellent behavior regarding standard deviation. Thus, this technique is efficient in terms of precision and repeatability. Likewise, in several cases, the MVO obtained the best solution regarding minimum , only outperformed by PSO by an almost negligible difference in the 21- and 69-node systems at a penetration level. Nevertheless, Figure 12 demonstrates that the MVO is the best technique to solve the OPF problem in DC networks of any size thanks to its low standard deviation and its great capacity to converge toward the best solution. The limitations of the solution methodology proposed in this paper can be overcome by (1) including an analysis of the problem of optimal location of DGs, (2) integrating and operating energy storage systems in order to improve the operation quality of the grid, (3) reducing the processing times required by the MVO and other solution methods (faster is better), and (4) using objective functions that incorporate economic and environmental indices. Hence, future studies should propose optimization strategies to solve the problem of optimal integration of DGs using the MVO-SA presented here in order to solve the sizing problem (optimal power flow problem). Moreover, further research should investigate the optimal location and operation of energy storage elements inside the DC grid, which were not included in this study. Parallel processing tools can be utilized to improve the performance of the solution methodology in terms of processing times. With respect to the indices in the objective functions, the methodology proposed here was only focused on the reduction of . However, said objective function can be changed to reduce the operating costs of a network or its emissions into the environment. Finally, it should be highlighted that the MVO-SA methodology can also be used to solve the OPF problem in AC networks.
Author Contributions
Conceptualization, A.A.R.-M., L.F.G.-N., J.M., O.D.M. and A.-J.P.-M.; methodology, A.A.R.-M., L.F.G.-N., J.M., O.D.M. and A.-J.P.-M.; formal analysis, A.A.R.-M., L.F.G.-N., J.M., O.D.M. and A.-J.P.-M.; investigation, A.A.R.-M., L.F.G.-N., J.M., O.D.M. and A.-J.P.-M.; resources, A.A.R.-M., L.F.G.-N., J.M., O.D.M. and A.-J.P.-M.; writing—original draft preparation, A.A.R.-M., L.F.G.-N., J.M., O.D.M. and A.-J.P.-M. All authors have read and agreed to the published version of the manuscript.
Funding
The authors would like to thank the Instituto Tecnológico Metropolitano (ITM), two of its research groups (AEyCC and MATyER), and the University of Córdoba.
Acknowledgments
This work was supported by the Centro de Investigación y Desarrollo Científico of the Universidad Distrital Francisco José de Caldas under grant 1643-12-2020 associated with the project entitled “Desarrollo de una metodología de optimización para la gestión óptima de recursos energéticos distribuidos en redes de distribución de energía eléctrica”; the Dirección de Investigaciones of the Universidad Tecnológica de Bolívar under grant PS2020002 associated with the project entitled “Ubicación óptima de bancos de capacitores de paso fijo en redes eléctricas de distribución para reducción de costos y pérdidas de energía: Aplicación de métodos exactos y metaheurísticos”; and the Spanish Ministry of Science, Innovation and Universities under the program “Proyectos de I+D de Generacion de Conocimiento” of the National Program for Knowledege Generation and Scientific and Technological Strengthening of the R&D&i System under grant number PGC2018-098813-B-C33.
Conflicts of Interest
The authors declare no conflict of interest.
References
- Taba, M.F.A.; Mwanza, M.; Çetin, N.S.; Ülgen, K. Assessment of the energy generation potential of photovoltaic systems in Caribbean region of Colombia. Period. Eng. Nat. Sci. 2017, 5. [Google Scholar] [CrossRef][Green Version]
- Gil-González, W.; Montoya, O.D.; Holguín, E.; Garces, A.; Grisales-Noreña, L.F. Economic dispatch of energy storage systems in dc microgrids employing a semidefinite programming model. J. Energy Storage 2019, 21, 1–8. [Google Scholar] [CrossRef]
- Grisales, L.F.; Grajales, A.; Montoya, O.D.; Hincapie, R.A.; Granada, M.; Castro, C.A. Optimal location, sizing and operation of energy storage in distribution systems using multi-objective approach. IEEE Lat. Am. Trans. 2017, 15, 1084–1090. [Google Scholar] [CrossRef]
- Montoya, O.D.; Garrido, V.M.; Gil-González, W.; Grisales-Noreña, L.F. Power flow analysis in DC grids: Two alternative numerical methods. IEEE Trans. Circuits Syst. II Express Briefs 2019, 66, 1865–1869. [Google Scholar] [CrossRef]
- Montoya, O.D.; Grisales-Noreña, L.F.; Amin, W.T.; Rojas, L.A.; Campillo, J. Vortex Search Algorithm for Optimal Sizing of Distributed Generators in AC Distribution Networks with Radial Topology. In Proceedings of the Workshop on Engineering Applications, Santa Marta, Colombia, 16–18 October 2019; Springer: Berlin/Heidelberg, Germany, 2019; pp. 235–249. [Google Scholar]
- Wang, W.; Barnes, M. Power flow algorithms for multi-terminal VSC-HVDC with droop control. IEEE Trans. Power Syst. 2014, 29, 1721–1730. [Google Scholar] [CrossRef]
- Huang, G.; Ongsakul, W. Managing the bottlenecks in parallel Gauss-Seidel type algorithms for power flow analysis. IEEE Trans. Power Syst. 1994, 9, 677–684. [Google Scholar] [CrossRef]
- Montoya, O.D.; Grisales-Noreña, L.F.; Gil-González, W. Triangular matrix formulation for power flow analysis in radial DC resistive grids with CPLs. IEEE Trans. Circuits Syst. II Express Briefs 2019, 67, 1094–1098. [Google Scholar] [CrossRef]
- Montoya, O.D.; Grisales-Noreña, L.; González-Montoya, D.; Ramos-Paja, C.; Garces, A. Linear power flow formulation for low-voltage DC power grids. Electr. Power Syst. Res. 2018, 163, 375–381. [Google Scholar] [CrossRef]
- Montoya, O.D. On the existence of the power flow solution in DC grids with CPLs through a graph-based method. IEEE Trans. Circuits Syst. II Express Briefs 2019, 67, 1434–1438. [Google Scholar] [CrossRef]
- Grisales-Noreña, L.F.; Montoya, O.D.; Gil-González, W.J.; Perea-Moreno, A.J.; Perea-Moreno, M.A. A Comparative Study on Power Flow Methods for Direct-Current Networks Considering Processing Time and Numerical Convergence Errors. Electronics 2020, 9, 2062. [Google Scholar] [CrossRef]
- Noreña, L.F.G.; Cuestas, B.J.R.; Ramirez, F.E.J. Ubicación y dimensionamiento de generación distribuida: Una revisión. Cienc. E Ing. Neogranadina 2017, 27, 157–176. [Google Scholar] [CrossRef]
- Rendon, R.A.G.; Zuluaga, A.H.E.; Ocampo, E.M.T. Técnicas Metaheuristicas de Optimización; Universidad Tecnologica de Pereira: Risaralda, Colombia, 2008. [Google Scholar]
- Garzon-Rivera, O.; Ocampo, J.; Grisales-Norena, L.; Montoya, O.; Rojas-Montano, J. Optimal Power Flow in Direct Current Networks Using the Antlion Optimizer. Stat. Optim. Inf. Comput. 2020, 8, 846–857. [Google Scholar] [CrossRef]
- Li, J.; Liu, F.; Wang, Z.; Low, S.H.; Mei, S. Optimal power flow in stand-alone DC microgrids. IEEE Trans. Power Syst. 2018, 33, 5496–5506. [Google Scholar] [CrossRef]
- Montoya, O.D.; Gil-González, W.; Garces, A. Sequential quadratic programming models for solving the OPF problem in DC grids. Electr. Power Syst. Res. 2019, 169, 18–23. [Google Scholar] [CrossRef]
- Velasquez, O.S.; Montoya Giraldo, O.D.; Garrido Arevalo, V.M.; Grisales Norena, L.F. Optimal power flow in direct-current power grids via black hole optimization. Adv. Electr. Electron. Eng. 2019, 17, 24–32. [Google Scholar] [CrossRef]
- Giraldo, J.; Montoya, O.; Grisales-Noreña, L.; Gil-González, W.; Holguín, M. Optimal power flow solution in direct current grids using Sine-Cosine algorithm. J. Phys. Conf. Ser. 2019, 1403, 012009. [Google Scholar] [CrossRef]
- Grisales-Noreña, L.F.; Garzón Rivera, O.D.; Ocampo Toro, J.A.; Ramos-Paja, C.A.; Rodriguez Cabal, M.A. Metaheuristic Optimization Methods for Optimal Power Flow Analysis in DC Distribution Networks. 2020. [Google Scholar]
- Moradi, M.H.; Abedini, M. A combination of genetic algorithm and particle swarm optimization for optimal DG location and sizing in distribution systems. Int. J. Electr. Power Energy Syst. 2012, 34, 66–74. [Google Scholar] [CrossRef]
- Grisales-Noreña, L.F.; Gonzalez Montoya, D.; Ramos-Paja, C.A. Optimal sizing and location of distributed generators based on PBIL and PSO techniques. Energies 2018, 11, 1018. [Google Scholar] [CrossRef]
- Mirjalili, S.; Mirjalili, S.M.; Hatamlou, A. Multi-verse optimizer: A nature-inspired algorithm for global optimization. Neural Comput. Appl. 2016, 27, 495–513. [Google Scholar] [CrossRef]
- Khoury, J.; Ovrut, B.A.; Seiberg, N.; Steinhardt, P.J.; Turok, N. From big crunch to big bang. Phys. Rev. D 2002, 65, 086007. [Google Scholar] [CrossRef]
- Tegmark, M. Parallel universes. Sci. Am. 2003, 288, 40–51. [Google Scholar] [CrossRef] [PubMed]
- Eardley, D.M. Death of white holes in the early universe. Phys. Rev. Lett. 1974, 33, 442. [Google Scholar] [CrossRef]
- Davies, P.C. Thermodynamics of black holes. Rep. Prog. Phys. 1978, 41, 1313. [Google Scholar] [CrossRef]
- Morris, M.S.; Thorne, K.S. Wormholes in spacetime and their use for interstellar travel: A tool for teaching general relativity. Am. J. Phys. 1988, 56, 395–412. [Google Scholar] [CrossRef]
- Guth, A.H. Eternal inflation and its implications. J. Phys. A Math. Theor. 2007, 40, 6811. [Google Scholar] [CrossRef]
- Steinhardt, P.J.; Turok, N. The cyclic model simplified. New Astron. Rev. 2005, 49, 43–57. [Google Scholar] [CrossRef]
- Lipowski, A.; Lipowska, D. Roulette-wheel selection via stochastic acceptance. Phys. A Stat. Mech. Its Appl. 2012, 391, 2193–2196. [Google Scholar] [CrossRef]
- Garcés, A. On the convergence of Newton’s method in power flow studies for DC microgrids. IEEE Trans. Power Syst. 2018, 33, 5770–5777. [Google Scholar] [CrossRef]
- Grisales-Noreña, L.F.; Montoya, O.D.; Ramos-Paja, C.A.; Hernandez-Escobedo, Q.; Perea-Moreno, A.J. Optimal location and sizing of distributed generators in DC Networks using a hybrid method based on parallel PBIL and PSO. Electronics 2020, 9, 1808. [Google Scholar] [CrossRef]
- Grisales-Noreña, L.F.; Montoya, O.D.; Ramos-Paja, C.A. An energy management system for optimal operation of BSS in DC distributed generation environments based on a parallel PSO algorithm. J. Energy Storage 2020, 29, 101488. [Google Scholar] [CrossRef]
- Molina-Martin, F.; Montoya, O.D.; Grisales-Noreña, L.F.; Hernández, J.C.; Ramírez-Vanegas, C.A. Simultaneous Minimization of Energy Losses and Greenhouse Gas Emissions in AC Distribution Networks Using BESS. Electronics 2021, 10, 1002. [Google Scholar] [CrossRef]
Publisher’s Note: MDPI stays neutral with regard to jurisdictional claims in published maps and institutional affiliations. |
© 2021 by the authors. Licensee MDPI, Basel, Switzerland. This article is an open access article distributed under the terms and conditions of the Creative Commons Attribution (CC BY) license (https://creativecommons.org/licenses/by/4.0/).