Article

Comparative Modelling Analysis of Air Pollutants, PM2.5 and Energy Efficiency Using Three Ventilation Strategies in a High-Rise Building: A Case Study in Suzhou, China

1
Department of Architecture, Xi’an Jiaotong—Liverpool University, Suzhou 215123, China
2
School of Architecture, University of Liverpool, Liverpool L69 7ZN, UK
3
Department of Civil Engineering and Energy Technology, Oslo Metropolitan University, 0130 Oslo, Norway
4
Department of Urban Planning and Design, Xi’an Jiaotong—Liverpool University, Suzhou 215123, China
*
Author to whom correspondence should be addressed.
Sustainability 2021, 13(15), 8453; https://doi.org/10.3390/su13158453
Submission received: 7 June 2021 / Revised: 16 July 2021 / Accepted: 19 July 2021 / Published: 28 July 2021

Abstract

:
This study investigated the ventilation efficiency and energy performance of three ventilation strategies—an all-air system (AAS), a radiant panel system with a displacement ventilation system (DPS), and a radiant panel system with a decentralized ventilation system (DVS). The research analyzed the indoor air quality (IAQ) in a high-rise building based on the building’s height, the air handling unit (AHU) location, air infiltration rate, outdoor air pollution rate, seasonal change, and air filter efficiency. The results indicated that the AAS had the best performance in terms of IAQ in the high-rise building in winter; however, the AAS also had the highest annual energy demand. For the same conditions, the DVS consumed less energy but had the worst performance in maintaining a satisfactory IAQ. Considering energy consumption, it is worth developing the DVS further to improve ventilation performance. By applying a double-filter system on the lower floors in a high-rise building, the DVS’s ventilation performance was dramatically improved while at the same time consuming less energy than the original DPS and AAS. The application of DVS can also minimize the negative effect of the infiltration rate on indoor air quality (IAQ) in a building, which means that the DVS can better maintain IAQ within a healthy range for a more extended period. Moreover, it was found that the DVS still had a substantial potential for saving energy during the season when the outdoor air was relatively clean. Hence, it is highly recommended that the DVS is used in high-rise buildings.

1. Introduction

Particulate matter (PM) is the term used to describe the mixture of solid particles and liquid droplets found in the air. In the last decade, the PM issue has been highlighted as a top priority in China due to its extreme harm to the health of human beings. Many investigations of elevated outdoor concentrations of PM have found positive correlations with a range of adverse health effects—from increased respiratory and cardiovascular morbidity to mortality [1,2,3,4,5,6,7]. As introduced by the World Health Organization (WHO), a decrease of 2.5 µg/m3 in the annual average level of PM2.5 would cause a 3.5% reduction in all-cause mortality [2]. People currently spend most of their time indoors, yet the outdoor particles can easily infiltrate into buildings through ventilation systems or leakage areas in the building’s envelope. Fine and ultra-fine PM particles are the most hazardous to human health [7], and they also have the highest chance of entering the indoor environment through the building envelope via the infiltrating air [8]. As a result, many occupants are still exposed to high levels of particles of outdoor origin, even though they are indoors. Therefore, controlling the ingress of PM particles, whilst providing an excellent indoor air quality environment, is crucial to protecting human health.
In order to achieve certified Indoor Air Quality (IAQ) in buildings, a centralized ventilation system (CVS) is widely used, since it can efficiently reduce the concentration of indoor pollutants. Previous studies indicated that the air pollutant indoor/outdoor ratio would be dramatically reduced in mechanically ventilated buildings [9,10,11,12,13,14,15,16]. However, the indoor pollutant concentration can still go beyond the limits suggested by the WHO standard, China and the USA’s National Ambient Air Quality Standard (NAAQS), especially in urban areas. Two strategies, including increasing the air change rate and installing the high-efficiency air filter, were often used to develop the CVS’s ventilation performance to further improve IAQ in the building [13,17,18,19,20,21,22,23,24]. Although these methods can efficiently improve IAQ in the building, they consume a significant amount of energy annually [25,26,27,28].
In comparison, a decentralized ventilation system could reduce the energy demand since it has a separate air inlet and outlet on each floor in a building, leading to shorter ductwork and smaller pressure drops [25,26,27,28,29,30]. Thus, a decentralized ventilation system would be expected to consume less fan energy than the CVS in a high-rise building, due to the lower pressure drops in the ductwork. However, little information is available for comparing the performance of controlling indoor air quality between these two ventilation strategies. In this study, two widely used CVS were chosen to compare with the DVS, including the all-air system (AAS) and radiant panel system with a displacement ventilation system (DPS). Moreover, the decentralized ventilation system is usually connected with a radiant panel system to reduce ventilation energy consumption [26,31]. Hence, a radiant panel system with a decentralized ventilation system was selected for the comparison study in this research. Furthermore, the air handling unit (AHU) is commonly located in the basement in some centralized ventilated buildings, while others are located on the top floor. Thus, these two AHU locations were also considered in this study since different air inlet locations could impact the IAQ in the building. The detailed schematic of the three selected ventilation systems with different AHU locations is presented in Figure 1.
This study focuses on investigating the energy efficiency of different ventilation system strategies to maintain IAQ in a high-rise building in China. The number of high-rise buildings in China has dramatically increased in recent decades, with around 86% of Chinese office buildings being over 100m high [32]. This contributes to a desire for a better understanding of how outdoor air pollutants impact the IAQ in tall buildings. Previous studies reported that the outdoor pollutants’ concentration significantly varied depending on the building height [33,34,35,36,37,38,39,40,41]. Accordingly, the IAQ on each floor of a high-rise building can be expected to be different due to the varying outdoor air quality. However, little research has been conducted to explore the interaction between ventilation efficiency and the energy performance of ventilation systems in high-rise buildings.
Suzhou is a major city located in the southeast of Jiangsu Province, China, and it is typical of the industrialized cities developed over recent decades. With this development, the number of high-rise buildings in the city has rapidly increased since the beginning of the 21st century [32]. At the same time, the quality of the outdoor air in Suzhou has deteriorated [42]. According to statistics issued by the Meteorological Bureau of China, the hourly average concentration of outdoor particles could reach around 290 µg/m3 [39]. Consequently, buildings in Suzhou face a big challenge in achieving good IAQ. Hence, Suzhou was selected as the target city in this study.
This study aims to investigate the ventilation efficiency and energy performance of three ventilation strategies in controlling IAQ, considering factors related to seasonal climatic changes, the height of the building, AHU location, outdoor air quality, air filter efficiency, and air infiltration rate. To this end, two research questions have been defined:
(1)
Which system has the better performance in controlling IAQ in a high-rise building?
(2)
Which system is more efficient in terms of improving IAQ in a high-rise building while also saving energy?

2. Methodology

The following sections specify the methods used to compare the indoor PM removal efficiency between the AAS, DPS, and DVS. The analyzing process was divided into four steps: (1) Size the cross-sectional duct area and determine the pressure drops in the ductworks, based on the European standard EN 13779; (2) Calculate the energy demand of the three selected ventilation systems, based on the designed air supply ductworks; (3) Estimate the indoor particles levels, based on online collected data and numerical simulation results; (4) Compare the ventilation efficiency and energy performance of the three ventilation systems.

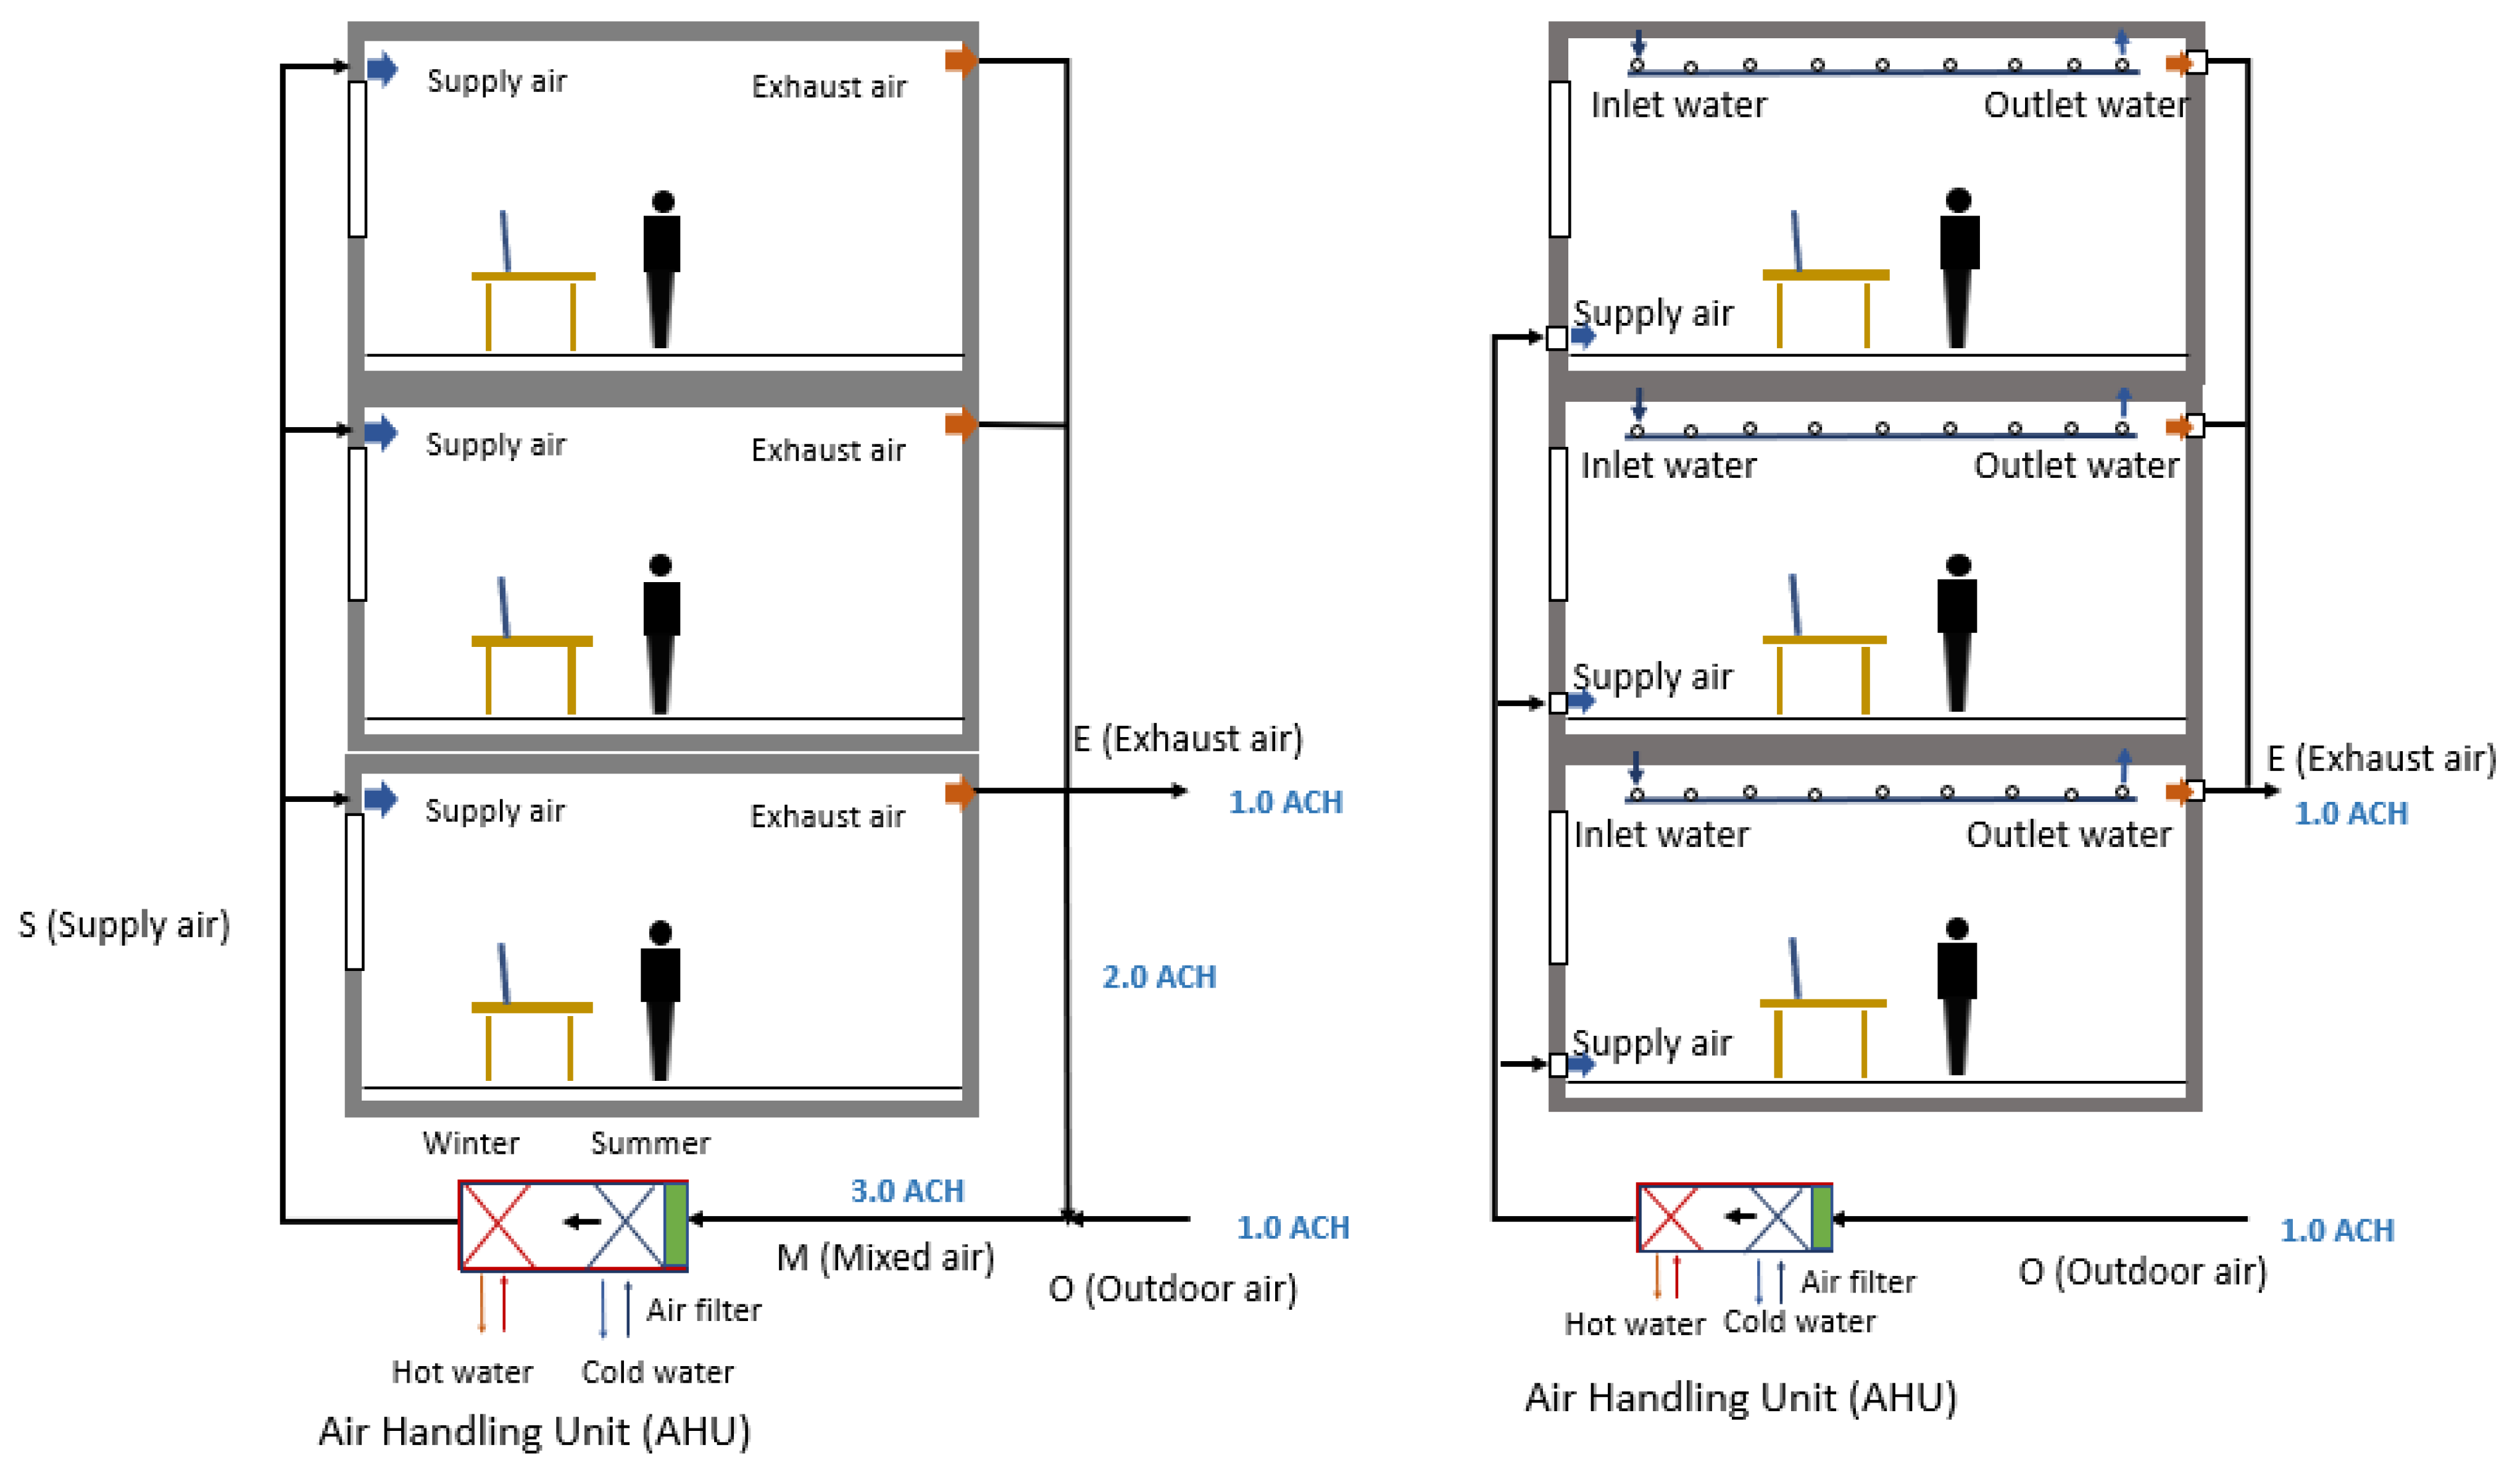
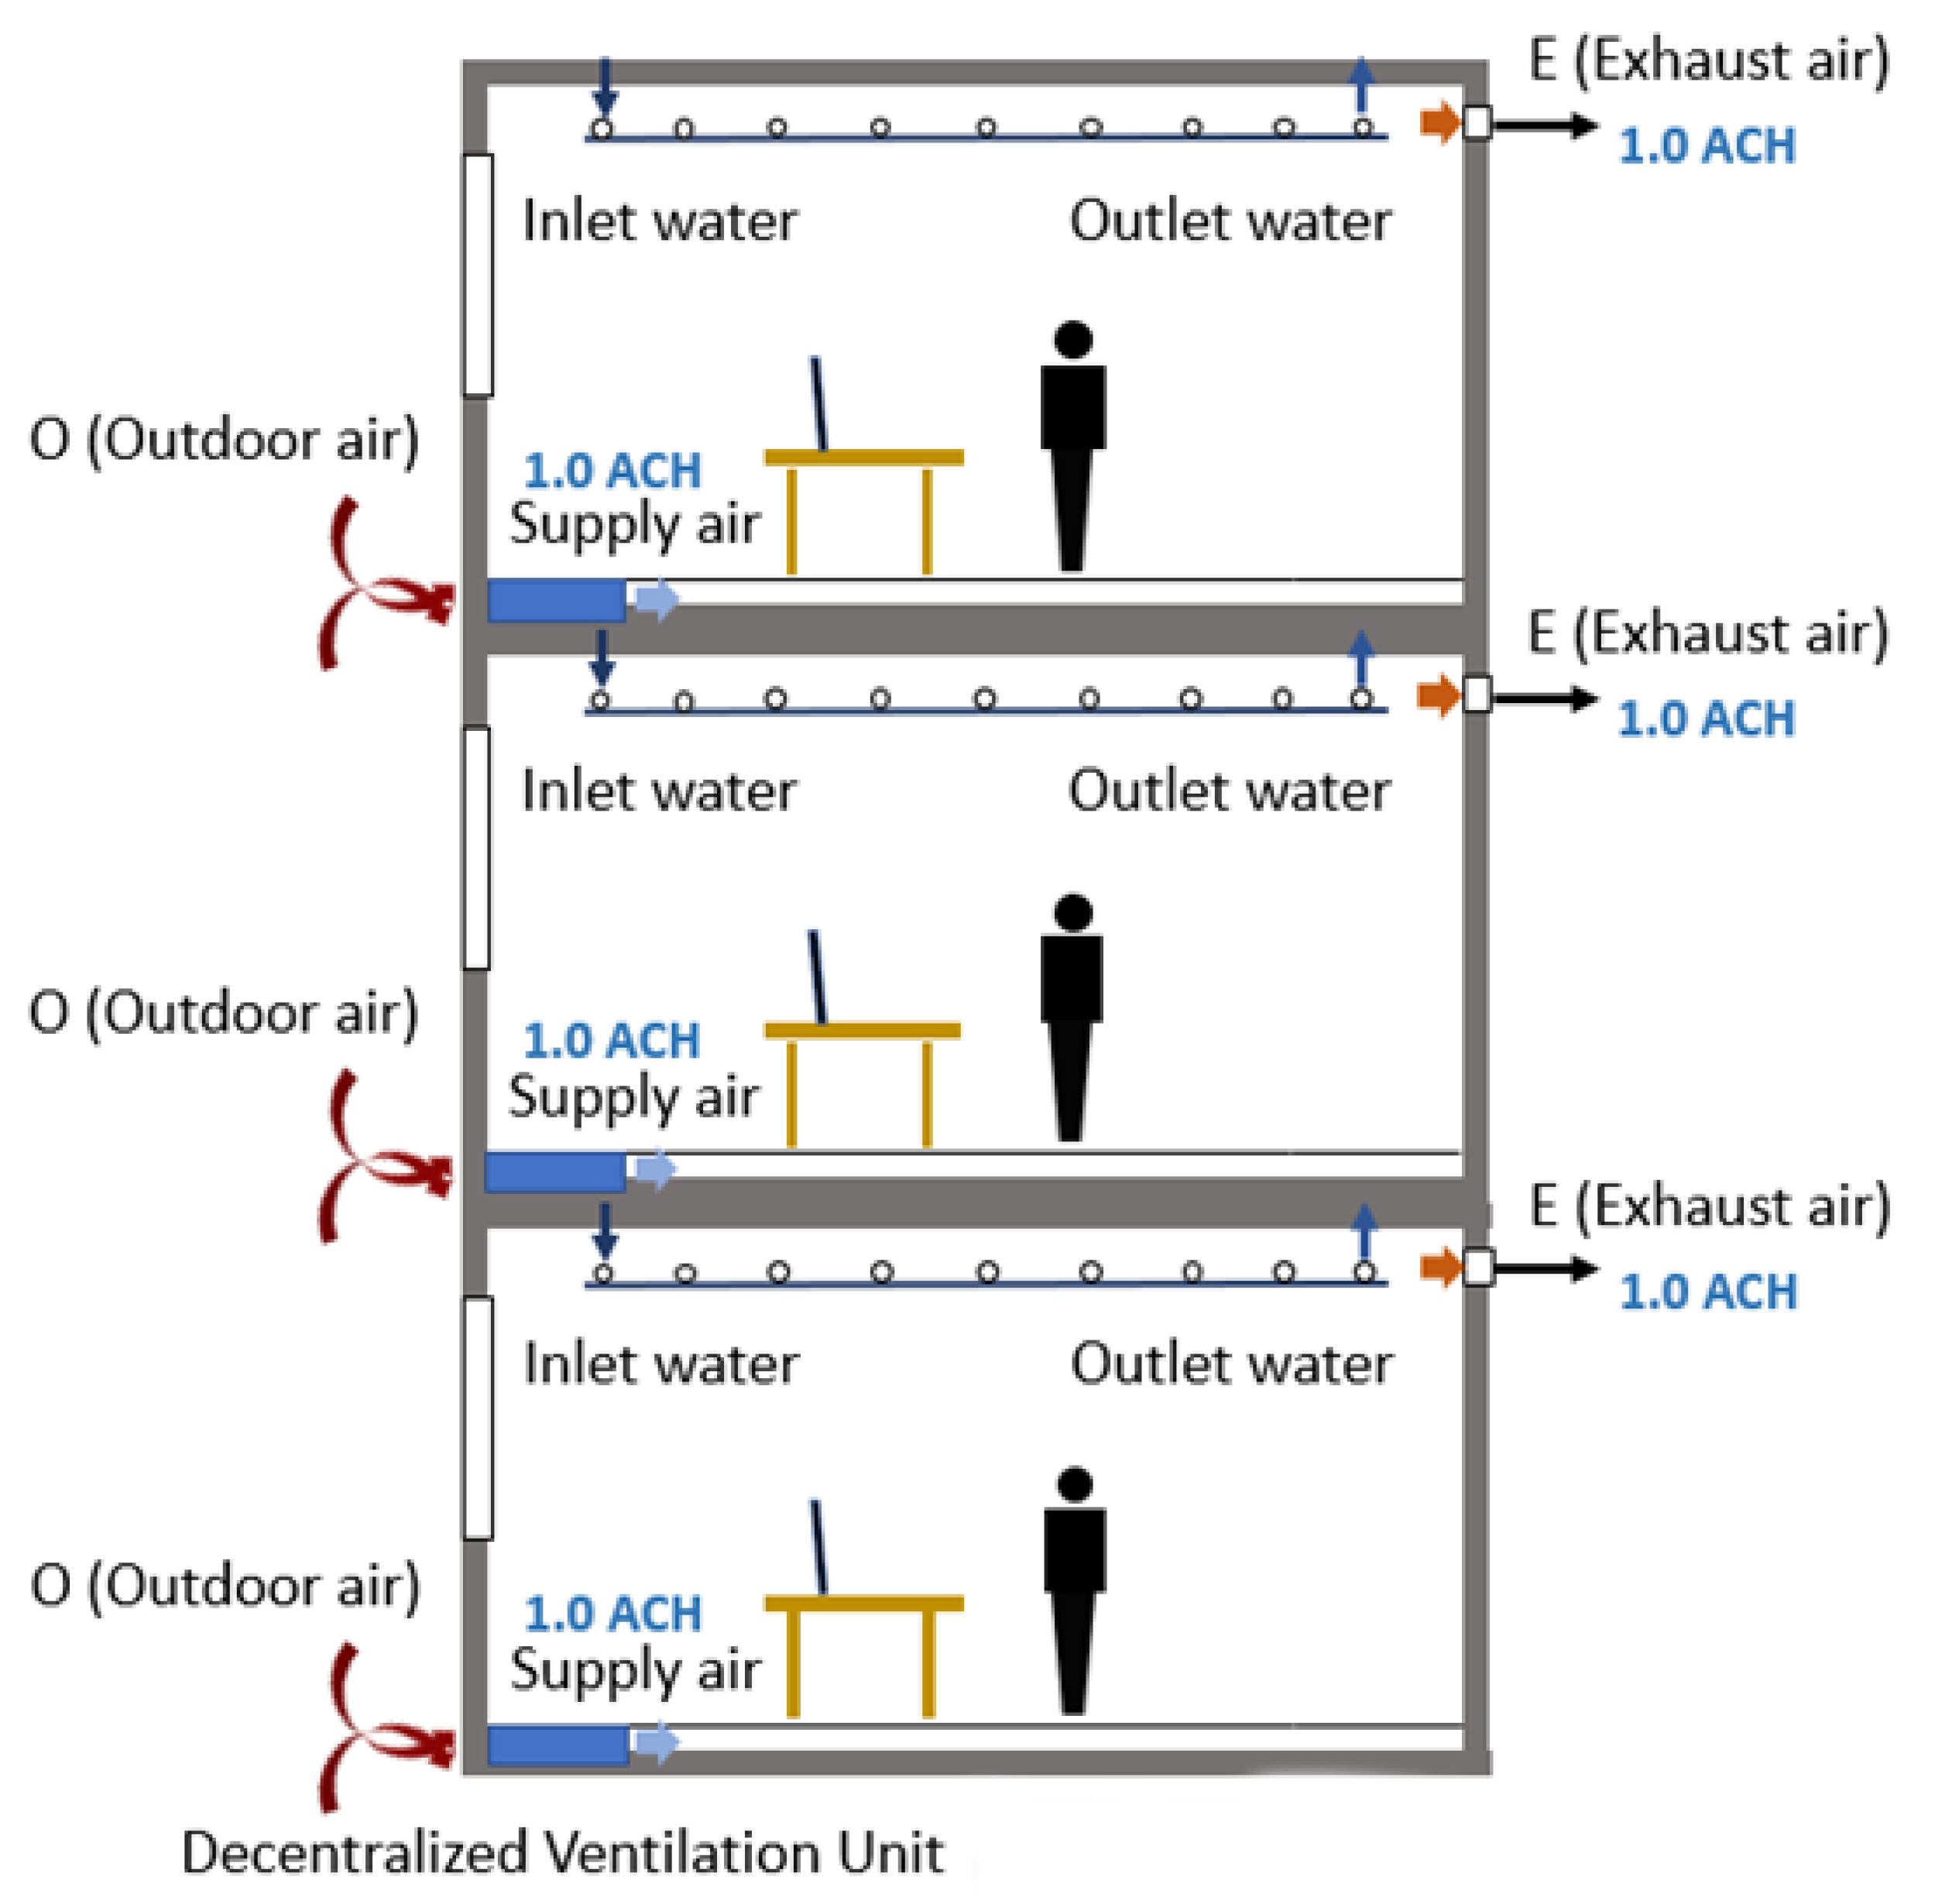
2.1. The Modelled Office Building

A case study of single-breathing zone model, in a modelled office building, was developed. In this study, each breathing zone’s footprint plan area was 275.56 m2, and for a typical floor height of 3.3 m, the volume of each breathing zone was 918 m3. The building was 30 floors high (about 100m in total). Moreover, the maximum number of occupants in each breathing zone was 30. This study assumed that the ventilation rate’s default value was 8.5 liter/second/person [43], which was equal to 1.0 air change per hour (ACH) in each breathing zone. Furthermore, a 3.0 ACH ventilation rate was set for the AAS in winter and summer to provide enough heating and cooling load.

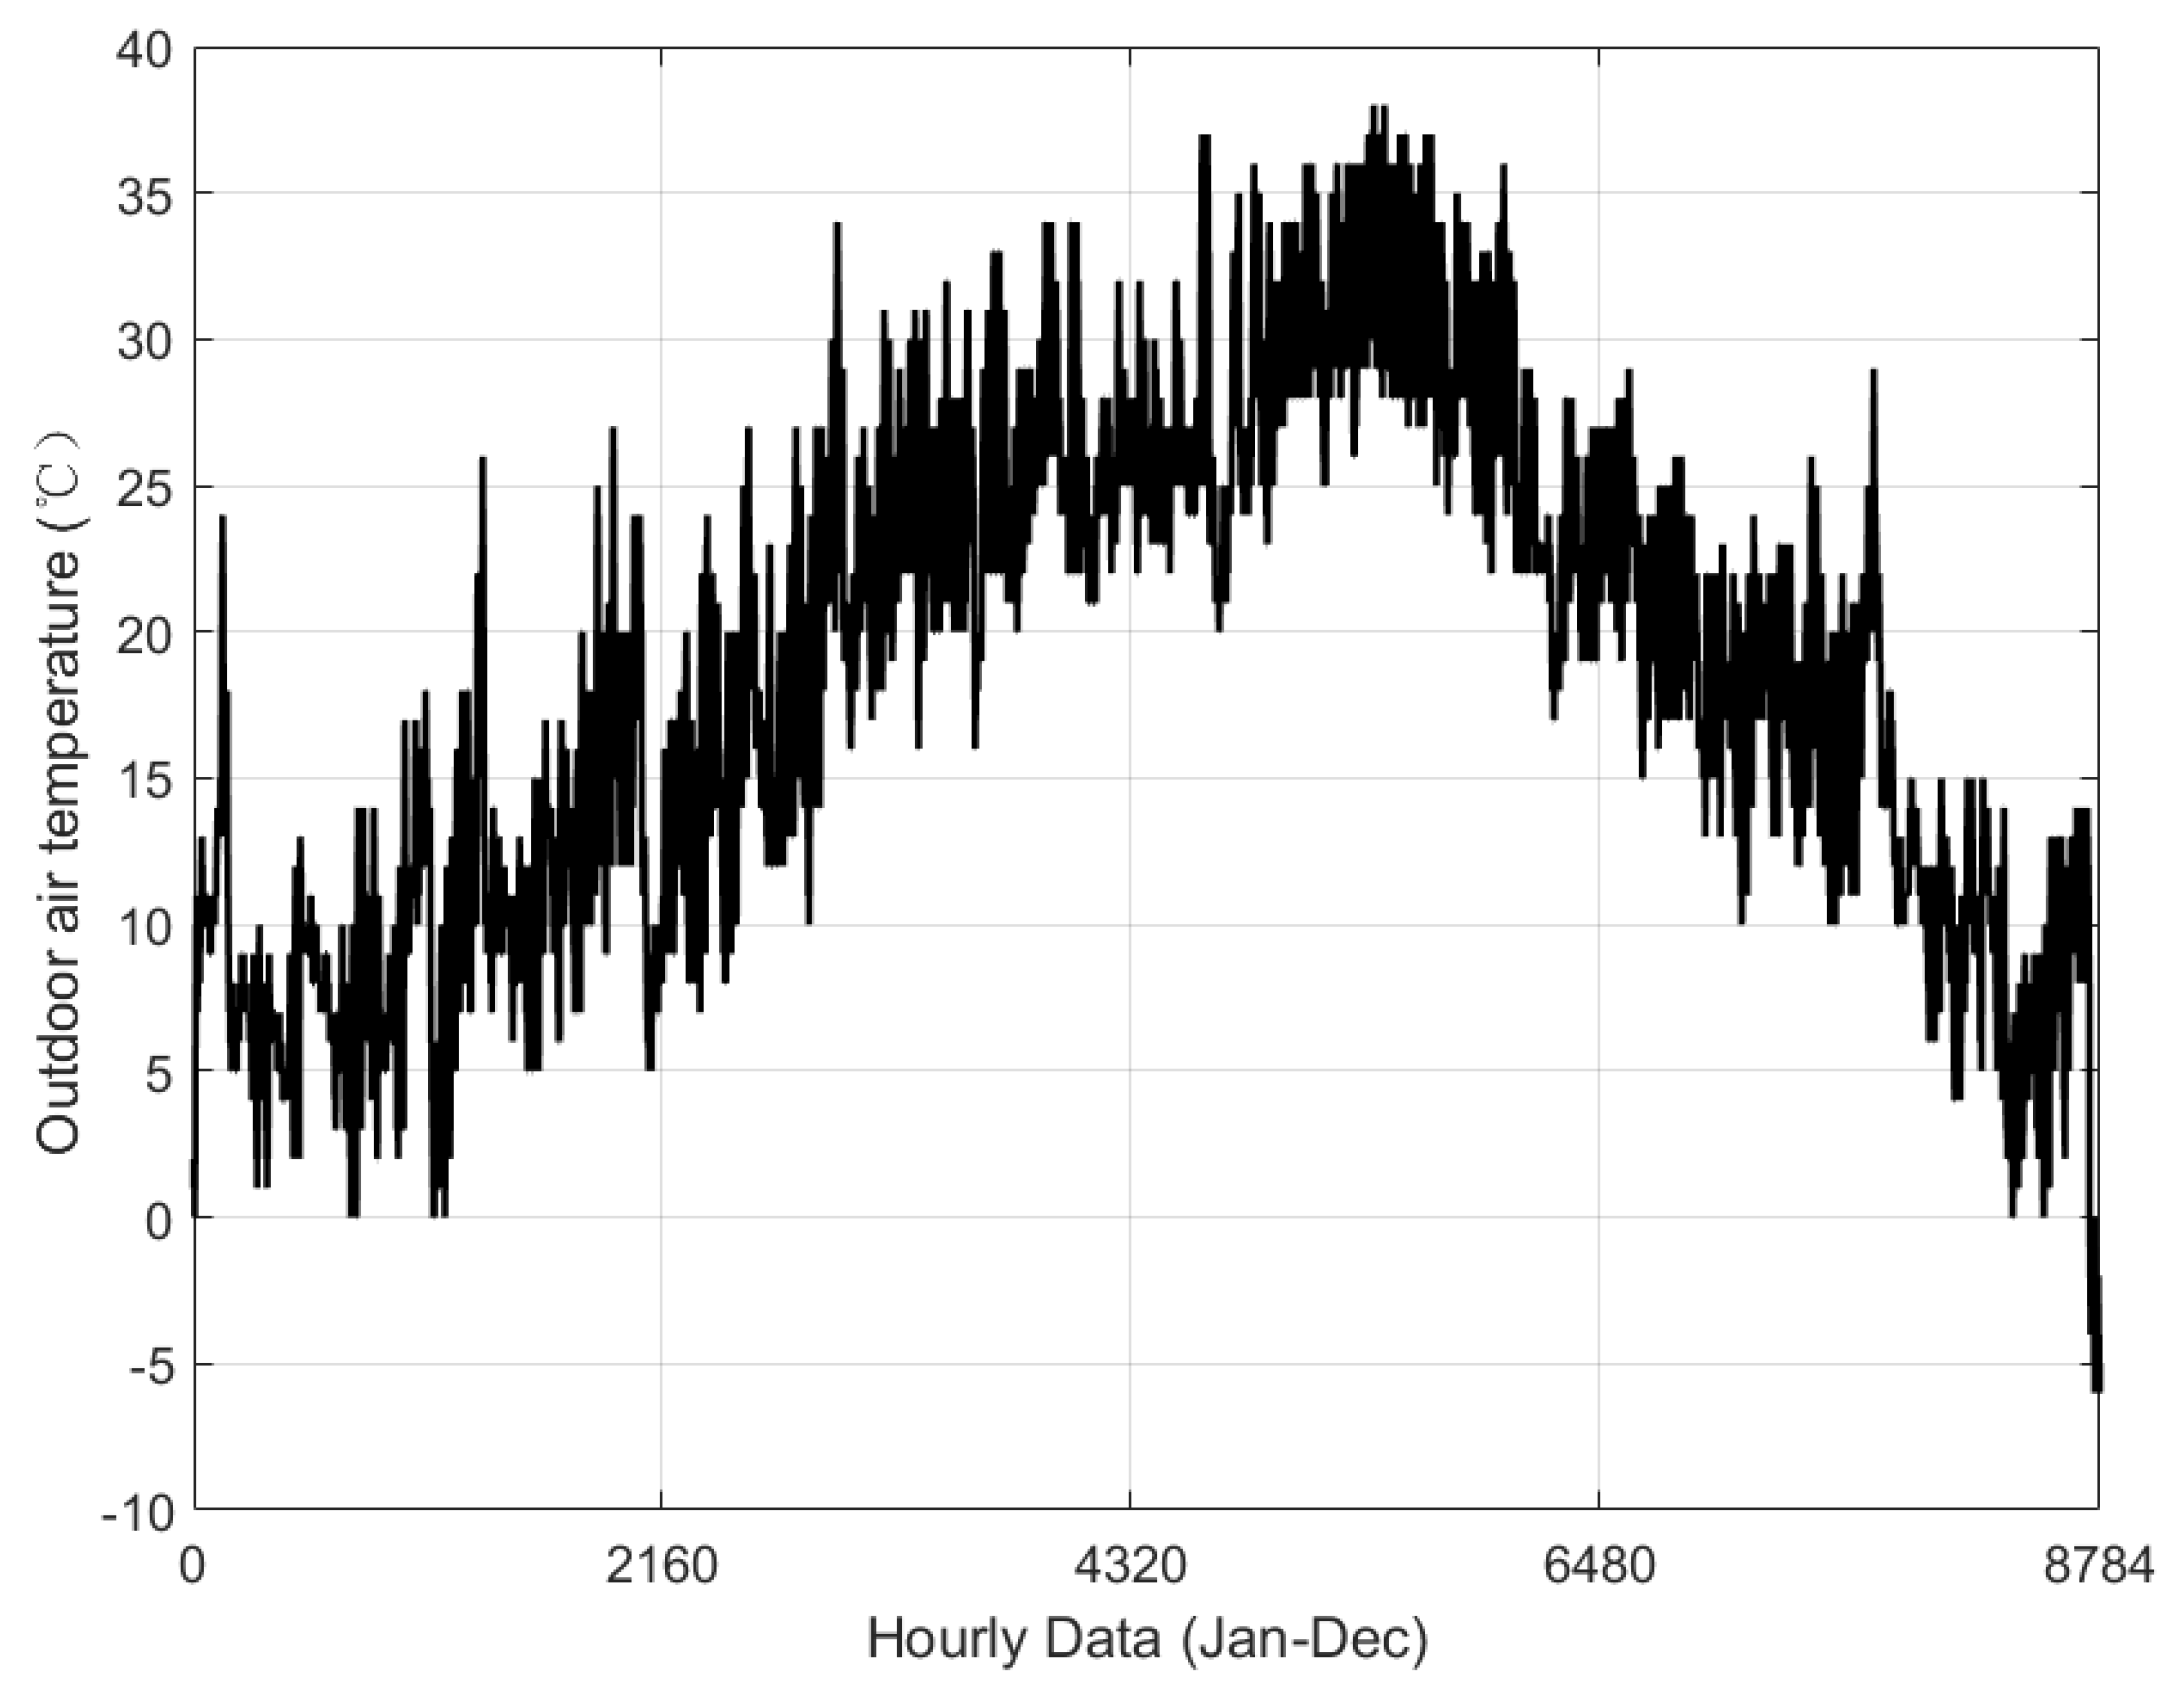
2.2. Weather Characteristics of Suzhou

Suzhou’s hourly average outdoor air dry-bulb temperatures in 2019 are presented in Figure 2 [44]. It can be seen that the outdoor air temperature varied from −10 °C to 40 °C. Further, the outdoor average dry-bulb temperature was 14 °C, 30 °C, 17 °C and 4 °C in spring, summer, autumn, and winter, respectively. Based on the ASHRAE Standard 55 [45], the indoor air temperature was set at 24 °C, 23 °C, 24 °C and 25 °C over the four seasons to achieve the indoor thermal comfort. Then, it was assumed that the return air temperature was 2 °C higher than the indoor air temperature. Accordingly, the heat recovery unit (HRU) could be used in winter in the AAS, considering the significant difference between the exhaust air temperature and outdoor air temperature. Moreover, since the outdoor temperature decreases by around 0.6 °C for each 100 m increase in height, it was assumed that the outdoor temperature did not change with the building height [46].

2.3. Indoor Thermal Comfort and Thermal Ventilation Energy

To achieve indoor thermal comfort, the target supply air temperature and the maximum humidity ratio were 15 °C and 8 g/kg [45]. However, the outdoor air should be chilled to 12 °C and 8 g/kg, at first, for the hot and humid season, and then reheated to 15 °C and 8 g/kg to prevent the draughts [45]. For the swing season, the target air temperature was set at 15 °C. Further, the thermal ventilation load can be calculated based on the difference between the target air temperature and ambient weather. For ventilation heating capacity, Qh is:
Q h = m a × C p a × ( T s a T o a )
where Qh is the air capacity in kJ/h, ma is the mass flow rate of the air in kg/h, Cpa is the specific heat of the air in kJ/kg°C, Tsa and Toa are the supply and outdoor air temperature in °C. In winter, Tsa should be replaced by the mixed air temperature, T, for the AAS since 70% of the exhaust air will be reused to save energy. T can be determined as:
m a × T = m o × T o + m r × T r
where mo and mr are the mass flow rates of outdoor air and return air in kg/h, and To and Tr are the outdoor air temperature and return air in °C. Moreover, the ventilation cooling load, Qc, (capacity and latent), can be determined by calculating the enthalpy difference between the ambient air and supply air condition, presented as:
Q c = m a × ( h a a h s a )
where Qc is the cooling capacity in kJ/h, and haa and hsa are the enthalpy values of the outdoor air and supply air in kJ/kg. Furthermore, the total ventilation cooling load, which also includes a reheating load as mentioned above, can be determined as:
Q r h = m a × C p a × ( T s a T c a )
where Qrh is the reheating load in kJ/h, Tsa and Tca are chilled and dehumidified air temperature in °C. Additionally, the ventilation load also includes fan and pump energy. The equation can be determined as [26,47,48]:
F a n ( P u m p )   p o w e r   ( W ) = ( V × Δ P ) / ( 3600 × η )
where V is the volume flow rate of air/ water in m3/h, Δ P is the total pressure rise in Pa, η is the efficiency of the fan and pump.

2.4. Estimating the Pressure Drop in the Ventilation System

This study assumed that all three ventilation systems were low-pressure systems [49]. Outdoor air would account for 100% of the total supplied air treated in the AHU in all three systems in spring, summer and autumn. Only 30% of the total supplied air will be treated in the AHU in the AAS in winter. Accordingly, as an AHU model box, the face velocity was assumed to be equal to 2.5 m/s consistently [50]. Moreover, for general offices, the maximum air velocity in the main ducts, branch, and run-outs is 7.5, 6.0, and 3.5 m/s, respectively [46]. Hence, the required size of the duct cross-sectional area in the different parts of ductwork can be determined as [50]:
A c r o s s = q v , r e q v
where A c r o s s is the cross-sectional area of the duct in m2, q v , r e q is the total required supply airflow rate in m3/s, and v is the air velocity in m/s. This study assumed that rectangular ducts were used in the main ducts, and circular ducts were used in the final branches [46]. Figure 3 and Figure 4 display the ductwork installation in the building applied with the CVS and DVS. Further, the total pressure rise by the fan can be calculated based on the determined size of the ducts and fittings, and the equation is given by [50]:
Δ P = 0.5 × ξ × ρ × v 2
where ξ is the pressure loss factor, and ρ is the density of the air in kg/m3.
Moreover, the water system will deliver the energy to cover the heating and cooling load in all three systems, thus the pump system is required to balance the water pressure loss in ductworks. It was assumed that the water volume flow rate was constantly 2.5 L/min in all three systems, and the pressure drop in each radiant panel was 370.5 KPa [51]. The pressure drop caused by components in the AHU is an essential part of the fan energy. The AHU contains a heating coil, cooling coil, humidifier, air filter, and silencer [49]. Further, a class H2 HRU was used in the AAS in winter to save energy [52].
The WHO [1] has reported that for every 10 μg/m3 decrease in the concentration of PM2.5, there would be a 6% decrease in mortality risk. Other studies have also indicated that reducing the PM2.5 concentration by 10 μg/m3 would significantly reduce the risks of human health [53,54]. There is no evidence of a safe level of exposure or a threshold below which no adverse health effects occur [2], which means that indoor PM2.5 level should be kept as low as possible. To this end, four different air filters were considered in this study: Minimum Efficiency Reporting Value rank 8 (MERV 8), MERV 10, MERV 14, and MERV 16. Furthermore, this study assumed that the MERV 8 air filter was used as the default filter [43]. Based on the European standard EN13779 [52], the input data for each specific component in AHU are listed in Table 1.

2.5. Estimate Indoor Particle Concentration

Many studies have shown that fine and ultra-fine particles have a higher possibility of entering the indoor environment through ventilation systems than coarse particles, due to their smaller size; thus, it is harder to capture them by a conventional air filter [55,56]. It is also easier for small particles to infiltrate and penetrate buildings than it is for coarse particles [8]. Hence, the particle that is 2.5 microns or less in diameter, PM2.5, was considered in this research. Moreover, it was assumed that there were no particle emission sources in the indoor environment in office buildings, and the indoor particles were uniformly distributed in the room [57]. In addition, it was assumed that the air filter was located in the supply airstream. Hence, based on the mass balance equation, the indoor PM2.5 concentration can be described as:
P M i , t k = P M i , t k 1 × e L ( t k t k 1 ) + (   S L S L × e L ( t k t k 1 ) )
Here, P M i n , t k is the concentration of the indoor PM concentration at time k in µg/m3, S is the source term, L is the loss term, and tk is the ventilation system’s operation time. Since it was assumed that there were no indoor particle emission sources in this study, the indoor PM level was steady, equaling the ambient outdoor particle concentration [58]. Then, the source term can be expressed as:
S = P M o u t × q v × ( 1 E f ) + P M o u t × p × q i
Here, P M o u t is the outdoor particle concentration in µg/m3, E f is the filter efficiency, q v is the ventilation rate in h−1, p is the penetration rate of particles, whose value was consistently set to 0.95 for PM2.5 [24], and q i is the air infiltration rate in h−1. The efficiency of the involved four filters for PM2.5 in order is 0.323 (MERV 8), 0.354 (MERV 10), 0.78 (MERV 14), 0.95 (MERV 16). The default infiltration rate was set at 0.1 ACH. Furthermore, it was assumed, for simplicity, that the filter efficiency of the recirculation air was the same as that of outdoor air. Thus, the loss term can be presented as:
L = q r × E f + q v + q i + β
where q r is the recirculation rate in h−1, β is the deposition rate of the particle, whose value is consistently 0.5 h−1 for PM2.5 [24,59].

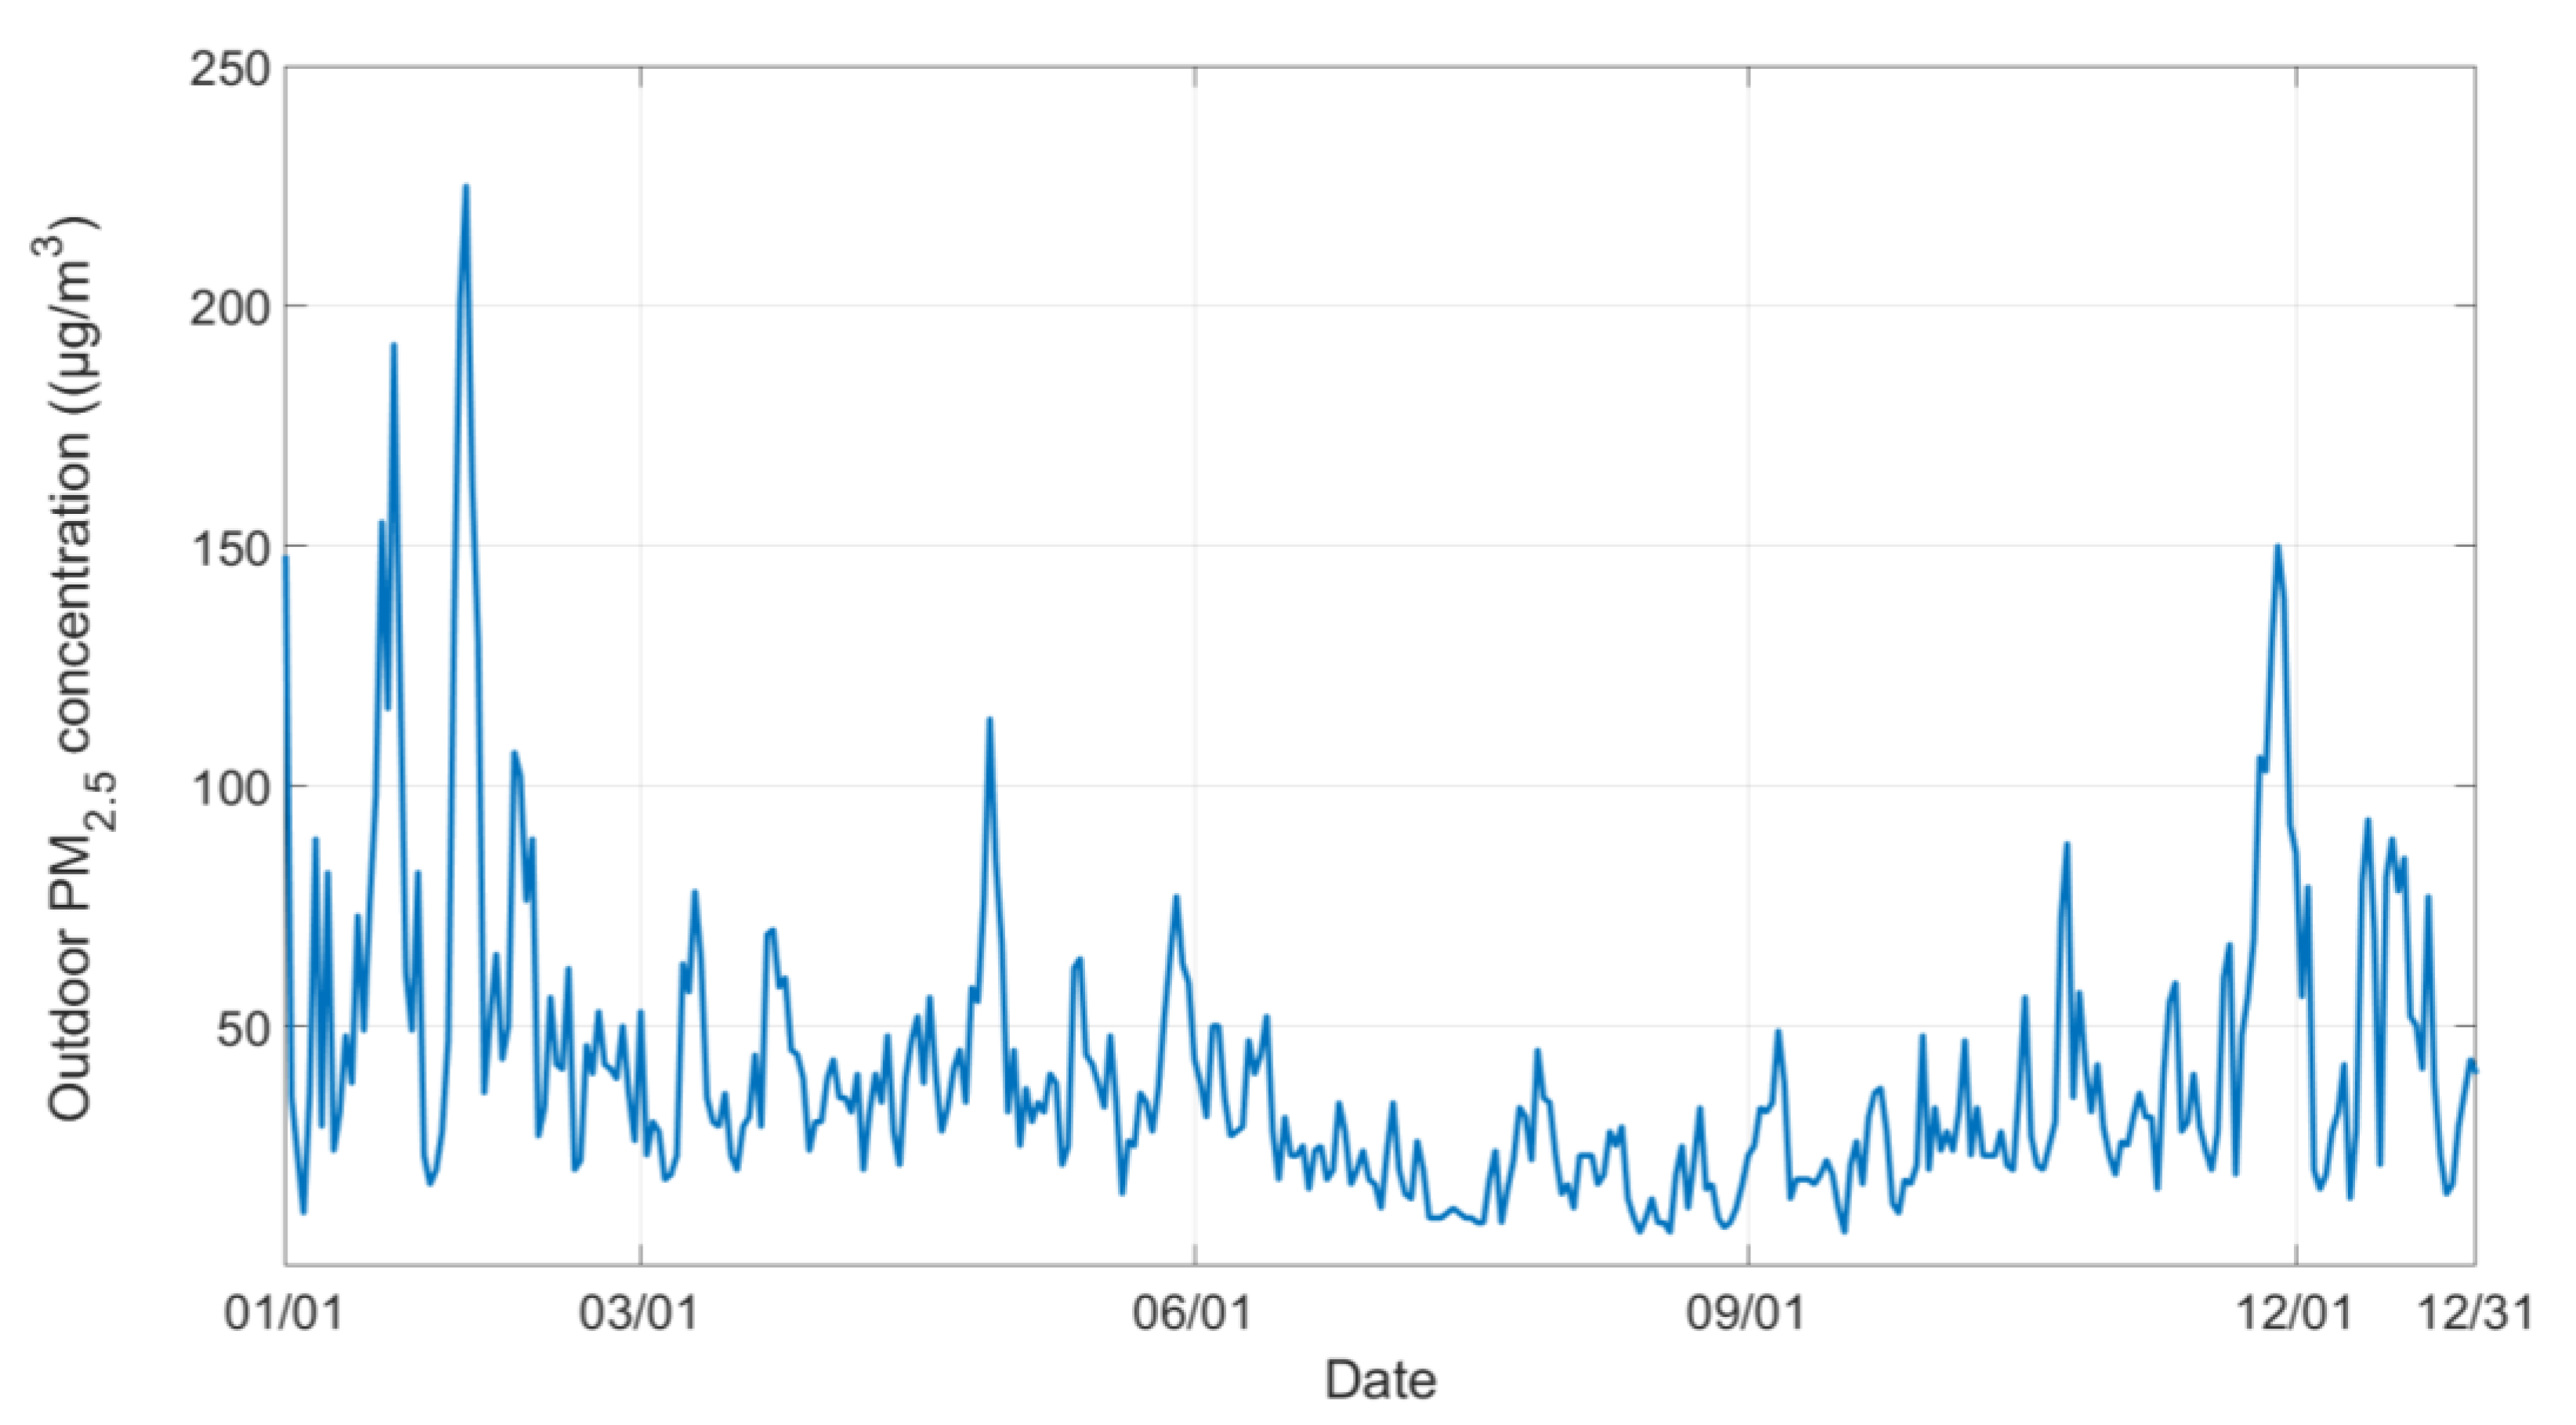
2.6. The Daily Average Outdoor PM2.5 Level in Suzhou

Figure 5 presents the measured daily average outdoor PM2.5 concentrations in Suzhou in 2018. From the graph, the daily average outdoor PM2.5 level can be found as 15–114 µg/m3, 7–52 µg/m3, 7–150 µg/m3, 11–225 µg/m3 from spring to winter, respectively. In terms of statistics, the 50th percentile of the daily mean outdoor PM2.5 level is 57, 20, 38, and 94 µg/m3 in spring, summer, autumn, and winter. Based on the analysis, the outdoor PM2.5 level is highest in winter and lowest in summer, and thus it is especially necessary to maintain the IAQ within a healthy range in winter. In this study, outdoor PM2.5 levels of 60, 20, 40, and 100 μg/m3 in spring, summer, autumn, and winter were used to investigate the seasonal changes in the ventilation system’s performance.

2.7. Particle Concentration Vertical Profiles

Recently, the vertical particle profiles on the façades of high-rise office buildings have been researched [33,34,36,37,38,39,60]. In general, the outdoor airborne particle concentration decreases with height. Further, several studies indicate that the outdoor particle concentration shows a stronger apparent decreasing trend with height in open areas than it does in urban areas [33,36]. Furthermore, the outdoor particle level’s vertical pattern is influenced by factors such as atmospheric stability, ambient meteorological conditions, and the surrounding environment [35,37,38,39,60,61].
Considering both the characteristics of decentralized ventilation systems and outdoor particles’ vertical profiles, the IAQ on each floor in a high-rise building should be different since the outdoor particle concentration in each floor’s air inlet position varies. Thus, it is necessary to determine the outdoor particle’s level vertical distribution profile. Liu et al. [39] investigated the outdoor PM2.5 and PM10 vertical pattern around a 100 m height office building in Nanjing’s urban area over four seasons. Their study reported that, at 100 m, the averaged PM2.5 concentration decayed by 7%, 12.9%, 18.1%, and 19.7% on the urban area over four seasons [39]. Through a literature review, their results showed a good correlation with other research. Further, Nanjing is very close to Suzhou, and thus to apply the results reported by Liu et al. [39] into this study for investigating the IAQ on each floor in a high-rise building is a reasonable decision.

3. Results

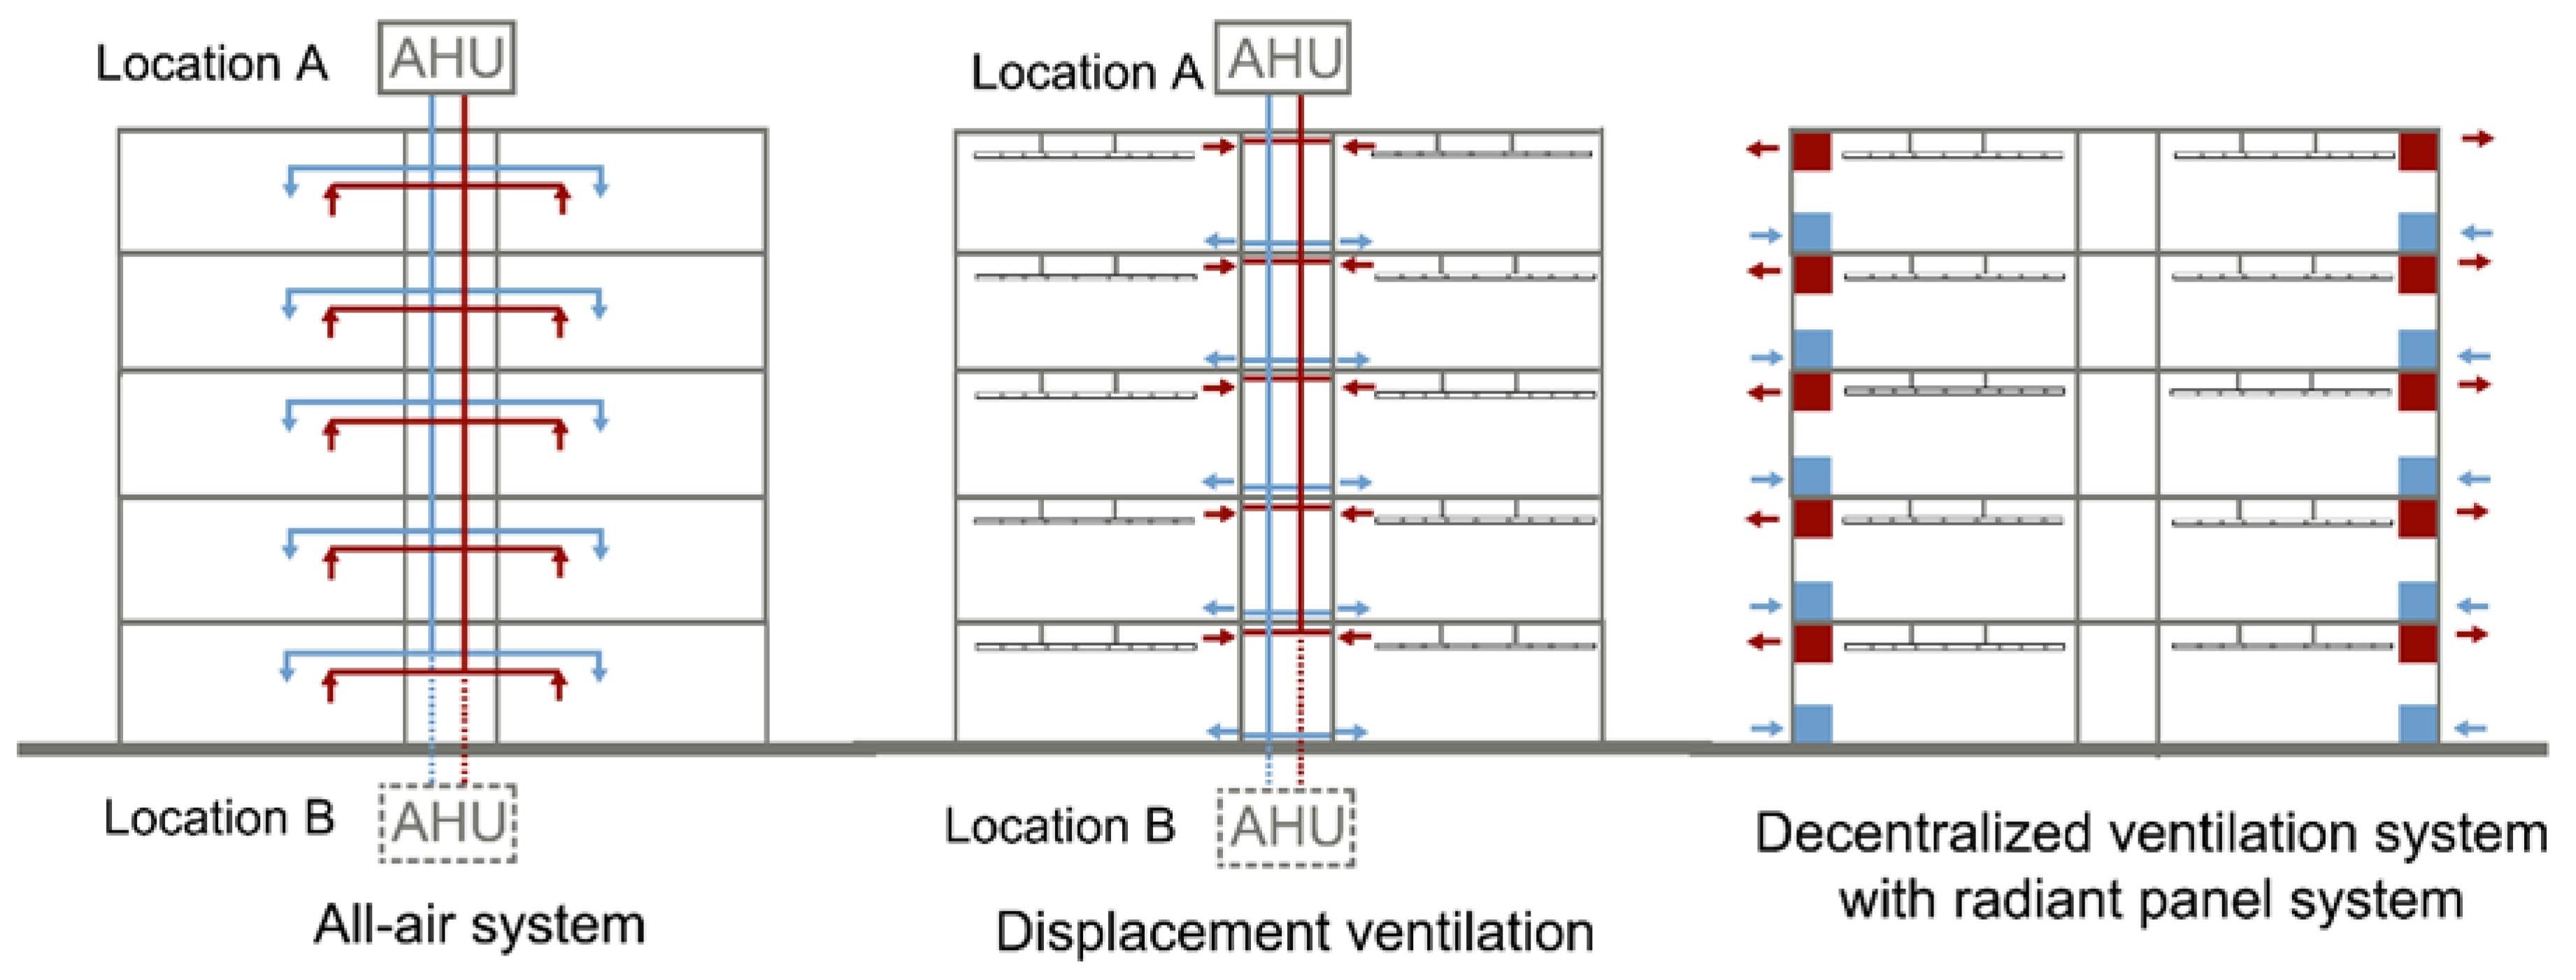
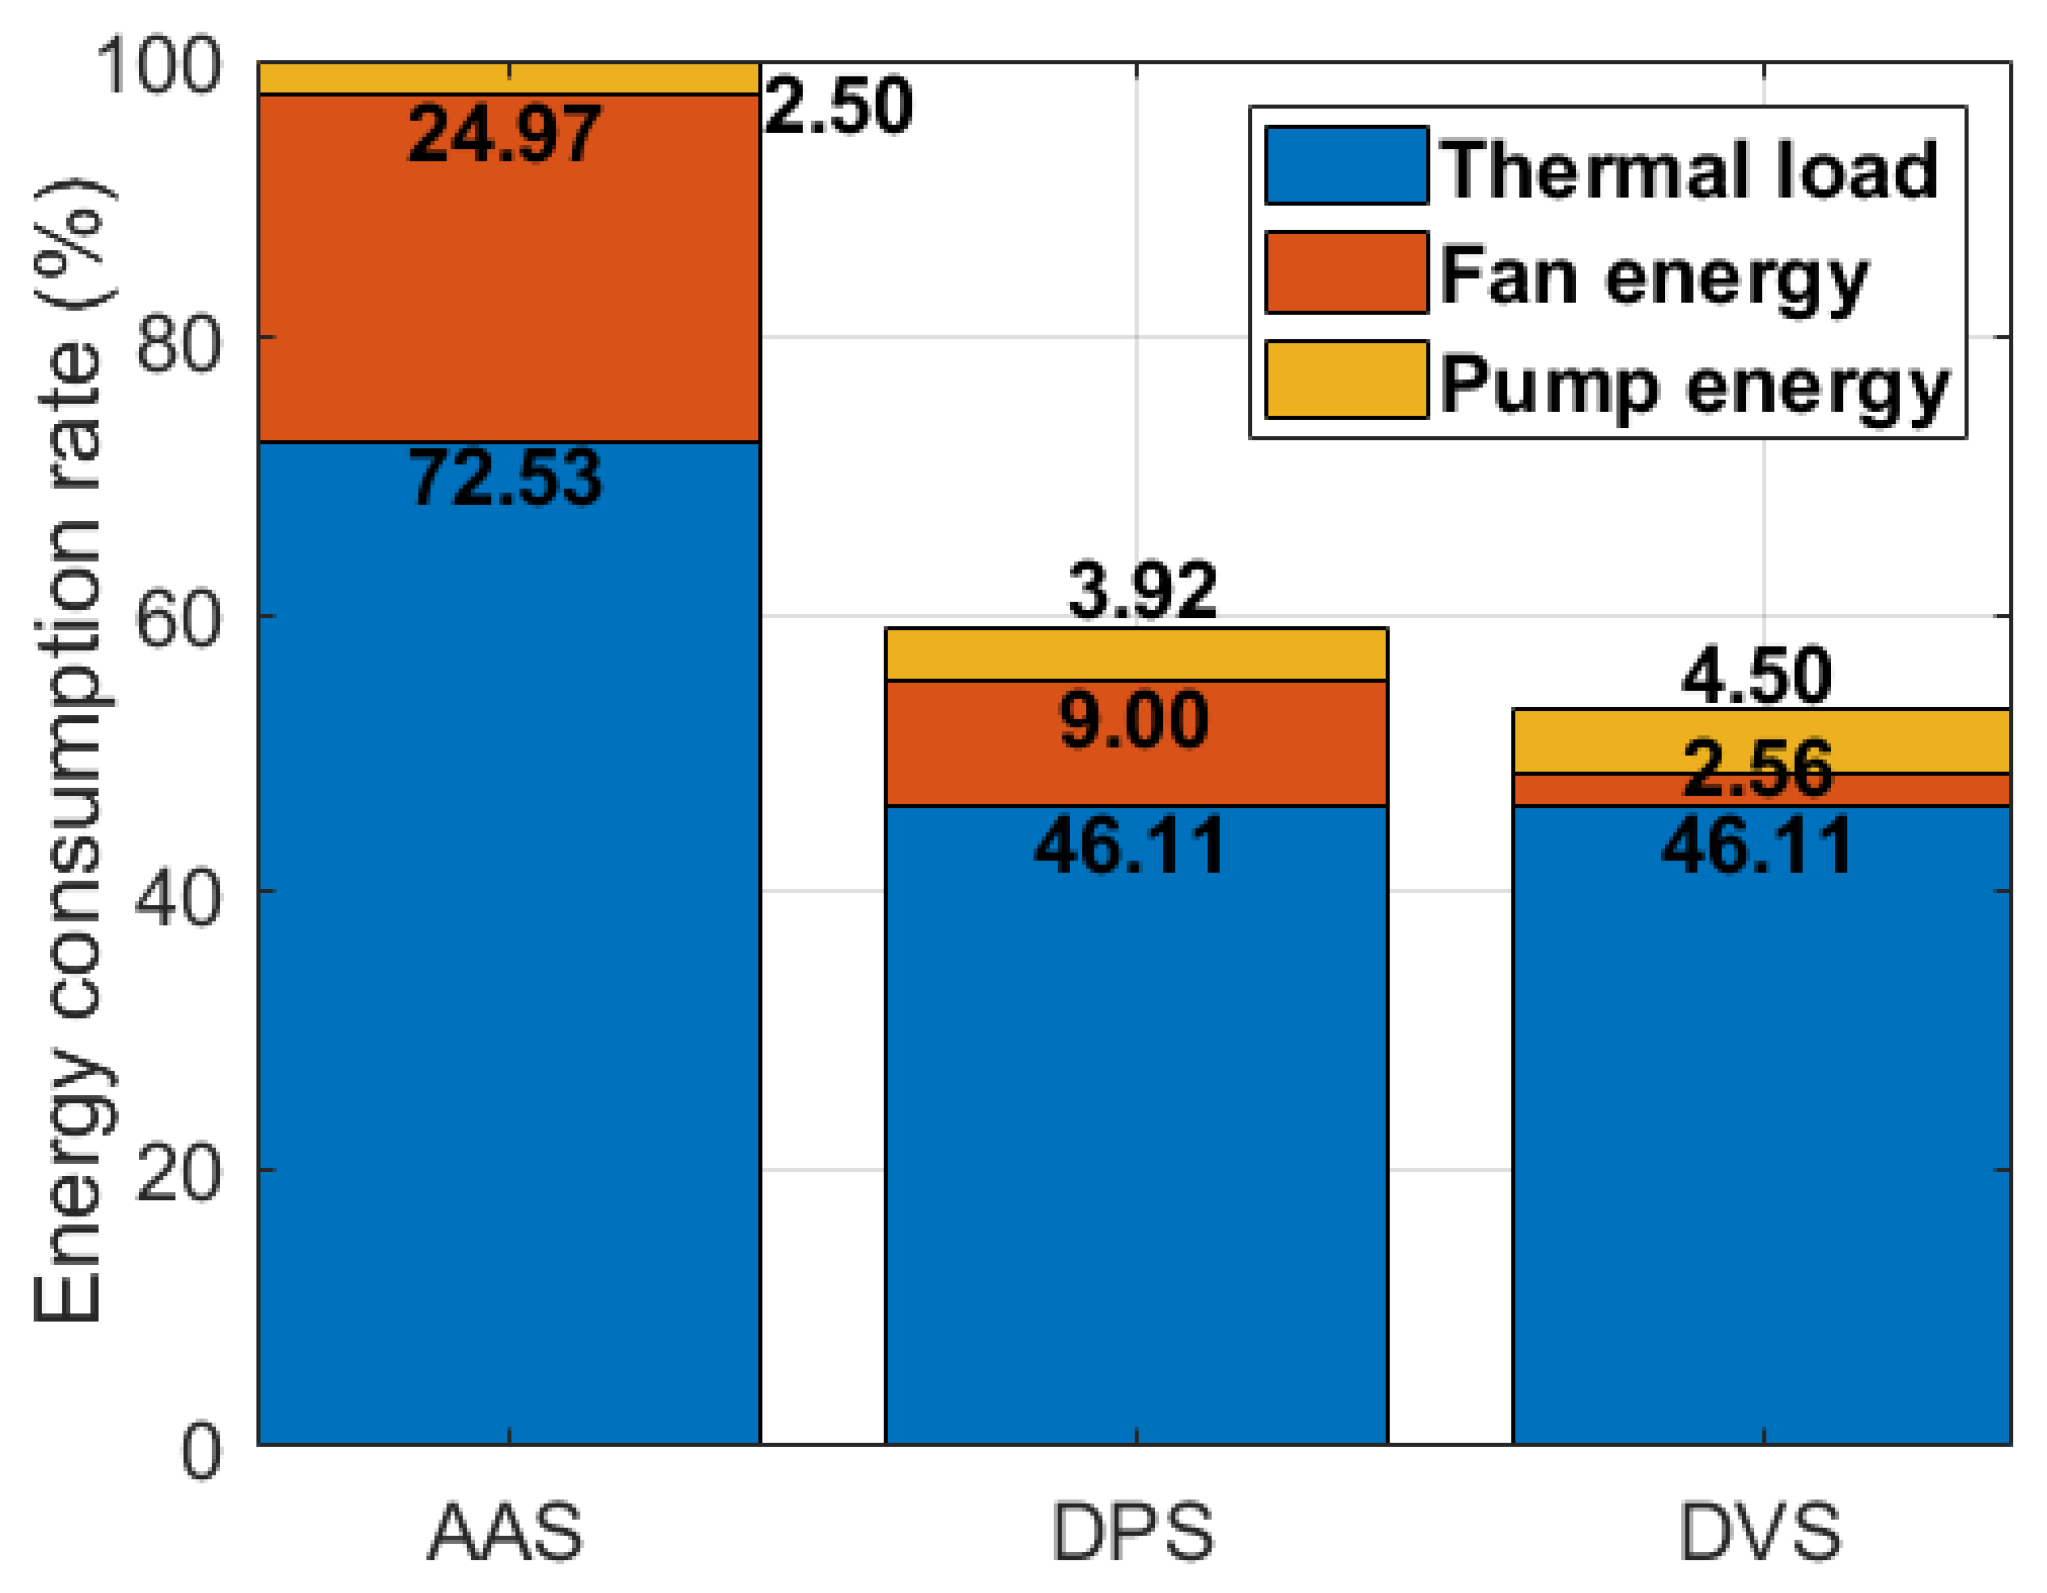
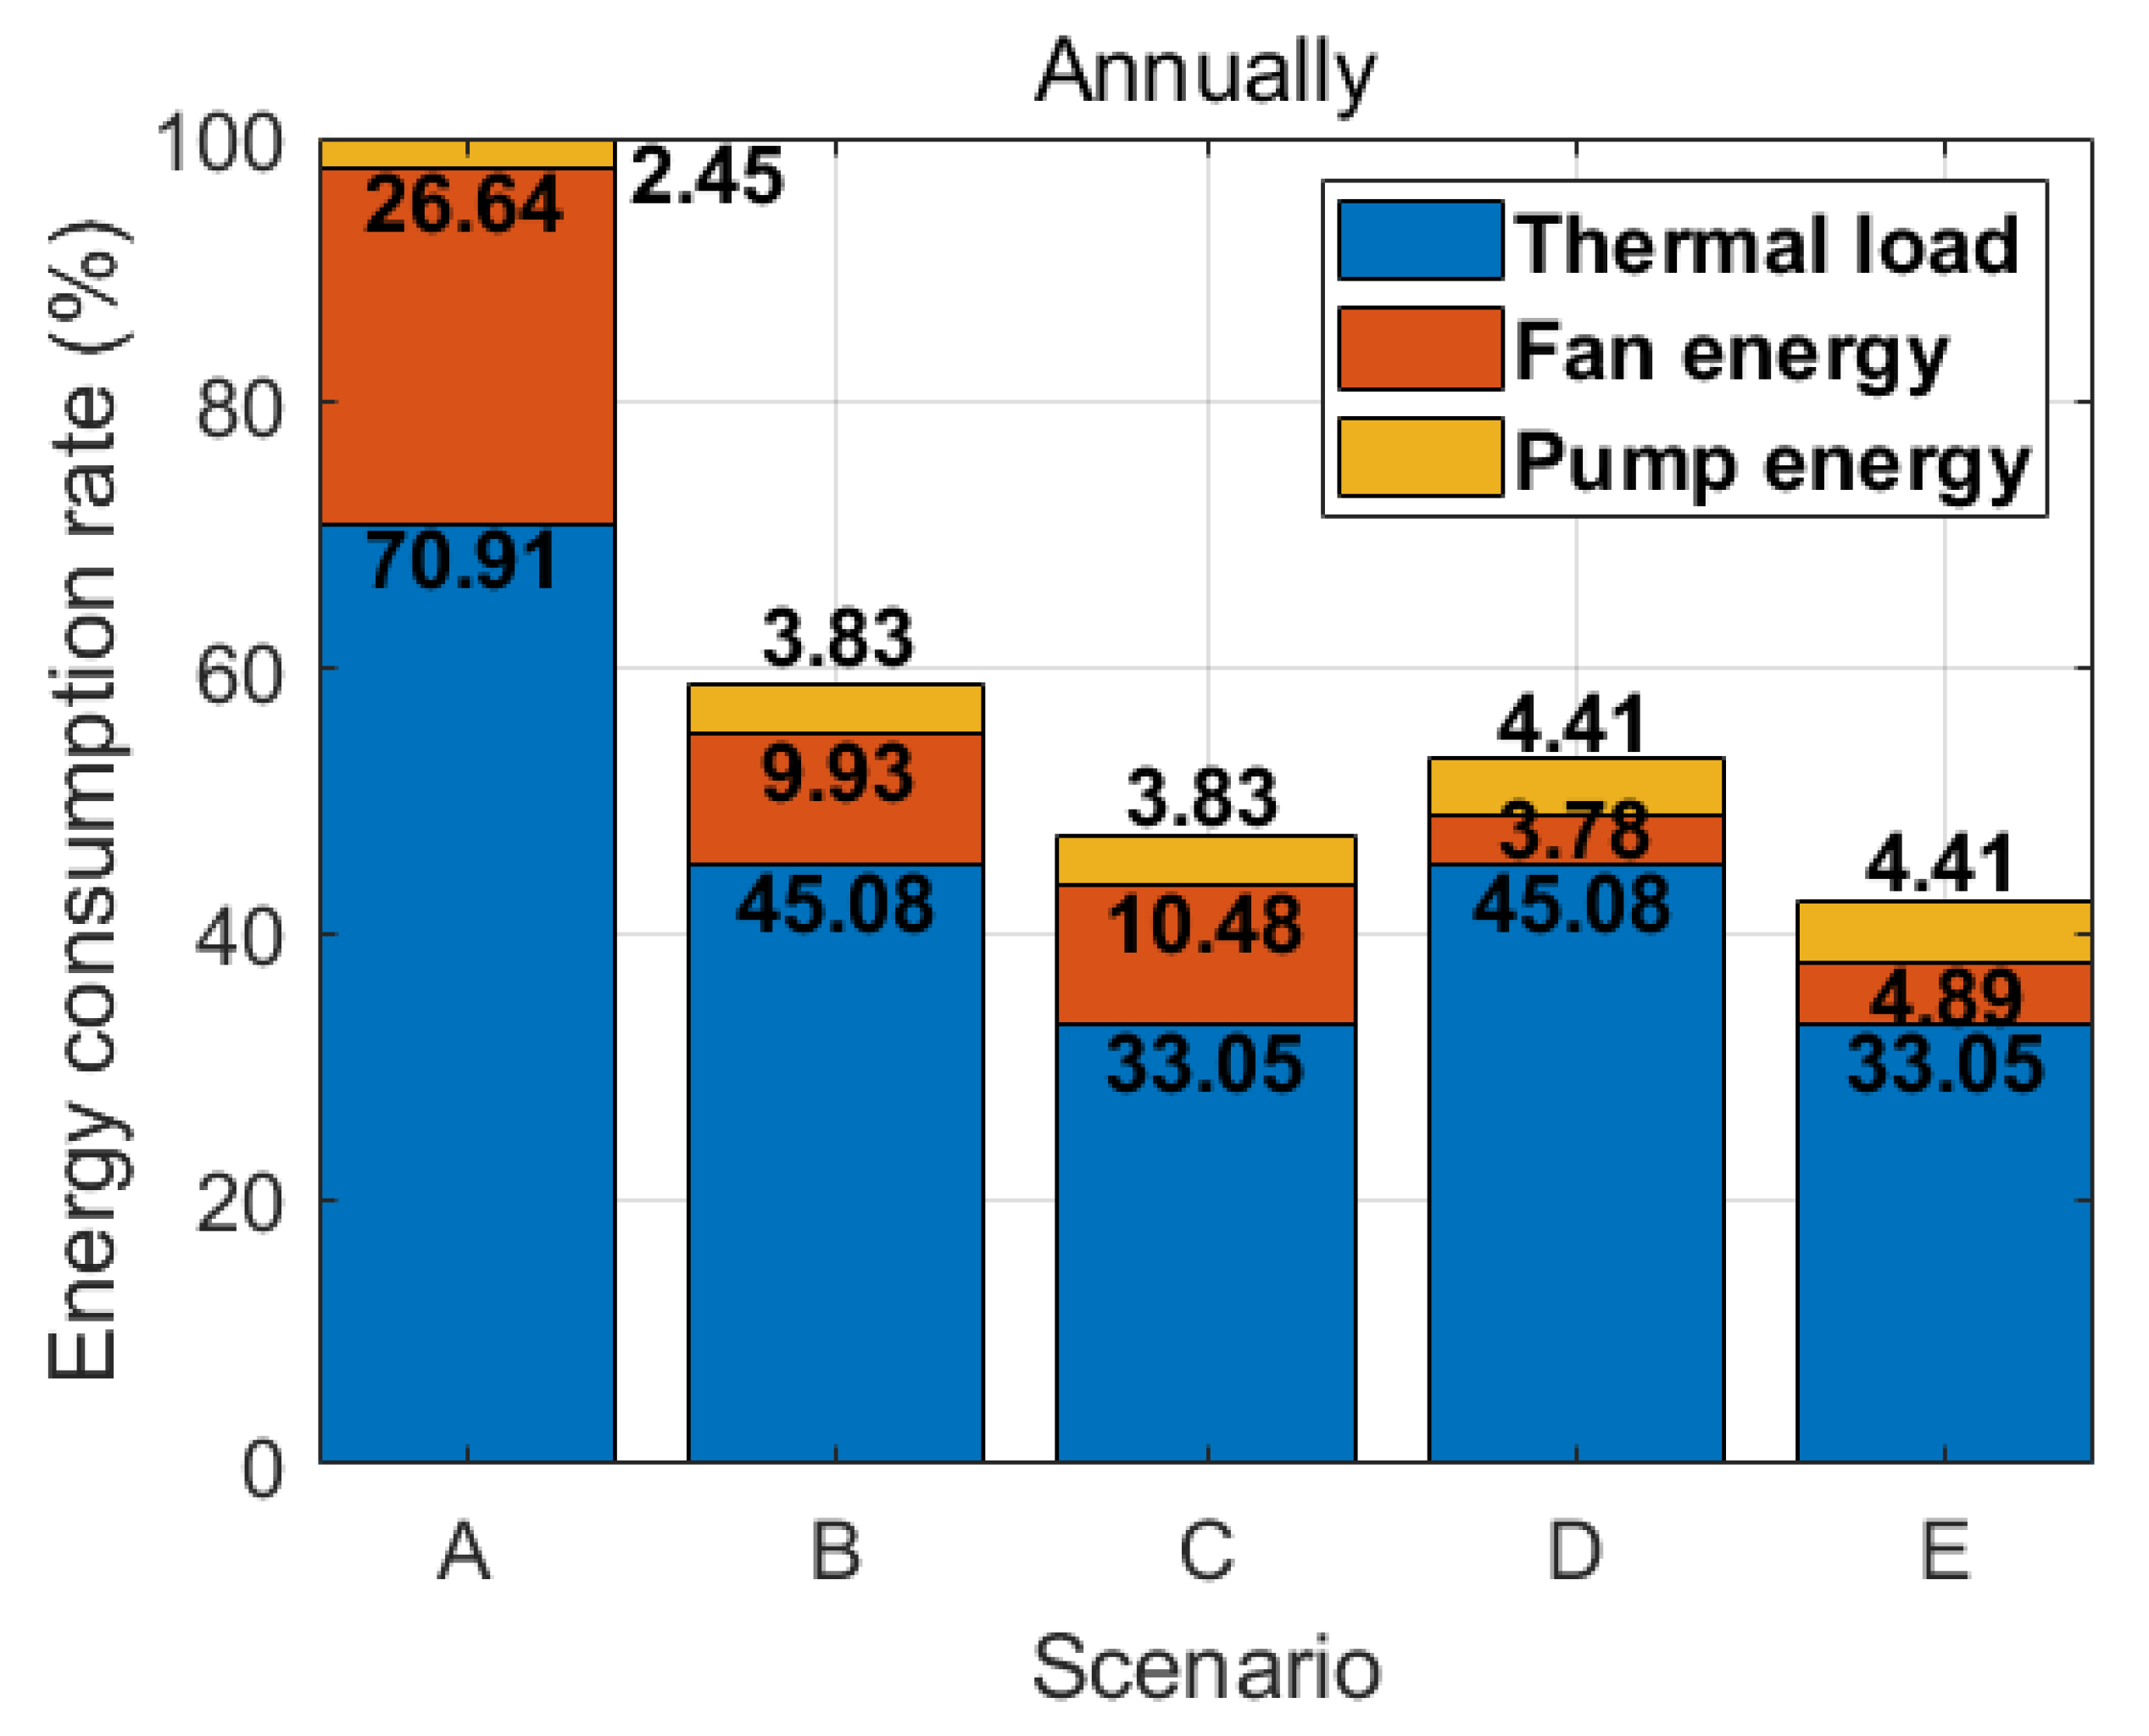
3.1. The Energy Performance of Three Different Ventilation Strategies

Suzhou’s hourly average outdoor air temperatures in 2019 were used to simulate all three systems’ yearly energy consumptions, which are presented in Figure 6. Compared to an AAS, the DPS saves 64% of fan energy and 36% of thermal load, while it consumes 1.6 times more pump energy, which leads to a total energy saving of around 41%. The DVS saves 90% and 36% of fan energy and thermal load, while it demands 1.8 times more pump energy, leading to a total energy saving of nearly 47% compared with an AAS. This is because the AAS requires a large ventilation rate (3.0 ACH) to supply enough heating and cooling capacity in winter and summer, which causes a significant pressure loss in ductworks, and more energy is required to treat the supply air. Furthermore, applying the DVS in a high-rise building could dramatically save fan load, since the shortest air distribution passages lead to a minimal pressure drop [26,31].
Due to the contaminated outdoor air, four different quality levels of air filters were considered to control IAQ in the building. Figure 7 displays the fan energy in all three systems when equipped with different air filters. It can be seen that the fan energy of DPS and DVS is kept constant in each season since the ventilation rate and supplied air temperature is stable. In comparison, the fan load of AAS is different in different seasons. It is higher in summer and winter since the additional supplied air is required to provide the heating and cooling capacity. Further, the fan load is highest in winter due to the HRU used, which causes an extra pressure drop, while the thermal load is reduced by 80%. Based on results, HRU could significantly reduce the energy used for conditioning the fresh air [62,63,64,65,66].
From Figure 7, in spring and autumn, the fan load demand by the DPS is higher than the AAS since the supply flow rate reduced from 3.0 to 1.0 ACH in the AAS and causes a decreasing pressure drop in the ductwork [52]. According to Figure 7, the fan load of DPS and DVS increases 21.2% and 36.3% when the MERV 16 air filter replaces the MERV 8 air filter. The fan load increases 29.7%, 14.1%, 29.7%, and 12% in the four seasons when the MERV 16 air filter is used for the AAS. It can be seen that the DVS demanded the lowest fan load over the four seasons among the three systems. Thus, using the DVS can effectively save fan energy since it has the shortest ductworks [26].

3.2. The Performance of the Ventilation System in Controlling IAQ

There are various limit values for outdoor PM2.5 concentration in different countries. The China National ambient air quality standard, GB3095-2012 [67], sets two classes of limit values for particular areas (e.g., National Parks) and all other areas (including urban and industrial areas). The standard recommends that the 24 h and annual mean PM2.5 concentration cannot go beyond 35 μg/m3 and 15 μg/m3 in the two particular areas. For the other areas, the limit value of daily and annual mean PM2.5 level is 75 μg/m3 and 35 μg/m3. In comparison, the USA has a stricter standard for the PM2.5 level. They have defined two types of standards for air pollutants, namely primary and secondary standards. The primary and secondary standards are aimed at protecting public health and public welfare. The primary standards require that the daily and annual mean value of PM2.5 should not exceed 35 μg/m3 and 12 μg/m3, while the secondary standards suggest that the 24 h and annual mean PM2.5 concentration should not be higher than 35 μg/m3 and 15 μg/m3. Since there is no evidence of a safe level for the PM, it is expected that the PM2.5 level is set as low as possible in order to protect human health [2]. Hence, in this study, the 35 μg/m3 was selected as the limit value of the daily average PM2.5 level.

3.2.1. The Influence of the AHU Location on the Ventilation Performance

As mentioned above, the different AHU locations in the centralized ventilated building will impact the IAQ within the building due to the outdoor air pollutants’ vertical profile. Hence, the IAQ in the building with two different AHU locations, including the basement and the top floor, were compared. According to the simulation results, the IAQ was much better if the AHU was located on the top floor of the building. In the default conditions (the system equipped with a MERV 8 air filter and air infiltration rate of 0.1 ACH), the indoor PM2.5 level in the AAS would increase by 18% and 18.6% on the ground floor and top floor, respectively, if the AHU was located in the basement. Meanwhile, the indoor PM2.5 level rose 11.8% and 13% on the ground floor and top floor, respectively, in the DPS. It is found that the effect of the AHU location is more significant in the AAS in winter since the higher ventilation rate (3.0 ACH) would bring more particles into the indoor environment. To improve IAQ, it is recommended that the AHU is set up on the top floor of a building in a polluted area. Thus, only this scenario is considered in the rest of this study.

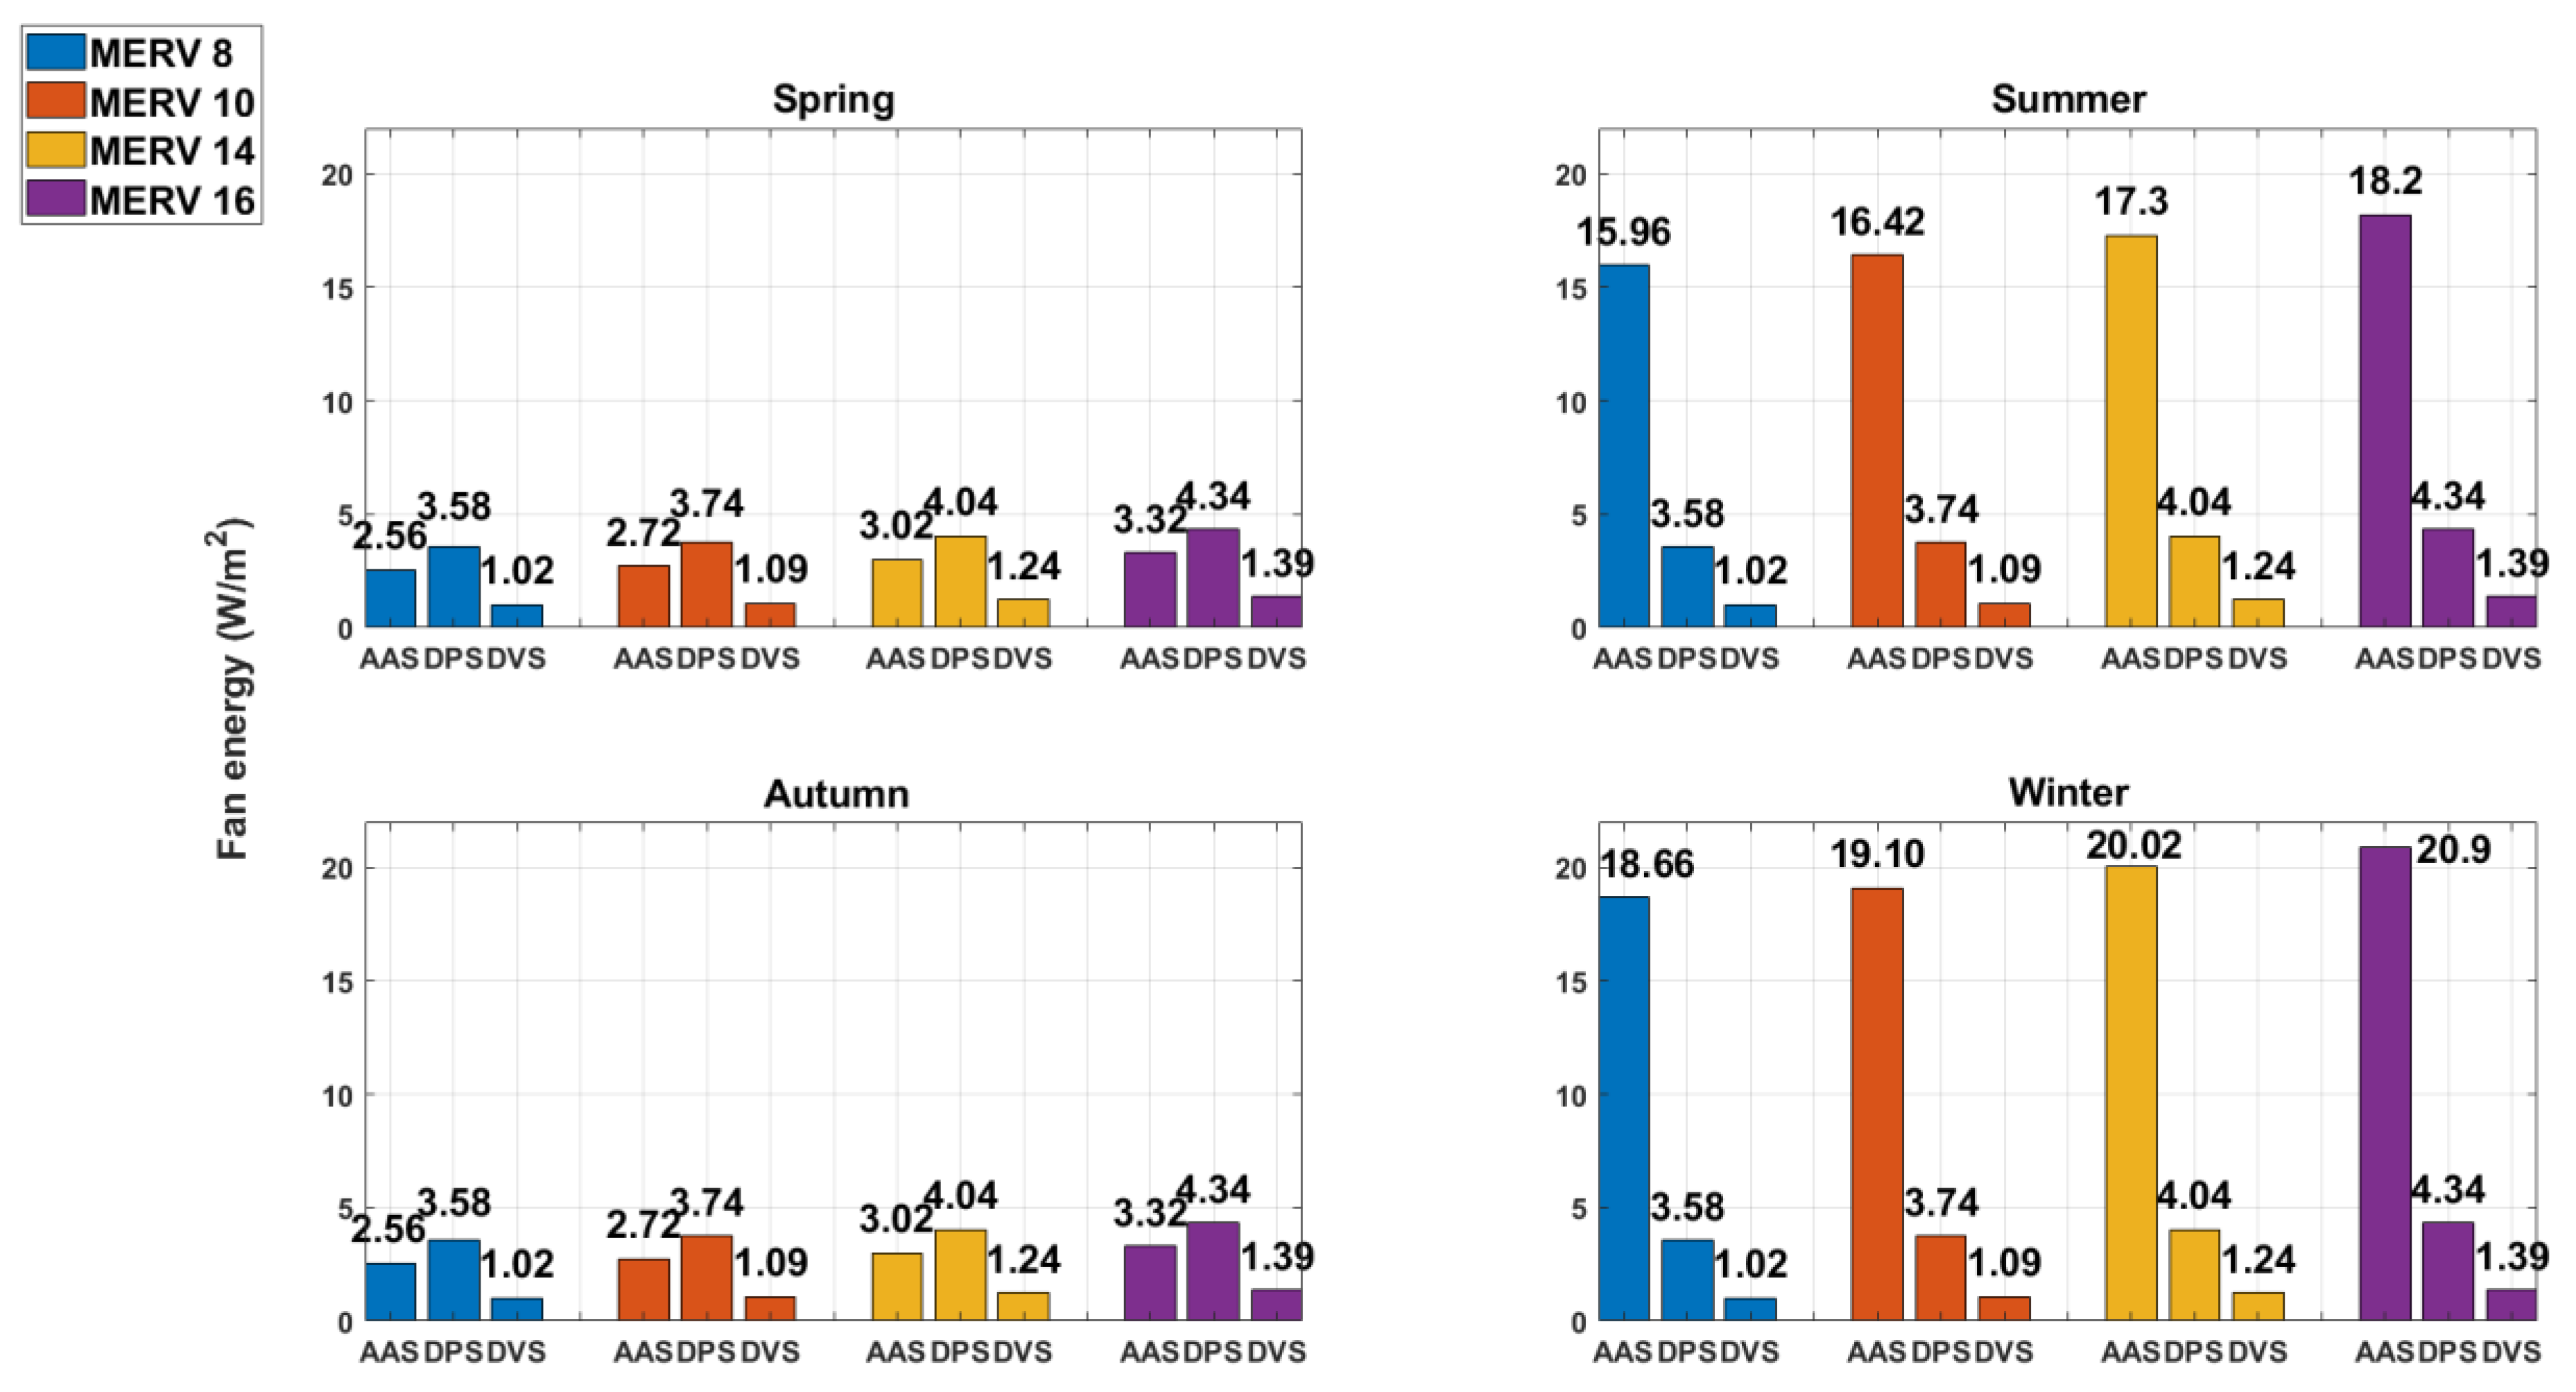
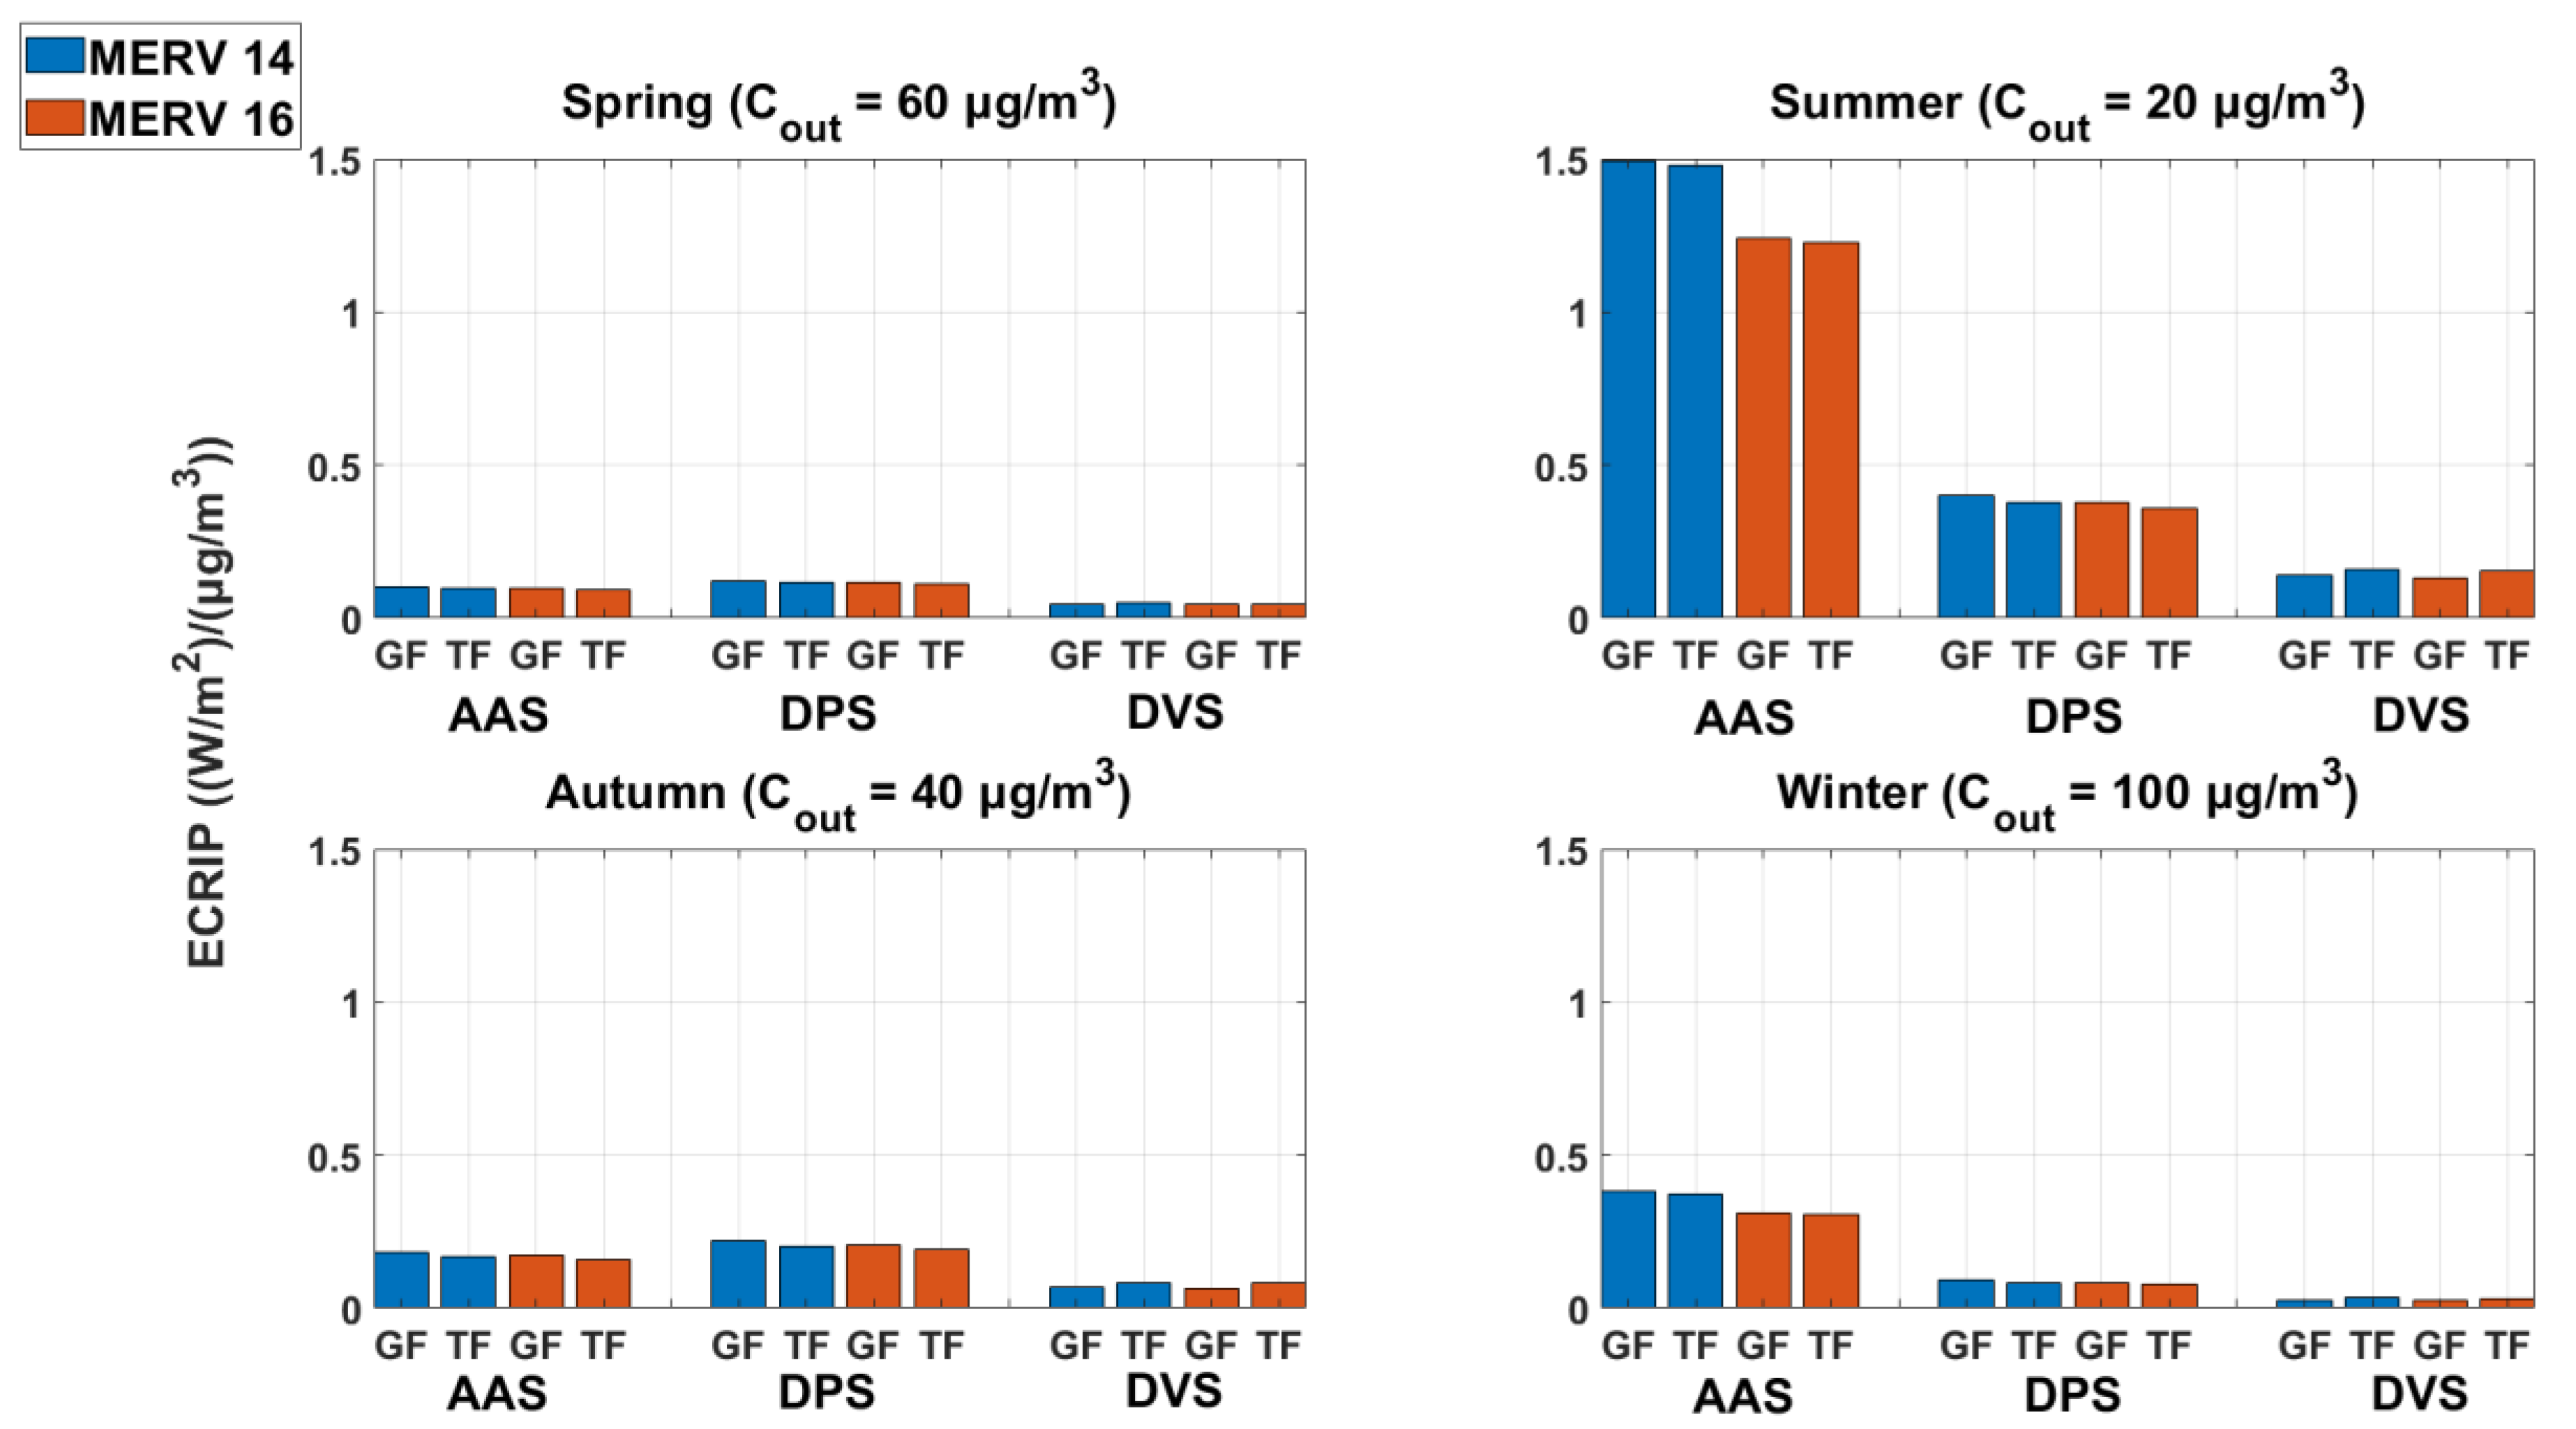
3.2.2. The Seasonal Impact on Ventilation Performance among the Three Systems

As discussed above, the outdoor air quality, outdoor air pollutants vertical profile, and the ventilation system’s operation mode can vary with the seasons, thereby impacting a ventilation system’s performance. Thus, it is necessary to investigate the influence of seasonal changes on the three systems’ ventilation performance. Table 2 presents all the input parameters that were used to run the simulations. A comparison of the seasonal impact on the ventilation performance between the three systems is shown in Figure 8.
The DPS was best at maintaining the IAQ in the high-rise building, followed by the DVS and AAS. Based on the simulations, the maximum and minimum indoor PM2.5 level occurred on the ground floor and the top floor in all scenarios, due to the outdoor PM vertical profiles. It was found that the AAS had the worst ventilation performance, especially in the heating and cooling seasons. This is due to the higher ventilation rate (3.0 ACH) and also because the recirculated air can bring more particles into the indoor environment than the other two systems when a low-efficiency air filter is used. Moreover, it can be seen that indoor PM2.5 levels vary more widely on different floors in the decentralized ventilated building than the centralized building, due to the operational characteristics of the DVS. Further, the indoor particle level difference between the top and ground floor was maximized in winter. It is because winter is the time of the most significant fluctuations in the outdoor PM. The results of other studies have reported that the DVS’s ventilation performance was highly influenced by outdoor air quality [25,26].

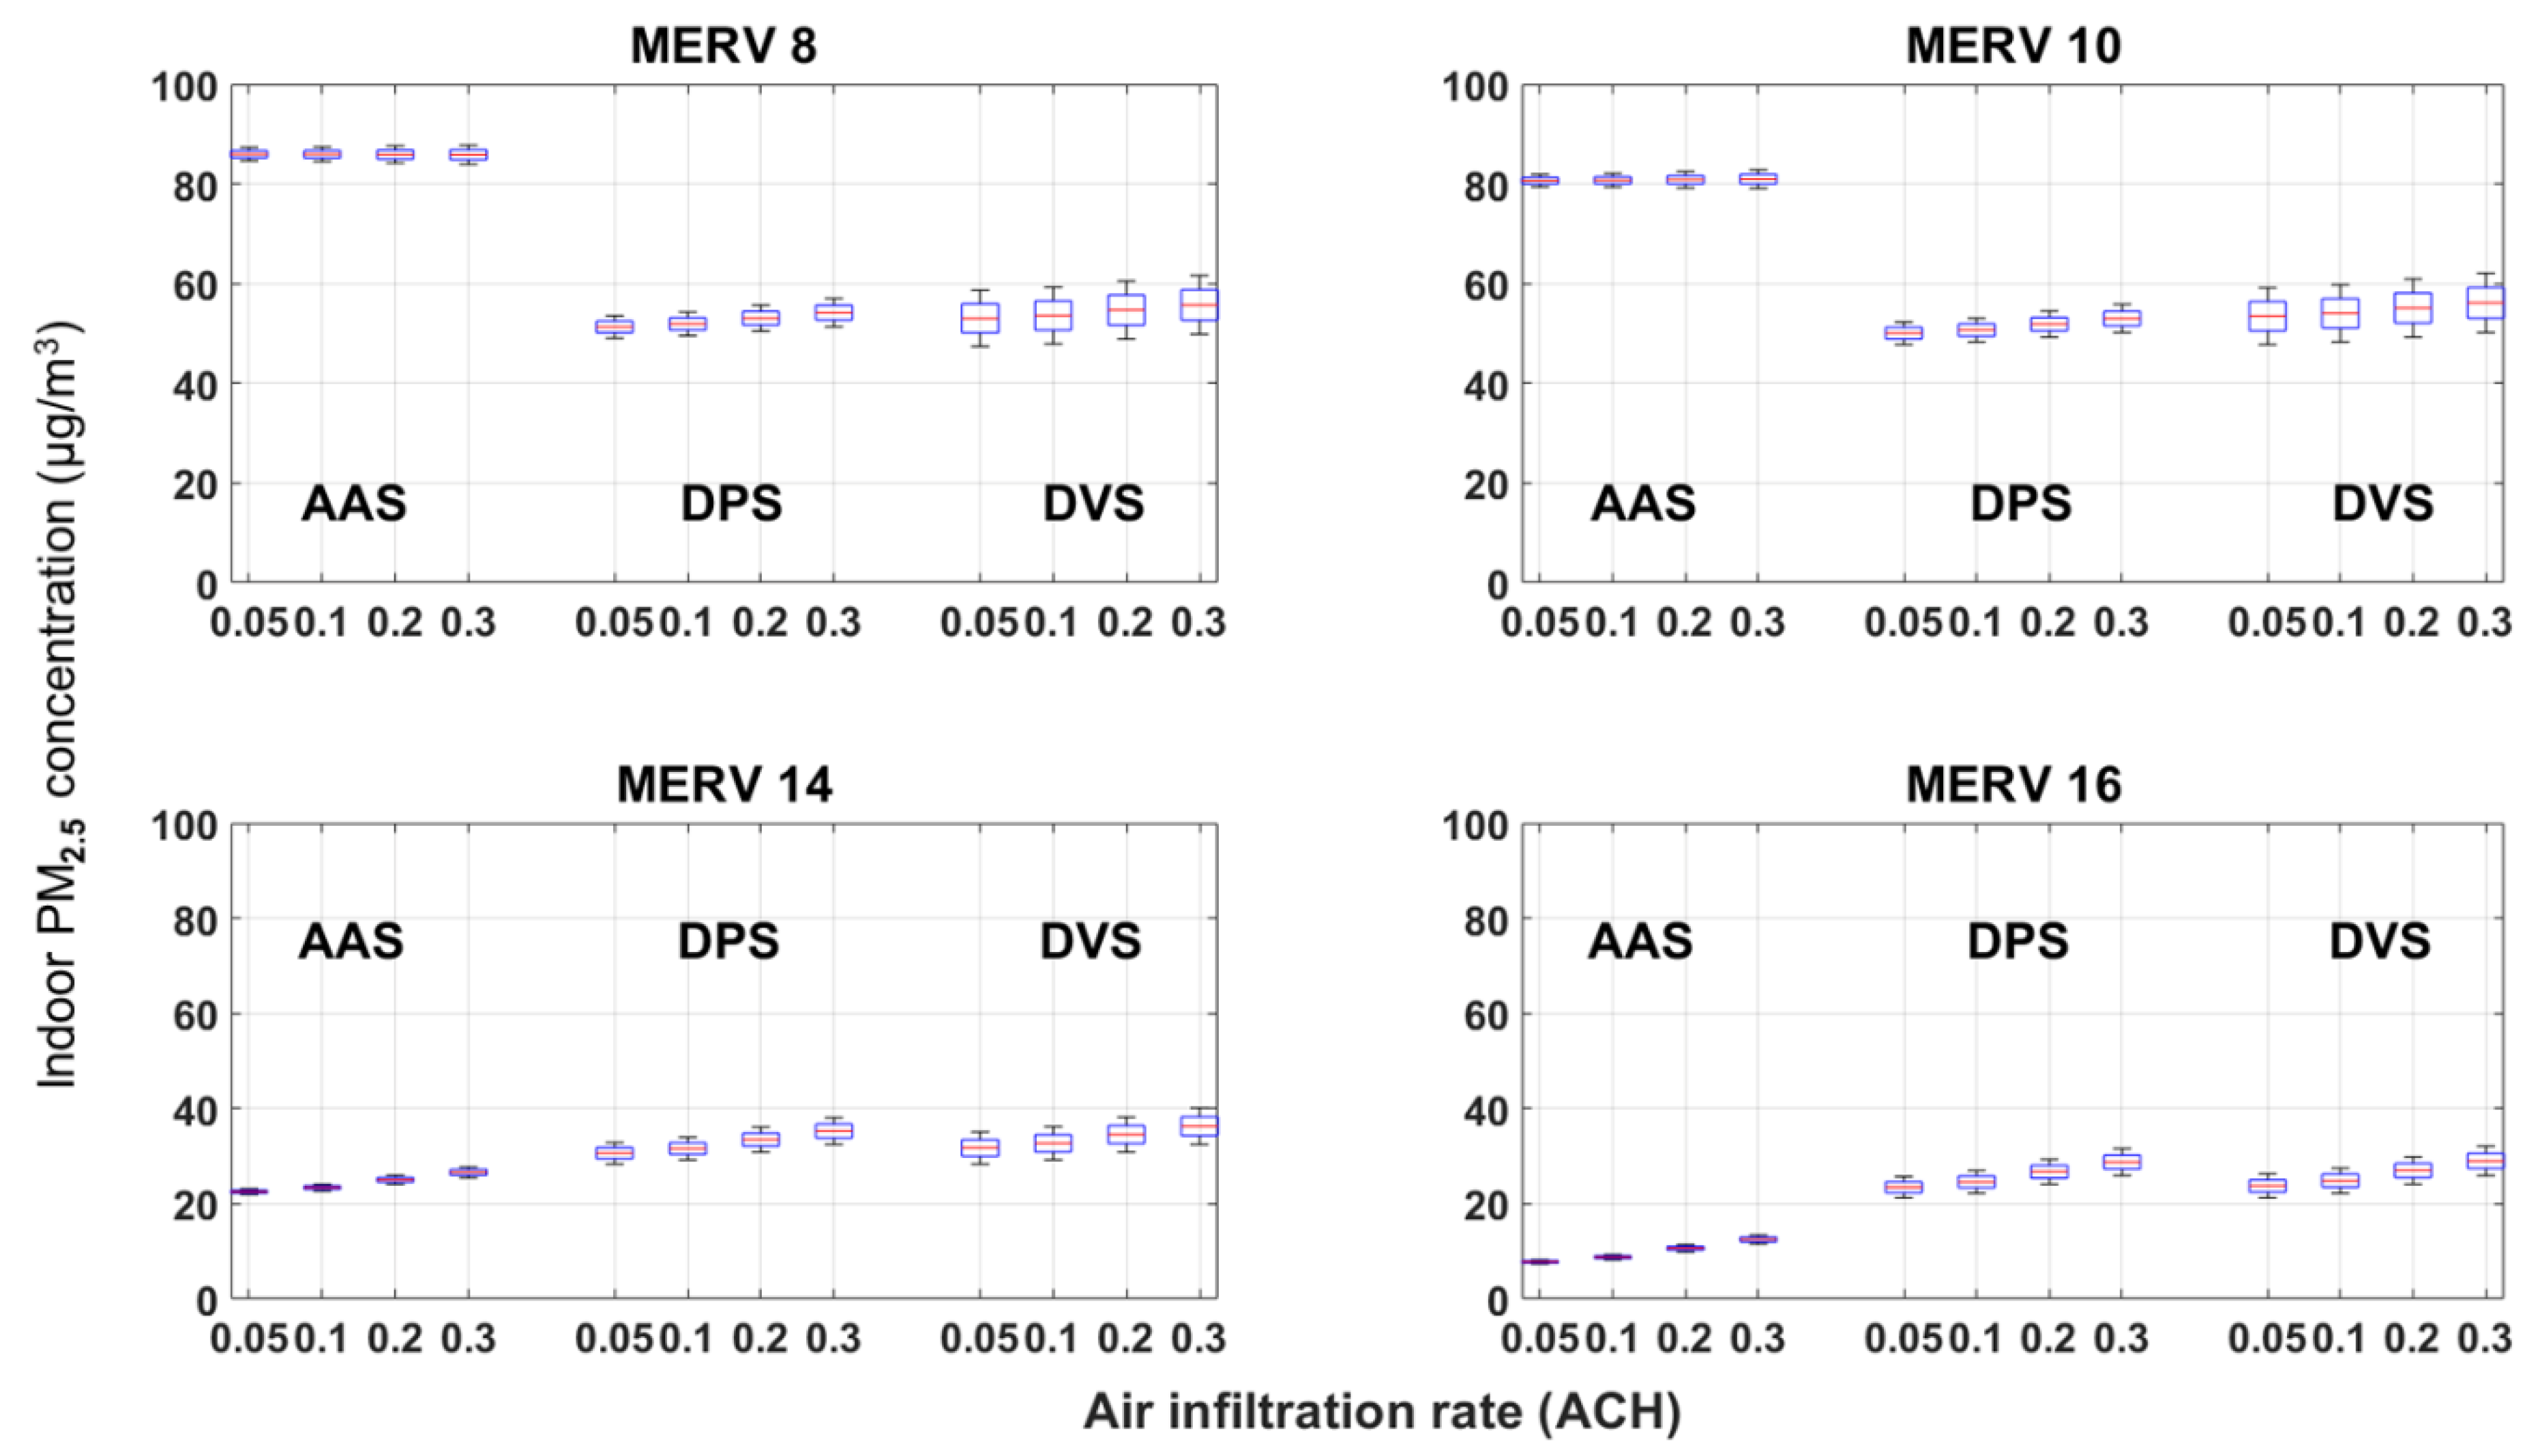
3.2.3. The Impact of Air Infiltration Rate and Filter Efficiency on Ventilation Performance

Measurements show that the outdoor air in Suzhou is most contaminated during winter [42], which means a building’s ventilation system should be able to maintain a good IAQ in winter. Thus, only IAQ within the building throughout the winter was simulated. Afterwards, it was applied to investigate the performance of three different strategies. In line with suggestions made in the ASHRAE Handbook of Fundamentals [68], four cases were chosen, namely: a well-sealed building ( q i = 0.05 h−1), a standard building ( q i = 0.1 h−1), and two leaky buildings ( q i = 0.2 h−1, q i = 0.3 h−1), which were used to investigate the effect of the air infiltration rate on ventilation system performance. All input variables shown in Table 3 were used to investigate the air filters’ impact on the ventilation system performance. The impact of infiltration rate and air filter efficiency on IAQ in the building in winter is shown in Figure 9.
Figure 9 shows that a high-efficiency air filter, MERV 14 or MERV 16, is required to get the IAQ to meet the standard. Other studies have also reported that high-efficiency air filters could significantly reduce indoor particle concentration [13,22,24]. It was found that the DPS and DVS performed better in maintaining IAQ when equipped with a low-efficiency air filter, whereas the AAS performed better if a high-efficiency air filter was used. This is because the AAS could supply more fresh air to dilute indoor particle concentrations than the other two systems, in winter, if a high-performance air filter was used. This result indicates that the higher ventilation rate could significantly improve IAQ if the supplied air is clear enough [23,68]. However, the recirculated air in the AAS may cause gas pollutants to exceed the limit value, such as CO2, which would negatively impact upon human health [23,24,69]. Based on this analysis, a MERV 14 or MERV 16 air filter is required to maintain IAQ in a building in Suzhou.
According to Figure 9, it can be seen that the infiltration rate could substantially degrade the ventilation system’s performance in controlling IAQ, and this effect is more evident with the AAS and DPS than it is for the DVS. A comparison of the indoor PM2.5 levels on the different floors of the building under different scenarios, when the air infiltration rate increased from 0.05 to 0.3 ACH, is presented in Table 4. This shows that the infiltration rate’s influence is more significant for a high-efficiency air filter than a low-efficiency air filter. Further, the air infiltration rate’s impact is more evident on the ground floor than on the top floor in a centralized ventilated building, and this is because the outdoor particle level decreases with height. According to the simulations, the effect of the air infiltration rate is kept constant on each floor in a decentralized ventilated building, due to the DVS’s operational characteristics. The results indicate that the air infiltration rate is an essential factor that impacts the ventilation system’s performance [70]. Based on the analysis, the DVS can better control IAQ within a healthy range in a building for a more extended period, since the system can minimize the influence of the air infiltration rate.
As a result, it is highly recommended that a building’s airtightness performance should be improved first [71], especially when outdoor air has deteriorated and the high-efficiency air filter is applied. Moreover, considering energy consumption, it is suggested that the DVS is applied in the high-rise building in order to control IAQ and supply fresh air.

3.2.4. The Comparison of the Ventilation Efficiency among the Three Systems

This study defined the energy cost of removing every unit of indoor particles (ECRIP) as an index to represent each system’s ventilation efficiency, considering both the system’s energy performance and ventilation performance, which can be determined from:
E C R I P = E f a n   P M o u t l e t P M i n l e t
E f a n = V × ( Δ P d u c t w o r k s + Δ P a i r   f i l t e r ) η × A × 3600
where ECRIP is the energy consumed by the system with different air filters to reduce every unit of indoor particles (W/m2)/(μg/m3), E f a n is the fan load based on the pressure differential between the inlet and the outlet of the fan, considering the pressure drop caused by the air filter and ductworks (W/m2), A is the total area that the fan served (m2), and the P M o u t l e t and P M i n l e t is the PM2.5 level in the air before and after the air filter (μg/m3). According to Equation (11), a higher ECRIP value means that more energy is required by the system to remove every unit of indoor particles. A comparison of the ventilation efficiency among the three systems considering the seasonal change, outdoor air quality and air filter efficiency is presented in Figure 10.
Figure 10 shows that the DVS performed the best in controlling IAQ in a high-rise building, while also saving energy. In the swing seasons, the DPS had the lowest efficiency on maintaining IAQ; this was because the smaller volume of supply air meant a lower pressure drop in the AAS [72]. From Figure 10, it can be seen that all three systems had their worst performance in summer, and this was because the outdoor air was cleaner and the air filter system was not needed. Moreover, all three systems’ total performances slightly decreased in autumn if the MERV 16 filter was used, which indicates that the high-efficiency air filter is not necessary when outdoor air is not highly contaminated. Accordingly, the high-performance air filter or air filter system is not essential when outdoor air is not highly polluted or clean, and thus there is a significant potential for energy-saving by using the DVS. In addition, it is found that the ventilation system performs better on the top floor than on the ground floor in a high-rise building, which indicates that the outdoor air pollutants can negatively impact upon the ventilation efficiency.
As a result, the DVS performed the best in controlling the IAQ in a high-rise building whilst saving energy, and it still has a large potential to save energy when the outdoor air is not highly polluted. Additionally, the DVS could also be used in the retrofit building to improve the IAQ and save energy [73]. The installation of the DVS has no special requirement of the indoor space in the retrofit building. However, the decentralized ventilation system will cause extra installation and maintenance costs because many decentralized air handling units would be installed in a building.

3.2.5. The Ventilation Performance in Controlling IAQ in a Building

According to statistics, the daily average outdoor PM2.5 concentration in Suzhou varied widely from 11 to 225 μg/m3 [42]. Therefore, it is essential to investigate how many days in a year the IAQ could be controlled within the limit value. Figure 11 presents the variation of the daily indoor PM2.5 level in the building served by the different ventilation systems. The detailed information about the comparison of indoor PM2.5 level in the building, equipped with different ventilation systems, is presented in Table 5.
It can be seen that the MERV 14 air filter could be successfully employed to maintain satisfactory indoor particle concentrations when the building used AAS and DPS, while the MERV 16 is required in the building equipped with a DVS. Based on the simulations, the IAQ in the building has 97.8–98.9% and 85.8–91% of days that can be controlled within a healthy range in a building served by the AAS and DPS, respectively, during a year when MERV 14 air filter is used. In comparison, the IAQ in a building equipped with a DVS has 38.6–99.7% of days reach the limit value in a year if MERV 16 air filter is applied. Based on the analysis, the daily average indoor PM2.5 concentration on the ground floor does not satisfy the standard’s requirement [1]. Thus, the extra air filter could be considered as an efficient strategy to improve IAQ on the lower floors in a decentralized, ventilated building [24].
According to Figure 11, the daily mean indoor PM2.5 level varied most widely in the building which used the DPS rather than the other two systems. The results indicate that outdoor air particles would significantly degrade the IAQ through the infiltrating air, and the default ventilation rate (1.0 ACH) cannot sufficiently dilute indoor particles when outdoor air is polluted. However, the DVS could minimize the infiltrating air’s impact compared to the other two systems in the same conditions. Moreover, it is found that IAQ on the top floor is significantly better than on the ground floor in a building because the indoor air quality is adjusted by the decentralized ventilation units on each floor. The results show a good agreement with previous research, contending that the DVS’ ventilation performance is influenced by outdoor air quality [25,26].
In comparing the three strategies, the DVS has the worst performance in controlling IAQ in the same conditions. The reason is that the outdoor air quality highly impacts the DVS due to its operational characteristics with an individual air inlet on each floor. However, considering energy consumption and minimizing the infiltrating air’s impact, it is worth developing the DVS further to improve its ventilation performance.

3.3. Improving the System’s Ventilation and Energy Performance

As analyzed, the indoor PM2.5 levels on the lower floors in a decentralized ventilated building do not reach the recommended limit value. Thus, further development is required. Ruan and Rim [23] indicated that a double air filter system (combined AHU filter and outdoor air (OA) filter system) could significantly dilute the indoor particle level. Hence, a double-filter system was applied to the decentralized ventilated building to control the indoor particle level. Based on the analysis, the indoor PM2.5 concentration between the 20th and 30th floors met the standard with the AHU filter only. Therefore, an extra OA filter, a MERV 8 air filter, was applied from the 1st to the 20th floors. Afterwards, the annual mean indoor PM2.5 level on the 1st floor decayed to 34.4 μg/m3, reaching the standard. As mentioned above, the HRU could significantly reduce the thermal ventilation load when applied in the AAS, and it is therefore expected that it can be used to save energy further if it is applied to the DPS and DVS. Accordingly, five scenarios were chosen to compare the system’s energy performance when the IAQ in a building had been controlled within a healthy range, and the detailed information is shown in Table 6.
Based on the simulation, the thermal load in winter reduced by 93% in scenarios C and E compared with scenarios B and D, if the HRU was used. However, an extra 22.9% and 29.2% of the fan load was required in scenarios C and E, which led to a total decrease of 69.6% and 79.3% in energy consumption in winter in scenarios C and E. Thus, it can be seen that the HRU is an efficient strategy to save energy in Suzhou. Furthermore, currently, the temperature difference between exhaust and outdoor air could be over 10 °C during summer daytimes, with potential global warming effects. Therefore, using the HRU during these specific periods may further improve its coefficient of performance.
Afterwards, each system’s total performance under different scenarios was simulated, and the results are listed in Table 7, where it can be seen that scenario D performed the best in controlling IAQ whilst saving energy, with a demand of 0.021–0.023 W/m2 for diluting every unit of the indoor particle concentration in the high-rise building. However, scenario C provides the best IAQ in a building, where the indoor PM2.5 level varied from 19.1 to 20.6 μg/m3 in a building. Moreover, Figure 12 shows a comparison of each system’s annual energy performance between five selected cases. Scenario E saves 81.6% and 53.4% of fan and thermal load compared to scenario A. It consumes more 44.4% of pump energy, however, it saves 57.7% of annual energy consumptions. Scenario C saves 52.6% energy yearly, compared with scenario A.
As a result, the DVS could essentially decrease fan energy consumption due to having the shortest ductworks in the system. Hence, scenario D needs to be applied to a high-rise building to provide better air quality when outdoor air is contaminated.

4. Conclusions

A simulation-based study was conducted to investigate the ventilation efficiency and energy performance of three ventilation strategies in improving IAQ. Based on the European standard EN13779, this study designed ventilation supply ductworks for centralized and decentralized systems to investigate the energy performance of three different ventilation strategies by considering the factors related to Suzhou’s seasonal environment. The study also analyzed the IAQ in a high-rise building based on the air infiltration rate, outdoor air pollution rate, seasonal change, and air filter efficiency, and these elements substantially impacted IAQ levels with floor height variations.
Numerical simulation was used to conclude that the IAQ differed from floor to floor in the modelled high-rise building due to the outdoor particles vertical profile. According to the simulation results, the DPS and DVS performed better in maintaining IAQ when equipped with a low-efficiency air filter, whereas the AAS performed better if a high-efficiency air filter was used. The results indicate that MERV 14 and MERV 16 filters were required for the building in Suzhou to maintain the IAQ within a healthy range. Moreover, it was found that the infiltration rate could substantially degrade the ventilation system’s performance in controlling IAQ, and this effect is more evident with the AAS and DPS than it is for the DVS.
Based on the analysis, the AAS performs the best in maintaining IAQ in a high-rise building, while it also consumes the highest energy annually. In comparison, the DVS had the worst performance in controlling IAQ among the three ventilation strategies. However, with the double-filter system applied on the lower floors, the IAQ in the building served by the DVS can easily meet the necessary standard, and the annual energy consumption remained the lowest among the three strategies. It was also found that the heat recovery unit could save energy in a temperate climate region, such as Suzhou. The results indicate that the DVS is the most energy-efficient system of those tested. Further, the DVS still has a substantial potential to save energy during the season when the outdoor air is relatively clean, since the air filter can be readily replaced. Accordingly, it is highly recommended that the DVS is applied to a high-rise building to control IAQ and supply fresh air in an energy-efficient manner.

Author Contributions

Conceptualization, N.F. and M.K.K.; methodology, N.F. and M.K.K.; software, N.F.; validation, M.K.K. and S.S.; formal analysis, N.F.; investigation, N.F.; resources, N.F. and M.K.K.; data curation, N.F.; writing—original draft preparation, N.F.; writing—review and editing, M.K.K., S.S. and B.C.; visualization, N.F.; supervision, M.K.K., B.C. and S.S.; project administration, M.K.K. and B.C.; funding acquisition, M.K.K. and B.C. All authors have read and agreed to the published version of the manuscript.

Funding

This research received no external funding.

Institutional Review Board Statement

Not applicable.

Informed Consent Statement

Not applicable.

Data Availability Statement

Data sharing needs permissions.

Acknowledgments

This work was supported by Research Development Fund (RDF 15-02-32) of Xi’an Jiaotong–Liverpool University and Zhejiang Provincial Natural Science Foundation (LY19E080001). And this study was also supported by the Department of Civil Engineering and Energy Technology of Oslo Metropolitan University.

Conflicts of Interest

The authors declare no conflict of interest.

References

  1. WHO. Air Quality Guidelines Global Update 2005: Particulate Matter, Ozone, Nitrogen Dioxide and Sulfur Dioxide; World Health Organization Regional Office for Europe: Geneva, Switzerland, 2006. [Google Scholar]
  2. WHO. Health Effects of Particulate Matter; World Health Organization: Geneva, Switzerland, 2013. [Google Scholar]
  3. Chen, G.; Li, S.; Zhang, Y.; Zhang, W.; Li, D.; Wei, X.; He, Y.; Bell, M.L.; Williams, G.; Marks, G.B.; et al. Effects of ambient PM 1 air pollution on daily emergency hospital visits in China: An epidemiological study. Lancet Planet. Health 2017, 1, e221–e229. [Google Scholar] [CrossRef]
  4. Hu, K.; Guo, Y.; Hu, D.; Du, R.; Yang, X.; Zhong, J.; Fei, F.; Chen, F.; Chen, G.; Zhao, Q.; et al. Mortality burden attributable to PM1 in Zhejiang province, China. Environ. Int. 2018, 121, 515–522. [Google Scholar] [CrossRef] [PubMed]
  5. Zauli-Sajani, S.; Rovelli, S.; Trentini, A.; Bacco, D.; Marchesi, S.; Scotto, F.; Zigola, C.; Lauriola, P.; Cavallo, D.M.; Poluzzi, V.; et al. Higher health effects of ambient particles during the warm season: The role of infiltration factors. Sci. Total Environ. 2018, 627, 67–77. [Google Scholar] [CrossRef] [PubMed]
  6. Yang, B.-Y.; Guo, Y.; Morawska, L.; Bloom, M.S.; Markevych, I.; Heinrich, J.; Dharmage, S.C.; Knibbs, L.D.; Lin, S.; Yim, S.H.L.; et al. Ambient PM1 air pollution and cardiovascular disease prevalence: Insights from the 33 Communities Chinese Health Study. Environ. Int. 2019, 123, 310–317. [Google Scholar] [CrossRef] [PubMed]
  7. EPA. Health and Environmental Effects of Particulate Matter (PM); 2019. Available online: https://www.epa.gov/pm-pollution/health-and-environmental-effects-particulate-matter-pm (accessed on 11 May 2019).
  8. Li, A.; Ren, T.; Yang, C.; Lv, W.; Zhang, F. Study on particle penetration through straight, L, Z and wedge-shaped cracks in buildings. Build. Environ. 2017, 114, 333–343. [Google Scholar] [CrossRef]
  9. Pereira, M.; Graudenz, G.; Tribess, A.; Morawska, L. Determination of particle concentration in the breathing zone for four different types of office ventilation systems. Build. Environ. 2009, 44, 904–911. [Google Scholar] [CrossRef] [Green Version]
  10. Chen, C.; Zhao, B. Review of relationship between indoor and outdoor particles: I/O ratio, infiltration factor and penetration factor. Atmos. Environ. 2011, 45, 275–288. [Google Scholar] [CrossRef]
  11. Challoner, A.; Gill, L. Indoor/outdoor air pollution relationships in ten commercial buildings: PM2.5 and NO2. Build. Environ. 2014, 80, 159–173. [Google Scholar] [CrossRef]
  12. Peng, Z.; Deng, W.; Tenorio, R. Investigation of Indoor Air Quality and the Identification of Influential Factors at Primary Schools in the North of China. Sustainability 2017, 9, 1180. [Google Scholar] [CrossRef]
  13. Ben-David, T.; Wang, S.; Rackes, A.; Waring, M.S. Measuring the efficacy of HVAC particle filtration over a range of ventilation rates in an office building. Build. Environ. 2018, 144, 648–656. [Google Scholar] [CrossRef]
  14. Zhang, C.; Wang, J.; Li, L.; Wang, F.; Gang, W. Utilization of Earth-to-Air Heat Exchanger to Pre-cool/heat Ventilation Air and Its Annual Energy Performance Evaluation: A Case Study. Sustainability 2020, 12, 8330. [Google Scholar] [CrossRef]
  15. Rieser, A. Integration of Energy-Efficient Ventilation Systems in Historic Buildings-Review and Proposal of a Systematic Intervention Approach. Sustainability 2021, 13, 2325. [Google Scholar] [CrossRef]
  16. Kim, M.K.; Baldini, L.; Leibundgut, H.; Wurzbacher, J.A.; Piatkowski, N. A novel ventilation strategy with CO2 capture device and energy saving in buildings. Energy Build. 2015, 87, 134–141. [Google Scholar] [CrossRef]
  17. Sundell, J.; Levin, H.; Nazaroff, W.; Cain, W.S.; Fisk, W.J.; Grimsrud, D.T.; Gyntelberg, F.; Li, Y.; Persily, A.K.; Pickering, A.C.; et al. Ventilation rates and health: Multidisciplinary review of the scientific literature. Indoor Air 2011, 21, 191–204. [Google Scholar] [CrossRef] [PubMed]
  18. Azimi, P.; Zhao, D.; Stephens, B. Estimates of HVAC filtration efficiency for fine and ultrafine particles of outdoor origin. Atmos. Environ. 2014, 98, 337–346. [Google Scholar] [CrossRef]
  19. Carrer, P.; Wargocki, P.; Fanetti, A.; Bischof, W.; Fernandes, E.D.O.; Hartmann, T.; Kephalopoulos, S.; Palkonen, S.; Seppänen, O. What does the scientific literature tell us about the ventilation–health relationship in public and residential buildings? Build. Environ. 2015, 94, 273–286. [Google Scholar] [CrossRef]
  20. Zhao, D.; Azimi, P.; Stephens, B. Evaluating the Long-Term Health and Economic Impacts of Central Residential Air Filtration for Reducing Premature Mortality Associated with Indoor Fine Particulate Matter (PM2.5) of Outdoor Origin. Int. J. Environ. Res. Public Health 2015, 12, 8448–8479. [Google Scholar] [CrossRef] [PubMed] [Green Version]
  21. Chan, W.R.; Parthasarathy, S.; Fisk, W.J.; McKone, T.E. Estimated effect of ventilation and filtration on chronic health risks in U.S. offices, schools, and retail stores. Indoor Air 2016, 26, 331–343. [Google Scholar] [CrossRef]
  22. Stephens, B. Evaluating the Sensitivity of the Mass-Based Particle Removal Calculations for HVAC Filters in ISO 16890 to Assumptions for Aerosol Distributions. Atmosphere 2018, 9, 85. [Google Scholar] [CrossRef] [Green Version]
  23. Kim, M.K.; Choi, J.-H. Can increased outdoor CO2 concentrations impact on the ventilation and energy in buildings? A case study in Shanghai, China. Atmos. Environ. 2019, 210, 220–230. [Google Scholar] [CrossRef]
  24. Ruan, T.; Rim, D. Indoor air pollution in office buildings in mega-cities: Effects of filtration efficiency and outdoor air ventilation rates. Sustain. Cities Soc. 2019, 49, 101609. [Google Scholar] [CrossRef]
  25. Kim, M. Introduction of decentralized ventilation systems in buildings. In Sustainable Buildings and Structures; CRC Press: Delft, The Netherlands, 2015; pp. 207–210. [Google Scholar]
  26. Kim, M.K.; Baldini, L. Energy analysis of a decentralized ventilation system compared with centralized ventilation systems in European climates: Based on review of analyses. Energy Build. 2016, 111, 424–433. [Google Scholar] [CrossRef]
  27. BINE Informationsdienst. Decentralized Ventilation and Climate Control of Office Buildings, 13/2009; FIZ: Karlsruhe, Germany, 2009; ISSN 0937-8367. [Google Scholar]
  28. Baldini, L. Advanced Building Ventilation System Based on the Paradigms of Decentralization and Exergy Minimization Using a Highly Interlaced Network Structure for the Supply and a Sensor Based Local Control Approach for the Exhaust; ETH Zurich Library: Zurich, Switzerland, 2009. [Google Scholar]
  29. Mahler, B.; Himmler, R. Results of the evaluation study DeAL decentralized facade integrated ventilation systems. In Proceedings of the Eighth International Conference for Enhanced Building Operations, Berlin, Germany, 20–22 October 2008. [Google Scholar]
  30. Cui, S.; Kim, M.K.; Papadikis, K. Performance Evaluation of Hybrid Radiant Cooling System Integrated with Decentralized Ventilation System in Hot and Humid Climates. Procedia Eng. 2017, 205, 1245–1252. [Google Scholar] [CrossRef]
  31. Kim, M.K.; Liu, J.; Cao, S.-J. Energy analysis of a hybrid radiant cooling system under hot and humid climates: A case study at Shanghai in China. Build. Environ. 2018, 137, 208–214. [Google Scholar] [CrossRef]
  32. CTBUH. Tall Buildings in Numbers: 2017 Year in Review; Council on Tall Buildings and Urban Habitat: Chicago, IL, USA, 2017. [Google Scholar]
  33. Kalaiarasan, M. Traffic-generated airborne particles in naturally ventilated multi-storey residential buildings of Singapore: Vertical distribution and potential health risks. Build. Environ. 2009, 44, 1493–1500. [Google Scholar] [CrossRef]
  34. Zhang, Y.-F.; Xu, H.; Tian, Y.-Z.; Shi, G.-L.; Zeng, F.; Wu, J.; Zhang, X.-Y.; Li, X.; Zhu, T.; Feng, Y.-C. The study on vertical variability of PM10 and the possible sources on a 220 m tower, in Tianjin, China. Atmos. Environ. 2011, 45, 6133–6140. [Google Scholar] [CrossRef]
  35. Xiao, Z.; Wu, J.; Han, S.; Zhang, Y.; Xu, H.; Zhang, X.; Shi, G.; Feng, Y. Vertical characteristics and source identification of FM10 in Tianjin. J. Environ. Sci. 2012, 24, 112–115. [Google Scholar] [CrossRef]
  36. Deng, X.; Li, F.; Li, Y.; Li, J.; Huang, H.; Liu, X. Vertical distribution characteristics of PM in the surface layer of Guangzhou. Particuology 2015, 20, 3–9. [Google Scholar] [CrossRef]
  37. Peng, Z.-R.; Wang, D.; Wang, Z.; Gao, Y.; Lu, S. A study of vertical distribution patterns of PM2.5 concentrations based on ambient monitoring with unmanned aerial vehicles: A case in Hangzhou, China. Atmos. Environ. 2015, 123, 357–369. [Google Scholar] [CrossRef]
  38. Azimi, P.; Zhao, H.; Fazli, T.; Zhao, D.; Faramarzi, A.; Leung, L.; Stephens, B. Pilot study of the vertical variations in outdoor pollutant concentrations and environmental conditions along the height of a tall building. Build. Environ. 2018, 138, 124–134. [Google Scholar] [CrossRef]
  39. Liu, F.; Zheng, X.; Qian, H. Comparison of particle concentration vertical profiles between downtown and urban forest park in Nanjing (China). Atmos. Pollut. Res. 2018, 9, 829–839. [Google Scholar] [CrossRef]
  40. Wong, P.P.; Lai, P.-C.; Allen, R.; Cheng, W.; Lee, M.; Tsui, A.; Tang, R.; Thach, T.Q.; Tian, L.; Brauer, M.; et al. Vertical monitoring of traffic-related air pollution (TRAP) in urban street canyons of Hong Kong. Sci. Total Environ. 2019, 670, 696–703. [Google Scholar] [CrossRef] [PubMed] [Green Version]
  41. Stephens, B.A.; Parham, L.L. How do outdoor pollutant concentration vary along the height of a tall building? CTBUH J. 2019, 7, 26–32. [Google Scholar]
  42. Wang, J. Suzhou Daily Average Outdoor Dry-Bulb Air Temperature from 1st of January 2018 to 31st of December 2018. Available online: https://www.aqistudy.cn/ (accessed on 21 September 2019).
  43. ANSI/ASHRAE Standard 62. 1, Ventilation for Acceptable Indoor Air Quality (ASHRAE 2010b); American Society of Heating, Refrigerating and Air-Conditioning Engineers, Inc.: Atlanta, GA, USA, 2013. [Google Scholar]
  44. WUI. Shanghai Hongqiao International Airport Station; 2021. Available online: https://www.wunderground.com/history/daily/cn/ (accessed on 21 September 2019).
  45. ANSI/ASHRAE Standard 55, Thermal Environmental Conditions for Human Occupancy (ASHRAE 2010a); American Society of Heating, Refrigerating and Air-Conditioning Engineers, Inc.: Atlanta, GA, USA, 2010.
  46. Muralikrishna, I.V.; Manickam, V. Chapter Fourteen—Air Pollution Control Technologies. In Environmental Management: Science and Engineering for Industry; Butterworth-Heinemann: Oxford, UK; Cambridge, MA, USA, 2017; pp. 337–397. [Google Scholar]
  47. Niu, J.; Zhang, L.; Zuo, H. Energy savings potential of chilled-ceiling combined with desiccant cooling in hot and humid climates. Energy Build. 2002, 34, 487–495. [Google Scholar] [CrossRef]
  48. Zhang, L.Z.; Niu, J.L. Indoor humidity behaviors associated with decoupled cooling in hot and humid climates. Build. Environ. 2003, 38, 99–107. [Google Scholar] [CrossRef]
  49. CIBSE Guide B2. Ventilation and Ductwork; CIBSE Publications: London, UK, 2016. [Google Scholar]
  50. CEN. BS EN 1886:2007 Ventilation for Buildings. Air Handling Units. Mechanical Performance; BSI Standards Limited: London, UK, 2007. [Google Scholar]
  51. EngA. Linear HEF-2 Extruded Radiant Ceiling System Design Manual. Available online: http://airtexradiantpanels.com/documents/lineardesign.pdf (accessed on 25 November 2020).
  52. CEN. BS EN 13779:2007 Ventilation for Non-Residential Buildings. Performance Requirements for Ventilation and Room-Conditioning Systems; BSI standards Limited: London, UK, 2007. [Google Scholar]
  53. Pope, C.A.; Burnett, R.T.; Thurston, G.D.; Thun, M.J.; Calle, E.E.; Krewski, D.; Godleski, J.J. Cardiovascular Mortality and Long-Term Exposure to Particulate Air Pollution. Circulation 2004, 109, 71–77. [Google Scholar] [CrossRef] [Green Version]
  54. Miller, K.A.; Siscovick, D.S.; Sheppard, L.; Shepherd, K.; Sullivan, J.H.; Anderson, G.L.; Kaufman, J.D. Long-Term Exposure to Air Pollution and Incidence of Cardiovascular Events in Women. N. Engl. J. Med. 2007, 356, 447–458. [Google Scholar] [CrossRef]
  55. Liu, D.-L.; Nazaroff, W. Particle Penetration through Building Cracks. Aerosol Sci. Technol. 2003, 37, 565–573. [Google Scholar] [CrossRef] [Green Version]
  56. Wang, H. Study Shows PM1 Air Pollution Is Most Harmful; 2013. Available online: http://usa.chinadaily.com.cn/china/2013-10/28/content_17061997.htm (accessed on 19 July 2019).
  57. Huang, W.; Xie, X.; Qi, X.; Huang, J.; Li, F. Determination of Particle Penetration Coefficient, Particle Deposition Rate and Air Infiltration Rate in Classrooms Based on Monitored Indoor and Outdoor Concentration Levels of Particle and Carbon Dioxide. Procedia Eng. 2017, 205, 3123–3129. [Google Scholar] [CrossRef]
  58. EPA. Indoor Particulate Matter—Indoor Air Quality (IAQ); 2019. Available online: https://www.epa.gov/indoor-air-quality-iaq/indoor-particulate-matter (accessed on 21 September 2019).
  59. Lisa, C.; Ng, A.M.; Anderw, K.; Persily, S.J. Airflow and Indoor Air Quality Models of DOE Reference Commercial Buildings; National Institute of Standards and Technology: Gaithersburg, MD, USA, 2012. [Google Scholar]
  60. Li, X.; Wang, J.; Tu, X.; Liu, W.; Huang, Z. Vertical variations of particle number concentration and size distribution in a street canyon in Shanghai, China. Sci. Total Environ. 2007, 378, 306–316. [Google Scholar] [CrossRef] [PubMed]
  61. Liu, P. Aircraft study of aerosol vertical distributions over Beijing and their optical properties. Tellus B Chem. Phys. Meteorol. 2009, 61, 756–767. [Google Scholar] [CrossRef] [Green Version]
  62. Hu, R.; Niu, J. A review of the application of radiant cooling & heating systems in Mainland China. Energy Build. 2012, 52, 11–19. [Google Scholar]
  63. ASHRAE. ASHRAE 52.2-1999—Method of Testing General Ventilation Air-Cleaning Devices for Removal Efficiency by Particle Size (ANSI Approved); American Society of Heating, Refrigerating and Air-Conditioning Engineers, Inc.: Atlanta, GA, USA, 2000. [Google Scholar]
  64. CEN. BS EN ISO 16890-1:2016 Air Filters for General Ventilation. Technical Specifications, Requirements and Classification System Based Upon Particulate Matter Efficiency (ePM); BSI Standards Limited: London, UK, 2017. [Google Scholar]
  65. Zhang, L.Z.; Niu, J.L. Energy requirements for conditioning fresh air and the long-term savings with a membrane-based energy recovery ventilator in Hong Kong. Energy 2001, 26, 119–135. [Google Scholar] [CrossRef]
  66. Liu, X.; Niu, J. An optimal design analysis method for heat recovery devices in building applications. Appl. Energy 2014, 129, 364–372. [Google Scholar] [CrossRef]
  67. Ministry of Environmental Protection of the Republic of China. Ambient Air Quality Standards (GB 3095-2012); Ministry of Environmental Protection of the Republic of China: Beijing, China, 2012. [Google Scholar]
  68. ASHRAE. 2017 ASHRAE Handbook: Fundamentals; ASHRAE: New York, NY, USA, 2017. [Google Scholar]
  69. Fisk, W.J.; Mendell, M.J.; Hotchi, T.; Sullivan, D.P. Is CO2 an Indoor Pollutant? Higher Levels of CO2 May Diminish Decision Making Performance. ASHRAE J. 2013, 55, 6148. [Google Scholar]
  70. Prignon, M.; Van Moeseke, G. Factors influencing airtightness and airtightness predictive models: A literature review. Energy Build. 2017, 146, 87–97. [Google Scholar] [CrossRef]
  71. Spiru, P.; Simona, P.L. A review on interactions between energy performance of the buildings, outdoor air pollution and the indoor air quality. Energy Procedia 2017, 128, 179–186. [Google Scholar] [CrossRef]
  72. CEN. BS EN 15242:2007 Ventilation for Buildings. Calculation Methods for the Determination of Air Flow Rates in Buildings Including Infiltration; BSI Standards Limited: London, UK, 2007. [Google Scholar]
  73. Bonato, P.; D’Antoni, M.; Fedrizzi, R. Modelling and simulation based analysis of a façade integrated decentralized ventilation unit. J. Build. Eng. 2020, 29, 101183. [Google Scholar] [CrossRef]
Figure 1. Schematic of the three selected ventilation systems.
Sustainability 13 08453 g001
Figure 2. Suzhou’s hourly outdoor air dry-bulb temperature in 2019 [44].
Sustainability 13 08453 g002
Figure 3. The installation of the ductwork in the building applied with a CV system.
Sustainability 13 08453 g003
Figure 4. The installation of ductwork in the building applied with a DV system [26].
Sustainability 13 08453 g004
Figure 5. The measured daily average outdoor PM2.5 concentrations in Suzhou between 1 January 2018 and 31 December 2018 [42].
Sustainability 13 08453 g005
Figure 6. The yearly energy consumption of three different ventilation systems (when equipped with a MERV 8 air filter).
Sustainability 13 08453 g006
Figure 7. The fan loads of the three different ventilation strategies when equipped with the different grades of air filters for the four seasons.
Sustainability 13 08453 g007
Figure 8. The seasonal impact on ventilation performance in controlling IAQ in a high-rise building among the three systems under the default scenario, which the MERV 8 air filter is used, and the air infiltration rate is 0.1 ACH (the five horizontal lines for each box represent, from bottom to top: minimum, 1st quartile, median, 3rd quartile, and maximum concentration).
Sustainability 13 08453 g008
Figure 9. The factors impacting on ventilation performance in winter of the three ventilation systems (the five horizontal lines for each box represent from bottom to top: minimum, 1st quartile, median, 3rd quartile, and maximum concentration).
Sustainability 13 08453 g009
Figure 10. Comparison of the total ventilation performance among the three systems considering the seasonal change, outdoor air quality and air filter efficiency (‘GF’ and ‘TF’ mean ground floor and top floor).
Sustainability 13 08453 g010
Figure 11. The variation of daily average indoor PM2.5 level from 1 Jan to 31 Dec in 2018 for the three ventilation systems and MERV 14 and MERV 16 air filters.
Sustainability 13 08453 g011
Figure 12. Comparison of the systems’ annual energy performance between five scenarios.
Sustainability 13 08453 g012
Table 1. The total pressure drop for specific components in the AHU [52].
MERV 8 (Pa)MERV 10 (Pa)MERV 14 (Pa)MERV 16 (Pa)
AAS520570670770
AAS (winter with HRU)8208709701070
DPS520570670770
DVS520570670770
Table 2. Input variables for investigating the impact of seasonal change on IAQ in a building.
Season P M o u t   ( µ g / m 3 ) η a   ( % ) q i   ( h 1 ) β   ( h 1 ) p (h−1) q r   ( h 1 )
Spring, Summer, Autumn, Winter 60, 20, 40, 10032.3 (MERV 8)0.10.50.950.7
Table 3. Input parameters for investigating the indoor PM2.5 concentration.
Season P M o u t   ( µ g / m 3 ) η a   ( % ) q i   ( h 1 ) β   ( h 1 ) p (h−1) q r   ( h 1 )
Winter 10032.3, 35.4, 78, 950.05, 0.1, 0.2, 0.30.50.950.7
Table 4. The indoor PM2.5 level in a building under different scenarios when the air infiltration rate increases from 0.05 to 0.3 ACH.
Ventilation SystemAir Filter ClassMERV 8MERV 16
q i   ( h 1 ) 0.050.30.050.3
AAS1st floor (µg/m3)87.2787.748.2213.44
30th floor (µg/m3)84.6384.947.3611.53
DPS1st floor (µg/m3)53.5656.9925.7331.60
30th floor (µg/m3)49.0651.3321.2325.93
DVS1st floor (µg/m3)40.2944.3726.2632.08
30th floor (µg/m3)32.5735.8721.2325.93
Table 5. The comparison of annually mean indoor PM2.5 level in the building equipped with different ventilation systems.
Ventilation System MERV 14 (μg/m3)MERV 16 (μg/m3)
AASGround floor24.0511.03
Top floor22.659.67
DPSGround floor23.5713.19
Top floor21.6611.29
DVSGround floor48.4435.61
Top floor39.1528.78
Table 6. Comparison of each system’s energy performance between the five scenarios.
ScenarioSystemFilter ConfigurationsOA FilterAHU FilterHRU
AAASSingle filter system-MERV 14Y
BDPSSingle filter system-MERV 14N
CDPSSingle filter system-MERV 14Y
DDVSDouble filter systemMERV 8MERV 16N
EDVSDouble filter systemMERV 8MERV 16Y
Hint
1.
‘Y’ and ‘N’ means the system equipped or do not equip the HRU, respectively.
Table 7. Each system’s total performance under different scenarios.
ScenarioABCDE
Building FloorGFTFGFTFGFTFGFTFGFTF
ECRIP (W/m2/(μg/m3)0.2640.2590.0530.0520.0660.0650.0230.0210.0270.025
Publisher’s Note: MDPI stays neutral with regard to jurisdictional claims in published maps and institutional affiliations.

