Article

Water Resources Allocation Based on Complex Adaptive System Theory in the Inland River Irrigation District

State Key Laboratory of Eco-Hydraulics in Northwest Arid Region, Xi’an University of Technology, Xi’an 710048, China
*
Author to whom correspondence should be addressed.
Sustainability 2021, 13(15), 8437; https://doi.org/10.3390/su13158437
Submission received: 17 June 2021 / Revised: 19 July 2021 / Accepted: 26 July 2021 / Published: 28 July 2021

Abstract

:
Water resources are the key factors affecting the sustainable development of inland river irrigation districts. The establishment of a water resources management model is helpful to realize the coordinated development of water, society, and ecology. Aiming at the contradiction of water use and ecological vulnerability, this study was based on the method of complex adaptive system (CAS) theory, and an agent-based modeling (ABM) method was adopted. Taking Huaitoutala irrigation district as the research object, a water resource management model considering ecological balance was established, with the water resources potentially tapping in the source area as an effective constraint. This study took 2016 as the datum year; the water consumption and comprehensive benefits of four water-saving irrigation scenarios in different characteristic years were simulated and optimized under the conditions of the current water supply and 10% and 15% potential water resources tapping. The results showed that the model considering the behavior and adaptability of the agent can well optimize and simulate the water use in the irrigation district. Under the application of water resources potential tapping and high-efficiency water-saving technology; the water utilization efficiency (WUE) of the irrigation area has been significantly improved. The comprehensive benefits of the irrigation district increased the proportion of ecological water, which was conducive to the sustainable development of the irrigation district and the ecological protection of inland rivers.

1. Introduction

In recent years, with the increase in economic development and population, the contradiction between the supply and demand of water resources in inland river source irrigation districts has become increasingly prominent [1], and the sustainable development of regional agricultural production and economic society has been seriously impeded [2]. Water resources management is the main instrument to improve water use efficiency and alleviate the pressure on water resources [3]. Because of the complexity and uncertainty of watershed systems, effective sustainable water resources management often needs to be based on adaptive management [4]. Adaptability refers to the ability of the agent to adapt to the environment. The concept of adaptive management was originally used in ecosystem theory and practice to address uncertainties in natural resources under dynamic conditions [5]. Adaptive water resource management considers the complexities and uncertainties of the water resource system and continuously optimizes its management objectives through the dynamic learning feedback process of each agent within the system [6,7]. Complex adaptive systems (CAS) theory combines macro-level systems and micro-level agents to describe the adaptability of the complex system. It describes the interaction between agents and the interaction between agents and the environment, making the whole system in the process of continuous evolution [5]. CAS emphasizes the adaptability and co-evolution of agents within the system, provides a theoretical basis for the adaptive theory of environmental resource allocation and management, and gradually applies the management of natural resources, especially the adaptive management of water resources [8].
Paying attention to the research on water resource allocation from the angle of complexity science, it is necessary to combine CAS theory with the basic characteristics of water resource systems [9]. Zhao et al. applied CAS theory to build a new water resources allocation system analysis model, and the dynamic connection of all agents in the system was established, which integrated hydrological simulation with economic optimization and was applied in water resource allocation of the Yellow River Basin in China. The study preliminarily proved the applicability of the model in the water resource allocation of river basins [10]. The theory is based on self-organization theory and synergetics, and it divides the system into individual adaptive agents. The agents have learning ability and adaptability and can continuously learn to accumulate experience and improve themselves according to the influence of the external environment [11]. This long-term dynamic evolution mechanism forms the evolution and adaptability of the system. The cooperation between agents enhances the stability of the water resource system and the adaptability of the agent accelerates the evolution of the system [11,12]. Vervoort et al. used adaptive action to provide decision-makers with food security decisions in response to different climate conditions [13], providing a new approach for the adaptive management of water resources. Meek and Marshall defined the elasticity range of water resources management in Southern California from the theory of CAS, proving the importance of stakeholders’ participation and action in the water governance system for elasticity recovery [9]. CAS theory can be used not only to evaluate water policies and design water management strategies but also to simulate the competitive process of water resources [14,15]. Liu et al. proposed a general framework for the analysis of agent water conservation behavior response model under external stimulation. The study took Beijing as an example to construct water conservation regulation scenarios and corresponding agent water conservation behavior rules, systematically simulated the process of individual water use change from the aspects of water price setting, water information, and water-saving education [16]. Such studies typically simulate the behavior of different water users/stakeholders and their responses to different management scenarios. The cooperation between the agents is realized by providing incentives, penalties, and new laws, which can provide a reference for regional sustainable water resources management strategy.
The water resources system is a complex adaptive system, and it is also a coupling human and natural systems [17]. Utilizing water rights trading, raising water-saving awareness, and water-saving reconstruction engineering, human beings improve their water use efficiency while pursuing the maximum benefits. These behaviors change the natural changes of river runoff and the groundwater level so that human beings affect the water resource system as an internal factor [18,19]. The agent-based model (ABM) is widely considered as an important tool to study the human–nature coupling system, which can be used to model the complex adaptive system [20]. The agent-based water resources management model fully considers the heterogeneity of the internal composition of the water resources system and is widely used in the optimal allocation of water resources in the basin, the management of urban residents’ water use, and the water resources management in the irrigation district [11,14,17,21,22,23,24]. The operational mechanism of the ABM includes the agent-level distributed decision-making process and the coordination mechanism of the system-level organizational decision-making process [11]. ABM technology provides a clear concept and regulations for the construction of distributed systems to support stakeholder-driven, bottom-up management [24]. Yang et al. described the agent-level distributed decision-making process and the coordination mechanism of the system-level organization decision-making process and also proposed a multi-agent-based distributed optimization algorithm for watershed management. The local interest factor was used to measure the importance of the agent goals compared with the constraints [25]. Zhao et al. proposed a decentralized algorithm of water resources system based on ABM, studied the allocation of water resources through indicators under the market system such as economic benefits, water rights, and water prices, found the optimal water rights allocation scheme for the water market through reasonable initial water rights, and revealed the overall water consumption and trading behavior of water users in the basin under the condition of water trading [10].
After the large scale complex problem is decomposed into several relatively simple local objective problems by using the distributed control theory and distributed to several agents in the network, the ABM should also be combined with the continuous watershed simulation model, to dynamically consider the effects of the actions taken by the agents on the quality and quantity of water resources and water demand, and establish rules that correspond to changing water demand and environmental issues [24,26,27]. Akhbari et al. studied to encourage cooperation by providing incentives, penalties, and new regulations, dynamically considered the impact of actions taken by the agent on water quality, quantity, and water demand, and established the framework of water resource conflict management model based on the ABM [11]. In irrigation districts, the research applies the ABM to simulate and analyze the grain yield, crop planting pattern, and water quality and to optimize water demand and restore underground aquifers. Nouri et al. established a crop model and a water management policy evaluation model based on the agent to restore the aquifer and simulated the behavior of agricultural agents through fuzzy inference system (FIS) [28]. Ghazali et al. proposed a hybrid framework based on TOPSIS-agent, which considered the influence of neighbors, training, punishment, incentives, and other factors; used TOPSIS to determine the dynamic balance coefficient; and proposed the best crop model for different regions under different climatic conditions [29]. Ng et al. established the ABM coupling model of water resources allocation and hydrological cycle to simulate and analyze the grain yield and water quality in the irrigation district [24].
In the irrigation district, previous studies about water resources management mainly focus on the economic benefits and groundwater problems, and less on the ecological relationship between the irrigation district and the surrounding environment [4,30,31]. Moreover, the traditional water resources allocation does not describe the dynamic changes of the water resources system enough and ignores the heterogeneity of irrigation water users and the water competition among them [32]. Such simulation results usually do not conform to the actual water use situation of irrigation districts [28]. According to the characteristics of water resources system in the irrigation district, based on the complex adaptive system, this study constructed the dynamic management model of water resources in irrigation district based on agent and applied it to Huaitoutala’s irrigation, which provided the basis for the decision making of water resources management in the sustainable development of inland river irrigation district.
The paper is divided into five sections. Section 2 introduces the structure of the CAS of water resources in the irrigation district, describes the agent behavior, and forms the dynamic communication mechanism of water resources allocation by establishing the interaction mechanism between the agents. Section 3 introduces the nested genetic algorithm to solve the model. Section 4 carries out a case study on a typical inland river irrigation district in China and analyzes the agent water use behavior under different scenarios. Section 5 summarizes conclusions of the study.

2. Model Building

2.1. CAS of Water Resources in Irrigation District

There are diverse agents in the system. The agent at the bottom level has formed a department-level agent through aggregation [5,12]. The agent with the same or similar behavior has formed a high-level agent through complementary advantages and resource sharing [18]. The new agent has stronger adaptability so that the original agent can enhance its ability to adapt to the changes of the external environment [22]. Secondly, because the agent has adaptive and learning mechanisms, there are many non-linear correlations within the system. For example, under the influence of different water use structures and modes, the relationship between the total amount of water resources and the total output is nonlinear [33]. The connection of nonlinear relations is based on flow. Flow is the link of the system, which mainly refers to substances, funds, and information exchange between the agents or an exchange of substances between the agents and the external environment [21]. Substances flow refers to the distribution and transportation of water quantity. Fund flow refers to the investment in agricultural water-saving transformation and water conservancy engineering projects. Information flow refers to the water supply and demand information of different agents [10].
The characteristics of CAS indicate that the system has dynamic conditions for continuous learning, and the mechanisms are the basis for continuous evolution [8]. The internal models are formed by the interaction of the internal mechanisms of the agents and mechanisms of different levels [11]. For example, according to the feedback of water supply and demand information and substances flow, the agricultural production agent should change the irrigation methods to improve the water utilization efficiency and optimize their own planting structure. Building blocks affect the complexity of the system [5,10]. For example, the resource allocation ratio between ecological agents and agricultural production agents affects whether the irrigation district is biased toward economic benefit or ecological benefit. Tagging is the basis for agents to identify water and land resources information [4]. By identifying the information and processing the internal model, the agents interact with simple building blocks in various ways and combinations and, finally, forms the co-evolution of CAS in the irrigation district.
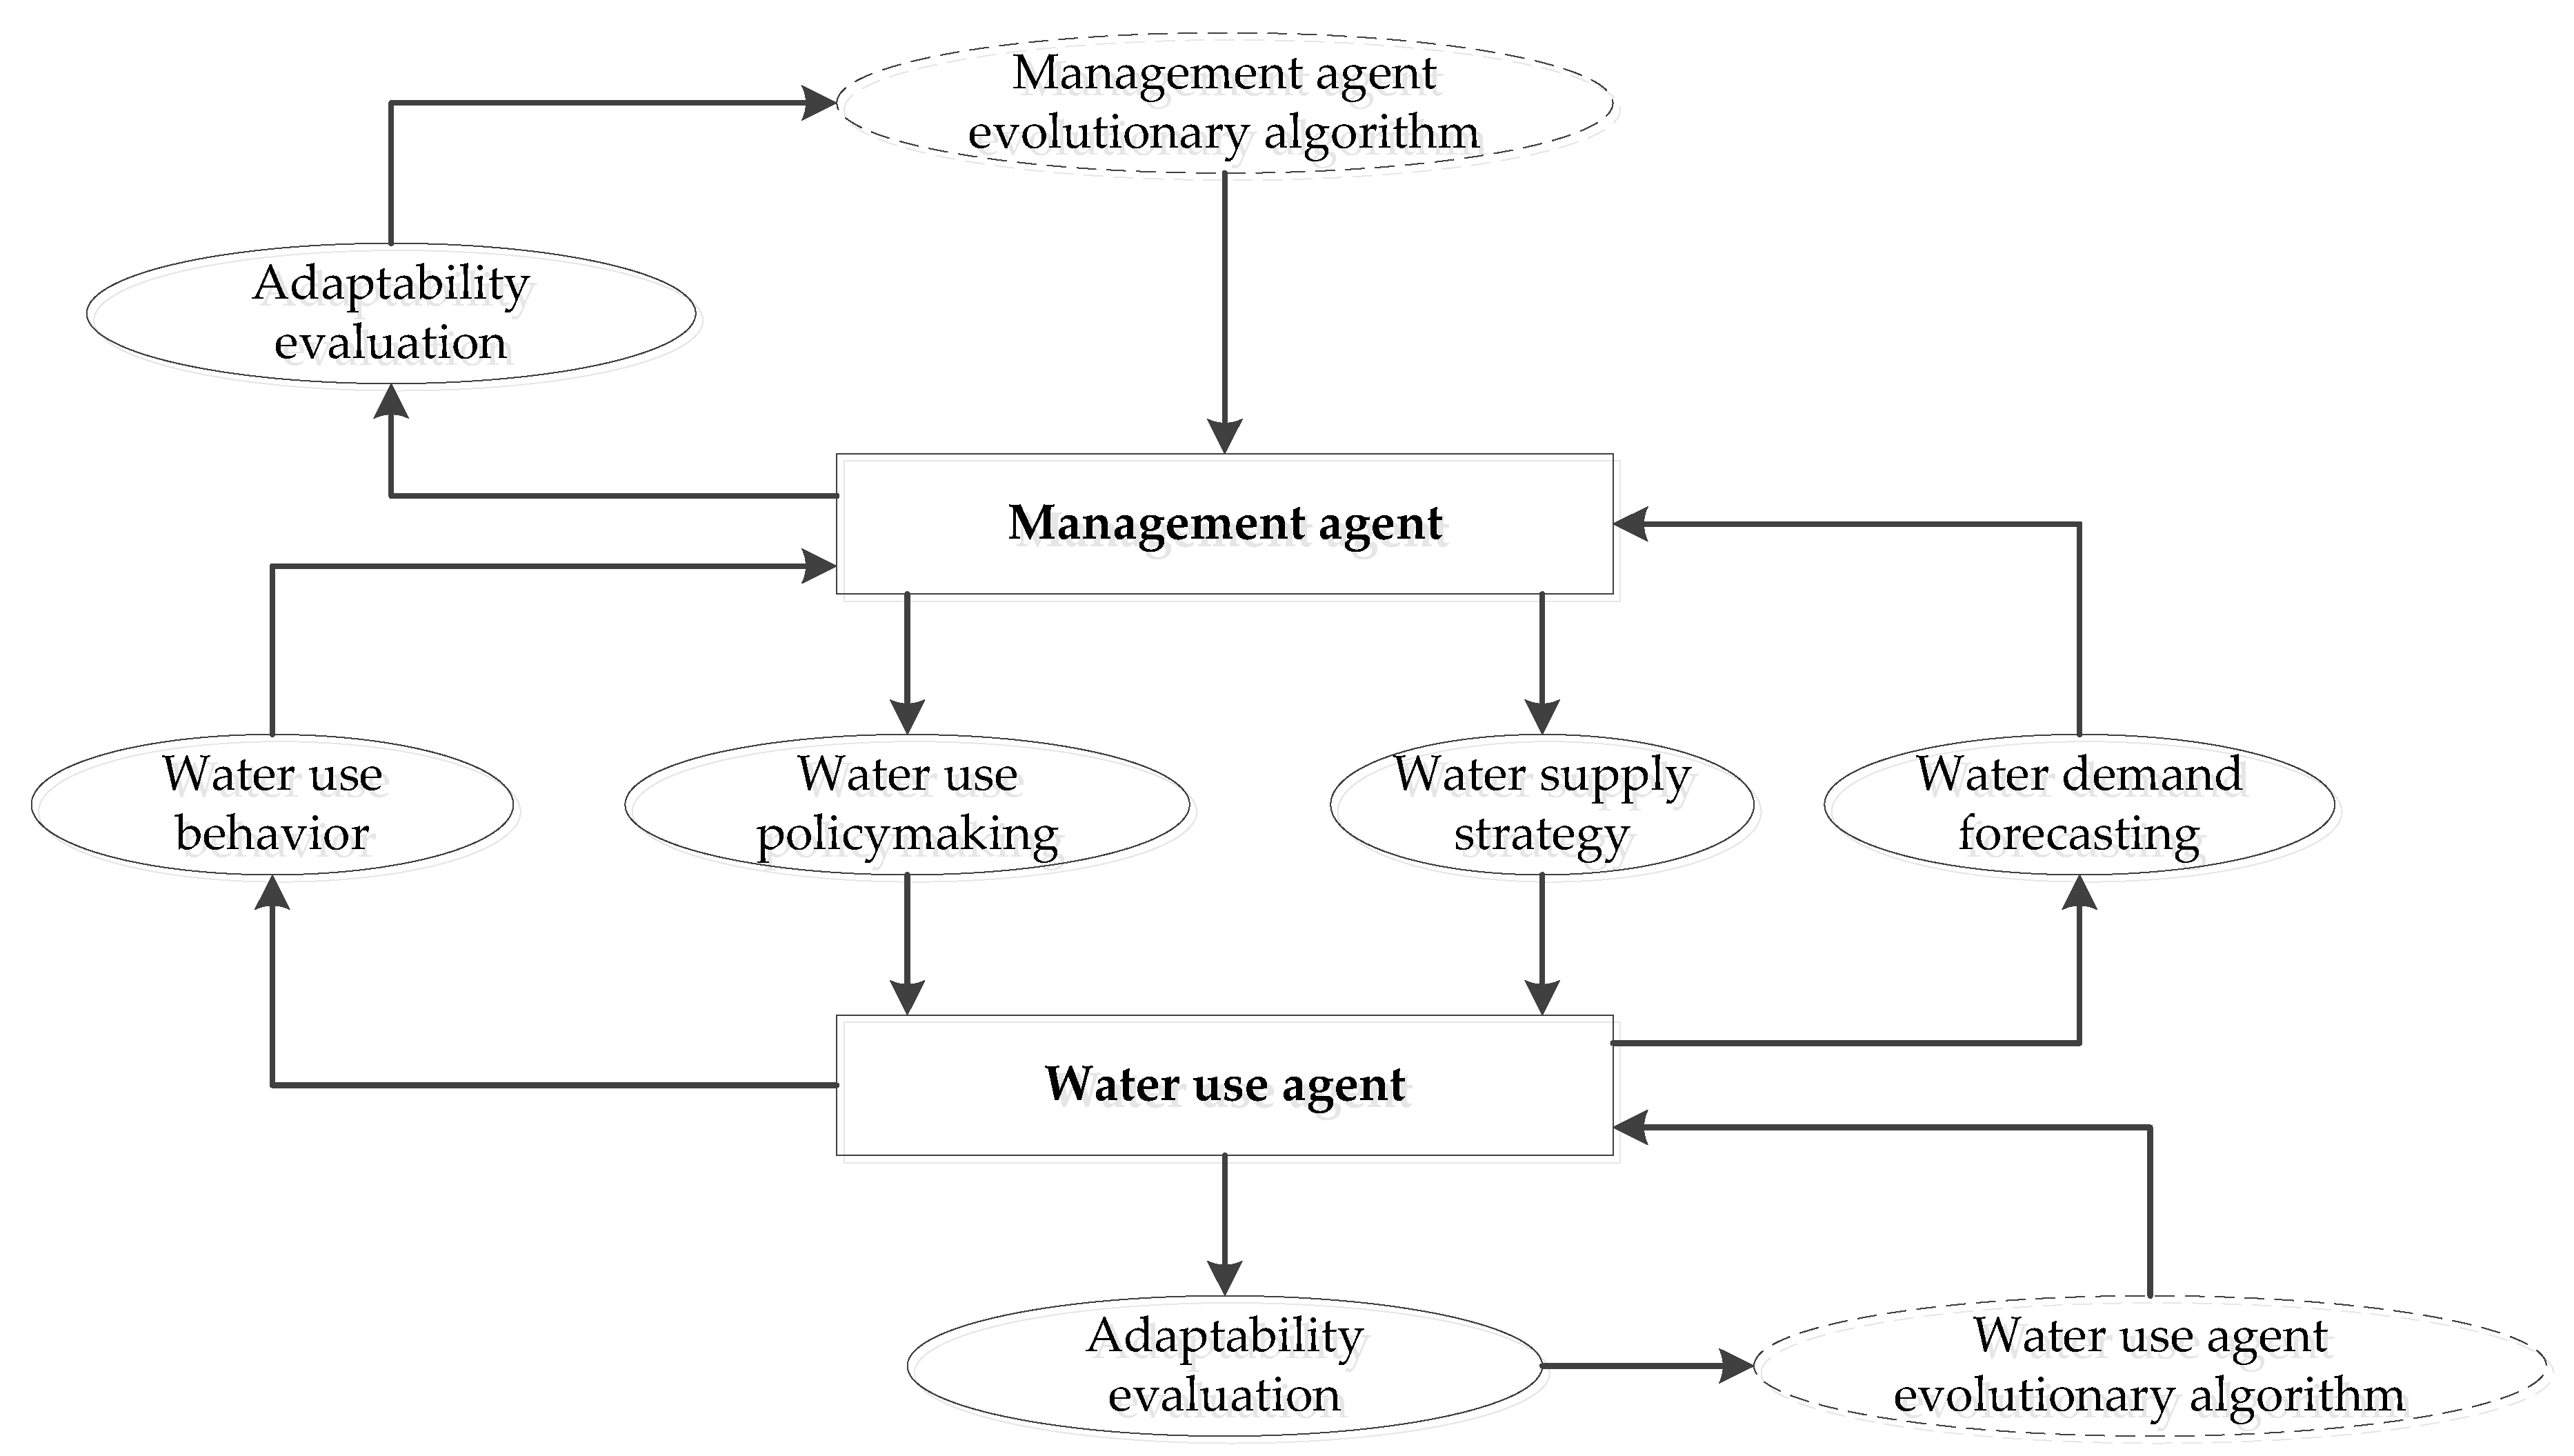
The water resources system of the irrigation district can be divided into three levels. The top management agent is responsible for the overall coordination of the whole irrigation district to achieve sustainable development [34]. The management agent forms the initial water resources allocation scheme according to the social and economic development goals and ecological planning development goals [22]. The lower level of agricultural production departments, ecological departments, and water supply departments, to maximize their profits, reallocate resources within the departments under the policies and programs formulated by the management agent [12,22,35]. The bottom users are the basis of the whole irrigation district’s water resources system. According to the experience of continuous learning and accumulation, they use the allocated resources for production and evaluate benefits after production, and the evaluation results are fed back to the department agents. The department agents adjust the water use behavior through behavior decision making, and the user agents execute a new round of production. Finally, the department agents feed the water use information back to the management agent, and the management agent generates a new water resources allocation scheme [24,28,29]. Therefore, different levels of water resource systems in the irrigation district cooperate to maximize the benefits of the irrigation district. The mutual feedback mechanism of CAS in the irrigation district is shown in Figure 1.

2.2. Agent Classification and Model Framework

In traditional water resources management, multi-stage stochastic programming, uncertain programming, and interval programming models are used to solve the impact of climate change on water resource management, irrigation water resource management, and other important issues in future water resource management research [31,36]. These traditional centralized models cannot be used to solve the optimization problem of multi-agent systems. Firstly, this is because of the disaster dimension. Secondly, when all subsystems are running at the same time, it is difficult to obtain the optimal solution from the perspective of central control [7,26,30]. ABM can decompose a large-scale complex problem into several relatively simple local objective problems and assign them to multiple agents in the network. Each agent processes the local objective problem and interacts with its neighbor agents to find the global optimal solution [25].
The adaptive agents are selected based on the comprehensive analysis of the hydrologic, economic, and ecological conditions in the irrigation district [11]. According to the hierarchical structure of the water resources system, the agent of water resources management is generalized into the management agent at the system level, the agricultural production agent, and the ecology agent at the department level. There are often lower-level user agents whose internal models are described by a fixed empirical formula or who are mathematical in practical application [10].
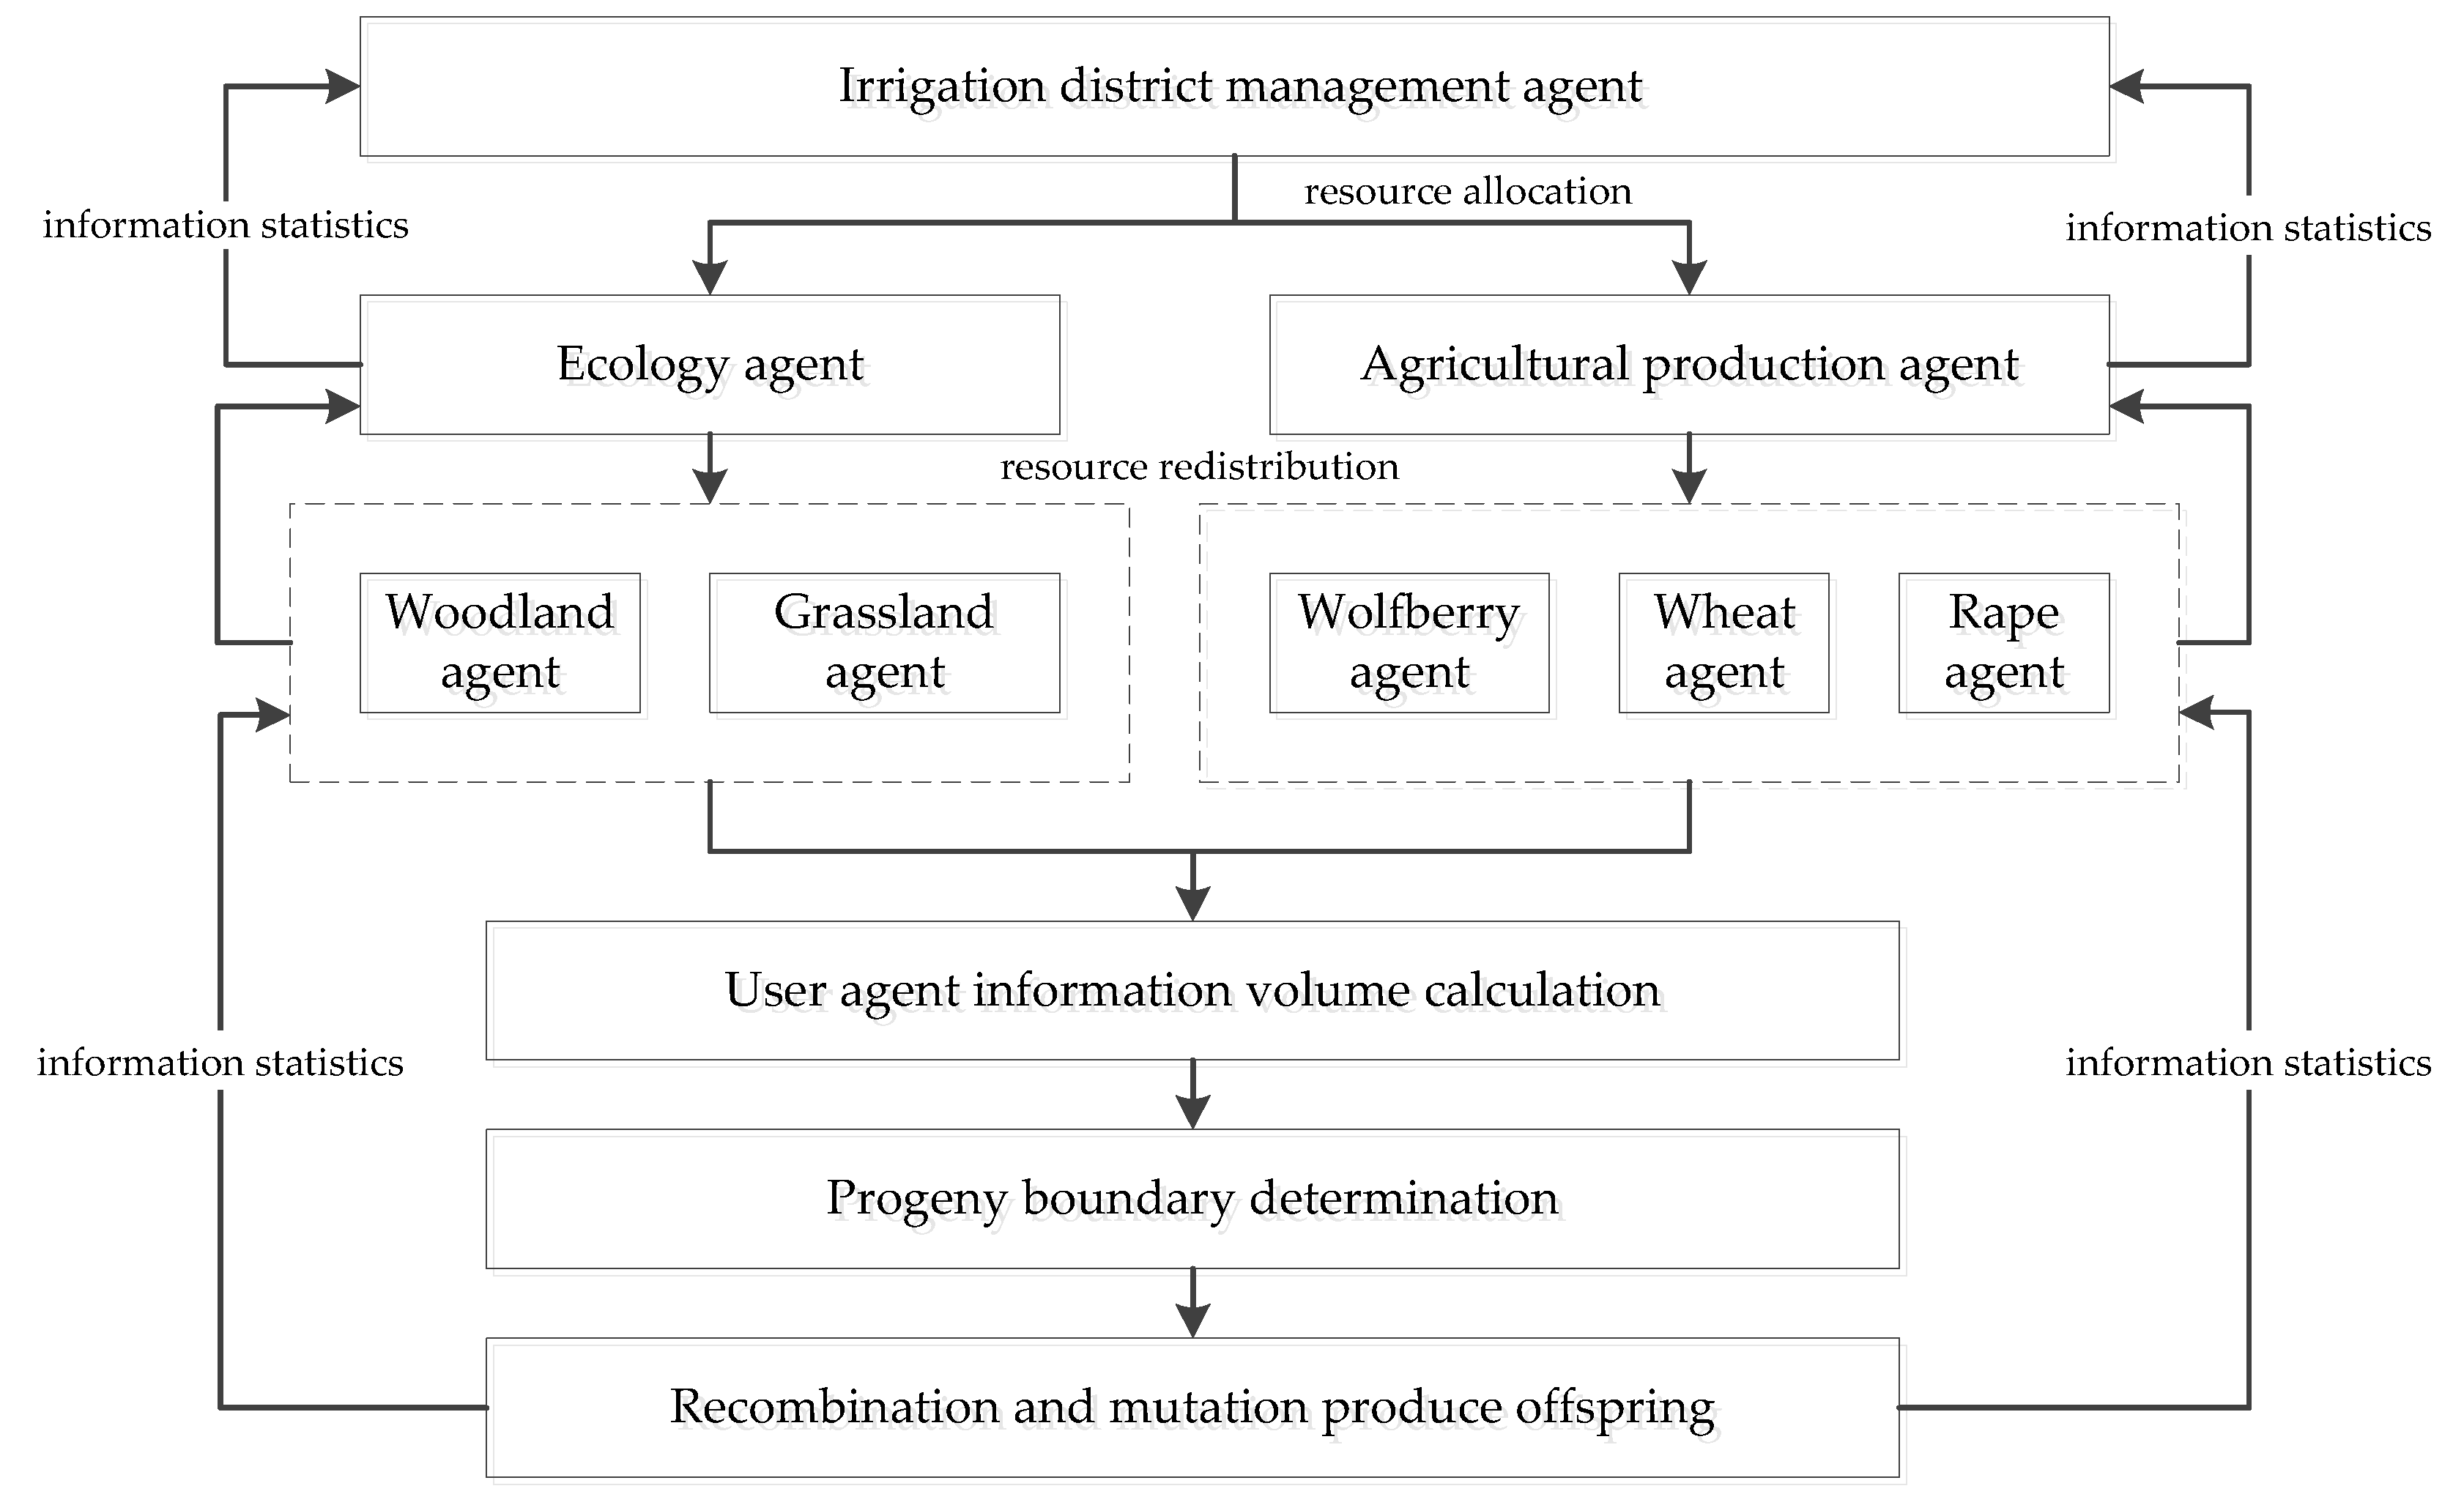
Through the analysis of the behavior goals of the selected adaptive agents, the functions of the agents are obtained, and the interaction mechanism between the agents is established. The dynamic feedback mechanism of the irrigation district water resources management model is established through the interaction between the agents [21]. The internal elements of the model include input data and output data, and the input data includes the parameter data which describe the characteristics of the agent and the variable data which are connected by the feedback relationship of other agents. The output data of the model is the performance of the adaptability of the agent [10,13]. As the input of other agents, the dynamic communication mechanism of the whole irrigation district is established to ensure the adaptive learning process of each level of the agent. The model block diagram is shown in Figure 2.

2.3. Management Agent Model

2.3.1. Water Resource Allocation System

The water resource allocation of the management agent is based on the water balance of the irrigation district [37]. Under the boundary conditions of water resources constraints, the water resource allocation mechanism of the management agent simulates the water resources circulation and allocation and realizes the allocation and scheduling of water resources in various departments [21], according to the following equation:
Q = Q s + Q G W A + W E
where   Q   is the water quantity available in the irrigation district (m3), Q s   is the surface water quantity (m3), Q G   is the available groundwater resources quantity (m3), W A , W E is water consumption of agricultural production agent and ecology agent (m3).

2.3.2. Land Management

The irrigation management department needs to determine the annual crop planting area and allocate the ecological area according to the ecological planning objective. This constraint can be expressed as:
i = 1 I a ( i , Y ) + j = 1 J a ( j , Y ) S
where a   ( i , Y ) is the area of the ecological user agent   i in the Y year (hm2); a ( j , Y ) is the planting area of the agricultural user agent   j in the Y year (hm2); S is the total area of available land in the irrigation district (hm2).

2.3.3. Ecological Management

The ecological management behavior calculates the ecological water demand satisfaction, which is calculated as:
E W D S D = {       d E W E W D L                                                                       ( E W < E W D L )     d + ( 1 d ) E W E W D L E W D U E W D L       ( E W E W D L )
where E W D S D is the satisfaction degree of ecological water demand; E W is the total ecological water resource allocated to the irrigation district (m3); E W D U and E W D L are the upper and lower limit of ecological water demand, respectively (m3); d refers to the satisfaction degree when ecological water is at the lower limit of ecological water demand (the value of d is 0.5 in this study). Ecological water consumption includes natural ecosystem water consumption and artificial ecosystem water consumption.

2.3.4. Social Statistics

The state information of the irrigation district management department needs to be obtained through social statistical behavior. Social statistical behavior collects crop yield, crop annual value, ecological water shortage, and other information to serve the government’s optimal decision-making [38].

2.3.5. Adaptability Description

In this model, the adaptability of the government is shown as the largest comprehensive benefit including agricultural benefit and ecological benefit [33]. The agricultural benefit is the result of the balance between crop yield and annual value, and the ecological benefit is the satisfaction degree of ecological water demand [39]. The functions of the benefits are as follows:
A W E L = f ( Y S , M S )
and
S W E L = f ( A W E L , E C O B )  
where Y S is the standard value of agricultural yield; M S is the standard value of agricultural annual value; A W E L stands for agricultural benefits; E C O B stands for ecological benefits; S W E L is the comprehensive benefit; and f is the utility function.

2.4. Department-Level Agent Model

2.4.1. Ecological Agent Model

The main constraints of the irrigation district include water constraints and land constraints. The constraint is expressed as:
a ( i , Y ) M E ( i , Y )
i = 1 I W E ( i , Y ) W E ( Y )
where a ( i , Y ) is the area of the ecological agent   i in the Y year (hm2); M E ( i , Y )   is the maximum area of the i in the Y year (hm2); W E ( i , Y ) is the ecological water consumption of the   i in the Y year (m3); W E ( Y ) is the maximum ecological water consumption in the   Y year (m3).
Accounting of ecological water shortage is performed according to the following equation:
E W S = D E i = 1 I W E i
where D E is the regional ecological water demand (m3), and W E i is the amount of water allocated to each ecology agent (m3).
The comprehensive index of ecological evaluation is added to describe the adaptability of the ecology agent. Model comprehensively considers the ecological factors include climate quality indicators, vegetation quality indicators, and hydrological quality indicators closely related to water resources management and land utilization [40]. Five indicators closely related to water resource utilization were selected, including precipitation in the climate index, woodland coverage and grassland area ratio of vegetation factors, water area, and the runoff of hydrological factors [2,41,42]. The weight values of each index are shown in Table 1.
The obtained data are standardized to avoid the influence of different dimensions or properties of data indicators on the accuracy of the results. The formula for standardization is as follows:
X i = X i X m i n X m a x X m i n × 100 %
where X m a x , X m i n represent the maximum value and minimum value in the data; respectively, and X i is the raw data.
The formula of the comprehensive index of ecological evaluation is as follows:
P = i = 1 n w i x i
where P is the comprehensive index of ecological evaluation, w i is the weight of the i t h factor, whose value is between (0, 1). the Activity-Based Classification is used to determine the weight value of each ecological indicator. All the factors in the index system were classified and queued according to their importance, and then different weights were given to various factors. x i is the dimensionless value of the i t h factor.

2.4.2. Agricultural Production Model Agent

The main behavior of the agricultural production agent includes redistribution of water and land allocated by irrigation management agent, forming a water supply strategy for the user-level agent, and making statistics on the actual amount of resource benefits of the user-level agent. The adaptability of the agent is the biggest agricultural benefit [14,21,29].
The model optimizes the planting area of all kinds of users according to the optimization objectives of department-level agents. The main constraints are as follows:
a ( j , Y ) T A ( j , Y )
C I A ( j , Y ) I A ( j , Y )
j = 1 J W A ( j , Y ) W A ( Y )
where a ( j , Y ) is the planting area of the agricultural user agent   j in the Y year; T A ( j , Y ) is the maximum allowable planting area of j in the Y year; C I A ( j , Y ) is the irrigation area of j in the Y year; I A ( j , Y ) is the effective irrigation area in Y year; W A ( j , Y ) is the agricultural water consumption in the Y year; W A ( Y ) is the maximum allowable water consumption for agricultural production in Y year.
The benefit statistic is the statistics of crop yield and annual value. The crop production function can be expressed as [43]:
Y j = a ( W I + P A ) 2 + b ( W I + P A ) + c
where Y j is the yield of each crop; W I is the irrigation water quantity; P A is the effective precipitation; a, b, and c are coefficients, which are determined by the research data of the irrigation district [1,44].
P A = P E T
E T = K c × E T 0
where P is the precipitation in the crop growth period;   E T is the evaporative capacity of the irrigation district.   K c is the crop water consumption coefficient; E T 0 is calculated by FAO Penman–Monteith equation. The calculation formula is as follows:
E T 0 = 0.408 Δ ( R n G ) + 900 γ u 2 ( e s   - e a ) T + 273 Δ + γ ( 1 + 0.34 U 2 )
where E T 0 is the reference crop evapotranspiration (mm day−1); T is the average temperature (°C) at the height of 2 m; u 2 is the wind speed at a height of 2 m (m s−1); Δ is the slope of the vapor pressure curve (kPA °C−1); R n is the net radiation at the crop surface (MJ m−2 day−1); G is the soil heat-flux density (MJ m−2 day−1); e s is the saturation vapor pressure (kPA).   e a is the actual vapor pressure (kPA); γ is the psychrometric constant (kPA °C−1).
The total crop yield can be calculated as follows:
Y = y j · s j
where Y is the total crop yield (kg); y j is the yield per unit area of the jth crop (kg hm−2); s j is the planting area of the j t h crop (hm2).
X A ( Y ) = Y A ( Y ) P A · W I ( Y )
X A ( Y ) is the agricultural income in Y year (yuan); Y A ( Y ) is the agricultural annual value in Y year (yuan); P A is the price of irrigation water; W I ( Y ) is the water consumption in Y year (yuan).

3. Model Solving

3.1. Model Algorithm

Aiming at the ABM of water resources management in the irrigation district, the improved evolutionary theory based on non-dominated sorting genetic algorithm II is used to establish the learning model of the agent. The genetic algorithm, which has self-organizing and self-adaptive characteristics, can be used to simulate and solve the intelligence of agents, the intelligence including self-organizing, self-adapting, and self-learning [28].
Because the model is based on the framework of agent and hierarchy, different levels of the model can be combined with the corresponding genetic algorithm to form a nested solution to the whole model. An independent genetic algorithm is used to solve the problem of the department-level agent, and the optimization results are used as the input of the genetic algorithm of the management agent, which provides support for the individual fitness evaluation of the genetic algorithm at the highest level of the model [10].

3.2. Model Operation Rules

Through sorting and inputting the basic data, the management agent allocates the initial water quantity and area to the agricultural production agent and the ecology agent. The department-level agent redistributes resources within the department. After the bottom user-level agents produce according to their behavior, they feed the results back to the department-level agent. The department-level agent makes statistics of the feedback information and forms a new water supply strategy and land allocation schemes according to the department’s internal goals. The user-level agents carry out a new round of production, The production results are fed back to the department-level agent again until the maximum benefit is achieved within the department. The agent of each department feeds back the optimal results to the management agent. The management agent makes statistics of the feedback information and redistributes the resources of each department according to the maximization of the comprehensive benefits of the irrigation district. In this bottom-up dynamic feedback, the comprehensive benefits of the irrigation district are maximized. The learning and adaptation processes of agents are simulated by genetic algorithm.

4. Case Study

4.1. General Situation of Irrigation District

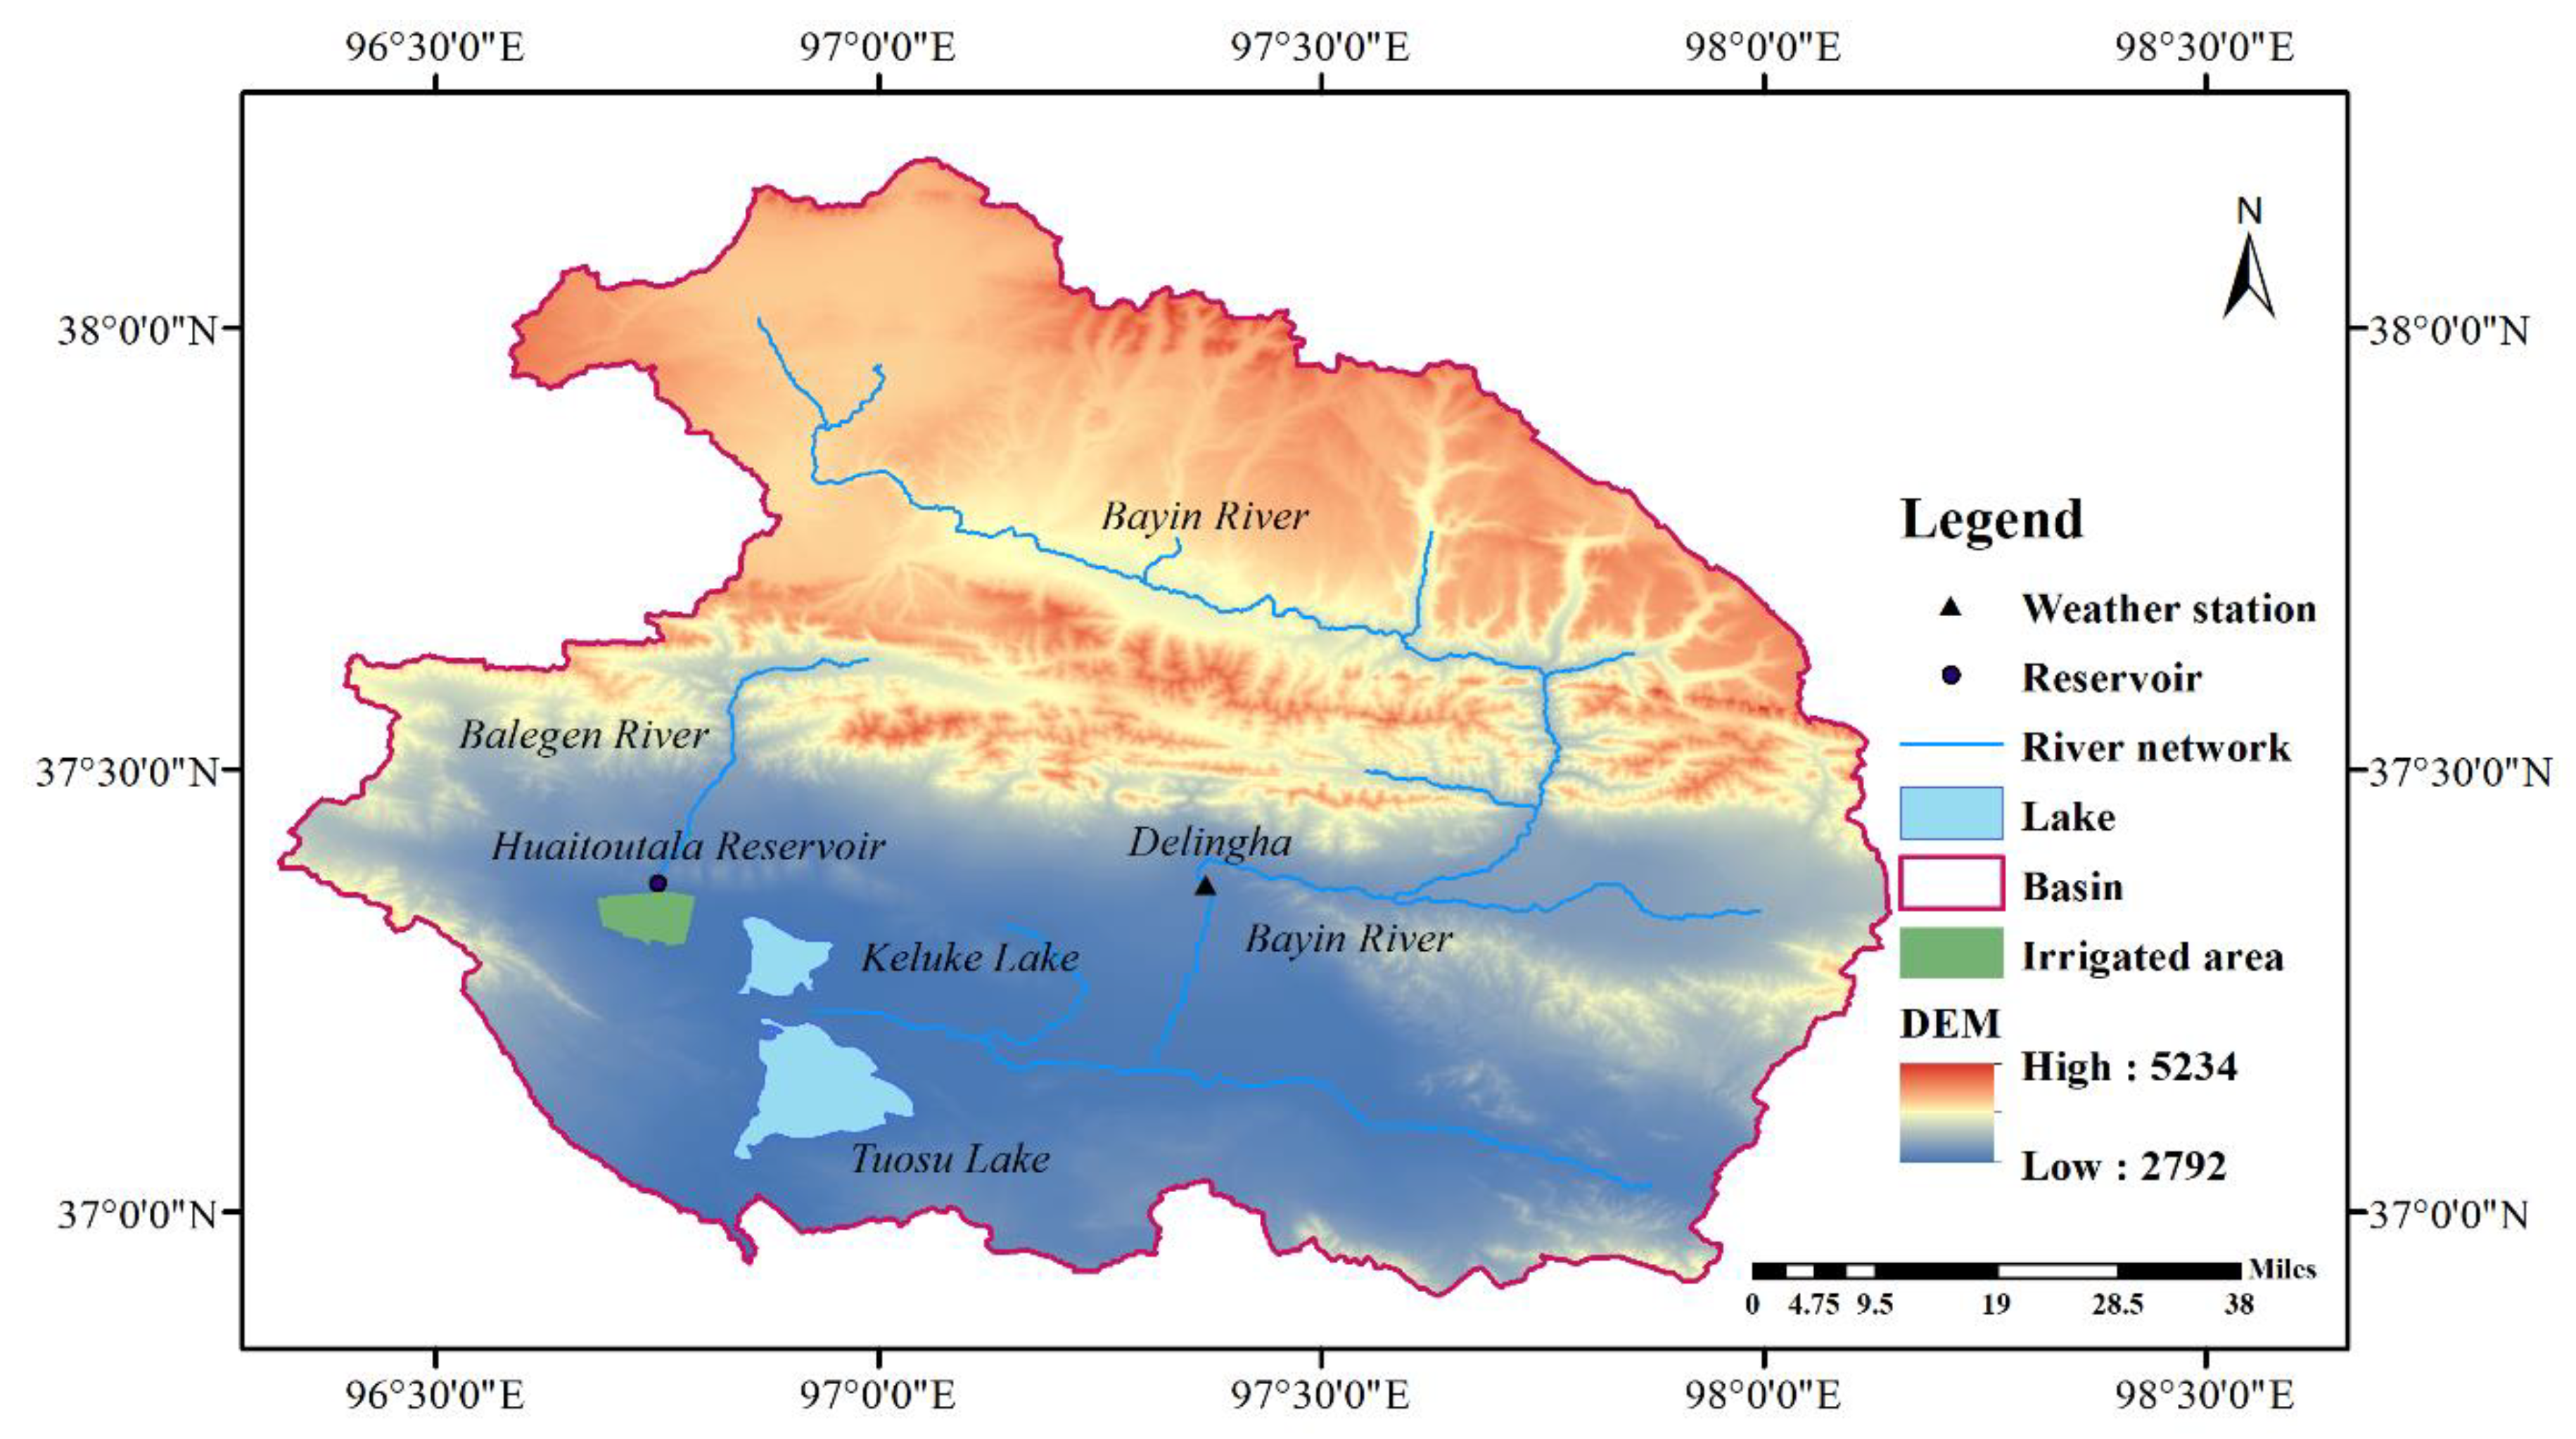
The Huaitoutala irrigation district is located in the southwest of Delingha City, Haixi Prefecture, Qinghai Province (Figure 3). Huaitoutala is a typical inland river irrigation district with little rain and large evaporation. The annual average precipitation (1956–2016) is 176.54 mm, and the proportion of precipitation in the four seasons is 18.97%, 61.5%, 14.78%, and 4.75% of the annual value, respectively. The distribution of precipitation is uneven throughout the year, mainly in spring and summer, and the evaporation is large in the irrigation district. The average annual evaporation is 2071 mm. The structure of water supply and use in the irrigation district is singular. Agriculture is the main water user in this area, and the water mainly comes from the Huaitoutala reservoir in the north of the irrigation district. The average annual water resource is 24.386 million m3 and the total annual water supply is 14.485 million m3. Wheat and rape are the main crops in the irrigation district. In recent years, the Huaitoutala irrigation district began to adjust the planting structure under the guidance of the government, planting characteristic economic crop wolfberry in the irrigation district, increasing the proportion of wolfberry planting, and exploiting groundwater for irrigation. Woodland and grassland are distributed around the irrigation district as ecological barriers. Therefore, the ecology agent of the irrigation district is generalized into the woodland agent and grassland agent; the agent of agricultural production can be generalized into wolfberry, wheat, and rape.

4.2. Boundary Condition Calibration

In this study, 25%, 50%, and 75% rainfall frequency were selected as wet year, normal year, and dry year, and the corresponding precipitation was 211.9 mm, 166.5 mm, and 129.8 mm, respectively. The data series of the Huaitoutala reservoir is short. Only data from 2009 to 2016 are available. The wet, normal, and dry years of the reservoir inflow were determined by determining the wet, normal, and dry years of precipitation. The available amount of surface water resources is the sum of the available water supply of the reservoir, and the water resources potential tapping. Furthermore, 85% of reservoir inflow was taken as irrigation water supply. The water resources increased by tapping the potential of precipitation is 10% and 15% of the average total amount of surface water resources available for many years. Combined with the construction of pumping wells in the irrigation district, the exploitable amount of groundwater is between 1 million m3 and 1.2 million m3.
According to the natural conditions, topographical conditions, and current planting structure of the irrigation district, the threshold of crop sown area was set as 50~150% of the actual area, and the threshold of ecological land occupation area was set as 100~600% of the actual area. In this study, the irrigation district should not only meet the water demand of the artificial ecosystem, but also supply water resources to the natural ecosystem. Therefore, the upper limit of ecological water demand was set as 50% of the total water diversion, and the lower limit was the water consumption of woodland and grassland irrigation. According to the Qinghai provincial local standard DB63/T 1429–2015, the quota index of agricultural and forestry water is used as the basis of water resources management. The meteorological data and precipitation data are from Delingha weather station, and the daily data time series is from 1956 to 2016. This study took the statistical data of the Huaitoutala irrigation district in 2016 as the initial data, and the initial area and water consumption of each agent are shown in Table 2.
Four different water-saving scenarios (Table 3) were set up to apply the improved irrigation technology and agronomic technology from the field scale to the irrigation district scale to form the optimal management scheme of water resources. The model solving process is shown in Figure 4.
A traditional flat no-mulching (FN) planting pattern is adopted in the irrigation district, and the present situation of irrigation is mainly flood irrigation (FI). The agronomic technologies to be popularized in the irrigation district include ridge-furrow mulching (RM) and the technology of soil magnistorge compatibilization (MC). The irrigation technologies include drip irrigation (DI) and subsurface irrigation with microporous ceramic (CI), which will also be applied to the irrigation district’s agriculture [1]. Ridge-furrow mulching can effectively reduce soil evaporation and improve soil water storage, which can provide a better hydrothermal environment for crops than flat no-mulching [1,45,46]. The technology of soil magnistorge compatibilization refers to enlarging the capacity of the soil reservoir, increasing the infiltration capacity of soil, and improving the utilization rate of rainfall through protective tillage, water and soil conservation engineering measures, and soil improvers [47]. Subsurface irrigation with microporous ceramic uses a microcellular ceramic emitter to transport irrigation water to crop root zone soil at a certain depth underground; it can reduce soil evaporation and effectively improve irrigation water use efficiency [48,49].

4.3. Results and Discussion

4.3.1. Water Utilization Behavior of Agents

The construction of the model takes the agent as the basic unit, while the users in the system have different ways of utilizing resources. The interaction between these ways emerges as the behavioral characteristics of higher-level sectoral water–land resources utilization. For example, the agricultural production agent seeks the maximum comprehensive benefit of agriculture, i.e., the maximum yield and output value. The interaction between resource behaviors at the departmental level emerges as the behavioral characteristics of higher-level management departments. The management agent seeks the maximum benefits, which include both the maximum of agricultural comprehensive benefits and the maximum of ecological benefits.
The self-organizing process of agent requires different water users to select appropriate water consumption and cooperate with other agents to seek the maximum benefit under the restriction of system setting rules. In this study, the agricultural production agent and the ecological agent firstly allocated resources between the departments and then fed the water use information and benefit value back to the management agent. The management agent balanced the benefits of agricultural and ecological departments to redistribute water resources. Different departments also worked together to increase or decrease water consumption to achieve the optimal target.
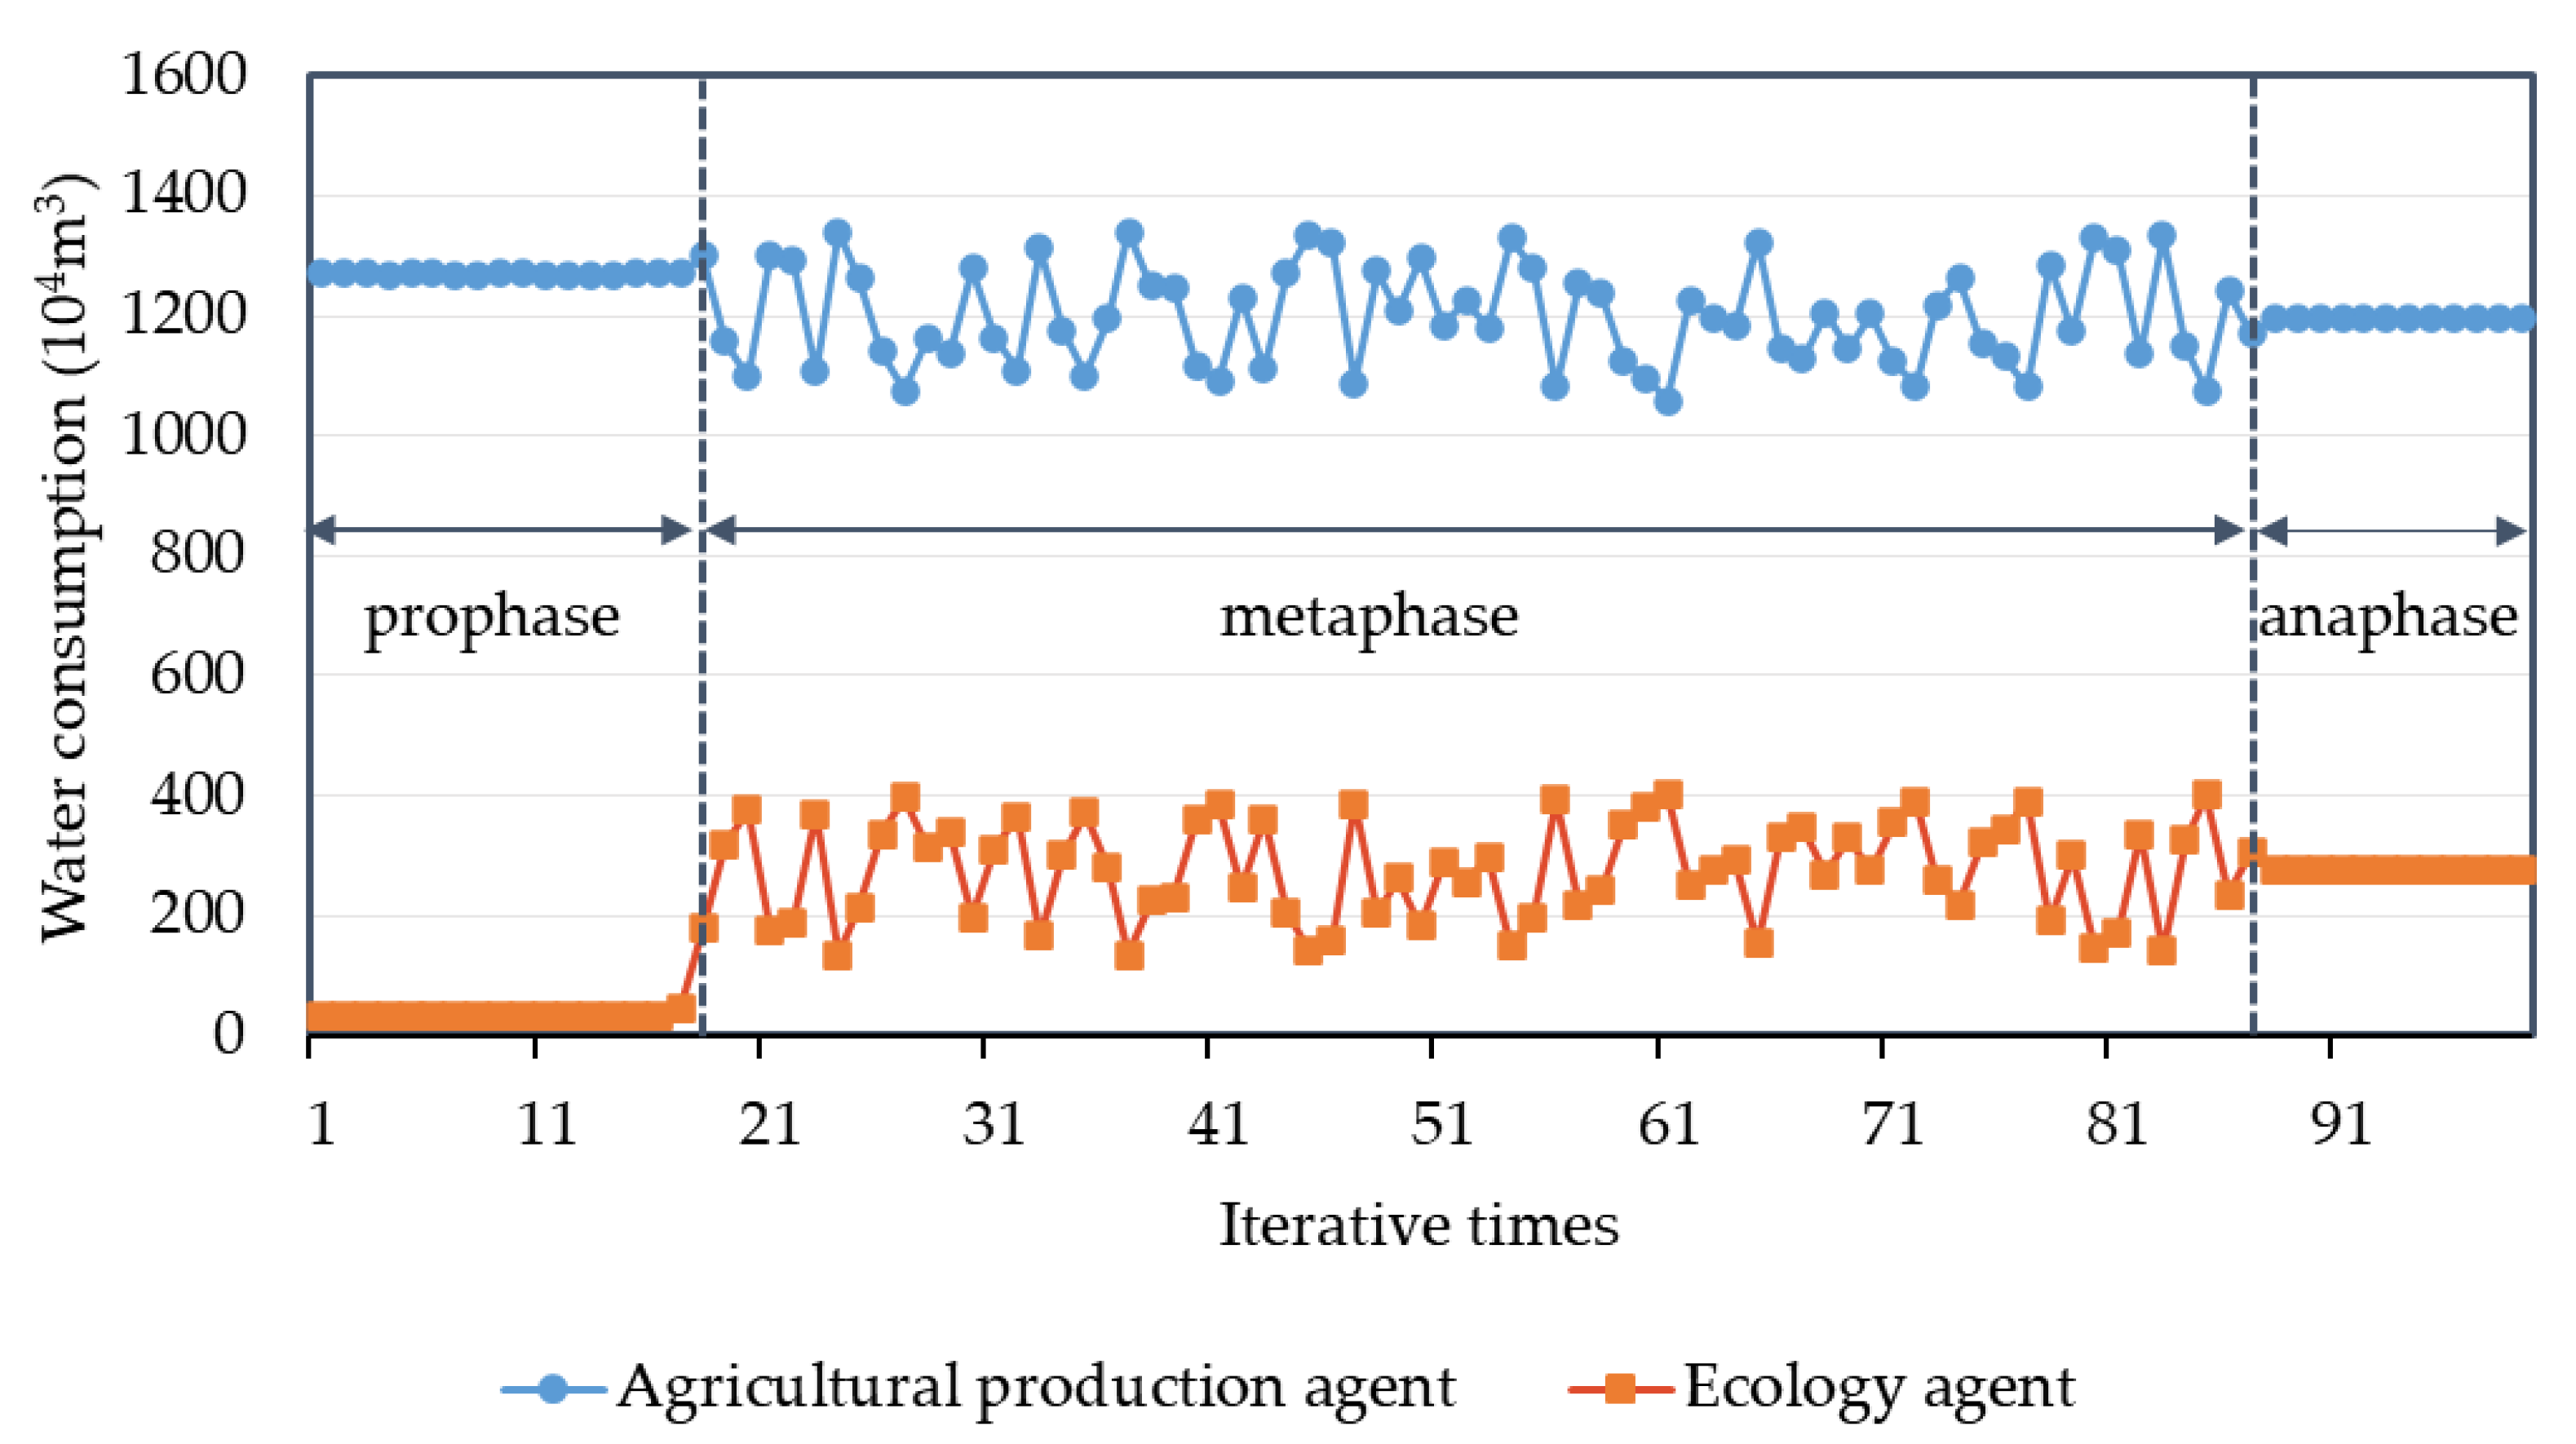
Taking scenario 4 in wet year (10% potential tapping) as an example, as shown in Figure 5, the adaptation process of the agent can be divided into three stages: the trial period in prophase, the adaptation stage in metaphase, and the stability stage in anaphase. In prophase, each department agent seeks the optimal value of the target according to the initial water allocation, modifies the behavior rules, and recognizes the external environment. The water consumption is relatively stable in prophase, and the water consumption of the agricultural production agent is much greater than that of the ecology agent. This is because when the competition between agents is not considered, the benefit value of agricultural water use is more significant than that of ecological water use, and the agricultural production agent will be given priority in the water supply. In metaphase, the interaction between the agents is deepening, and the mutual transformation of water resources is frequent. The agents constantly change their water consumption to adapt to the environment through cooperation and competition. With the development of the model evolution process, the interaction between the adaptive agents tends to be stable, and water resources allocation also enters the late stage of stable development. Driven by the comprehensive benefits of the irrigation district, the ecological water consumption increases, and the agricultural production water consumption reduces. Three stages are consistent with the agent adaptive evolution characteristics, which proves the applicability of the CAS theory in the allocation of water resources in irrigation districts.

4.3.2. Analysis of Water Resources Allocation Results

The irrigation district is planning to tap the potential of water resources to increase the available amount of water resources. The water consumption and comprehensive benefits of four water-saving irrigation scenarios in different characteristic years were simulated and optimized under the condition of the current water supply and 10% and 15% tapping of the potential water resources.
For the agricultural production agent, because of its high economic benefits, wolfberry occupies a large proportion of water consumption. As can be seen from Table 4, compared with scenario 1, without water resources potential tapping, the water consumption of wolfberry decreased by 12.8%, 11.2%, and 10.8% in wet, normal and dry years, respectively; when 10% of the water resources are tapped, the water consumption of wolfberry decreased by 1%, 11.5%, and 10.0% in the wet, normal, and dry years, respectively; when 15% of water resources are tapped, the water consumption of wolfberry decreased by 17.6%, 15.0% and 12.8% in the wet, normal, and dry years, respectively. Compared with scenario 1, the yield, annual value, and water use efficiency of wolfberry increased by 63.3%, 85.3%, and 108.4%, respectively.
Under the collaborative application of high-efficiency water-saving irrigation and agronomic technology, the water use efficiency of the irrigation district was significantly improved, and crop yield was significantly increased. According to Table 5, the water use efficiency of wolfberry in scenario 2 increased by 62.6% compared with that in scenario 1 when the water resources potential tapping was 10%; Scenario 3 increased by 18.9% compared with scenario 2; Scenario 4 increased by 10.7% compared with scenario 3. According to the analysis in Table 6, with the improvement of agronomic technology and the change of irrigation methods, the water consumption of the agricultural production agent gradually decreased, the total agricultural annual value steadily increased, the water allocated to the ecology agent continuously increased, and the ecological water demand satisfaction increased by 22.5% from scenario 1 to scenario 4. At the same time, it is more conducive to the sustainable development of the inland river irrigation district and the stability of the inland river and lake ecosystem.
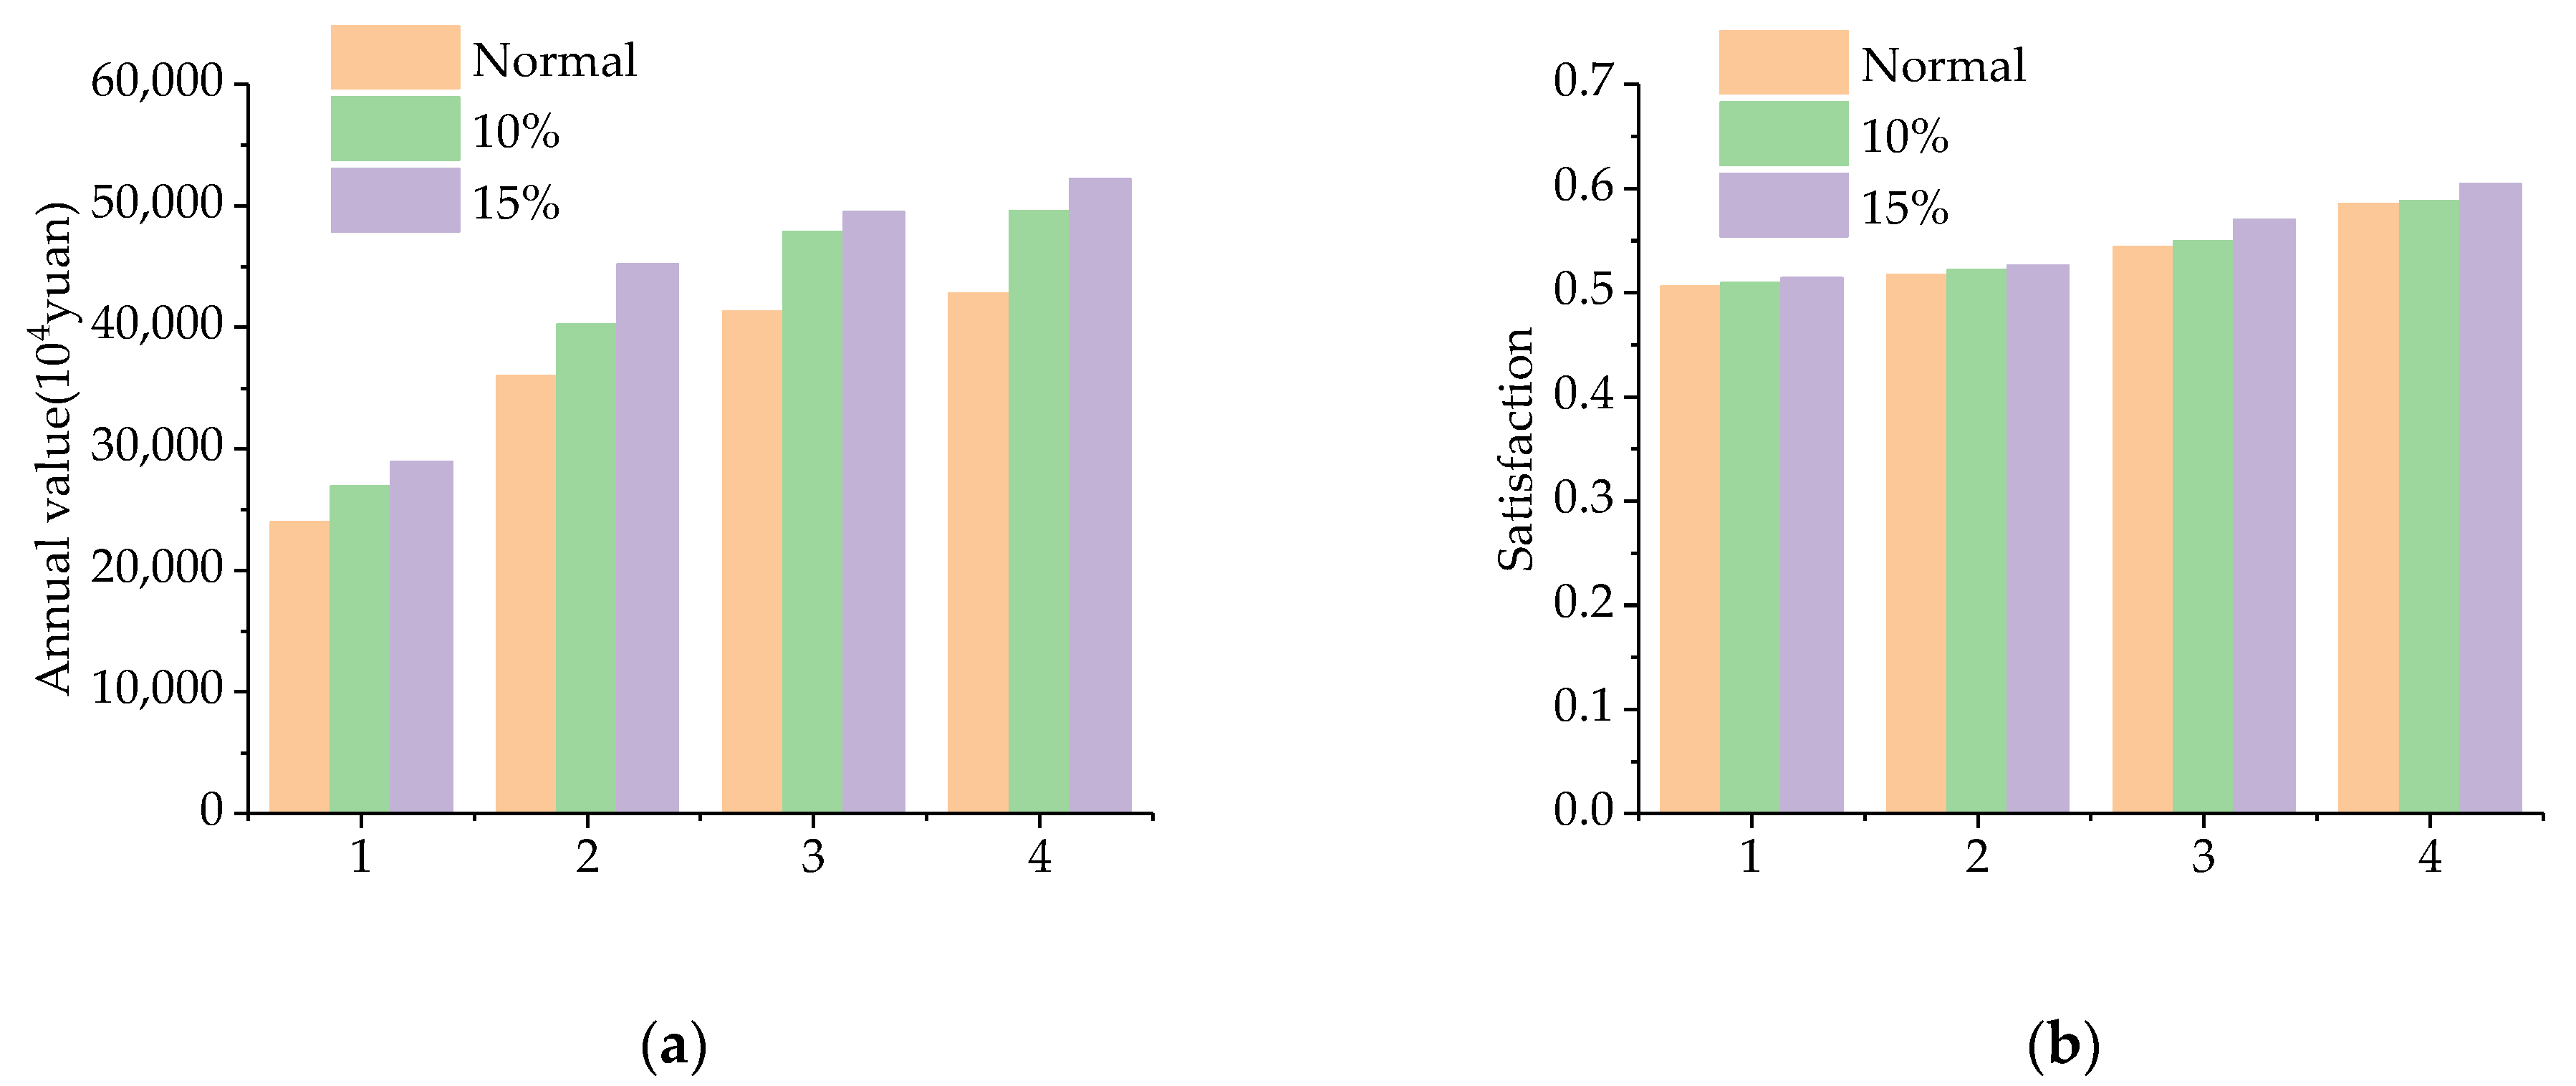
It can be seen from Figure 6 that under the four scenarios of dry year, the yield and annual value of wolfberry steadily increased and gradually stabilized, and the water consumption of wolfberry decreased significantly. Without water resources potential tapping, compared with flood irrigation and flat no-mulching, the total agricultural annual value increased by 78.6% in scenario 4 (Figure 6c). When water resources are increased by 15%, the total annual value will increase by 80.5% in scenario 4 (Figure 6d). In dry year, through the application of subsurface irrigation with microporous ceramic and technology of soil magnistorge compatibilization, the irrigation district can still maintain stability and achieve higher economic and ecological benefits. When water resources are increased by 15% in the dry year, the ecological water use in the irrigation district is increased from 6% in scenario 1 to 16% in scenario 4 (Figure 7d), which indicates that the water resource potential tapping has a significant role in relieving the pressure of groundwater exploitation and maintaining the sustainable development of the irrigation district. Figure 7 shows the water consumption of each agent under four scenarios. It can be seen that, with the improvement of agronomic technique and irrigation technique, the total annual value has increased significantly and has the trend to be smooth (Figure 8a), while the ecological satisfaction still has a potential for a lasting increase (Figure 8b). It shows that, with the increase of available water resources and the improvement of water resource utilization efficiency, the economic benefits will gradually become stable, and the ecological benefits of the irrigation district will be steadily improved. More water resources can be used in the ecological protection of the source area.

5. Conclusions

Based on the theory of CAS, this paper described the internal model and adaptability of each agent, analyzed the interaction and feedback mechanism between each agent in detail, and used the multi-objective method to evaluate the state of the system. In Huaitoutala irrigation district, runoff flows into the downstream lake through dissipation. The uncontrolled increase of agricultural irrigation water will directly lead to the lake shrinking and drying up. The ecological balance of the irrigation district can be maintained by increasing ecological water demand and increasing water supply to rivers, lakes, and other ecological users. In the study of ecological water demand, without considering the social and economic benefits, the results are usually not accepted by other stakeholders and are difficult to be applied in the actual water resources management. Therefore, comprehensive consideration of agricultural water demand and ecological water demand becomes a reliable way to manage water resources. By coupling water resources potential tapping with irrigation and agronomic techniques, the agent-based irrigation water resources management model was constructed and optimized. In the dry year without water resources potential tapping, the total agricultural annual value increased by 78.6%, and the satisfaction degree of ecological water demand increased by 15.6%. When water resources are increased by 15%, the total annual value can be increased by 80.5%, and the satisfaction degree of ecological water demand can be increased by 17.5%, which is more conducive to the sustainable development of inland river irrigation district and the stability of the upstream and downstream inland river lake ecosystem. The model has been applied to water resources management in irrigation district, and it has good application prospects in the detection of sustainable development.

Author Contributions

Conceptualization, S.M.; methodology, H.X.; formal analysis, H.X.; data curation, H.X.; supervision, S.M.; project administration, S.M.; writing—original draft preparation, H.X.; writing—review and editing, H.X., X.L. and Y.L. All authors have read and agreed to the published version of the manuscript.

Funding

This research was funded by the National Key Research and Development Program of China, grant number 2017YFC0403605 and the National Natural Science Foundation of China, grant number 51679185.

Institutional Review Board Statement

Not applicable.

Informed Consent Statement

Not applicable.

Data Availability Statement

The data presented in this study are available on request from the corresponding author.

Acknowledgments

We would like to express our sincere thanks to the participants who provided us with valuable advice during the data processing.

Conflicts of Interest

The authors declare no conflict of interest.

References

  1. Jiaxin, W.; Xiaodong, G.; Yanqing, Z.; Pute, W.; Xining, Z. Impact of conservation practices on soil hydrothermal properties and crop water use efficiency in a dry agricultural region of the tibetan plateau. Soil Tillage Res. 2020, 200, 104619. [Google Scholar]
  2. Xia, J.; Lu, Z.; Liu, C.; Yu, J. Towards better water security in North China. Water Resour. Manag. 2007, 21, 233–247. [Google Scholar] [CrossRef]
  3. Zhang, M.; Shuai, W.; Fu, B.; Gao, G.; Qin, S. Ecological effects and potential risks of the water diversion project in the Heihe River Basin. Sci. Total Environ. 2017, 619–620, 794–803. [Google Scholar] [CrossRef] [PubMed]
  4. Sophocleous, M. From safe yield to sustainable development of water resources—The Kansas experience. J. Hydrol. 2000, 235, 27–43. [Google Scholar] [CrossRef]
  5. Holland, J.H. Studying Complex Adaptive Systems. J. Syst. Sci. Complex. 2006, 19, 1–8. [Google Scholar] [CrossRef]
  6. Grayson, R.B.; Doolan, J.M.; Blake, T. Application of AEAM (Adaptive Environmental Assessment and Management) to Water Quality in the Latrobe River Catchment. J. Environ. Manag. 1994, 41, 245–258. [Google Scholar] [CrossRef]
  7. Georgakakos, A.P.; Yao, H.; Kistenmacher, M.; Georgakakos, K.P.; Graham, N.E.; Cheng, F.-Y.; Spencer, C.; Shamir, E. Value of adaptive water resources management in Northern California under climatic variability and change: Reservoir management. J. Hydrol. 2011, 412, 34–46. [Google Scholar] [CrossRef]
  8. Rammel, C.; Stagl, S.; Wilfing, H. Managing complex adaptive systems—A co-evolutionary perspective on natural resource management. Ecol. Econ. 2006, 63, 9–21. [Google Scholar] [CrossRef]
  9. Meek, J.W.; Marshall, K.S. Cultivating resiliency through system shock: The Southern California metropolitan water management system as a complex adaptive system. Public Manag. Rev. 2018, 20, 1088–1104. [Google Scholar] [CrossRef]
  10. Zhao, J.; Wang, Z.; Weng, W. Study on the holistic model for water resources system. Sci. China Ser. E 2004, 47, 72–89. [Google Scholar] [CrossRef]
  11. Akhbari, M.; Grigg, N.S. A Framework for an Agent-Based Model to Manage Water Resources Conflicts. Water Resour. Manag. 2013, 27, 4039–4052. [Google Scholar] [CrossRef]
  12. Mialhe, F.; Becu, N.; Gunnell, Y. An agent-based model for analyzing land use dynamics in response to farmer behaviour and environmental change in the Pampanga delta (Philippines). Agric. Ecosyst. Environ. 2012, 161, 55–69. [Google Scholar] [CrossRef]
  13. Vervoort, J.M.; Thornton, P.K.; Kristjanson, P.; Förch, W.; Ericksen, P.J.; Kok, K.; Ingram, J.S.I.; Herrero, M.; Palazzo, A.; Helfgott, A.E.S.; et al. Challenges to scenario-guided adaptive action on food security under climate change. Glob. Environ. Chang. Hum. Policy Dimens. 2014, 28, 383–394. [Google Scholar] [CrossRef] [Green Version]
  14. Arnold, R.T.; Troost, C.; Berger, T. Quantifying the economic importance of irrigation water reuse in a C hilean watershed using an integrated agent-based model. Water Resour. Res. 2015, 51, 648–668. [Google Scholar] [CrossRef]
  15. Zhang, H.; Ren, Q.; Li, J. How to Improve Water Resources Allocation Efficiency: A Two-Stage Performance-Based Allocation Mechanism. Sustainability 2019, 11, 6021. [Google Scholar] [CrossRef] [Green Version]
  16. Liu, H.; Zhao, Y.; Li, H.; Wang, L.; Wang, Q. Individual Water-Saving Response Based on Complex Adaptive System Theory: Case Study of Beijing City, China. Water 2020, 12, 1478. [Google Scholar] [CrossRef]
  17. Castilla-Rho, J.C.; Mariethoz, G.; Rojas, R.; Andersen, M.S.; Kelly, B.F.J. An agent-based platform for simulating complex human-aquifer interactions in managed groundwater systems. Environ. Modell. Softw. 2015, 73, 305–323. [Google Scholar] [CrossRef]
  18. Borgomeo, E.; Hall, J.W.; Salehin, M. Avoiding the water-poverty trap: Insights from a conceptual human-water dynamical model for coastal Bangladesh. Int. J. Water Resour. Dev. 2018, 34, 900–922. [Google Scholar] [CrossRef]
  19. Srinivasan, V.; Lambin, E.F.; Gorelick, S.M.; Thompson, B.H.; Rozelle, S. The nature and causes of the global water crisis: Syndromes from a meta-analysis of coupled human-water studies. Water Resour. Res. 2012, 48, W10516. [Google Scholar] [CrossRef]
  20. Doran, J. Intervening to Achieve Co-Operative Ecosystem Management: Towards an Agent Based Model. JASSS 2001, 4, 4. [Google Scholar]
  21. Anthony, P.; Birendra, K. Improving irrigation water management using agent technology. N. Z. J. Agric. Res. 2018, 61, 425–439. [Google Scholar] [CrossRef]
  22. Darbandsari, P.; Kerachian, R.; Malakpour-Estalaki, S. An Agent-based Behavioral Simulation Model for Residential Water Demand Management: A Case-Study of the Tehran City. Simul. Model. Pract. Theory 2017, 78, 51–72. [Google Scholar] [CrossRef]
  23. Lin, Z.; Lim, S.H.; Lin, T.; Borders, M. Using Agent-Based Modeling for Water Resources Management in the Bakken Region. J. Water Resour. Plan. Manag. ASCE 2020, 146, 05019020. [Google Scholar] [CrossRef]
  24. Ng, T.L.; Eheart, J.W.; Cai, X.; Braden, J.B. An agent-based model of farmer decision-making and water quality impacts at the watershed scale under markets for carbon allowances and a second-generation biofuel crop. Water Resour. Res. 2011, 47, 113–120. [Google Scholar] [CrossRef]
  25. Yang, Y.C.E.; Cai, X.; Stipanovic, D.M. A Decentralized Optimization Algorithm for Multi-Agent System Based Watershed Management. Water Resour. Res. 2009, 45, 8430. [Google Scholar] [CrossRef]
  26. Dehghanipour, A.H.; Schoups, G.; Zahabiyoun, B.; Babazadeh, H. Meeting agricultural and environmental water demand in endorheic irrigated river basins: A simulation-optimization approach applied to the Urmia Lake basin in Iran. Agric. Water Manag. 2020, 241, 106353. [Google Scholar] [CrossRef]
  27. Adu, M.O.; Yawson, D.O.; Abano, E.E.; Asare, P.A.; Opoku, E.K. Does water-saving irrigation improve the quality of fruits and vegetables? Evidence from meta-analysis. Irrig. Sci. 2019, 37, 669–690. [Google Scholar] [CrossRef]
  28. Nouri, A.; Saghafian, B.; Delavar, M.; Bazargan-Lari, M.R. Agent-Based Modeling for Evaluation of Crop Pattern and Water Management Policies. Water Resour. Manag. 2019, 33, 3707–3720. [Google Scholar] [CrossRef]
  29. Ghazali, M.; Honar, T.; Nikoo, M.R. A hybrid TOPSIS-agent-based framework for reducing the water demand requested by stakeholders with considering the agents’ characteristics and optimization of cropping pattern. Agric. Water Manag. 2018, 199, 71–85. [Google Scholar] [CrossRef]
  30. Charizopoulos, N.; Zagana, E.; Psilovikos, A. Assessment of natural and anthropogenic impacts in groundwater, utilizing multivariate statistical analysis and inverse distance weighted interpolation modeling: The case of a Scopia basin (Central Greece). Environ. Earth Sci. 2018, 77, 380. [Google Scholar] [CrossRef]
  31. Psilovikos, A.; Tzimopoulos, C. Comparison of quadratic and non-linear programming (QP and NLP) optimization models in groundwater management. J. Hydroinform. 2004, 6, 175–185. [Google Scholar] [CrossRef] [Green Version]
  32. Pham, L.T.; Otto, I.M.; Zikos, D. Self-Governance and the Effects of Rules in Irrigation Systems: Evidence from Laboratory and Framed Field Experiments in China, India and Vietnam. Water Econ. Policy 2019, 5, 1850009. [Google Scholar] [CrossRef] [Green Version]
  33. Aljanabi, A.; Mays, L.; Fox, P. Optimization Model for Agricultural Reclaimed Water Allocation Using Mixed-Integer Nonlinear Programming. Water 2018, 10, 1291. [Google Scholar] [CrossRef] [Green Version]
  34. Kim, D.; Kaluarachchi, J.J. A risk-based hydro-economic analysis for land and water management in water deficit and salinity affected farming regions. Agric. Water Manag. 2016, 166, 111–122. [Google Scholar] [CrossRef]
  35. Al-Amin, S.; Berglund, E.Z.; Mahinthakumar, G.; Larson, K.L. Assessing the effects of water restrictions on socio-hydrologic resilience for shared groundwater systems. J. Hydrol. 2018, 566, 872–885. [Google Scholar] [CrossRef]
  36. Archibald, T.W.; Marshall, S.E. Review of Mathematical Programming Applications in Water Resource Management Under Uncertainty. Environ. Model. Softw. 2018, 23, 753–777. [Google Scholar] [CrossRef] [Green Version]
  37. Zhang, Y.F.; Li, Y.P.; Sun, J.; Huang, G.H. Optimizing water resources allocation and soil salinity control for supporting agricultural and environmental sustainable development in Central Asia. Sci. Total Environ. 2020, 704, 135281. [Google Scholar] [CrossRef] [PubMed]
  38. Bekchanov, M.; Lamers, J. Economic costs of reduced irrigation water availability in Uzbekistan (Central Asia). Reg. Environ. Chang. 2016, 16, 2369–2387. [Google Scholar] [CrossRef]
  39. Gomiero, T.; Pimentel, D.; Paoletti, M.G. Is There a Need for a More Sustainable Agriculture? Crit. Rev. Plant Sci. 2011, 30, 6–23. [Google Scholar] [CrossRef]
  40. Guo, J.; Xu, H.; Zhang, G.; Yuan, K.; Ling, H. The Enhanced Management of Water Resources Improves Ecosystem Services in a Typical Arid Basin. Sustainability 2020, 12, 8802. [Google Scholar] [CrossRef]
  41. Chong, J.; Zhang, L. Climate Change and Its Impact on the Eco-Environment of the Three-Rivers Headwater Region on the Tibetan Plateau, China. Int. J. Environ. Res. Public Health 2015, 12, 12057–12081. [Google Scholar]
  42. Ye, B.; Yang, D.; Zhang, Z.; Kane, D. Variation of hydrological regime with permafrost coverage over Lena Basin in Siberia. J. Geophys. Res. Atmos. 2009, 114, D07102. [Google Scholar] [CrossRef] [Green Version]
  43. García-Tejero, I.; Arriaga, J.; Durán-Zuazo, V.; Muriel-Fernández, J. Predicting crop-water production functions for long-term effects of deficit irrigation on citrus productivity (SW Spain). Arch. Agron. Soil Sci. 2013, 59, 1591–1606. [Google Scholar] [CrossRef]
  44. Surendran, U.; Sushanth, C.M.; Mammen, G.; Joseph, E.J. Modelling the Crop Water Requirement Using FAO-CROPWAT and Assessment of Water Resources for Sustainable Water Resource Management: A Case Study in Palakkad District of Humid Tropical Kerala, India. Aquat. Procedia 2015, 4, 1211–1219. [Google Scholar] [CrossRef]
  45. Daryanto, S.; Wang, L.; Jacinthe, P.A. Can ridge-furrow plastic mulching replace irrigation in dryland wheat and maize cropping systems? Agric. Water Manag. 2017, 190, 1–5. [Google Scholar] [CrossRef] [Green Version]
  46. Li, W.D. Effect of ridge–furrow and plastic-mulching planting patterns on yield formation and water movement of potato in a semi-arid area. Agric. Water Manag. 2014, 131, 87–94. [Google Scholar]
  47. Guzha, A.C. Effects of tillage on soil microrelief, surface depression storage and soil water storage. Soil Tillage Res. 2004, 76, 105–114. [Google Scholar] [CrossRef]
  48. Cai, Y.; Yao, C.; Wu, P.; Zhang, L.; Du, Y. Effectiveness of a subsurface irrigation system with ceramic emitters under low-pressure conditions. Agric. Water Manag. 2021, 243, 106390. [Google Scholar] [CrossRef]
  49. Cai, Y.; Zhao, X.; Wu, P.; Zhang, L.; Zhu, D.; Chen, J.; Lin, L. Ceramic patch type subsurface drip irrigation line: Construction and hydraulic properties. Biosyst. Eng. 2019, 182, 29–37. [Google Scholar] [CrossRef]
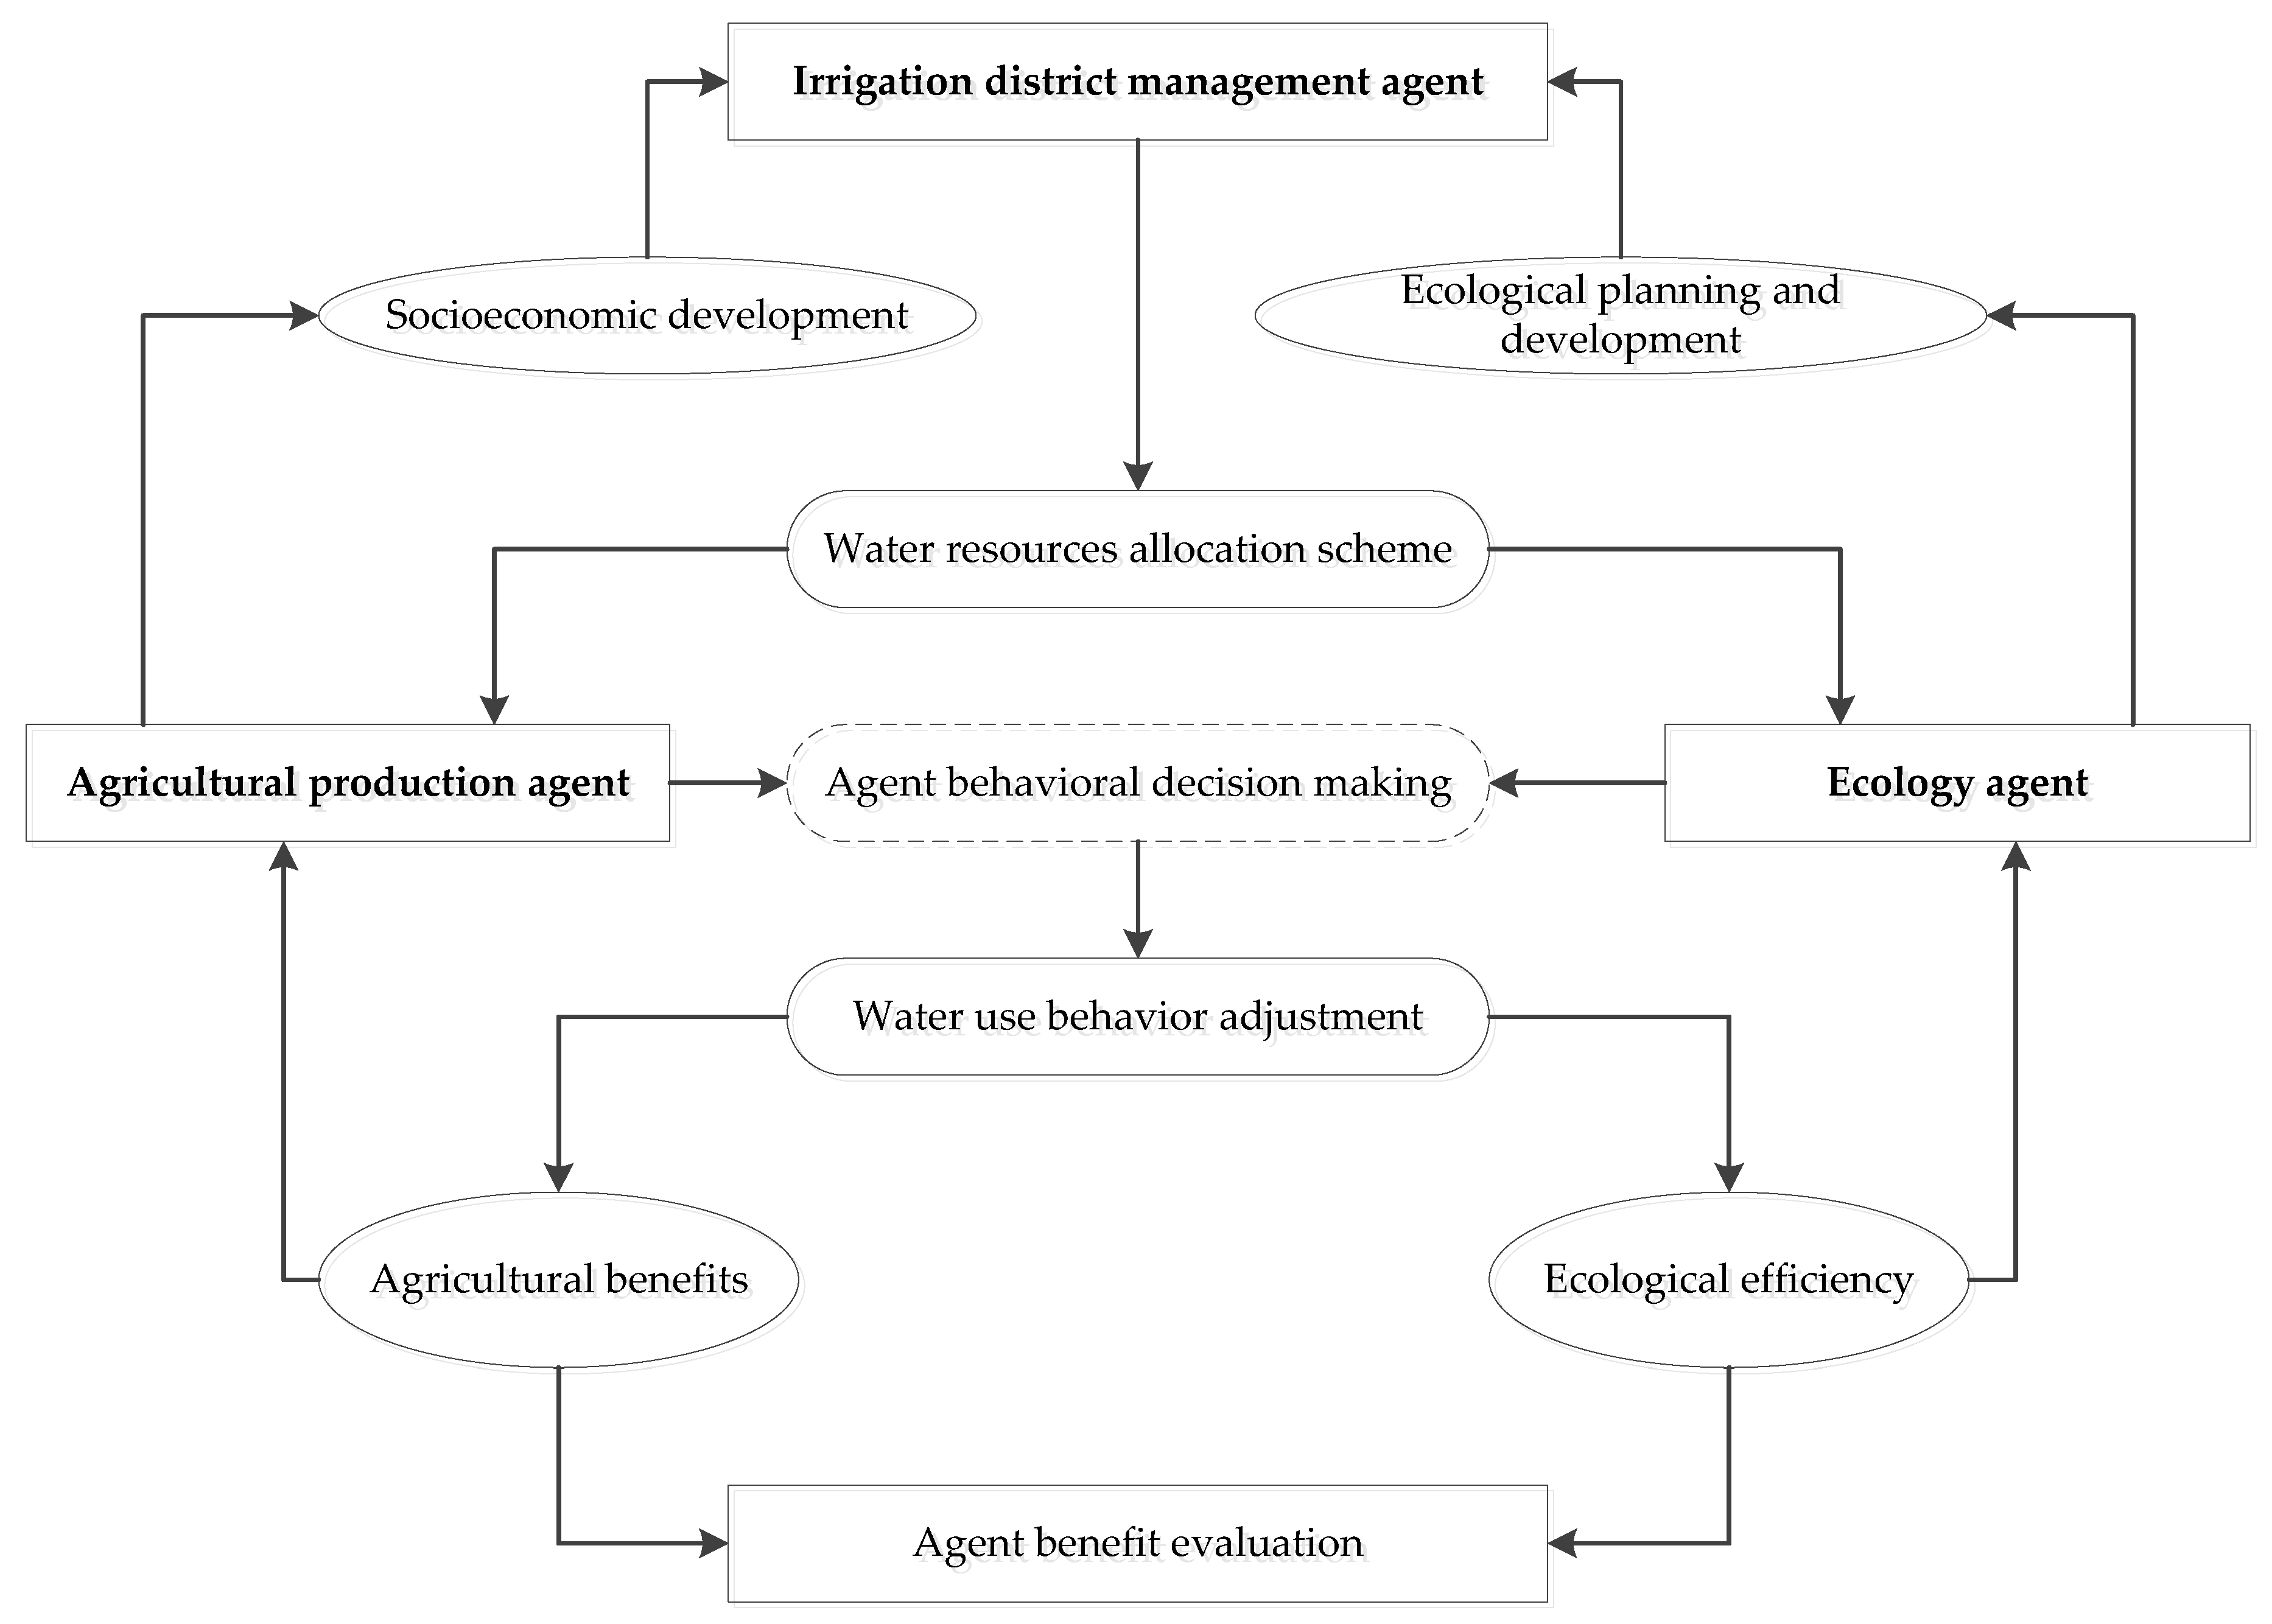
Figure 1. The mutual feedback mechanism of CAS in the irrigation district.
Sustainability 13 08437 g001
Figure 2. Frame diagram of ABM.
Sustainability 13 08437 g002
Figure 3. Location of the Huaitoutala irrigation district.
Sustainability 13 08437 g003
Figure 4. Model solving block diagram.
Sustainability 13 08437 g004
Figure 5. The evolutionary path of agent water utilization behavior in scenario IV (wet year with 10% potential tapping).
Sustainability 13 08437 g005
Figure 6. Without water resources potential tapping, wolfberry yield and water consumption in dry year (a); 15% water resources potential tapping, wolfberry yield and water consumption in dry year (b); without water resources potential tapping, water consumption of agricultural production agent and total agricultural annual value in dry year (c); 15% water resources potential tapping, water consumption of agricultural production agent and total agricultural annual value in dry year (d).
Sustainability 13 08437 g006aSustainability 13 08437 g006b
Figure 7. Water consumption of each department-level agent under four scenarios. (ad) correspond to the four scenarios, respectively.
Sustainability 13 08437 g007
Figure 8. The benefit of the irrigation district in dry year under four scenarios. The annual value of the irrigation district (a); the ecological water demand satisfaction (b).
Sustainability 13 08437 g008
Table 1. Weight of ecological indicators.
Evaluating IndicatorWeight
Precipitation (mm)0.4
Woodland coverage (%)0.2
Grassland area ratio (%)0.2
Water area ratio (%)0.1
Runoff ( 10 8   m 3 )0.1
Table 2. Initial data of agents.
TypeWolfberryWheatRapeWoodlandGrassland
Area ( hm 2 ) 19235061431673
Water consumption   ( m 3 / hm 2 ) 45005775412554003600
Table 3. Four irrigation scenarios in this study.
ScenarioIrrigation Scheme
1FN + FI
2RM + DI
3RM + MC + DI
4RM + MC + CI
Table 4. Water use efficiency of wolfberry in scenario I and scenario IV.
ScenarioCharacteristic YearWater Consumption (104 m3) Area   ( hm 2 ) Yield
( kg / hm 2 )
Annual Value
(104 RMB)
WUE
( kg · hm 2 · mm 1 )
IWet895.22646.21051.428,839.8612.956
Normal8342467.51049.926,892.4692.959
Dry691.82097.1998.322,860.1013.031
Wet (15%) 110802940.21165.432,018.3032.722
Normal (15%)10062786.21146.630,346.2452.771
Dry (15%)873.62531.51086.127,584.8092.898
IVWet780.94719.01731.451,674.5456.043
Normal740.84513.61674.049,427.8646.093
Dry6173809.21555.841,716.2416.173
Wet (15%)889.85301.01815.858,043.5765.958
Normal (15%)855.45116.31793.856,023.0585.981
Dry (15%)762.14648.91664.550,909.4106.100
1 15% are water resources potential tapping.
Table 5. Water use efficiency of wolfberry in wet year (10% potential tapping).
Scenario Area   ( hm 2 ) Yield   ( kg / hm 2 ) Water Consumption (mm)WUE
( kg · hm 2 · mm 1 )
WUE Relative Increase (%)
12499.6151131.2403.02.8070
22947.8551582.4346.84.56362.55
32942.2681740.5320.95.42493.22
42927.5641773.2295.46.003113.85
Table 6. Comprehensive benefits of irrigation district in wet year (10% potential tapping).
ScenarioAgriculture Water Consumption (104 m3)Ecology Water Consumption (104 m3)Total (104 m3)Yield (t)Annual Value
(104 RMB)
Ecological Water Demand Satisfaction
11361.268113.4991474.7677467.28232,308.8790.520
21343.263151.4671494.7306857.54052,402.3730.538
31289.784203.7501493.5347265.19757,521.4680.579
41196.063276.2081472.2717152.43558,295.1820.637
Publisher’s Note: MDPI stays neutral with regard to jurisdictional claims in published maps and institutional affiliations.