
Analysis of Bus Line Operation Reliability Based on Copula Function


Abstract
:1. Introduction
2. Evaluation Index of Bus Line Operation Reliability
2.1. Definition of Bus Line Operation Reliability
2.2. Operational Reliability Evaluation Index of Bus Lines
- Reflect the operation reliability characteristics of bus lines, which is convenient to analyze and find existing problems;
- Should be able to reflect the passengers for the bus to provide operational capacity requirements, that is, expectations;
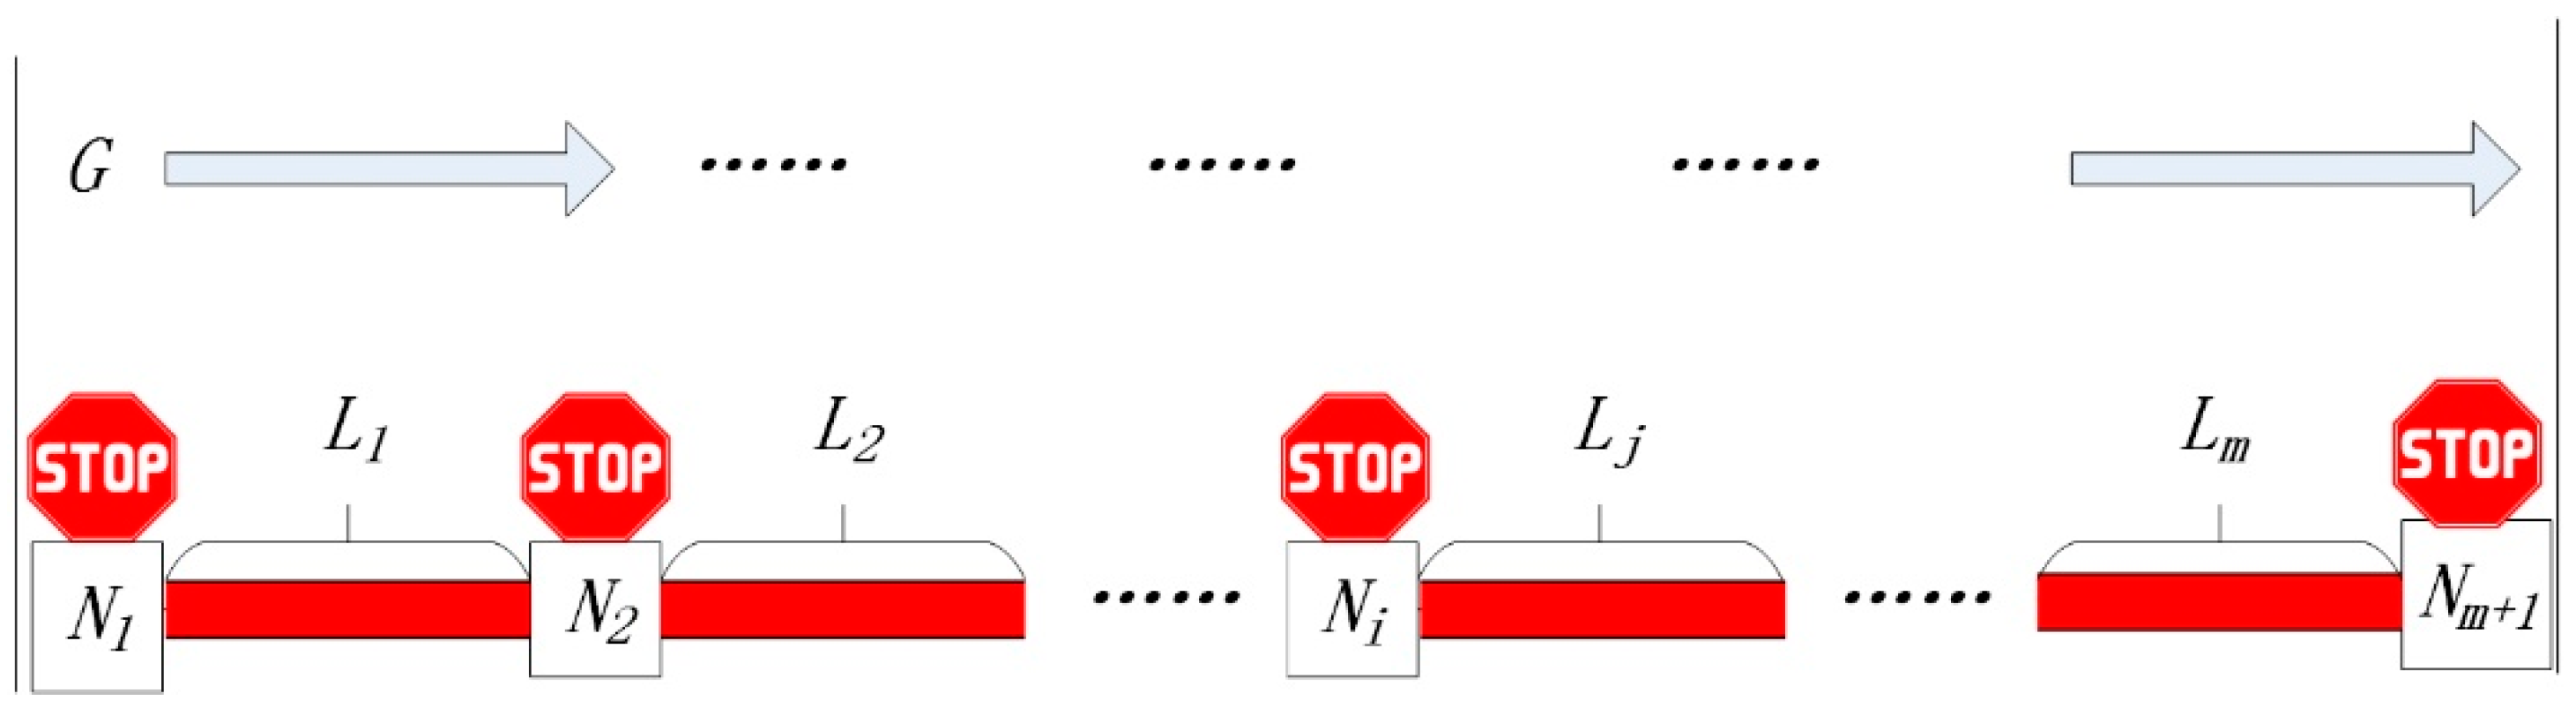
- It should be operable and easy to calculate based on the given data. After comprehensive consideration of the above factors, one-way bus line operation is regarded as a system based on the perspective of system theory, and each inter-station path is regarded as a subsystem.
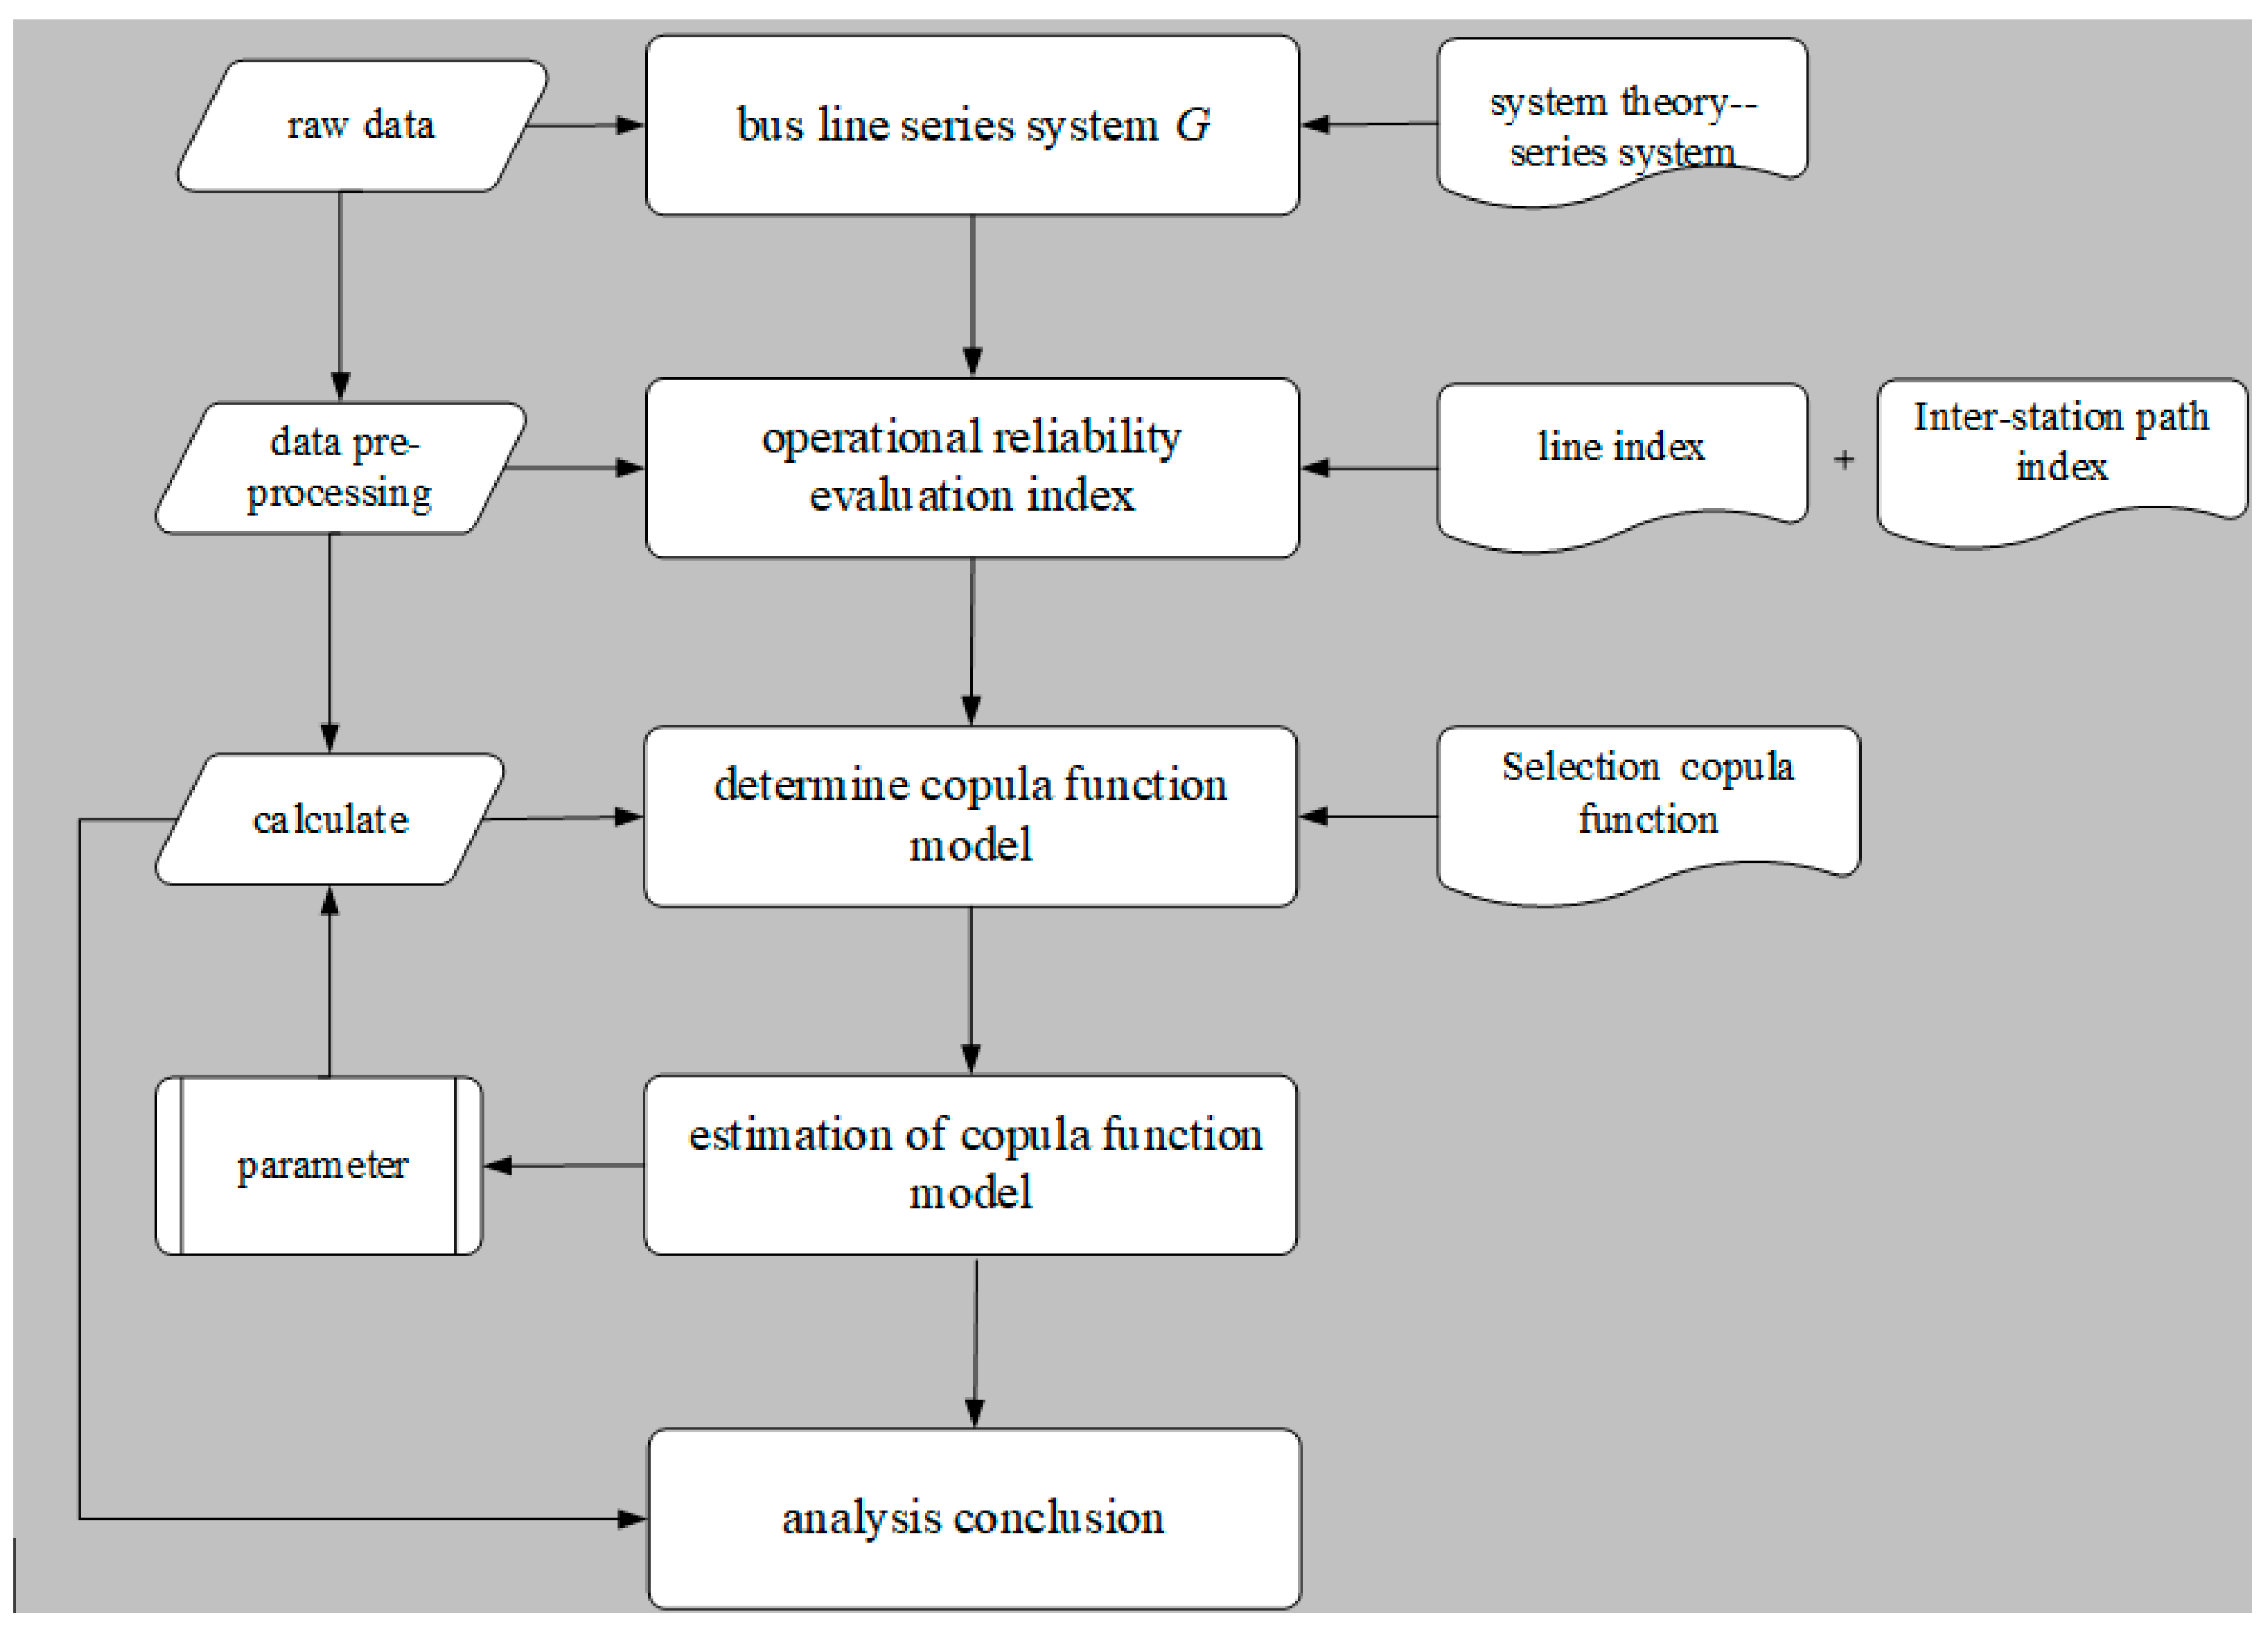
3. General Idea and Methods
3.1. Research Framework
3.2. Reasons for Choosing the Copula Function
3.3. Copula Function
3.4. Selection and Estimation of Copula Function Model
4. Data and Model Calculations
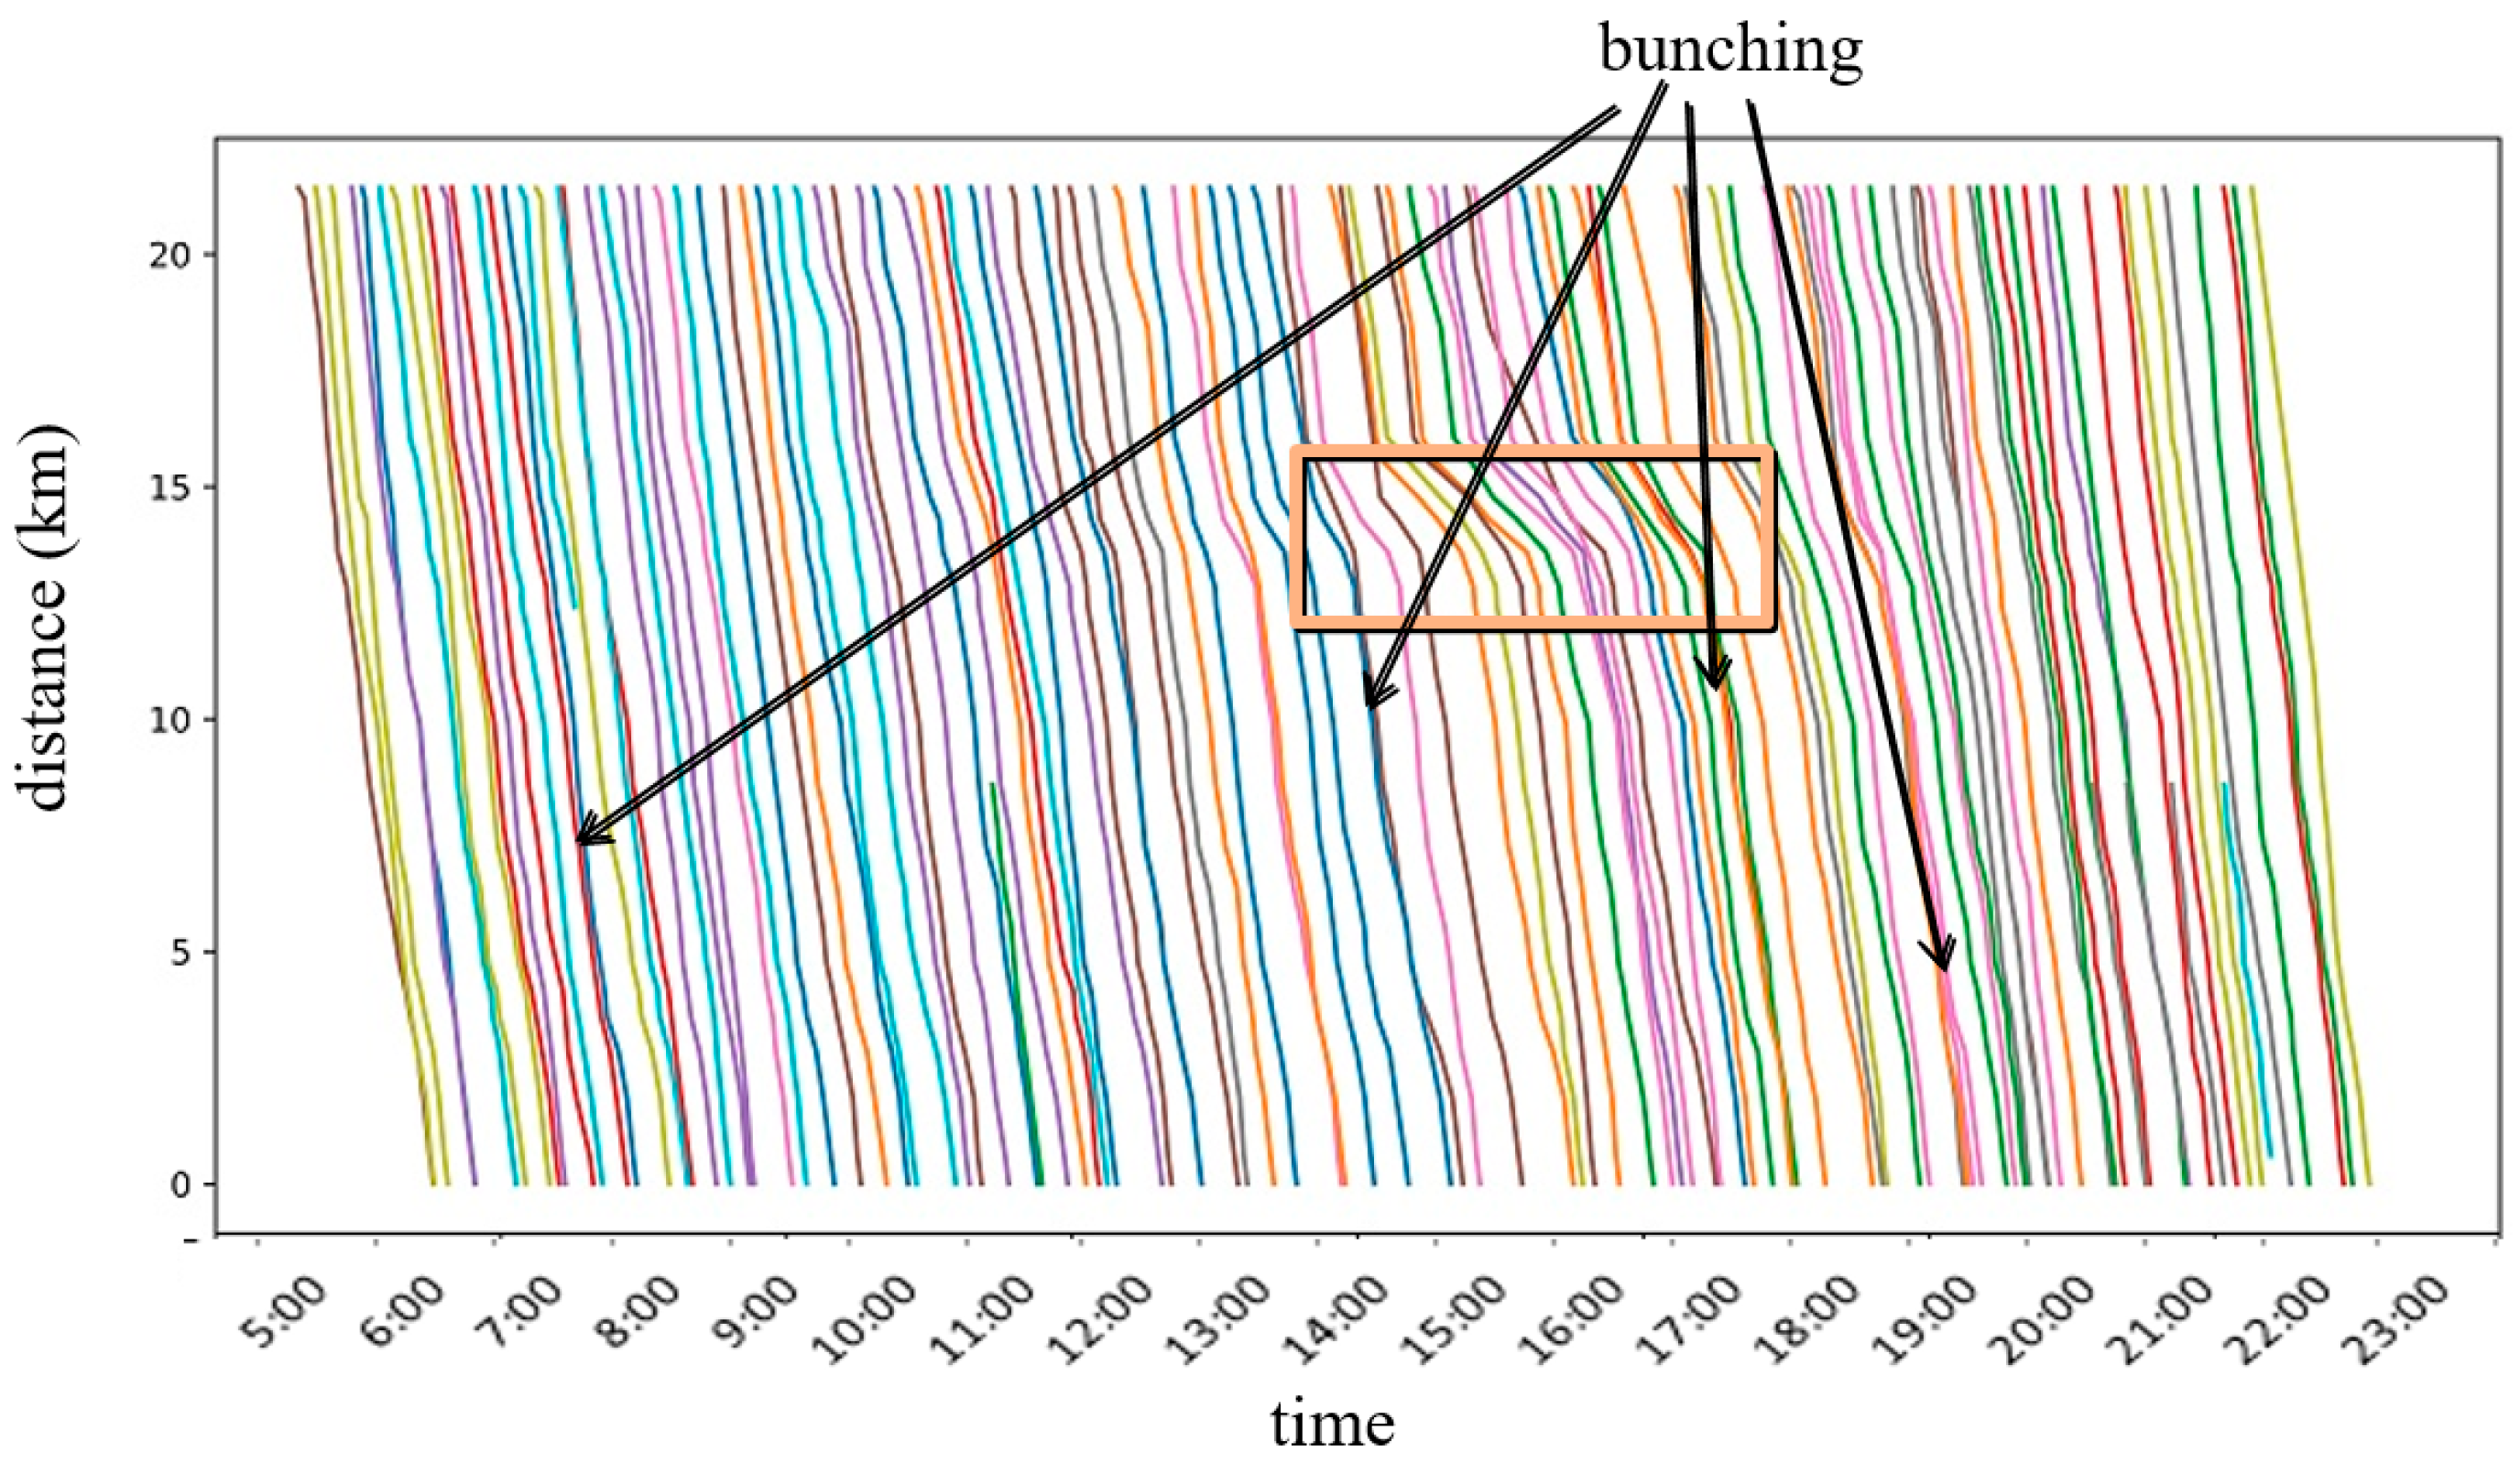
4.1. Data Introduction
- 1.
- Raw data
- 2.
- Data Processing
- 3.
- Index calculation
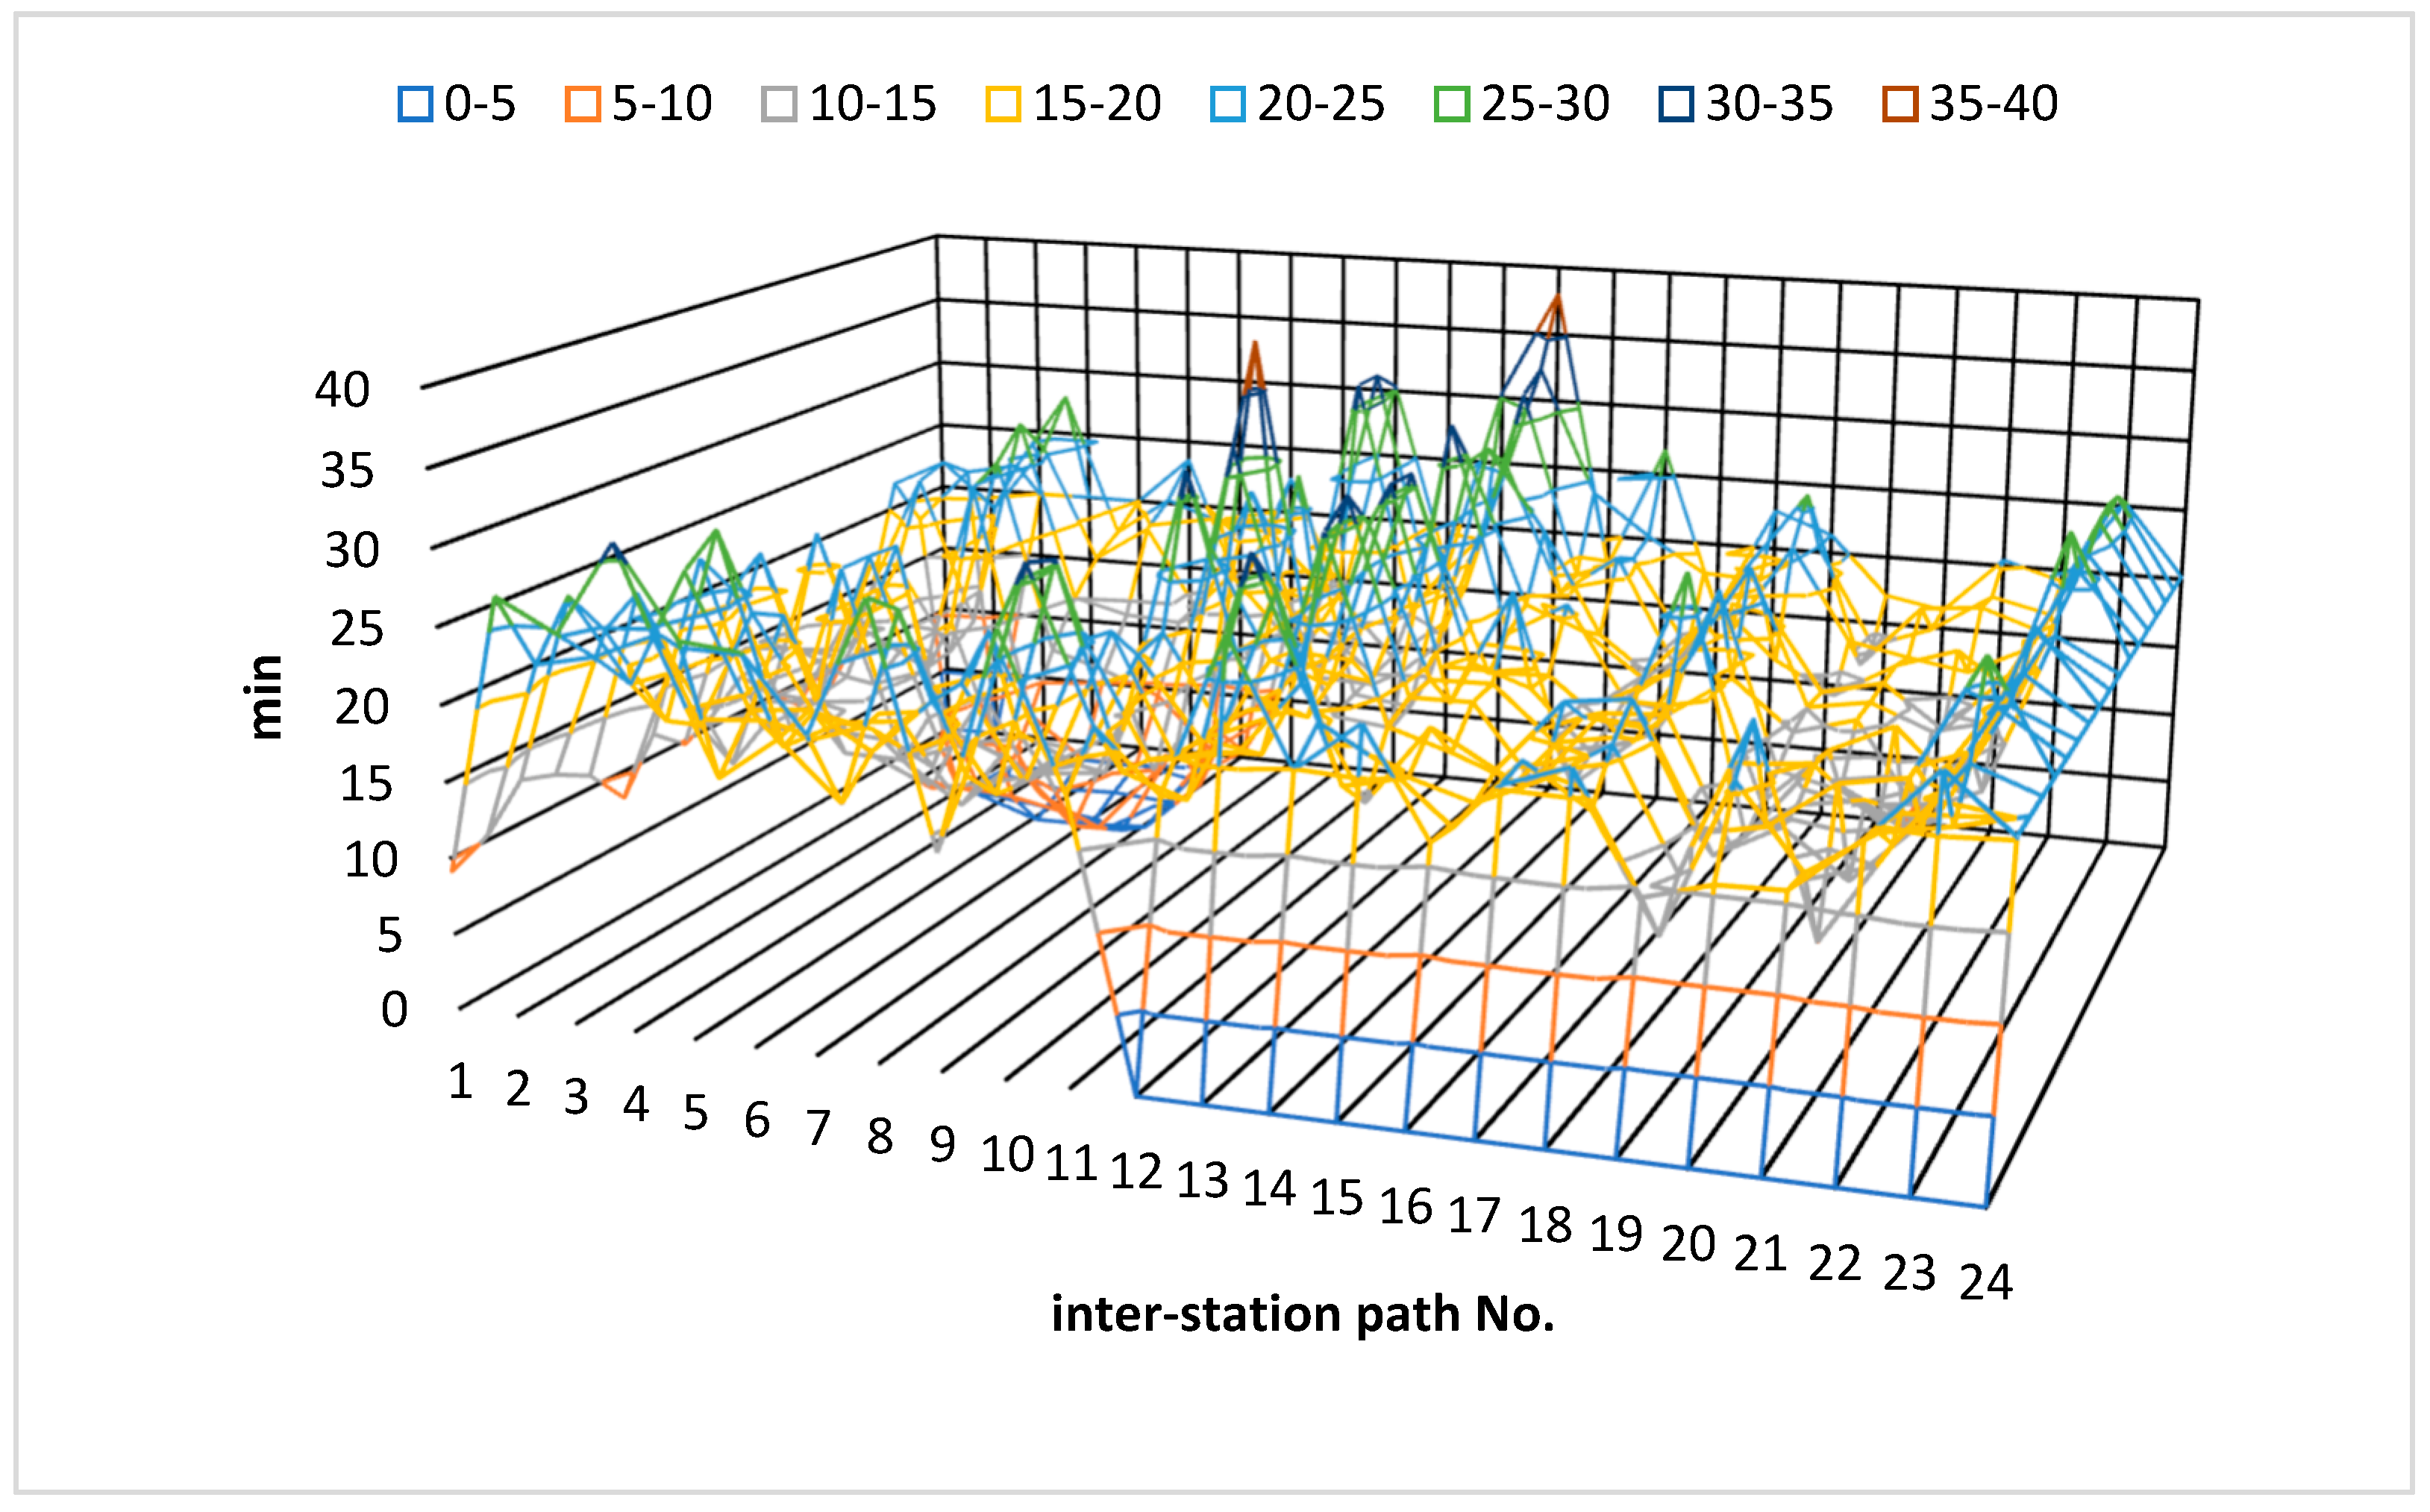
- Inter-station path average running time ().Step 1: Select the real-time bus dynamic data according to the route number, get the one-day arrival time of all the vehicles in a line, save the results as bus route arrival time table.Step 2: According to the vehicle number and arrival time, get the arrival time of each vehicle.Step 3: Each station is traversed, and the running time of each station is obtained by subtracting the time when the vehicles arrive at the station in turn.Step 4: Calculate the average running time interval of each station path, that is, the average running time between stations of the line within the statistical period.
- Inter-station path average running speed ()Step 1: Get average running time ( above.Step 2: Match the average running time of up and down bus routes with the distance between bus stations.Step 3: Calculate the ratiowhere is the operational mileage of the inter-station path.
- Coefficient of variation (CVT)
4.2. Determine the Edge Distribution Model
4.3. Determine Copula Function Model
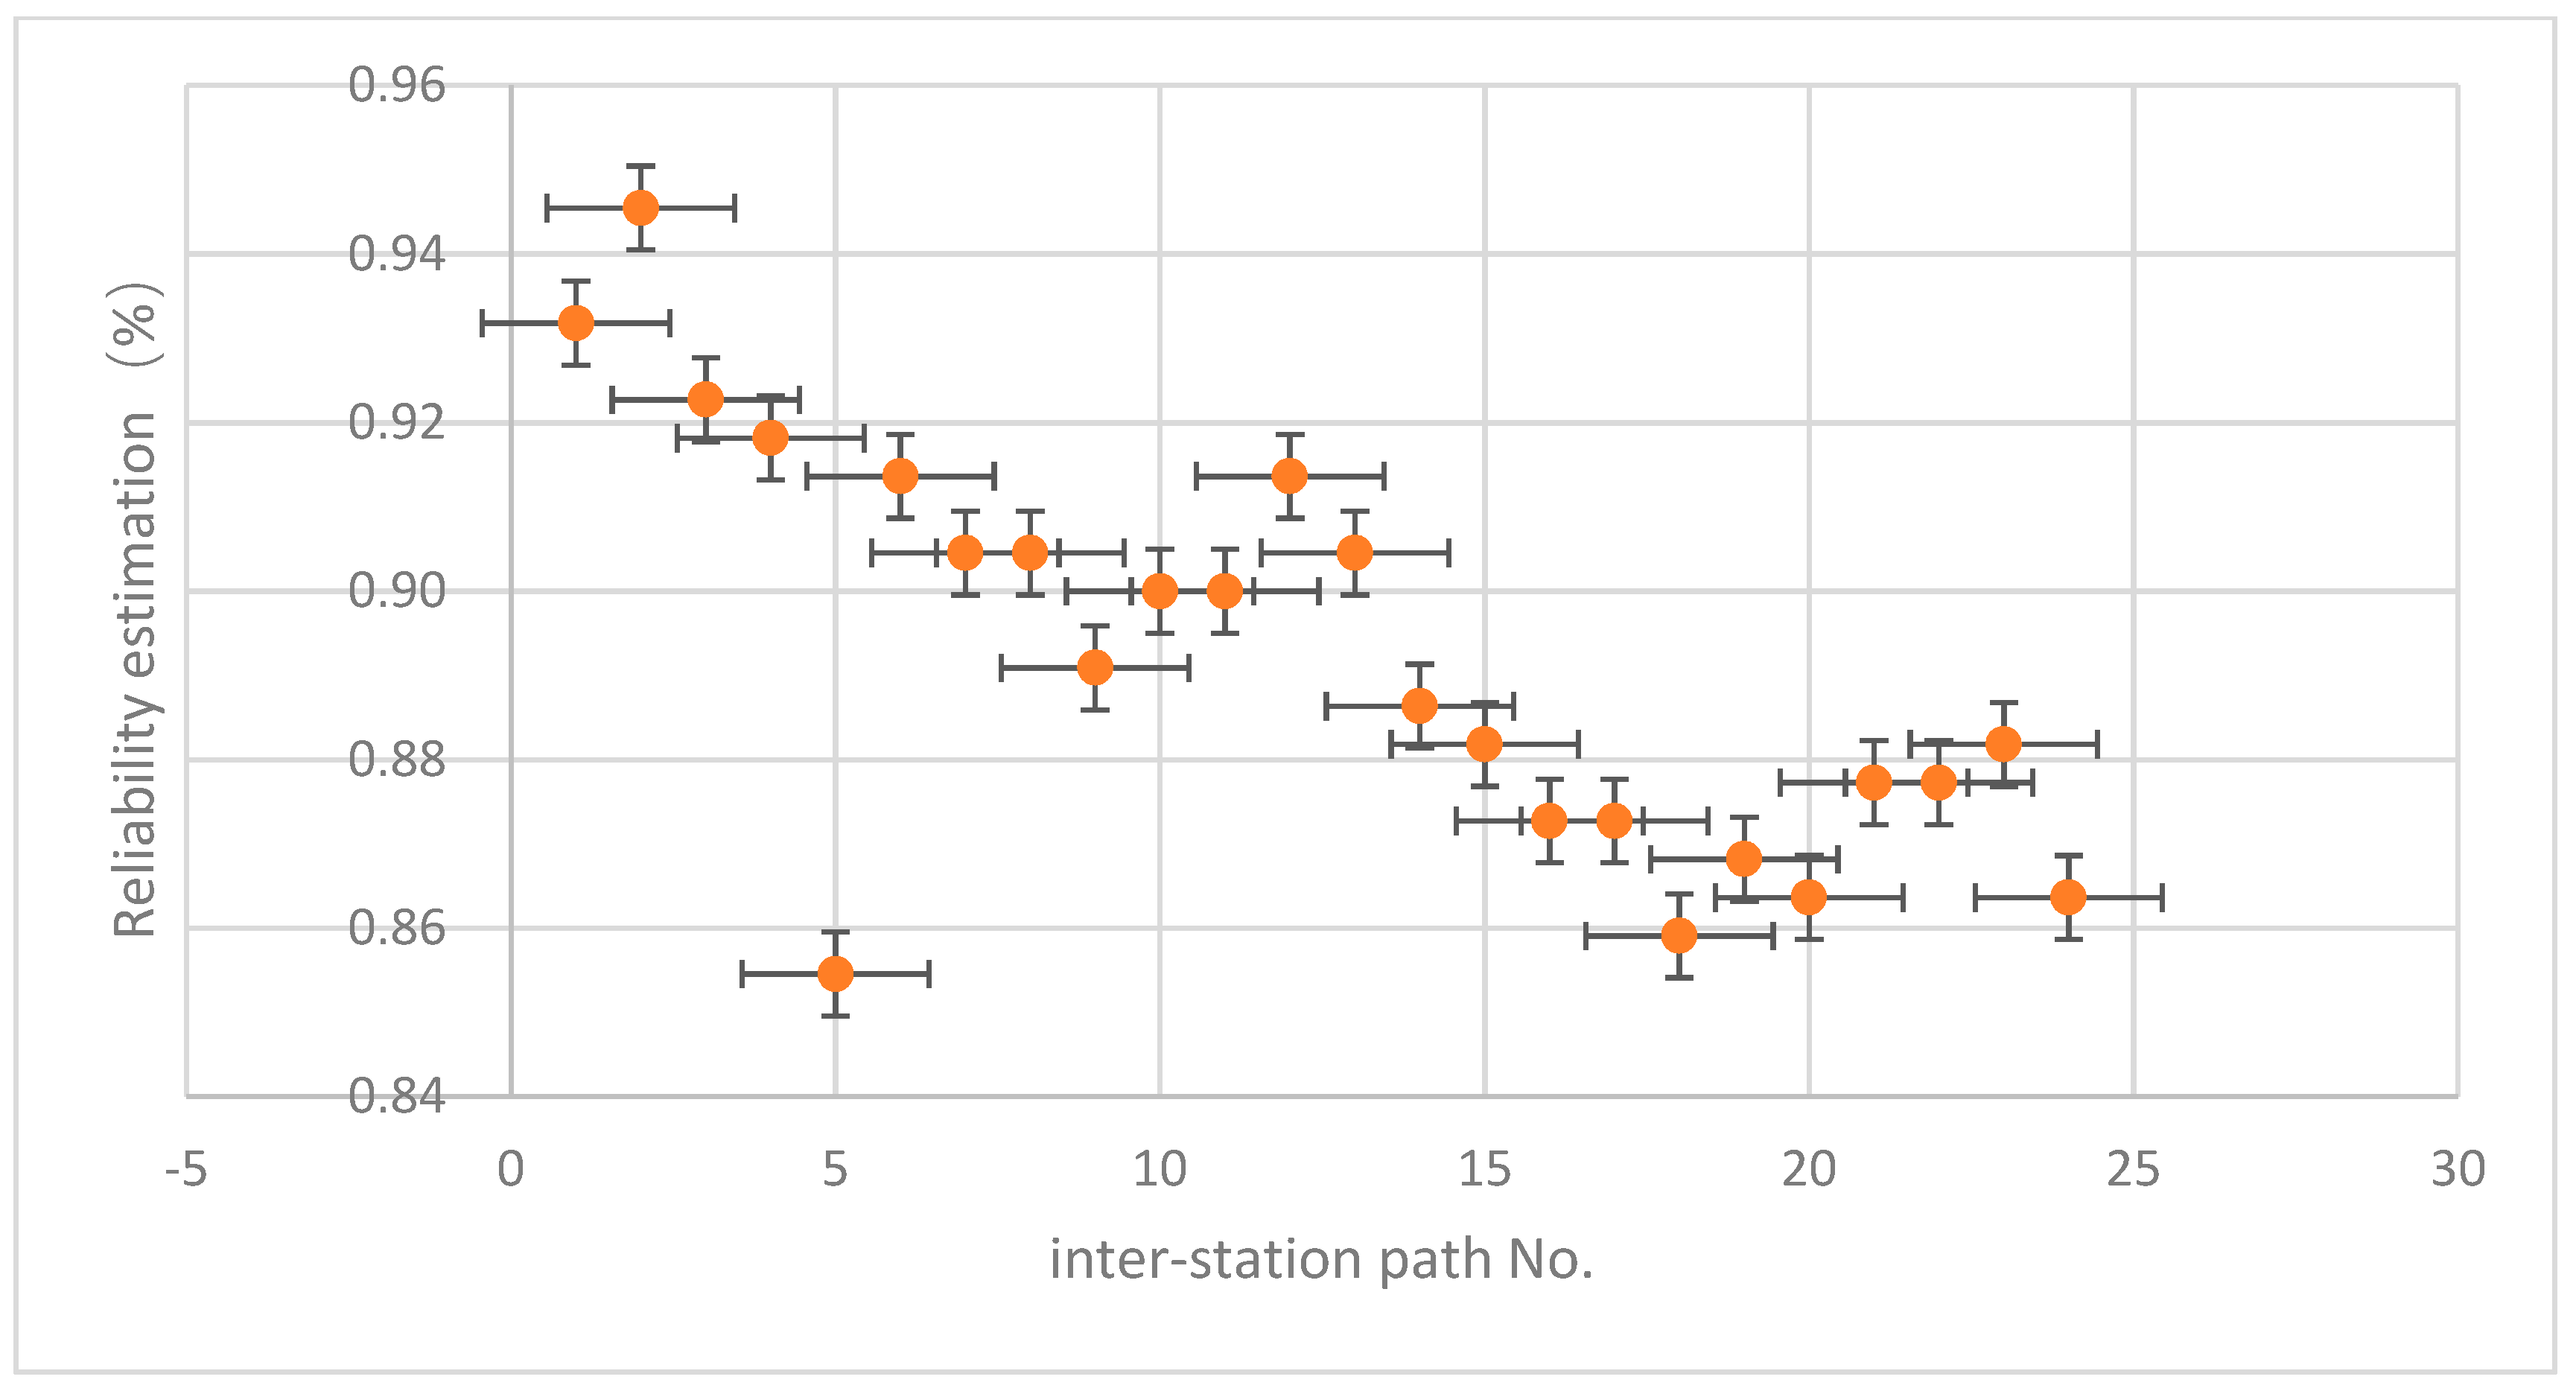
5. Results and Discussion
6. Conclusions
Author Contributions
Funding
Institutional Review Board Statement
Informed Consent Statement
Data Availability Statement
Acknowledgments
Conflicts of Interest
References
- Beaudoin, J.; Farzin, Y. Public transit investment and sustainable transportation: A review of studies of transit’s impact on traffic congestion and air quality. Res. Transport. Econ. 2015, 52, 15–22. [Google Scholar] [CrossRef]
- Firew, T. Analysis of Service Reliability of Public Transportation in the Helsinki CapitalRegion: The Case of Bus Line 550. Master’s Thesis, Aalto University, Espoo, Finland, 5 March 2016. [Google Scholar]
- Paudel, J. Bus ridership and service reliability: The case of public transportation in Western Massachusetts. Transp. Policy 2021, 100, 98–107. [Google Scholar] [CrossRef]
- Frederico, C.S.; Pereira, A.L.S.; Marte, C.L.; Yoshioka, L.R. Mobile application for bus operations controlled by passengers: A user experience design project (UX). Case Stud. Transp. Policy 2021, 9, 172–180. [Google Scholar] [CrossRef]
- Sterman, B.P.; Schofer, J.L. Factors affecting reliability of urban bus service. Transp. Eng. J. 1976, 102, 147–159. [Google Scholar] [CrossRef]
- Chapman, R.A. Bus Reliability-Definition and Measurement; Research Report no.18; Transportation Operations Research Group, University of Newcastle upon Tyne: Newcastle upon Tyne, UK, 1976. [Google Scholar]
- Polus, A. Modeling and measurements of bus service reliability. Transp. Res. 1978, 12, 253–256. [Google Scholar] [CrossRef]
- Sorratini, J.A.; Liu, R.; Sinha, S. Assessing Bus Transport Reliability Using Micro-Simulation. Transp. Plan. Technol. 2008, 31, 303–324. Available online: http://www.tandfonline.com/doi/abs/10.1080/03081060802086512 (accessed on 31 August 2016). [CrossRef]
- Ceder, A. Public Transit Planning and Operation Theory, Modelling and Practice; Butterworth Heinemann: Haifa, Israel, 2016. [Google Scholar]
- Park, J.; Kho, S.Y. A new method to determine level of service criteria of headway. In Proceedings of the 85th Annual Meeting of the Transportation Research Board, Washington, DC, USA, 22–26 January 2006; pp. 1–12. [Google Scholar]
- Strathman, J.G.; Dueker, K.J.; Kimpel, T.; Gerhart, R.; Turner, K.; Taylor, P.; Callas, S.; Griffin, D.; Hooper, J. Automated bus dispatching, operations control and service reliability: Analysis of Tri-Met baseline service data. Transp. Res. Record 1999, 1666, 28–36. [Google Scholar] [CrossRef] [Green Version]
- Turnquist, M. A model for investigating the effects of service frequency and reliability on bus passenger waiting times. Transp. Res. Rec. 1978, 663, 70–73. [Google Scholar]
- Herbert, S.L. The reliability of transit service: An historical perspective. J. Urban Technol. 2005, 12, 99–118. [Google Scholar]
- Oort, N.V.; Nes, R.V. Reliability of urban public transport and strategic and tactical planning, a first analysis. In Proceedings of the IAROR Conference 2007 Proceedings, Hannover, Germany, 28–30 March 2007. [Google Scholar]
- Dai, S.; Chen, Y.; Wei, Z. Analysis on System Reliability of Complex Public Transit Network. J. Wuhan Univ. Technol. Transp. Sci. Eng. 2007, 3, 412–414. [Google Scholar]
- Jang, Y. Study and Case Evaluation on Operational Reliability of Conventional Public Transportation in Large Cities. Master’s Thesis, Beijing Jiaotong University, Beijing, China, 2008. [Google Scholar]
- Chen, X.; Yu, L.; Zhang, Y.; Guo, J. Analyzing urban bus service reliability at the stop, route, and network levels. Transp. Res. Part A Policy Pract. 2009, 43, 722–734. [Google Scholar] [CrossRef]
- Song, X.; Yu, L. Analysis of factors affecting bus operation reliability and improvement measures. Integr. Transp. 2019, 3, 59–62. [Google Scholar]
- Transportation Research Board. Transit Capacity and Quality of Service Manual, 2nd ed.; National Research Council; Transportation Research Board: Washington, DC, USA, 2003. [Google Scholar]
- Abkowitz, M.D.; Engelstein, I. Factors affecting running time on transit routes. Transp. Res. Part A 1983, 17, 107–113. [Google Scholar] [CrossRef]
- Strathman, J.G.; Hopper, J.R. Empirical analysis of bus transit on-time performance. Transp. Res. Part A 1993, 27, 93–100. [Google Scholar] [CrossRef]
- Chioni, E.; Iliopoulou, C.; Milioti, C.; Kepaptsoglou, K. Factors affecting bus bunching at the stop level: A geographically weighted regression approach. Int. J. Transp. Sci. Technol. 2020, 9, 207–217. [Google Scholar] [CrossRef]
- Diab, E.; Badami, M.; El-Geneidy, A. Bus Transit Service Reliability and Improvement Strategies: Integrating the Perspectives of Passengers and Transit Agencies in North America. Transp. Rev. 2015, 35, 292–328. [Google Scholar] [CrossRef]
- Dakic, I.; Yang, K.; Menendez, M.; Chow, J.Y.J. On the design of an optimal flexible bus dispatching system with modular bus units: Using the three-dimensional macroscopic fundamental diagram. Transp. Res. B Methodol. 2021, 148, 38–59. [Google Scholar] [CrossRef]
- Van Oort, N. Service Reliability and Urban Public Transport Design. Ph.D. Thesis, Delft University of Technology, Delft, The Netherlands, 2011. [Google Scholar]
- Abrantes, P.; Wardman, M. Meta-analysis of UK values of travel time: An update. Transp. Res. Part A Policy Pract. 2011, 45, 1–17. [Google Scholar] [CrossRef]
- Arhin, S.A.; Noel, E.C.; Dairo, O. Bus Stop On-Time Arrival Performance and Criteria in a Dense Urban Area. Int. J. Traffic Transp. Eng. 2014, 3, 233–238. Available online: http://article.sapub.org/10.5923.j.ijtte.20140306.01.html (accessed on 5 September 2016).
- Junsik, P.; Seung-Yonung, K. A New Method to Determine Level-of-Service Criteria for Headway Adherence; Transportation Research Record: Washington, DC, USA, 2005; Volume 1927, pp. 277–286. Available online: https://www.doc88.com/p-4903409240677.html (accessed on 23 July 2021).
- Hammerler, M.; Haynes, M.; McNeil, S. Use of automati vehicle location and passenger count data to evaluate bus operations-experience of the Chicagou Transit Authority. Transp. Res. Rec. 2005, 1903, 27–34. [Google Scholar] [CrossRef]
- Alonso-González, J.M.; van Oort, N.; Cats, O.; Hoogendoorn-Lanser, S.; Hoogendoorn, S. Value of time and reliability for urban pooled on-demand services. Transp. Res. C Emerg. Technol. 2020, 115, 102621. [Google Scholar] [CrossRef]
- Rietveld, P.; Bruinsma, F.R.; van Vuuren, D.J. Coping with unreliability in public transport chains: A case study for Netherlands. Transp. Res. A Policy Pract. 2001, 35, 539–559. [Google Scholar] [CrossRef]
- Esmailpour, J.; Aghabayk, K.; Vajari, A.M.; De Gruyter, C. Importance—Performance Analysis (IPA) of bus service attributes: A case study in a developing country. Transp. Res. A Policy Pract. 2020, 142, 129–150. [Google Scholar] [CrossRef]
- Hammerle, M.; Haynes, M.; McNeil, S. Use of automatic vehicle location and passenger count data to evaluate bus operations for the Chicago transit authority. In Proceedings of the TRB 2005 Annual Meeting, Washington, DC, USA, 9–13 January 2005. [Google Scholar]
- Camus, R.; Longo, G. Transit reliability level-of-service estimation based on antomatic vehicle location data. In Proceedings of the TRB 2005 Annual Meeting, Washington, DC, USA, 9–13 January 2005. [Google Scholar]
- Sperstad, I.B.; Solvang, H.E.; Jakobsen, H.S.; Gjerde, O. Data set for power system reliability analysis using a four-area test network. Data Br. 2020, 33, 106495. [Google Scholar] [CrossRef] [PubMed]
- Yanchun, Y.; Chunfu, S.; Yusu, G. Study on travel time reliability model of road network based on real-time Data. Mod. Transp. Technol. 2006, 2, 70–73. [Google Scholar]
- Zhang, W.; Xu, W. Simulation-based robust optimization for the schedule of single-direction bus transit route: The design of experiment. Transp. Res. E Logist. Transp. Rev. 2017, 106, 203–230. [Google Scholar] [CrossRef]
- Ishaq, R.; Cats, O. Designing bus rapid transit systems: Lessons on service reliability and operations. Case Stud. Transp. Policy 2020, 8, 946–953. [Google Scholar] [CrossRef]
- Zhao, H.; Song, R. Study on reliability of Transit Operation. J. Highw. Transp. Res. Dev. 2005, 10, 132–135. [Google Scholar]
- Gao, S.; Zhang, S.; Zhang, Y.; Gao, Y. Operational reliability evaluation and prediction of rolling bearing based on isometric mapping and NoCuSa-LSSVMReliab. Eng. Syst. Saf. 2020, 201, 106968. [Google Scholar] [CrossRef]
- Sharov, M.; Mikhailov, A. Urban Transport System Reliability Indicators. Transp. Res. Procedia 2017, 20, 591–595. [Google Scholar] [CrossRef]
- Boisjoly, G.; Grisé, E.; Maguire, M.; Veillette, M.-P.; Deboosere, R.; Berrebi, E.; El-Geneidy, A. Invest in the ride: A 14year longitudinal analysis of the determinants of public transport ridership in 25 North American cities. Transp. Res. Part A 2018, 116, 434–445. [Google Scholar] [CrossRef]
- Eryilmaz, S. Multivariate copula based dynamic reliability modeling with application to weighted-k-out-of-n systems of dependent components. Struct. Saf. 2014, 51, 23–28. [Google Scholar] [CrossRef]
- Liang, S.; He, S.; Zhang, H.; Ma, M. Optimal holding time calculation algorithm to improve the reliability of high frequency bus route considering the bus capacity constraint. Reliab. Eng. Syst. Saf. 2021, 212, 107632. [Google Scholar] [CrossRef]
- Diab, E.; El-Geneidy, A. Bus Public Transport Planning and Operations. In International Encyclopedia of Transportation; Vickerman, R., Ed.; Elsevier: Amsterdam, The Netherlands, 2021; pp. 326–332. [Google Scholar]


| The Evaluation Object | Time | Index |
| a line | day/hour | average running time () on-time rate () |
| inter-station path | day/hour | average running time () average running speed () average time standard deviation () coefficient of variation (CVT) |
| NO. | 1 | 2 | 3 | 4 | 5 | 6 | 7 | 8 | 9 | 10 | 11 | 12 | |
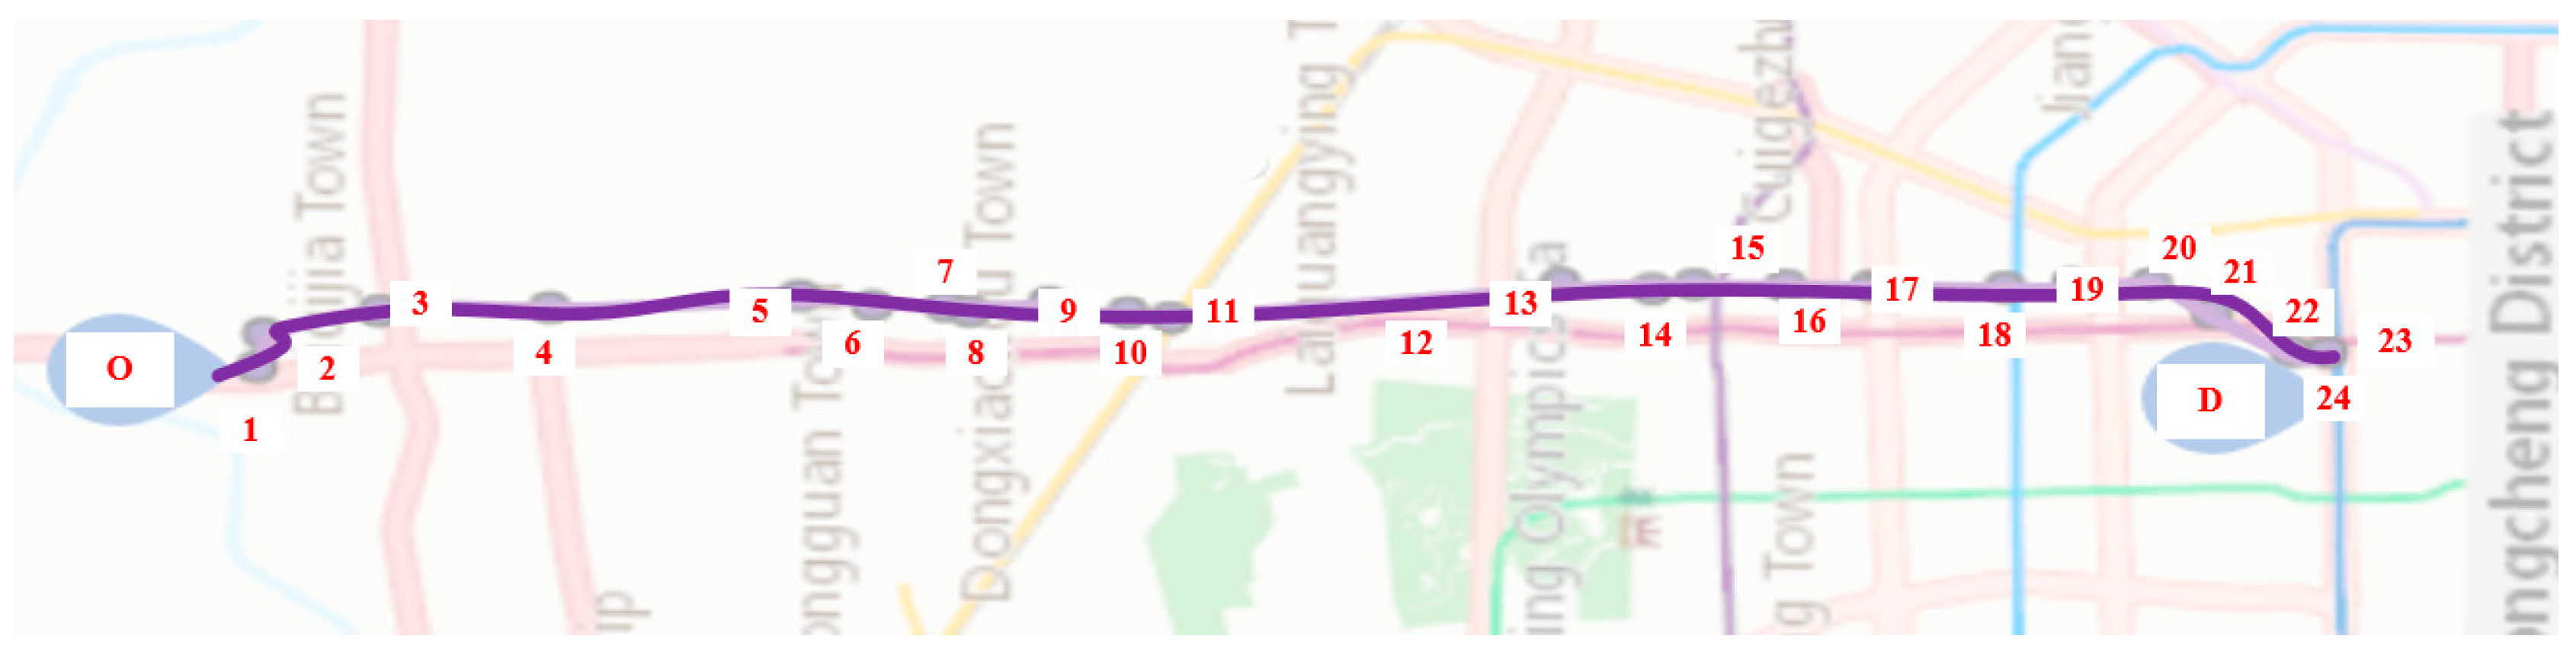
| station | Dongshage zhuang bus station | Dongshage zhuang | Ping fang | Pingxi Wangfu intersection southh | South East banner South Station of Tiantongyuan | Dongsanqi South Station | Tiantongyuan Taipingzhuang | Tiantong Xiyuan North | Tiantong Xiyuan South | Lishuiqiao Station | Lishuiqiao North Station | Dayangfang | |
| NO. | 13 | 14 | 15 | 16 | 17 | 18 | 19 | 20 | 21 | 22 | 23 | 24 | 25 |
| station | Beiyuan | Xindian Village | Beiyuan Road Datun North Station | MTR Datun Road East Station | Huizhong Road East entrance | Huixin West Bridge | Huixinyuan | South entrance of Huixin West Street | Heping West Bridge North | Heping West Bridge Southd | Xinghua Road | Ditan West Gate | Andingmen |
| Index | L1 | L2 | L3 | L4 | L5 | L6 | L7 | L8 | L9 | L10 | L11 | L12 |
| 1.3 | 4.0 | 5.0 | 6.5 | 4.4 | 3.1 | 2.2 | 2.4 | 3.7 | 1.2 | 6.1 | 4.1 | |
| 1.2 | 2.0 | 2.3 | 2.1 | 1.9 | 2.8 | 2.4 | 2.8 | 1.3 | 1.6 | 1.6 | 2.0 | |
| Index | L13 | L14 | L15 | L16 | L17 | L18 | L19 | L20 | L21 | L22 | L23 | L24 |
| 3.3 | 3.3 | 1.2 | 4.0 | 3.0 | 2.5 | 2.7 | 2.5 | 4.0 | 4.0 | 3.3 | 1.8 | |
| 0.9 | 1.1 | 0.6 | 1.2 | 0.8 | 1.2 | 0.9 | 0.8 | 1.5 | 1.3 | 1.0 | 1.0 |
| CAR _CODE | LINE _CODE | UP_OR_DOWN | GPS_TIME | LONGITUDE | LATITUDE | RUN_STATUS | PARK_STATUS | NEXTSTATION_CODE | UPDATETIME |
|---|---|---|---|---|---|---|---|---|---|
| 27376 | 44 | 0 | 2020-07-06 7:30 | 116.3824333333 | 39.9477733333 | 1 | 1 | 0 | 2020-07-06 7:31 |
| 27376 | 44 | 0 | 2020-07-06 7:30 | 116.3823283333 | 39.947775 | 1 | 1 | 0 | 2020-07-06 7:31 |
| 22137 | 1 | 1 | 2020-07-06 7:30 | 116.3034083333 | 40.1621 | 1 | 0 | 0 | 2020-07-06 7:31 |
| 22137 | 1 | 1 | 2020-07-06 7:30 | 116.303795 | 40.162125 | 0 | 0 | 0 | 2020-07-06 7:31 |
| Date | Line id | License Plate | Trip Index | Actual Departure Time | Actual Time of Arrival | Direction | Stardom | Planned Time of Arrival | Originating Terminal | Terminal |
|---|---|---|---|---|---|---|---|---|---|---|
| 2020-07-30 | 10919 | AN8721 | 2 | 04:06:32 | 05:40:35 | 1 | 04:06:00 | 2 05:41:00 | North of Jingzhang Road | Deshengmen |
| 2020-07-30 | 10919 | AN8723 | 3 | 04:12:26 | 05:46:55 | 1 | 04:12:00 | 05:47:00 | North of Jingzhang Road | Deshengmen |
| 2020-07-30 | 10919 | AW7333 | 7 | 04:18:40 | 05:51:02 | 1 | 04:18:00 | 05:53:00 | North of Jingzhang Road | Deshengmen |
| 2020-07-30 | 918 | AV0516 | 1 | 04:20:00 | 06:20:00 | 1 | 04:20:00 | 06:20:00 | Pinggu new bus station | Dongzhimen Bus Hub |
| 2020-07-30 | 918 | AW1319 | 8 | 04:21:11 | 06:20:00 | 1 | 04:20:00 | 06:20:00 | Pinggu new bus station | Dongzhimen Bus Hub |
| Index | L1 | L2 | L3 | L4 | L5 | L6 | L7 | L8 | L9 | L10 | L11 | L12 |
| 1.3 | 4.0 | 5.0 | 6.5 | 4.4 | 3.1 | 2.2 | 2.4 | 3.7 | 1.2 | 6.1 | 4.1 | |
| 1.2 | 2.0 | 2.3 | 2.1 | 1.9 | 2.8 | 2.4 | 2.8 | 1.3 | 1.6 | 1.6 | 2.0 | |
| CVT | 0.9 | 0.5 | 0.5 | 0.3 | 0.4 | 0.9 | 1.1 | 1.2 | 0.4 | 1.3 | 0.3 | 0.5 |
| (km/h) | 11.3 | 23.2 | 17.4 | 24.7 | 13.4 | 16.3 | 13.0 | 22.9 | 13.5 | 27.2 | 14.9 | 19.5 |
| Index | L13 | L14 | L15 | L16 | L17 | L18 | L19 | L20 | L21 | L22 | L23 | L24 |
| 3.3 | 3.3 | 1.2 | 4.0 | 3.0 | 2.5 | 2.7 | 2.5 | 4.0 | 4.0 | 3.3 | 1.8 | |
| 0.9 | 1.1 | 0.6 | 1.2 | 0.8 | 1.2 | 0.9 | 0.8 | 1.5 | 1.3 | 1.0 | 1.0 | |
| CVT | 0.3 | 0.3 | 0.5 | 0.3 | 0.3 | 0.5 | 0.3 | 0.3 | 0.4 | 0.3 | 0.3 | 0.6 |
| 26.9 | 17.3 | 18.9 | 13.4 | 18.1 | 19.4 | 12.9 | 14.1 | 10.7 | 15.2 | 23.4 | 20.2 |
Publisher’s Note: MDPI stays neutral with regard to jurisdictional claims in published maps and institutional affiliations. |
© 2021 by the authors. Licensee MDPI, Basel, Switzerland. This article is an open access article distributed under the terms and conditions of the Creative Commons Attribution (CC BY) license (https://creativecommons.org/licenses/by/4.0/).
Share and Cite
Xiaoliang, Z.; Limin, J. Analysis of Bus Line Operation Reliability Based on Copula Function. Sustainability 2021, 13, 8419. https://doi.org/10.3390/su13158419
Xiaoliang Z, Limin J. Analysis of Bus Line Operation Reliability Based on Copula Function. Sustainability. 2021; 13(15):8419. https://doi.org/10.3390/su13158419
Chicago/Turabian StyleXiaoliang, Zhang, and Jia Limin. 2021. "Analysis of Bus Line Operation Reliability Based on Copula Function" Sustainability 13, no. 15: 8419. https://doi.org/10.3390/su13158419
APA StyleXiaoliang, Z., & Limin, J. (2021). Analysis of Bus Line Operation Reliability Based on Copula Function. Sustainability, 13(15), 8419. https://doi.org/10.3390/su13158419