1. Introduction
Although the questions of how global fisheries are faring and their roles in society are critically important, they are largely unresolved, especially for inland freshwaters. Answers to these questions currently depend on the Food and Agriculture Organization of the United Nations (FAO), which collects fishery data for the entire planet. Since 1950, the FAO has been receiving reported fishery data from its member countries, which it then harmonizes and disseminates as global datasets for marine and inland (freshwater) capture fisheries along with culture (aquaculture). Biannual analyses of reported inland capture fisheries performed by the FAO have focused on regional summaries and repeatedly shown continuous, but seemingly inexplicable, near-linear increases in catch for many poorly developed Asian, African, and South American countries [
1,
2,
3,
4]. Reported aquaculture production has shown similar trends for most countries, with China dominating this sector [
1,
2,
3,
4]. The apparent increase in inland global capture fisheries contrasts dramatically with declines in global ocean fisheries [
5], although the latter trend was only recognized after reported values had been re-evaluated/ re-calculated after being found to have been under-reported [
5]. It is difficult to understand how and why inland capture fisheries can be rapidly increasing in poorly developed countries because of their rising populations and the declining health of their aquatic habitats [
1,
2,
3]. However, if universally true for these poorer countries, this situation is serious because these countries rely on inland fisheries for food, and it would then be unclear how reliable this food source actually is or how to manage it [
1,
6,
7,
8,
9].
To date, nearly all analyses of the world’s inland capture fisheries have taken a geopolitical approach, summarizing data reported to the FAO by region (continent, subcontinent, country) and the weight (in tons) of all aquatic organisms reported captured or produced [
1,
2,
3,
4,
9]. While the FAO summarizes country data on a biannual basis, it has also produced three special analyses of inland fisheries [
10,
11,
12]. Additionally, there have been several independent analyses which have attempted to identify overarching geographic trends in capture data [
1,
9,
13]. All of these analyses report evidence of a rising global catch with especially large increases reported in many Asian countries, although China, Japan, Thailand, and Korea, relatively well-to-do countries in this region, report that their capture fisheries to be either stable or decreasing [
1,
10]. South America is another region that contains countries in various stages of development (e.g., Chile, Brazil). It is reasonable to suggest that within-region variance might be at least partially explained by socioeconomic factors, as seen in marine capture fisheries [
14]. One approach, and the first step in this process, would be to perform a descriptive study of trends in fishery data that could serve as a foundation for more data analysis and developing more sophisticated analytical models in the future.
The possibility that socioeconomic factors affect inland capture data has been examined for a few regions/fisheries and appears to have merit. One study focused on river fisheries and found that GDP correlated with reported capture fisheries in the early 2000s when wealthy countries were excluded [
7]. Another analysis of mostly poorer African countries similarly suggested that they are badly underestimating their capture fisheries [
8], but again did not consider global inland fisheries as a whole. Similarly, it has been noted that several well-developed European countries are likely under-estimating their fisheries because of unreported recreational fisheries [
1]. Finally, in the only known analysis of the possible role of social factors, Kapetsky [
15] examined the Human Development Index (HDI), an index of a country’s education, longevity and economic well-being [
16], and showed that of the top 20 inland fishing countries (based on reported biomass), all but one (China) were poorly developed in 2002. This observation could be explained in several ways. The possibility that countries with lower educational levels might de-emphasize data collection makes sense, as does the possibility that wealthier countries might be more inclined and better able to collect more and better data, while their citizens might also tend to overfish less as they depend less on the fish they catch for food. Effects of development might also be seen in the life histories of the fish species caught (i.e., diadromous or fresh or estuarine) by countries, but this possibility has not been examined. No study we know of has examined historic trends in global inland capture fisheries across time to determine whether or how socioeconomic factors might contribute to trends in reported catch, including whether species are being fully identified, or possible relationships to fish culture activity.
Indeed, inland fish culture is now reported to be more important (by biomass) than capture fisheries [
2,
3,
4], but the role of socioeconomic factors on it and their possible effects on capture fisheries have also not been examined aside from FAO reports. Notably, reported inland culture fisheries have grown most quickly in China, a developing country [
2,
3]. However, in many instances, cultured species are obtained from the wild (e.g., larval anguillid eels) and often raised in dammed rivers that might be classified and reported as capture fishes and not culture, possibly confounding reporting [
1]. The identities of species cultured might also be expected to vary greatly with country location as well as their socioeconomic status, especially when lucrative export markets are involved and possibly also complicating reporting. While marine aquaculture has been independently examined to evaluate data reporting [
17] and found to be generally accurate, inland (freshwater) aquaculture has not been examined in this manner. Finally, it has been suggested that aquacultural activity may confound capture fisheries directly by diverting resources from it. These possibilities have not yet been examined by determining overlap in species cultured and captured, or by determining if historic trends in reporting for capture and culture might run counter to each other.
Given the disproportionate importance of inland fisheries to global food security and uncertainties surrounding its status in poorly developed countries, it is important to examine inland fishery data from multiple perspectives to learn as much as possible about how accurate they might, or might not be, and why. Our proof-of-concept study examined reported inland capture and culture data for finfish from a socioeconomic perspective across time to determine what role development (HDI) might have and how these sectors might influence each other. We were especially interested in possible trends in data reporting and relationships between capture and culture finfisheries. We focused on finfisheries because they are the most valuable and most easily quantified in a proof-of-concept approach. Our goal was to determine if future detailed analyses of global inland fisheries that consider socioeconomic factors and new types of data collection might be warranted next.
2. Materials and Methods
Inland fisheries data were obtained from the FAO Capture, Aquaculture and Global production databases (1970–2015; [
18] using the FishStatJ software (downloaded from
www.fao.org on 10 January 2018)). The taxa from these datasets were separated into finfish (326 in fisheries; 218 in aquaculture), invertebrates, and plants. Fish taxonomy and habitat were validated using FishBase (
www.fishbase.org, accessed on 10 January 2018) and categorized as fresh, brackish, diadromous (anadromous, catadromous, and amphidromous), and marine. This categorization was confirmed via extensive scientific literature searches (Google Scholar). Fisheries for species that can tolerate brackish water but are typically cultured or raised in freshwater were considered as “freshwater fisheries” (199 taxa). Similarly, “brackish water fisheries” included fishes typically caught in brackish waters but included a few species that might also be found in either fresh or marine waters or migrate between them on occasion (21 taxa). All diadromous fishes were placed in the “diadromous fisheries” category (28 taxa). Salmonids were included in this group and analysis, even though they are often grown out in marine pens because they are hatched in freshwater, and many exist solely as landlocked species and sub-species. Unidentified fishes (e.g., Osteichthyes) were not further disaggregated and noted as “unidentified” (Cypriniformes was described as freshwater because all species in this family are freshwater species). Lastly, fish taxa found in the culture category, whose culture relies completely on wild-caught larvae or juveniles (e.g., anguillid eels) were moved from the aquaculture dataset to the capture fisheries dataset (32 taxa). In this process, we looked for mistaken data reports and sought to “correct” data to the greatest extent possible, short of whole-sale “catch reconstruction” [
19].
Catch data were summarized by country by year. For countries such as the Russian Federation and China, which have other country names appearing in the FAO datasets, their catch data were lumped to one country, e.g., Russian Federation and Union of Soviet Socialist Republics were lumped as Russian Federation. In the case of the Russian Federation, this scenario is complicated by the fact that after 1991 half a dozen countries left the federation, but because no data were collected on these countries prior to the split we, like the FAO, choose to use the entire group for this analysis.
To evaluate the socioeconomic status of countries, the HDI was used (
http://hdr.undp.org/en/content/human-development-index-hdi; accessed on 10 January 2018). Importantly, this index is a composite of several indicators (i.e., not just financial wealth) including life expectancy index (life expectancy at birth), education index (expected years of schooling, mean years of schooling), and the gross national income (GNI) index (GNI per capita, purchase power parity in US dollars) [
17]. These indicators thus cover three dimensions of life (long and healthy life, knowledge, a decent standard of living) that measure the capacity of inhabitants to contribute to the development of their country, more than just average income level. We used 2015 as our index year because HDI values have changed little over the past several decades and it was beyond the scope of this particular study to examine changes in HDI value over time. Similarly, in this initial proof-of-concept study, we focused on finfish (i.e., not plants nor mollusks) because this sector is the most valuable and important, and the most straightforward to evaluate. Catches by country by year were ranked by HDI (1–189) as reported online (
http://hdr.undp.org/en/composite/HDI accessed on 10 January 2018) and then categorized by us into one of three groups: the top third or tier (Tier-1 or “well-developed”; HDI ranks 1–51), the middle third (Tier-2 or “moderately developed”; HDI ranks 52–105) and the bottom third (Tier-3 or “poorly developed”; HDI ranks 106–189 and countries without HDI ranks).
Temporal trends of fishery landings and culture production were plotted for each HDI group for all fish, freshwater, brackish, and diadromous finfish fisheries, and total finfish capture. We examined the relative contribution of country by HDI and species. The top three countries in each category and the top three fish species were identified and tabulated. Culture data were treated in the same manner.
3. Results
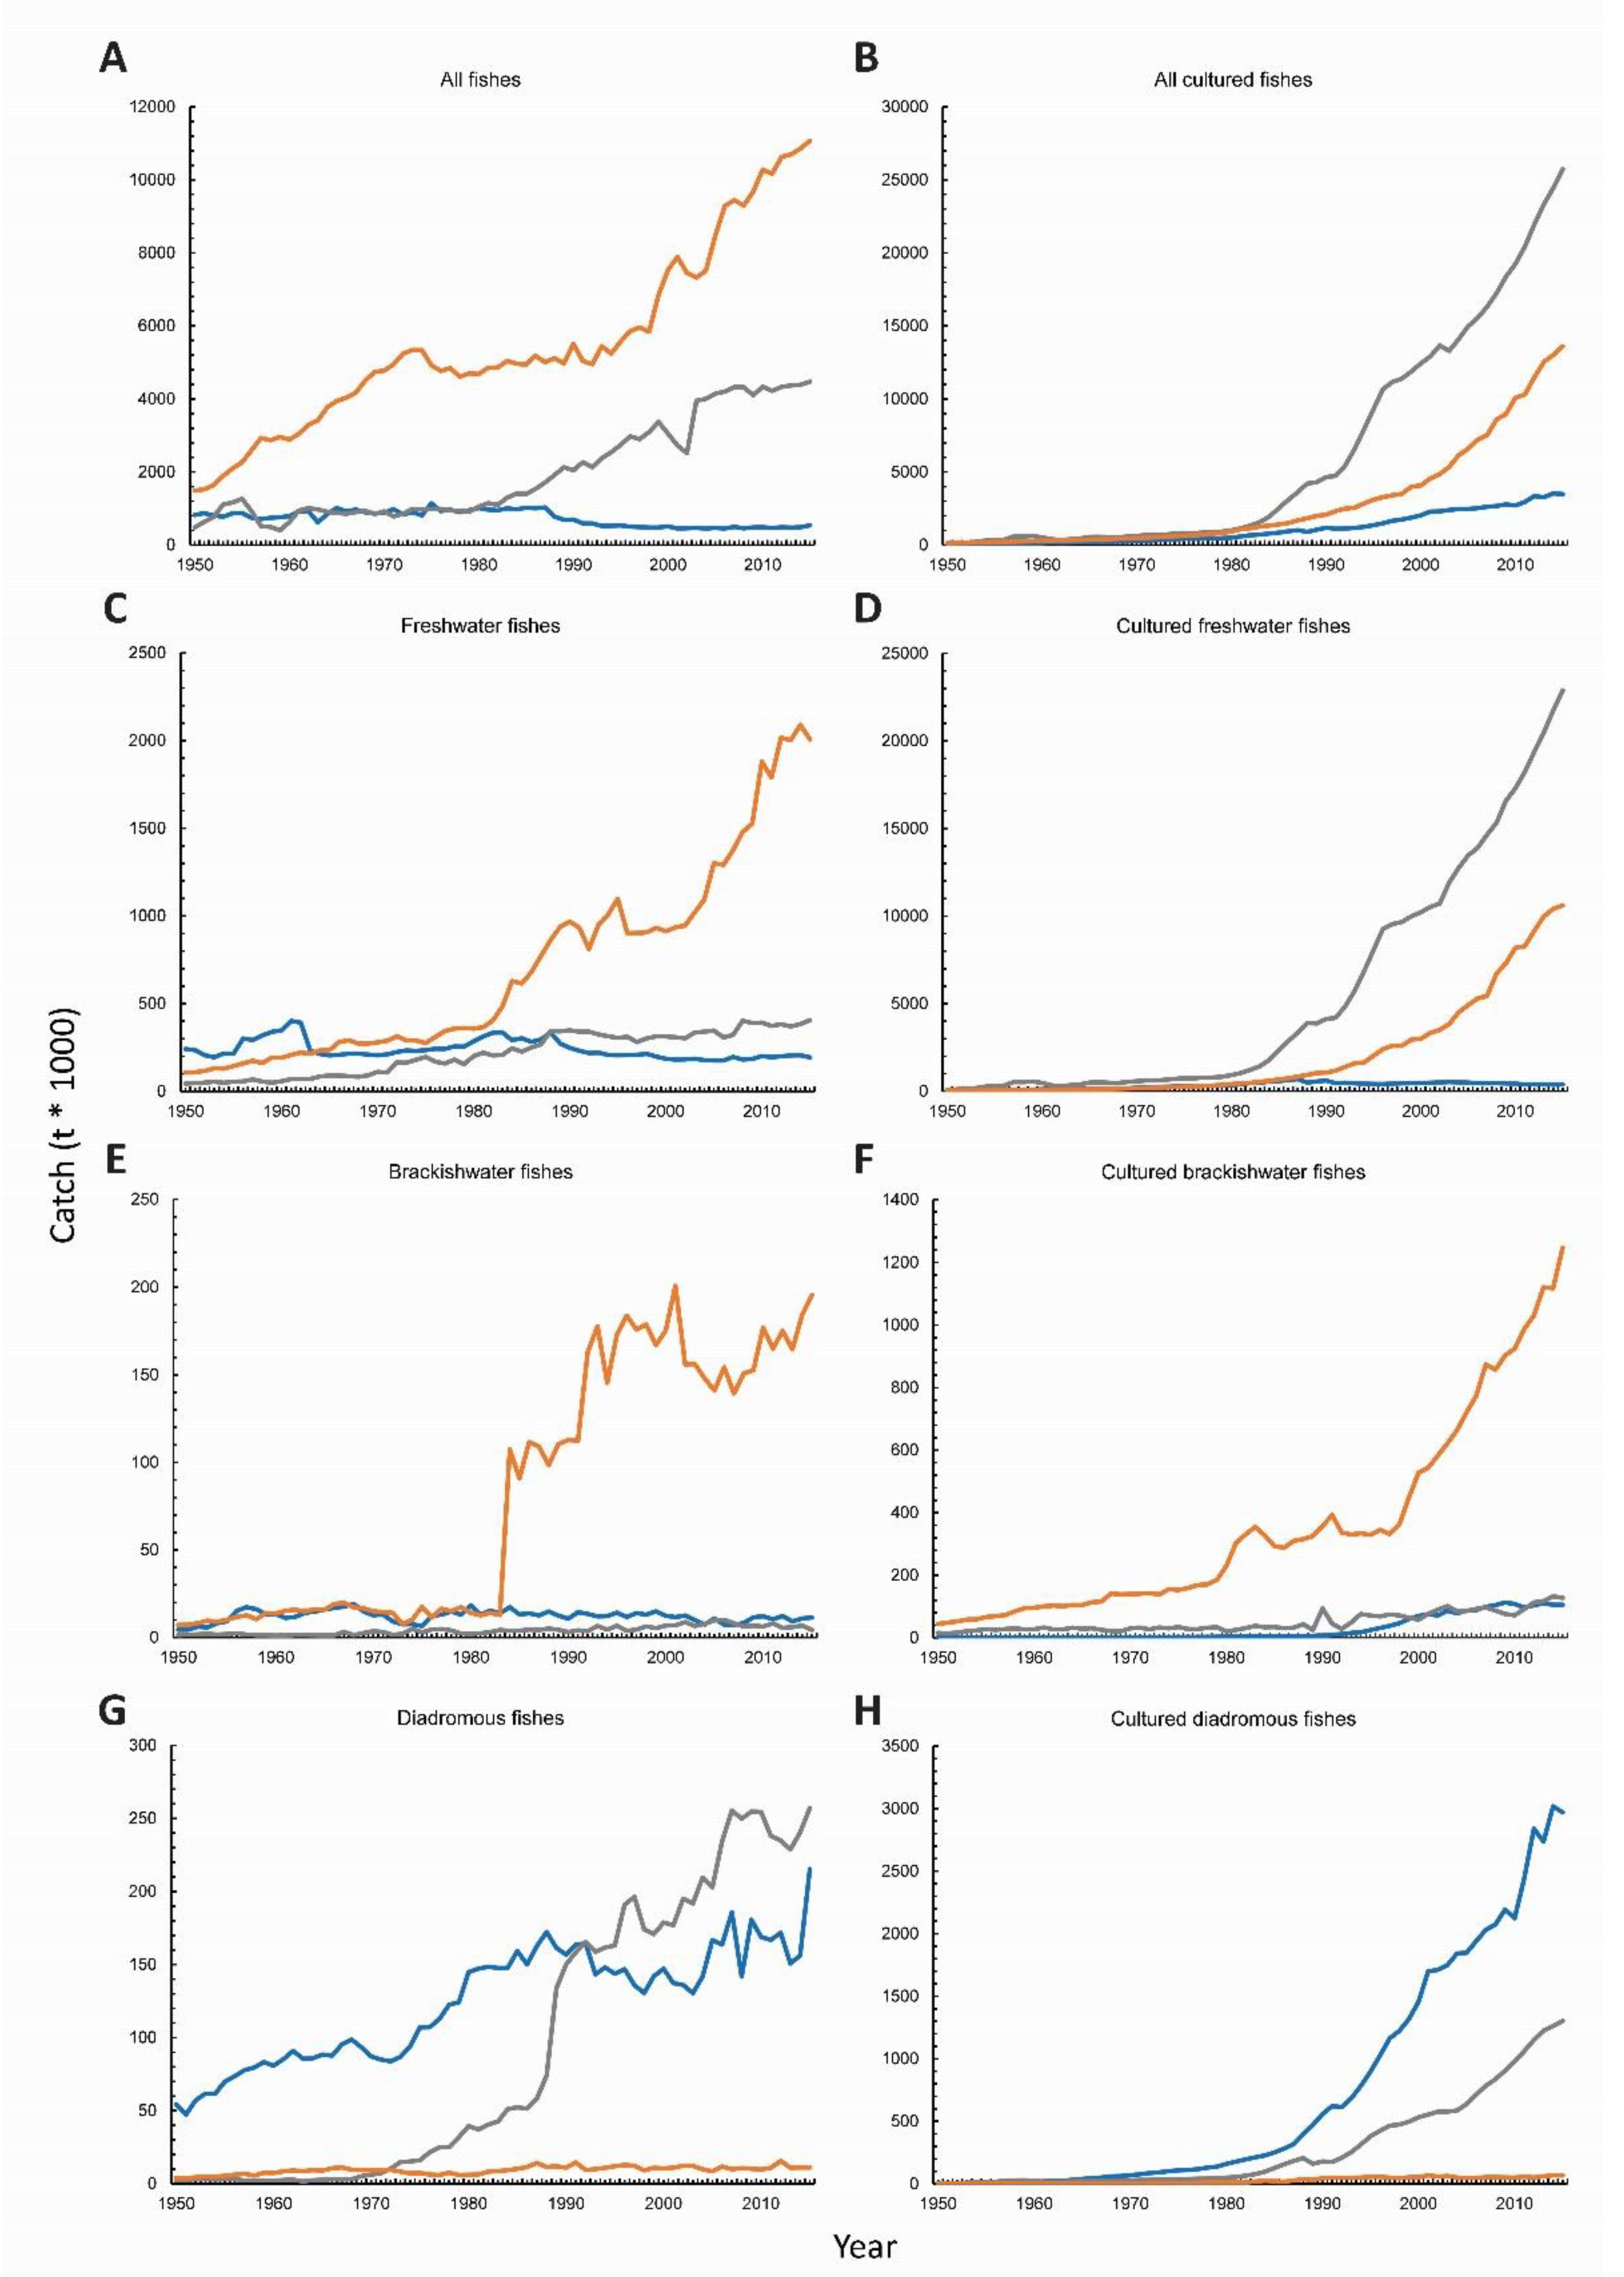
Reported overall global landings of inland capture finfisheries rose from approximately 2.8 million metric tons (MT) in 1950 to just over 16 MT in 2015, a nearly six-fold increase (
Figure 1A). Within this overall increase, different trends were seen for its HDI groups. In particular, landings for Tier-1 (the most-developed countries in 2015) decreased; while Tier-1 country landings comprised nearly 30% of global finfisheries in 1950 at 0.8 MT, by 2015 they comprised only 3% of the total at 0.5 MT. Meanwhile, Tier-2 finfisheries increased nearly 10-fold, going from 17% of the reported world catch to 27% at just over 4.3 MT. Similarly, landings of Tier-3 countries showed a seven-fold increase, going from 53% to 67% of the global inland finfisheries at 10.7 MT. In 2015, unidentified fish (e.g., Osteichthyes) were the most common species type caught by all countries when evaluated as a whole, comprising 74% of all reported landings for all tier groups combined. Overall, Cyprinidae were globally the second most reported group of fish at 5%, and
Rasterineaobola argentea (an African cyprinid) was third at 2%. The large number of unidentified species meant that only a quarter of the total global catch could be further assigned to either freshwater (16%), brackish (1%), and diadromous (3%) categories on a global basis (
Figure 1C,E,G), but freshwater species were the most important of this small portion of the total global catch (
Figure 1C). Notably, Tier-2 and Tier-3 landings dominated these values, and over 96% of reported Tier-1 landings (which were 3% of the global total) could be correctly classified.
Reported total global inland culture finfisheries also increased dramatically between 1950 and 2015, rising from about 0.2 MT in 1950 to nearly 54 MT in 2015, a nearly 180-fold overall increase (
Figure 1B). Different trends were again seen for different HDI groups, although all increased. Tier-1 culture finfisheries increased in size from 0.08 MT and 79% of world production in 1950 to 3.5 MT and 8% of global production in 2015, a 44-fold increase. In contrast, Tier-2 culture finfisheries increased from 0.07 MT to 25.7 MT in 2015, a nearly 400-fold increase and value which exceeds all global inland capture finfisheries and was 60% of global culture. Tier-3 countries witnessed a similar 460-fold increase to 14 MT, 28% of global finfish culture. Additionally, unlike global fishery landings, 85% of all species were identified, with similar numbers of unidentified species were seen in all tier groups. Globally, silver carp (
Hyopthalmichthys molitrix) was the most commonly cultured finfish at 14% of the world total, followed by grass carp (
Ctenopharyngodon idella) at 13%. Freshwater finfish culture dominated global culture, accounting for 79% of the world total, followed by 3% for brackish, and 10% for diadromous (
Figure 1D,F,H). While freshwater species production was especially important for all three tier groups, this was particularly true for Tier-2, as this group was 90% of their total production. Diadromous finfish culture was comparatively more important for Tier-1 countries for which they comprised well over three-quarters of all of their culture production in 2015. These trends are explained in greater detail below.
3.1. Tier-1 Finfish Capture and Culture
Reported Tier-1 capture finfisheries made up only 3% of global capture fishery landings in 2015 at 0.5 MT, a notable decrease from 0.8 MT in 1950 after peaking slightly at 1.1 MT in 1987 (
Figure 1A). In 2015, over 78% of the reported species for this tier were identified to a meaningful level (species or genus), with most (40%) being diadromous, 36% being exclusively freshwater, and less than 2% being brackish (
Table 1). These ratios have seemingly not changed in the past decade. Remarkably, a variety of countries from different continents (Asia, Europe, and North America) were found in this tier, with the Russian Federation having the greatest overall role (48%), followed by Germany (8%), and then Japan (7%). Most (78%) of all species were identified. In 2015, the Russian Federation was the largest overall contributor (48%) to Tier-1′s freshwater finfishery (48%), followed by Canada (11%), and then Finland (7%), with
Abramis brama,
Perca fluviatilis, and
Carassius carassius being of similar importance (about 10% each). Russia was also the largest contributor to the relatively small brackish water capture finfisheries, with reports of catching
Osmerus sp. (29%). Finally, the relatively large diadromous capture fishery associated with this tier was strongly dominated by the Russian Federation (69%), followed only by Japan (16%), and finally Korea (4%) with chum salmon also dominating (40%) these captures and the Japanese eel being next (13%), with much of these catches reflecting grow-out from aquaculture.
In contrast to the seeming decline in reported inland capture finfisheries for Tier-1 countries, overall reported inland culture finfisheries of Tier-1 countries has grown consistently, albeit slowly, since 1950, from 0.08 MT to 3.5 MT in 2015 (
Figure 1B,
Table 2). Remarkably, almost all fishes were identified to a meaningful taxonomic level (99%) in 2015, with about 11% of these fish being identified as freshwater, 3% brackish, and 86% diadromous, i.e., a much greater number of diadromous fishes than for Tier-1 capture fisheries (
Figure 1B,D,F,H). Different countries and continents dominated Tier-1 finfish culture more than capture fisheries: Norway (24%), Chile (16%) and the USA (13%). Culture of diadromous fishes has been growing especially quickly and greatly exceeded capture finfisheries by about 20 times in 2015 (
Figure 1H), while the freshwater and brackish finfisheries are only slightly larger than their wild counterparts. In 2015, the USA was the largest producer of cultured freshwater finfish (37%), closely followed by the Russian Federation (27%), with channel catfish,
Ictalurus punctatus (37%), being the most important, followed by common carp,
Cyprinus carpio (34%), and then the silver carp. Greece (35%) was the largest producer of brackish water fish in this small sector, with most being identified as the gilthead bream,
Sparus aurata. Norway (46%) accounted for almost half of all cultured diadromous fishes in this tier, followed by Chile (28%) (
Table 2). The most commonly cultured diadromous fish was Atlantic salmon,
Salmo salar (80%), followed rainbow trout,
Oncorhynchus mykiss (14%).
3.2. Tier-2 Finfish Capture and Culture
In 2015, inland capture finfish fisheries reported by Tier-2 counties comprised 28% of the world total at 4.5 MT, having grown more than 10-fold from 0.48 MT in 1950 and plateauing in 2010 at 4.3 MT (
Figure 1C). However, in 2015, only 16% of the species reported captured by this tier were identified, with 96% of these (i.e., only 15% of overall captures) being classifiable as freshwater, 3% as diadromous, and 1% as brackish. China accounted for almost all (90%) of reported inland finfish captured in 2015, but it identified very few species. Accordingly, Brazil (35%) dominated reports of identified freshwater finfish considered (common carp being the most important, and Characidae next). Most identified brackish water species in this tier were attributable to Iran (35%), with Mugilidae (79%) being the most important. China dominated the identified diadromous group (92%), with the Japanese eel (92%) being the most important amongst the very small number of fishes they identified. More detailed breakdowns seemed unreasonable given the low number of identified species, so they are not reported here.
Somewhat similar trends were seen for reported cultured as for the reported capture finfisheries by Tier-2 countries with huge increases since 1950 rising from 0.07 MT in 1950 to 25.7 MT in 2015, far exceeding global capture fisheries. Notably, over 97% of cultured fishes were identified to a meaningful taxonomic level in 2015 by this tier (
Table 2) which once again was dominated by China (95% of total in 2015;
Figure 1C). Almost all finfisheries cultured by Tier-2 countries were attributable to China, with most being fresh (90%). Grass carp (25%) and bighead carp (20%) were the most important species (
Table 2). In contrast, brackish water species were only about 1% of cultured finfisheries for this tier in 2015 and are seemingly growing at a slow and erratic pace. Turkey played a similar role (43%). Finally, diadromous fishes were about 7% of finfish culture for this tier group and were once again dominated by China (71%) in 2015, with Wuchang bream,
Megalobrama amblycephala, making the biggest contribution (61%).
3.3. Tier-3 Finfish Capture and Culture
In 2015, the overall capture finfish fisheries reported by Tier-3 counties was the largest of the three tier groups at 10.7 MT, comprising 67% of the reported global capture fishery, showing consistent annual increases since 1950 when it was only 1.4 MT, an eight-fold increase (
Figure 1A). However, only 23% of the fish were identified to a meaningful level in 2015 and of these, another 6% were simply categorized as Cyprinidae, making this family the second-largest group. Of the 23% of fish that were identified to some level, most were categorized as freshwater (98% or 22% overall), with only a few being categorizable as brackish (2%) or diadromous (1%). Three countries from central and southeastern Asia, Bangladesh (16%), Myanmar (16%), and India (15%), accounted for most of the overall inland capture data for Tier-3 countries in 2015. Most of the few fish that could be categorized as freshwater were Cyprinidae (35%), with India reporting most of this catch. Bangladesh reported most of the brackish species (69%), with
Tenulosa ilisha (72%) dominating. Again, the value of these breakdowns seemed questionable so further breakdown is not included here.
Somewhat different trends were seen for reported cultured inland finfish as for capture fisheries by Tier-3 countries. This group has also been reporting consistent increases in finfish culture since 1950, which, by 2015, amounted to nearly 14 MT, a value that exceeded that of their reported wild capture (
Figure 1B,
Table 2). Further, unlike for capture fisheries, almost all species (84%) were identified to a meaningful level. A slightly different combination of Asian countries than that reported for capture fisheries was noted as important: India (40%), Vietnam (16%), and Bangladesh (12%). Nearly 88% of all categorizable fishes were freshwater, most being reported by India (37%), with
Gibelion catla (26%) being the most important species. Nearly 10% of all other cultured fisheries were brackish, with Indonesia (54%) being most important, and the snakehead,
Chanos chanos (85%), the most important species. The Philippines (31%) was the next most important. Diadromous fishes comprised less than 1% of all identified cultured finfish for this tier group (
Table 2). This ratio of fresh: brackish: diadromous seemingly had relatively more brackish water species than Tier-2, but far fewer diadromous species than Tier-1. Comparisons with capture fisheries for this tier did not seem reasonable given how few were identified by the former group.
4. Discussion
Our proof-of-concept study describes trends in reported inland capture and culture finfisheries according to country HDI which clearly show that poorly and well-developed countries are following different trajectories. In particular, our study found that reported inland capture fisheries are increasing rapidly for the least-developed (Tier-3) countries irrespective of their location, but that they are also only reporting the identities of a small fraction of these species. Strikingly, the opposite trend is described for well-developed countries, who report catching few finfish but identity most of them. These trends are evident across locales within each of the three tiers, suggesting they are at least partially driven by as-yet unknown socioeconomic factors, which may also function as correlates. Meanwhile, finfish culture shows a different set of trends, growing very rapidly in the most poorly- and moderately-developed countries, and only slightly in well-developed countries, with all tiers identifying most species. While these trends support previous reports from individual countries [
1,
2,
3,
10,
11,
13], here, we show that they also characterize groups of countries defined by their stage of development, seemingly largely irrespective of specific location. The continuing increases in inland capture finfishes reported by poorly developed countries are thus of genuine concern and their basis and actual significance needs to validated and re-examined, especially because so many people in these countries rely on these fish for food. More sophisticated analyses of inland fisheries that include both socioeconomic and geopolitical variables appear warranted, especially for less-developed countries which need to manage them effectively [
1,
2,
3,
7,
8].
Perhaps our most important finding is that poorly developed countries as a group are reporting increasing inland capture fisheries, but not their identity. Indeed, so few fish are being identified that it is not possible to suggest how management might best proceed and overall confidence in data quality might be questioned. Further, at least some of these overall increases were accompanied by sudden and unexplained changes in the reported annual captures by many poorly developed countries such as India, Bangladesh and Myanmar (1,4,10)—further eroding confidence in reporting but also offering hope for improvement, although calling for further study. While most poorly developed countries in our analysis are from Asia (e.g., India, Bangladesh, Myanmar), many African countries (e.g., Nigeria, Uganda) are also found in this least-developed group, suggesting that common socioeconomic factors likely play a role. However, only 16% of all reported capture fishes are identified below family, so accuracy of the data seems especially questionable given discrepancies noted by other studies in a variety of African and Asian countries [
1,
7,
8]. It is not even clear what the origins (i.e., freshwater, estuarine, diadromous) of the captured fish are, although it appears that freshwater species may dominate, with brackish fisheries being a small but growing component of both capture and culture fisheries. It is very notable, then, that most cultured fish are identified—apparently, these two sectors are conducted, monitored and reported independently of each other. Future efforts to evaluate the status of global inland capture fisheries should consider both geopolitical and socioeconomic underpinnings. Data quality will need to be confirmed as others have also suggested [
1] (see below).
Interestingly, moderately-developed Tier-2 countries follow different trends than the poorly or well-developed tiers: their capture fisheries are stable while culture activity is rising rapidly. However, China accounted for 90% of all capture fisheries in this tier in 2015 (and thus 25% of the world’s catch), as well as 95% of all culture activity (and over 50% of world aquaculture). Thus, the overall trends we describe here for Tier-2 reflect those of China and not necessarily the sector as a whole. Indeed, the trends we describe (stable but poorly understood inland capture fisheries, but rapidly increasing culture) match those previously reported by other studies for China [
1,
10,
11,
12,
13]. Nevertheless, Thailand, Iran, and Brazil also all have roles in this tier and report capturing and culturing different suites of species of fish than China, and seemingly also identifying far more for them [
10]. This might be facilitated by a more distinctive fish fauna. Chinese finfish culture, like that of other countries found in this tier, identifies most species and is dominated by freshwater carps, as previously described [
2,
3].
Lastly, we describe evidence that reported capture fisheries of well-developed countries are unique. Only for this tier are reported capture fisheries falling, while culture production is rising very slowly. Further, only this tier identified the majority of the species (78%) it reported capturing or culturing. Notably, all well-developed countries irrespective of location seemed to show similar trends, including some from eastern Europe/ northern Asia (the Russian Federation), Western Europe (Germany), Northern Europe (Finland), East Asia (Japan, Korea), and North America (Canada, USA). Different countries dominated culture (e.g., Norway, Chile) versus capture fisheries (e.g., Russia; see below), as well as different species, unlike for Tier-3 countries. Unlike Tier-2 finfisheries, little annual variation is seen in country reporting. The Russian Federation has the largest inland capture fisheries amongst the well-developed countries, dominating freshwater, brackish, and diadromous sectors and reporting the most species [
1,
10]. Further analysis of this entity’s captures is warranted because the Russian Federation contains a variety of countries with different HDIs which left it when the USSR dissolved. One possible explanation for declines in capture fisheries in Tier-1 countries as a whole is a likely shift to recreational fishing amongst their older, better-off populations [
10]. Recreational fishing is rarely measured or reported to the FAO [
1], yet its value has been shown to exceed that of commercial inland fisheries by as much as 10 times in the United States, Republic of Korea, Norway, and Australia [
10]. It likely exceeds that of reported commercial fishing. This needs to be closely evaluated in future studies, especially because determining the possible role of habitat degradation in their decline could enlighten interpretation of Tier-2 capture fisheries.
This study is the first of inland culture finfishes aside from FAO reports [
2,
3,
4] and finds that culture finfisheries are growing in all socioeconomic tiers, but especially Tiers 2 and 3. Notably, all tiers are identifying most cultured finfish, similar to the situation for mariculture [
17], suggesting that these data, unlike for capture fisheries, are accurate. This may not be surprising given that aquaculture facilities are relatively easy to monitor. As widely reported by other studies, and mentioned above, our study shows that finfish culture is growing especially rapidly in China. That China and other Tier-2 countries should increasingly dominate inland culture makes sense because intensive finfish culture requires strong infrastructure for feed acquisition, transport, aeration, and water treatment, as well as strong demand including a global market and fewer restrictions on water usage, as is a factor in Tier-1 countries. Centralized markets may be important to these trends. Conversely, aquacultural development may be held back by the high value placed on waterfront for recreation in well-developed countries. Most cultured finfish appear to be from fresh (vs. brackish) water, as also suggested by an economic analysis by Funge-Smith and colleagues [
3,
10]. Although not surprising, diadromous species, and salmonids in particular, are important to well-developed countries. The present analysis did not consider the role of feed or baitfish, which should be examined in the future, could be important in better-developed countries and are likely unreported. Finally, aside from the salmonids, it is notable that few species are simultaneously important to both capture and culture, suggesting that culture fisheries may not have a large role on capture fisheries, but this will require a more intensive analysis of capture fisheries than we were able to perform using uncorrected or enhanced FAO data here.
While our study describes clear evidence that human development influences how inland capture and culture finfisheries are conducted and then reported, it importantly does not explain why this is so, and that will require future study. Socioeconomic factors likely play a multitude of causal and correlative roles. A role of HDI in global inland fisheries does not dispute that geopolitical factors play important roles in global inland finfisheries, but merely suggests that geopolitical factors alone may not explain all trends. Nevertheless, social, economic, and practical considerations (ability to identify small tropical fishes) all might well explain why less-developed countries are not identifying species and very likely are strongly affected by local geopolitical factors. For instance, well-organized market economies with central market systems may help explain some trends in Tier-1 countries. Conversely, subsistence and artisanal fisheries are known to be especially important, but also largely unreported in poorly developed African countries that identify few fishes and appear to have major reporting issues [
8]. This possibility is also supported by a lack of poorer African countries (except for Ugandan freshwater fisheries) in our analysis as well as in other studies [
7]. Undoubtedly, all components of HDI including wealth, level of education, and longevity/lifestyle factor into whether and how fishes are exploited and reported, and all deserve future attention. Of course, the species of fish involved may also play a role because many of the smaller fishes caught and eaten in poor countries cannot be identified easily. Interestingly, high HDI countries also appear to exploit marine fisheries in different manners than lower-HDI countries, although with access to open-ocean fishing technologies [
20]. Although our results do support the preliminary 2003 analysis of HDI [
15], it was beyond the scope to the present study to examine trends in countries’ HDIs across time (and this should be examined). Further, we only examined finfisheries, the largest and most important component of inland capture and culture fisheries [
1,
2,
3]; other future studies should examine the variety of freshwater flora and fauna which are reported as part of inland fisheries. We strongly suggest that all of these variables be considered in future studies of global fisheries. One way forward might be to use diet analyses [
20] to estimate actual inland captures, thereby allowing catch reconstruction using population dynamics models to forecast back in time and examine possible roles of various factors such as economic development, education, population growth, and environmental quality [
21]. The excellent work already conducted by others might be leveraged in this manner [
1,
2,
3,
7,
8,
10,
11] to reach a more complete understanding. Inland fish culture also warrants further study but, as our study shows, further work on corroborating species identification may not be needed for Tier-1.
In summary, our analysis suggests that socioeconomic factors have complex, but as-yet poorly understood direct and indirect roles in inland capture fisheries that function together with geopolitical factors to determine the nature of these fisheries and how they are reported—future study is needed and warranted. Although this finding may not be surprising, it is valuable because it suggests new directions to understanding these vitally important fisheries. For instance, we suggest that inland capture estimates might be further examined by country location as well as income, education level, and longevity, and then calibrated by diet analysis [
8,
20] or other means, including examining previously unreported government data reports [
21], to validate capture rates, and from there to extrapolate meaningful historic trends (i.e., “fisheries reconstruction” [
21]) to permit hypothesis testing. In addition to key work on poorly developed countries using catch reconstruction, well-developed countries would also be an easy place to start because their reported data appear to be of good quality, recreational and culture data are presumably available as well as environmental data, and these countries are found in many geographic regions—permitting global lessons to be drawn. How and why inland capture fisheries can seemingly be falling in well-developed countries, which have some of the best-managed ecosystems and fisheries, yet rising rapidly in the least-developed countries which do not, remains an enigma that deserves new answers and approaches.


 First-tier (blue, well-developed);
  Second-tier (gray; moderately-developed);
  Third-tier (orange, least-developed). (A). Global inland freshwater capture fisheries; (B) global inland cultured finfishes; (C) inland freshwater finfish capture fisheries; (D) inland cultured freshwater finfishes; (E) brackish water finfish capture fisheries (fishes whose main habitat is brackish water and are not migratory); (F) cultured brackish water finfishes; (G) diadromous finfish capture fisheries (fishes that migrate between marine and freshwater habitats); and (H) cultured diadromous finfishes. Note: over three-quarters of all fish caught by Tier-2 and Tier-3 countries were not identified.

