Article

Monitoring of Field Patrolling Efforts, Vietnam: Insights from a Forest Station in Pu Hu Nature Reserve

1
Faculty of Environmental Management, Prince of Songkla University, Hat Yai 90100, Thailand
2
Department of Agricultural and Rural Development, Thanh Hoa City 440000, Vietnam
3
Faculty of Economics, Tay Nguyen University, Buon Ma Thuot City 630000, Vietnam
4
Faculty of Agricultural Technology, Hung Vuong University, Viet tri City 29000, Vietnam
5
Faculty of Finance-Banking and Business Administration, Quy Nhon University, Quy Nhon City 55113, Vietnam
*
Author to whom correspondence should be addressed.
Sustainability 2021, 13(15), 8407; https://doi.org/10.3390/su13158407
Submission received: 15 March 2021 / Revised: 24 May 2021 / Accepted: 24 May 2021 / Published: 28 July 2021
(This article belongs to the Section Sustainability, Biodiversity and Conservation)

Abstract

:
In the various protected areas such as nature reserves and national parks in Vietnam, ranger patrols are crucial for protecting forest resources against the increasing threats from fringe communities. Previous studies have investigated ranger patrol efforts (RPEs) in conservation areas using conventional measures in terms of illegal activities encountered, but there has been little research into indices related to RPEs in the field, both worldwide and particularly in Vietnam. This paper explores various indices of RPEs and other aspects of forest patrolling at a local level. The number of rangers and patrol-days strongly influences the distance walked and the number of patrol-hours. However, neither the rainy season nor the Lunar New Year festival had any significant effect on patrol efforts, nor was there any effect on the relative altitude covered or the speed of patrolling during the long Lunar New Year vacation. Management responsible for protecting forest areas needs to consider the full scope of rangers’ efforts and identify the qualities of motivated staff. Our findings suggested ways in which rangers’ capacity to promote conservation may be assessed in the future.

1. Introduction

In many protected areas (PAs) in tropical forests, biodiversity loss and forest depletion are a consequence of the illegal use of resources because of social demand [1,2,3]. Demand is a dimension of conservation which is fundamental in social development and the implementation of sound policy [2,3]. As other researchers have reported, timber harvesting, poaching, non-timber forest production harvesting and agricultural encroachment are the main threats to biodiversity conservation [4,5] causing significant declines in forest resources and diversity [2]. Even though residents living in and around the forest are aware of the value of PAs and they have been considering the tragedy of common, they prefer personal gain [6]. Thus, there is emphasis on the balance between conservation management in Pas and human requirements, and the importance of understanding how different activities impact forest protection [6,7]. However, people continue to pursue their economic goals despite human impact endangering the system [5,8], and adversely affecting protected areas [9].
The main target of protected area management is to preserve the whole of the ecosystem and its biodiversity [10] through the strict protection of the forest as a “sanctuary of nature” with only limited human activities allowed [10,11]. However, the implementation of forest protection through PAs affects stakeholders such as local communities, as well as international organizations and government agencies responsible for providing rangers [12,13]. Reducing the scale, extent, and negative effects of illegal activities is a priority for conservation practitioners and increasing law enforcement efforts through an increase in ranger patrol efforts (RPEs) is a means of achieving this [14,15]. Thus, management of RPEs is key to improving long-term forest management strategies in protected areas in Vietnam [16,17].
Patrol-based (also known as ranger-based) monitoring programs have increased throughout the world [10], and have been one of the mainstays of conservation initiatives [11]. This has increased the importance of ranger performance in the field. In particular, in special-use forests, the forest ranger is the key player [4,8] in identifying and preventing illegal activities by regularly and visibly patrolling and ultimately, limiting human access to the forest and thus controlling the occurrence of illegal activities [18]. Most patrol routes are established in areas of the forest which are more likely to attract illegal activities, especially areas with rich natural forest resources [12], and through a combination of different conservation efforts, a significant reduction in illegal activities can be achieved [1,19]. Previous research has shown that illegal activities have emerged as a serious threat to conservation in various protected areas [20,21] and better law enforcement practices are necessary to protect nature reserves (NRs). This includes security and guarding procedures and responding urgently when illegal activity is encountered unexpectedly, as well as presenting progress reports on previous activities and predicted future issues [22,23] which suggested that strong law enforcement within protected areas is of great importance in ensuring the conservation of biological diversity. Further, an effective monitoring system gives good feedback to the forest protection management [24,25]. The evaluation of the capacity and performance of a forest station as to whether it is effective in forest protection is an urgent issue for conservation planners at different levels [26]. Activity reports, which provide valuable information about the progress of forest management in protected areas [24,27,28] are a useful tool in this evaluation. However, even if a dramatic decline in illegal activities can be achieved due to enforcement practices, there are still great benefits to be attained through extensive patrolling activities [29].
There is no doubt that staff perform better and collect better information on the effect of conservation if their morale is high, with more effective patrol outcomes per day/staff, greater distance patrolled, and more poaching encounters over longer periods [16]. These performance improvements bring the advantage of supplying regular and speedy information on the occurrence of illegal activities by ranger patrols [30]. Furthermore, patrol-hours and patrol-distances were not different in specific seasons [30], for instance, during rainy seasons or in seasons when crops were being grown in the forest. However, few studies have considered the effect of other external indicators such as patrol speed and the relative altitude covered by ranger patrols, although both are critical in maintaining the rangers’ motivation [24]. Further, there has been little research devoted to patrol efforts in protected areas in Vietnam, nor on the effect of patrol efforts on long vacations such as at the Lunar New Year. Based on records relating to poaching or logging activities, previous researchers have found the high relationship between the number of camp senior officers and the number of illegal activities encountered during patrolling when measured on a quarterly basis [28]. In contrast, it is argued that this was statistically unrelated to wildlife trends. Interestingly, because of spatial and temporal changes in illegal activities, typical patrol routes throughout sensitive forest areas need to be varied, even in forest areas least affected, and with the best record of conservation [8]. It is notable that when law enforcement efforts decrease, the risk to conservation increases, and illegal activities in large protected areas may directly result from lower patrol efforts [24]. Further, it is found that in spite of 60% of a forest zone nominally patrolled by rangers, they effectively patrol only 22% of it [24]. Overall, however, RPEs present a significant opportunity to discover a large number of illegal activities.
Maintaining the effectiveness of RPEs is an important problem faced by all protected areas in Vietnam, such as Pu Hu Nature Reserve (NR). The ranger patrol monitoring system is a major management tool for surveillance and forest protection by which conservation is achieved [21]. Patrol performance is measured based on patrolling days, hours, distance, speeds and relative altitude, which are the most important aspects affecting how difficult it is for rangers to work in the field. Further, physical threat [31,32] and insufficient or improper equipment to regulate law enforcement efforts [33] may also have an impact on the effectiveness of RPEs.
Pu Hu NR has implemented monitoring of routes using GPS data logging devices and it is currently one of the most well-known protected areas in Thanh Hoa Province as well as throughout the whole of Vietnam. The results of ranger efforts and the current illegal activity through regular patrol-based monitoring are announced in monthly meetings of rangers. In addition to the ranger-based monitoring system, the management board has also committed to exchanging rangers between forest stations to reduce any bias in patrol report over the long term.
The research reported in this paper sets out to understand how the monitoring of the patrol system works to aid adaptive management, by examining monitoring at the largest forest station in Pu Hu NR, namely the Nam Tien Forest Station (FS). The dual objectives of this study were to (i) quantify patrol performance and (ii) analyze the factors which influence RPE effectiveness during the period studied. The study aims to support local forest authorities in the future management of forest conservation.

2. Materials and Methods

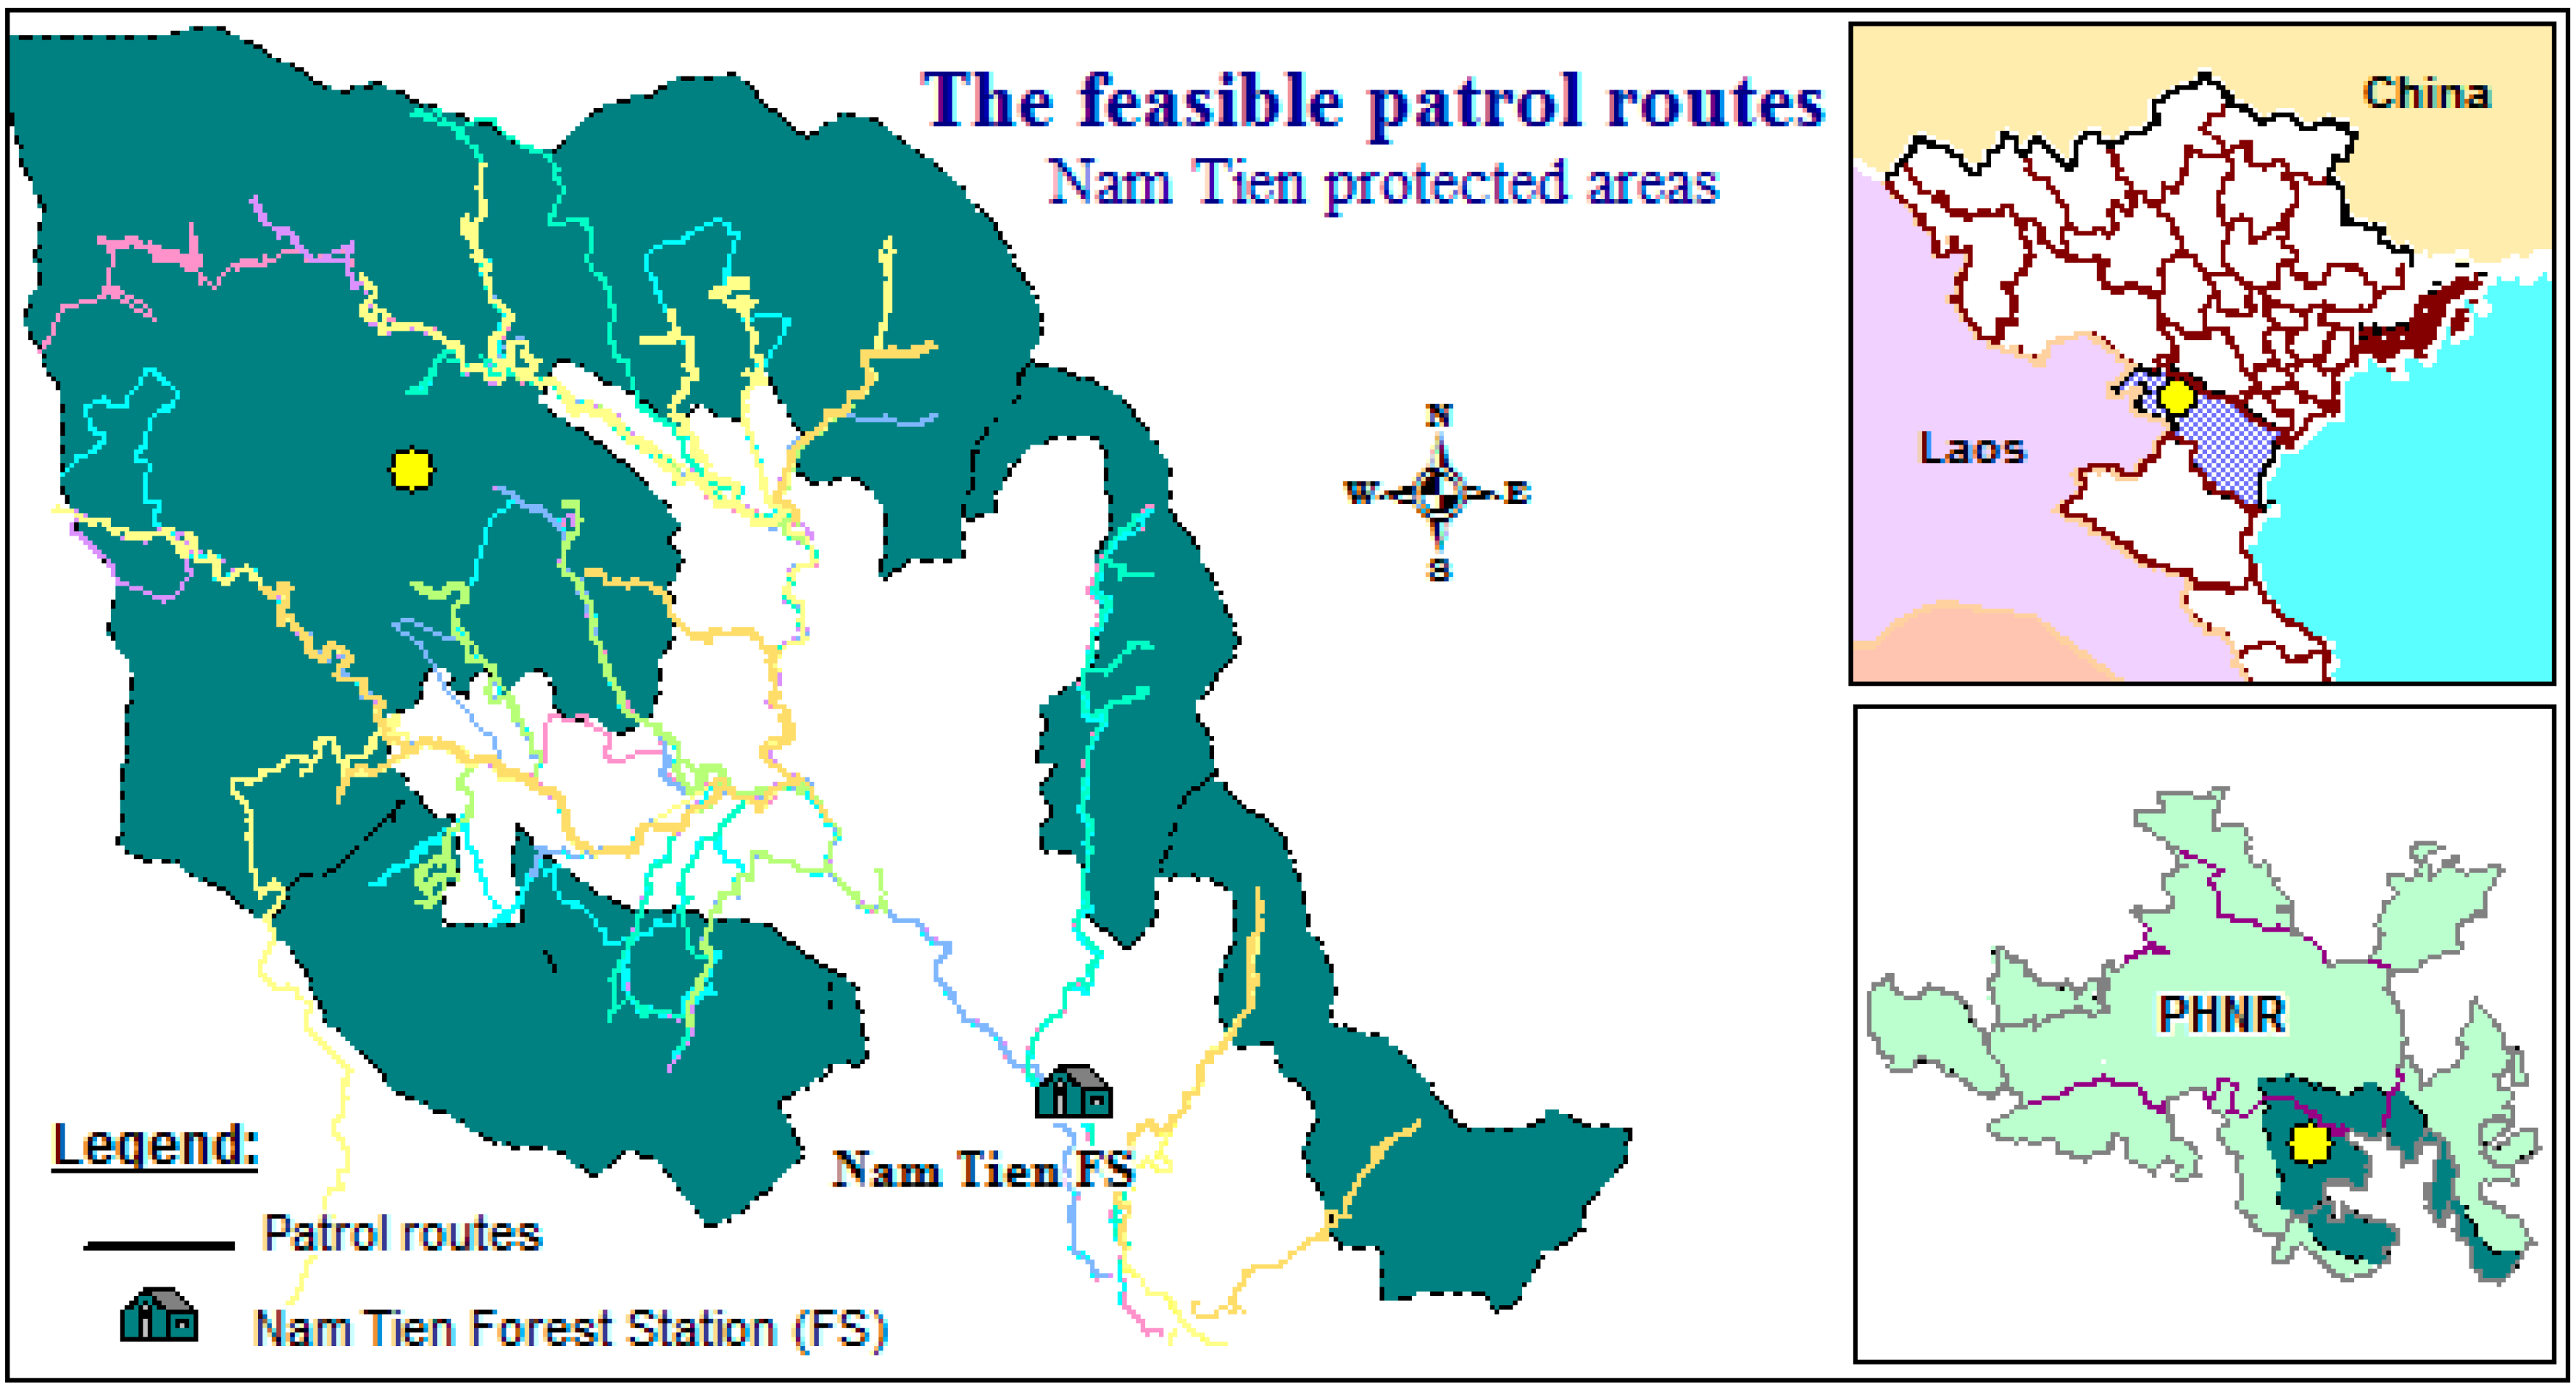
2.1. Area of Interest

Pu Hu NR is located in Quan Hoa and Muong Lat districts in Thanh Hoa province, and extends over 28,000 ha. It is a rugged, mountainous area between latitude 20°30′ and 20°40′ N, and longitude 104°40′ and 105°05′ E, in the northeast of Vietnam (Figure 1). It was established as a special-use forest area in the year 1999 by the government of Vietnam and is governed by Pu Hu Management Board. It is home to a variety of rare and endangered animals and plant species. Since establishing the NR, all extraction of flora and fauna has been banned. Forest control stations have been established to enforce this regulation. Therefore, protection is the primary management issue in Pu Hu including restriction on the extraction of bamboo, roof thatching materials, firewood and medical plants, as well as cattle grazing and other economic activities conducted by residents in the surrounding areas [31]. Thus, the NR has come under high pressure from people in the immediate area. This is particularly true for Nam Tien FS, which, amongst the six forest stations and one sub-forest station, is the largest and closest to Quan Hoa town center. This has required forest rangers to consider how to enforce the law while facing the loss of access and economic benefits suffered by the local people which has given rise to frequent conflicts [34,35].
As explained above, this research focused solely on Nam Tien FS which protects an area of almost 5000 ha, which is divided into nine sub-area forest plots. The permanent or non-permanent rangers responsible for protecting the forest areas are in charge of the practical enforcement of the law in the forest area. The fully protected area is bordered to the northeast by a buffer zone with around 423 households and 1512 inhabitants in 12 villages constituting 2 communities, namely Nam Tien and Thien Phu communities. Compared to other forest stations, the villages have the highest population density and most of the inhabitants in the buffer zone areas under Nam Tien FS live in them.

2.2. Data Collection

The protected area in Nam Tien FS, under Pu Hu NR areas, apply conventional law enforcement methods using foot patrols. Most of the patrols are conducted by staff based in nearby FSs, and are recorded as transects with fixed location points. For such location points (waypoints), information on patrolling is recorded containing the name and the number of officers on patrol, the duration of the patrol and the location of forest sub-area plots [24,28]. However, the main technical analysis is carried out by forest officers in the central office of Pu Hu NR.
This study focused on Nam Tien FS, and was based on data collected from January to October 2017 (around 10 months) from the database in the central office. All the major patrol routes shown in Figure 1 were commonly conducted by local rangers from Nam Tien FS, where a GPS-based monitoring system was in place [28], and the typical patrolling activity was conducted by one, two, or, less frequently, three rangers, using a hand-held GPS unit to record their location [11] in conjunction with a topographic map of the particular area [26,36]. RPE was evaluated based on man-days patrolled per month which was calculated based on the number of rangers on patrol multiplied by the number of hours patrolled (where one day is regarded as an 8 h patrol-day) [24]. All available activity reports were incorporated into a standardized database containing the following information: monthly report, number of patrol staff on each track and the patrolling location [11].
The patrolling activity was sometimes re-checked and evaluated by mobile teams in the Department of Law Enforcement and the ranger patrols were supplemented by nature protection groups from the adjoining villages. After each patrol, information was recorded in data sheets or patrol staff logbooks [26,36] and these were tabulated into a summary consisting of Excel worksheets which were submitted to the director of the Pu Hu NR and discussed in monthly meetings.

2.3. System of Patrol Planning and Operation

Regular weekly meetings of rangers were held at the Nam Tien FS to discuss the information collected on each patrol track and this was also discussed daily in conversations among the rangers at the Nam Tien FS. Short patrols were conducted in the sub-areas but some long patrols lasting several days were also conducted if the rangers considered that this was necessary [25]. The need to alter the pattern of patrols was thus approached according to lessons learned, and plans were adjusted and adopted as required. Where necessary, strategic ambush night-patrols focusing on specific locations were planned, according to the situation. Such patrols might split the ranger team into different groups to patrol different tracks and were often based on secret information obtained from informers or through intelligence work in the communities [36]. The head of the FS was responsible for planning the distribution of the rangers to each team for patrolling the forest sub-areas [31]. Due to the high level of illegal activity, local villagers could also be organized into a patrol group. Predictable patrol routes and their timing were altered, and liaison with ranger teams from adjacent forest areas could be arranged. Additionally, the style of patrol movement adopted might also be altered from “single file”, to an “arrow head” configuration’ depending on previous information from earlier patrols [30].
Patrol movements and starting times from the forest station need to be unpredictable [24,28]. Naturally, the patrol teams cannot always follow the patrol plan set, as often observations along the track being patrolled make a change of strategy necessary. Briefly, in Nam Tien, the patrol strategy is divided into three classes: (i) daily patrols covering a radius of 4–13 km, (ii) duration of patrols comprising between 6 and 8 patrol-hours/ranger/month which is the local policy of the Pu Hu Management Board and (iii) strategic patrols covering areas with specific issues and areas where there are potentially drastic negative impacts on biodiversity. Such patrols are often undertaken in response to intelligence information [25].

2.4. Estimating Ranger Patrol Effort

Generally, the target sub-area forest plots are about 10 to 45 min away from Nam Tien by motorcycle after which patrols are conducted on foot, so that the exact starting point of each patrol cannot be identified even though a GPS is used. Accordingly, when initiating the location by the GPS device, the supervisor has to estimate the starting point and ending point of the route and then base the route itself on waypoints located during the patrol [22,31]. Both Google Earth and MapInfo software are then used to analyze and estimate the probable routes of the patrols (Appendix A).

2.5. Data Analysis

A standard measure of the patrolling effort of dedicated and motivated rangers is required to provide feedback to management to enable them to steer field operations [24,28] in protected areas. From January to September 2017, all the data from the patrol groups was analyzed by a supervising officer in the central office to establish the number of staff and starting time points for each track. Further, the number of patrol kilometers walked, team days spent, and the relative altitude covered [37] based on measurements from the GPS device were estimated using the Google Earth software application. All the technical data vetted and accepted by the supervision section was transferred into Microsoft Excel from which the final report and descriptive statistics were prepared. SPSS version 20.0 was inferentially used to analyze the data and determine any significant differences (p < 0.05) among the variables in different times and events. Values were presented as mean ± SD (standard deviation). Descriptive statistics were used to summarize the illegal activity found by the patrols. The data relating to illegal activity by different routes was grouped together, and totals and averages per patrolling route were calculated. Data were not normally distributed; therefore, non-parametric statistics were used in the analysis with the Spearman’s rank correlation being used to derive correlation coefficients and the Kruskal–Wallis and Mann–Whitney tests being used to compare means for significant differences.

3. Results

There were several patrols along tracks through each sub-area forest plot which were conducted on foot by rangers (Figure 1). All the patrol routes were established to cover areas sensitive to biodiversity loss and illegal activity (Table 1). The sub-areas further away from Nam Tien FS have larger areas of forest.

3.1. Quantify of Patrol Performance

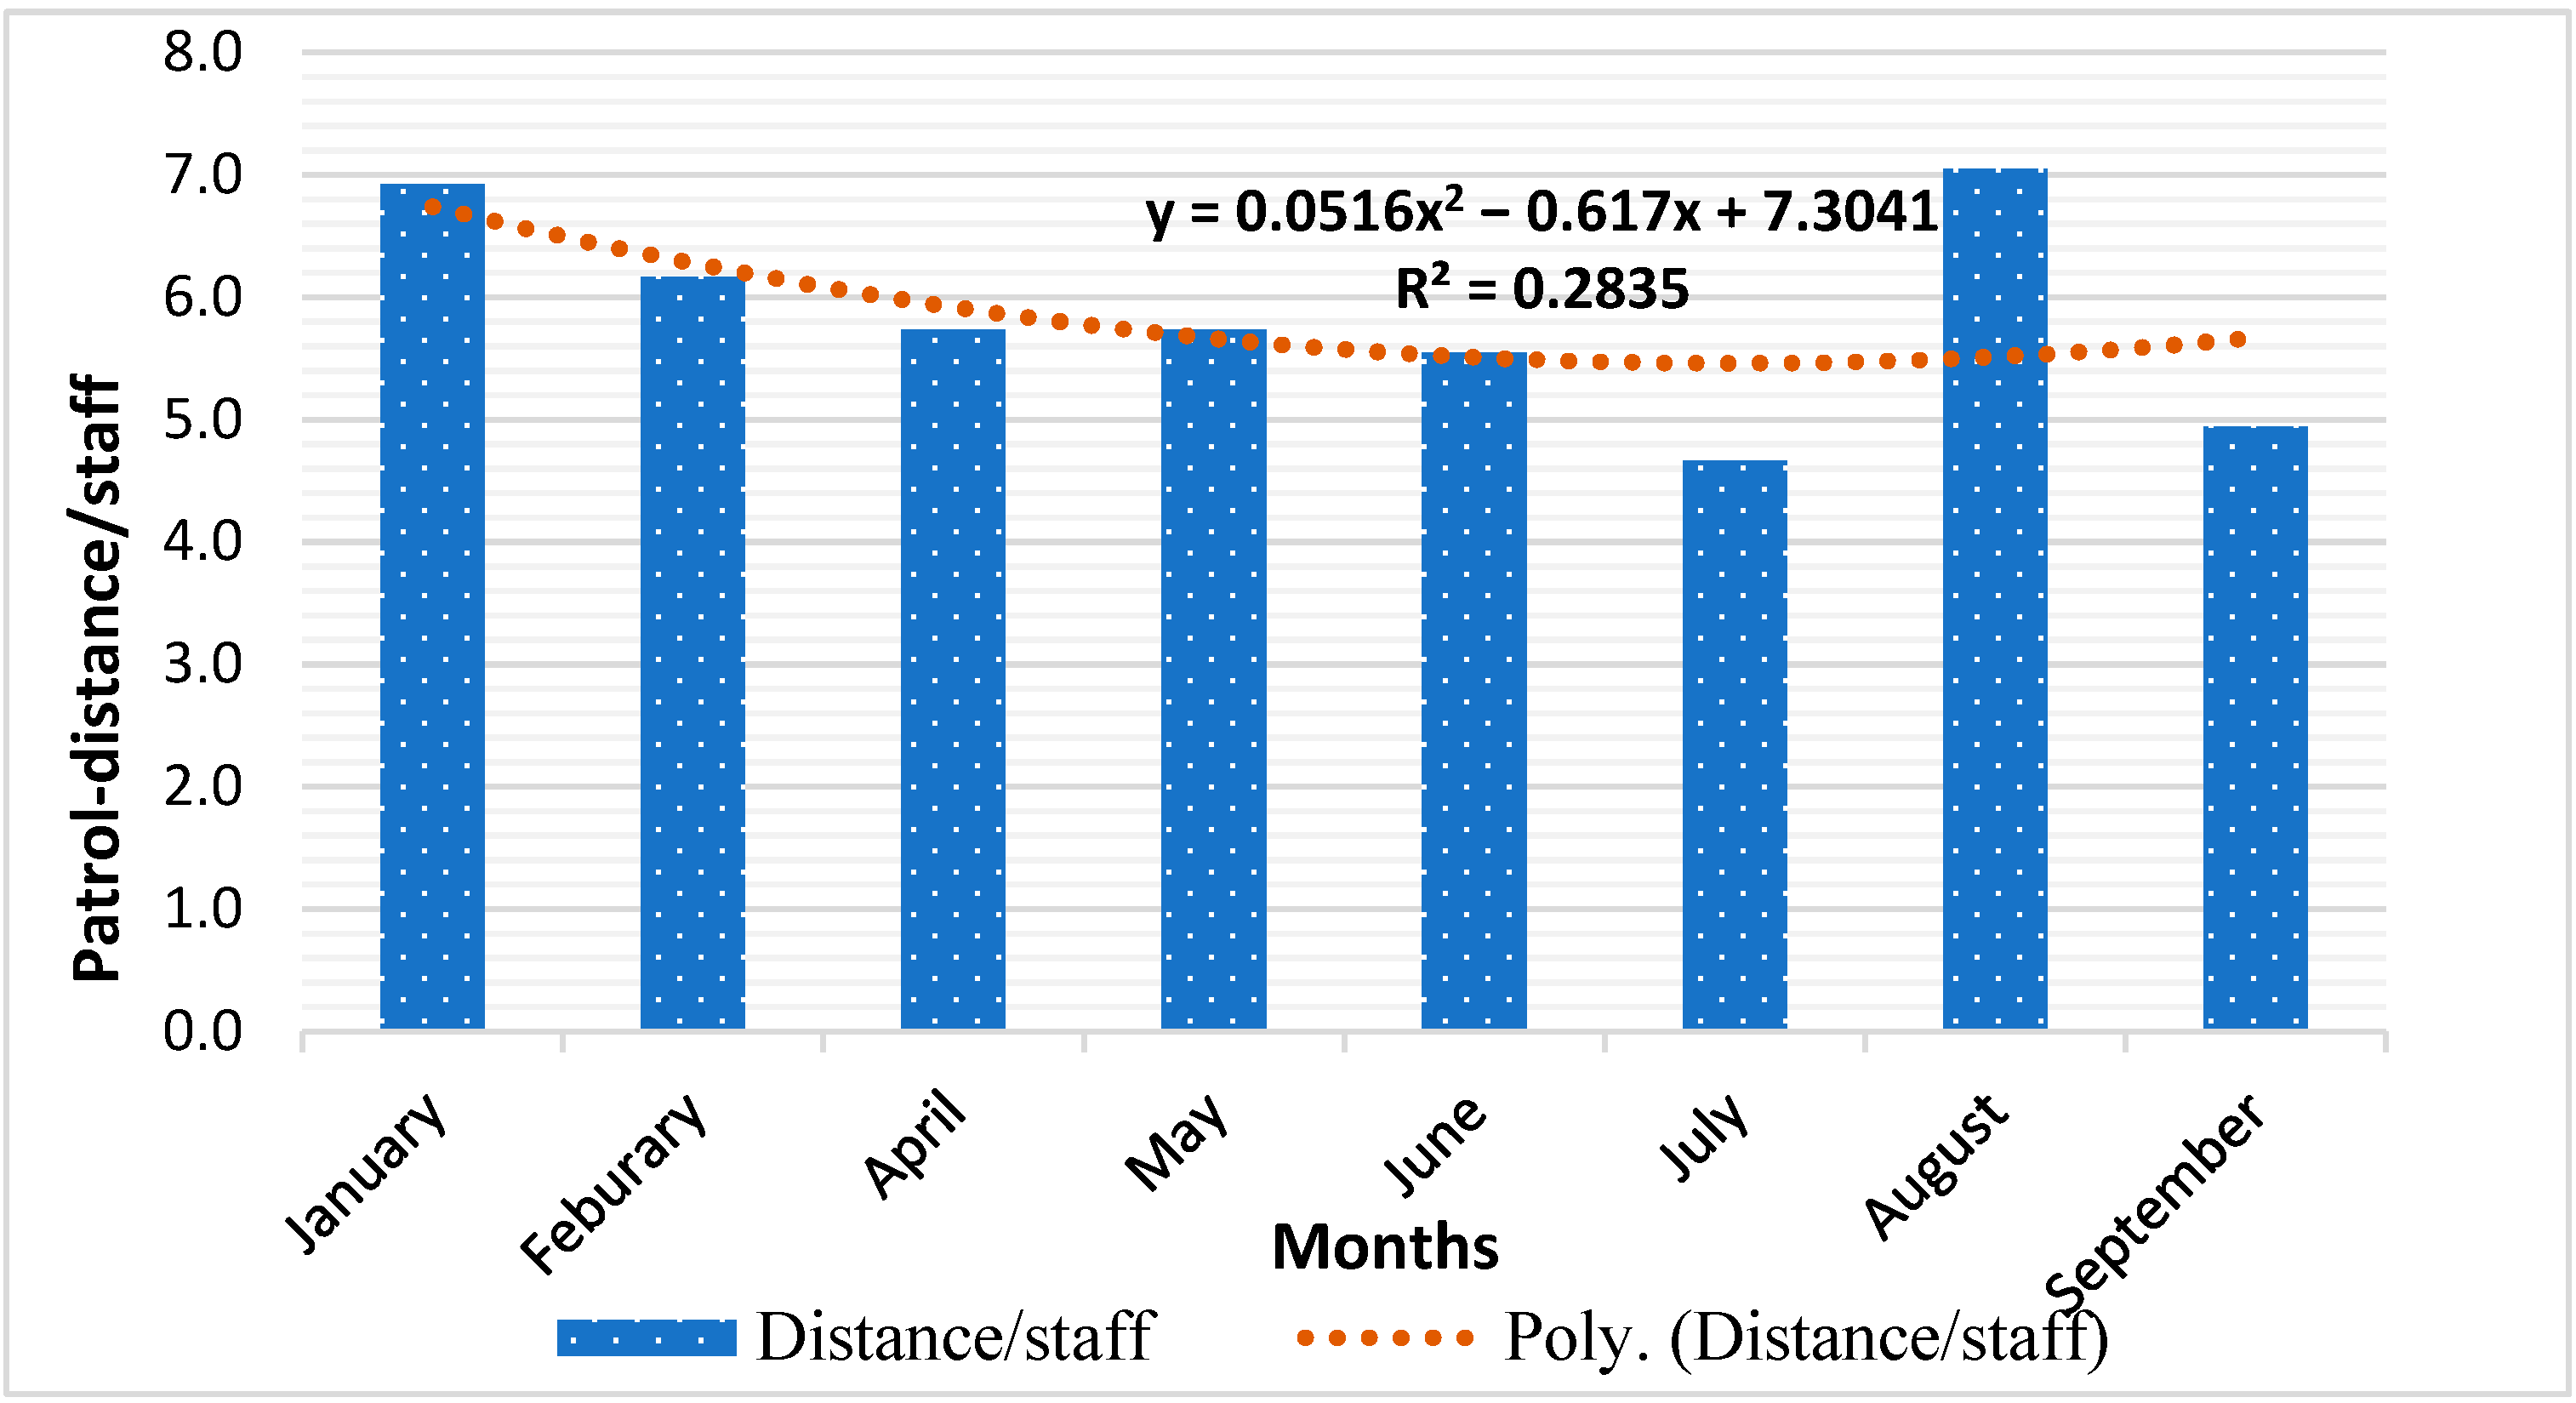
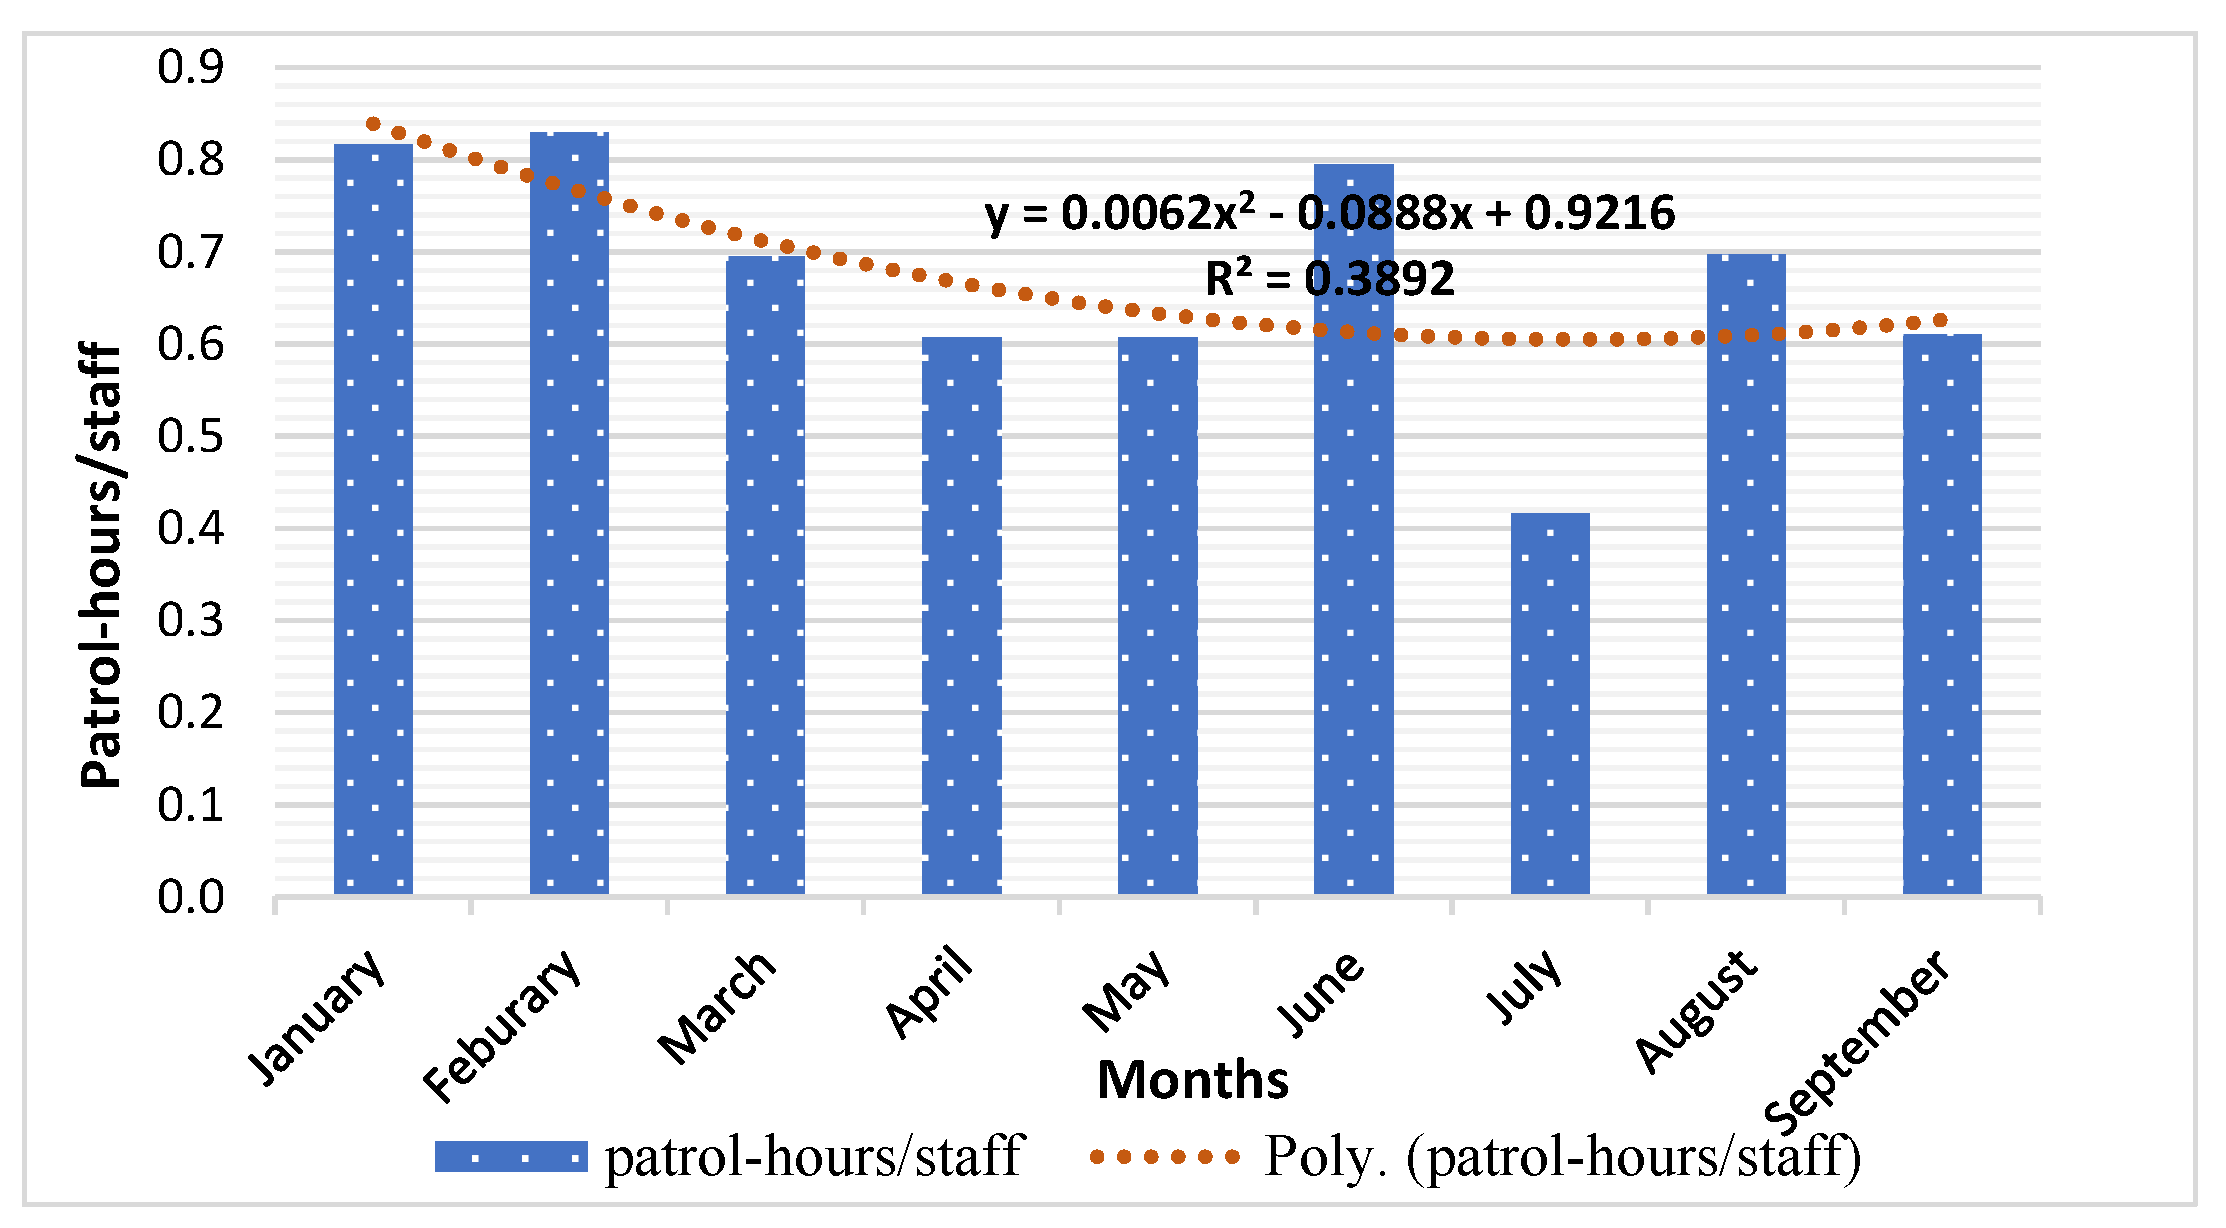
3.1.1. General Patrol Efforts

From February to September 2017 in Nam Tien, there were a total of 93 patrol by rangers, 52.78 patrol-days (8 h per day), 333.61 patrol-hours, and a distance of 524.9 km walked. The average patrol over the nine-month period was 0.69 ± SD = 0.48 patrol-days long, with 1.21 (±0.41) rangers patrolling for 4.33 (±2.21) patrol-hours, walking 6.82 km (±2.96) over a relative altitude of 177.81 m (±110.73). Overall, the number of rangers per month was positively and significantly correlated with the distance walked per month (rs = 0.88, p < 0.01) and the patrol-hours (rs = 0.62, p < 0.01) in those months. Similarly, the moderately strong correlation between patrol staff and patrol-days was significant (Spearman’s (rs) = 0.69, p < 0.01). The trend in the monthly number of patrol-days decreased slightly from January to July, then increased slightly until September (Figure 2 and Figure 3).
However, the difference in the number of staff was not significant during the given time (H = 1.65, p > 0.05) nor was there a significant difference in the daily patrol-distance per month during these months (H = 11.13, p > 0.05). In their study, Wiafe [9] also found that the daily patrol-hours and patrol-days did not differ in any of the months studied (H = 13.26, p > 0.05; H = 10.57, p > 0.05, respectively). Finally, the number of patrol-hours was positively correlated with the distance walked (rs = 0.81, p < 0.01).
Differences in the monthly index of relative altitude covered were not significant (H = 13.26, p = 0.10). The relative altitude was moderately correlated with the patrol-hours and patrol-distance (rs = 0.57, p < 0.01 and rs = 0.36, p < 0.01, respectively). In particular, a negative correlation with speed of patrolling (rs = −0.45, p < 0.01) was found which is undoubtedly due to the effect of the topography on conventional patrolling and is a major factor in demotivating rangers to patrol certain routes (Figure 4). The significant correlation was found with the number of staff (rs = 0.14, p > 0.05). It was inevitable that the relative altitude would be strongly correlated with other variables such as speed and time consumed (p < 0.01).

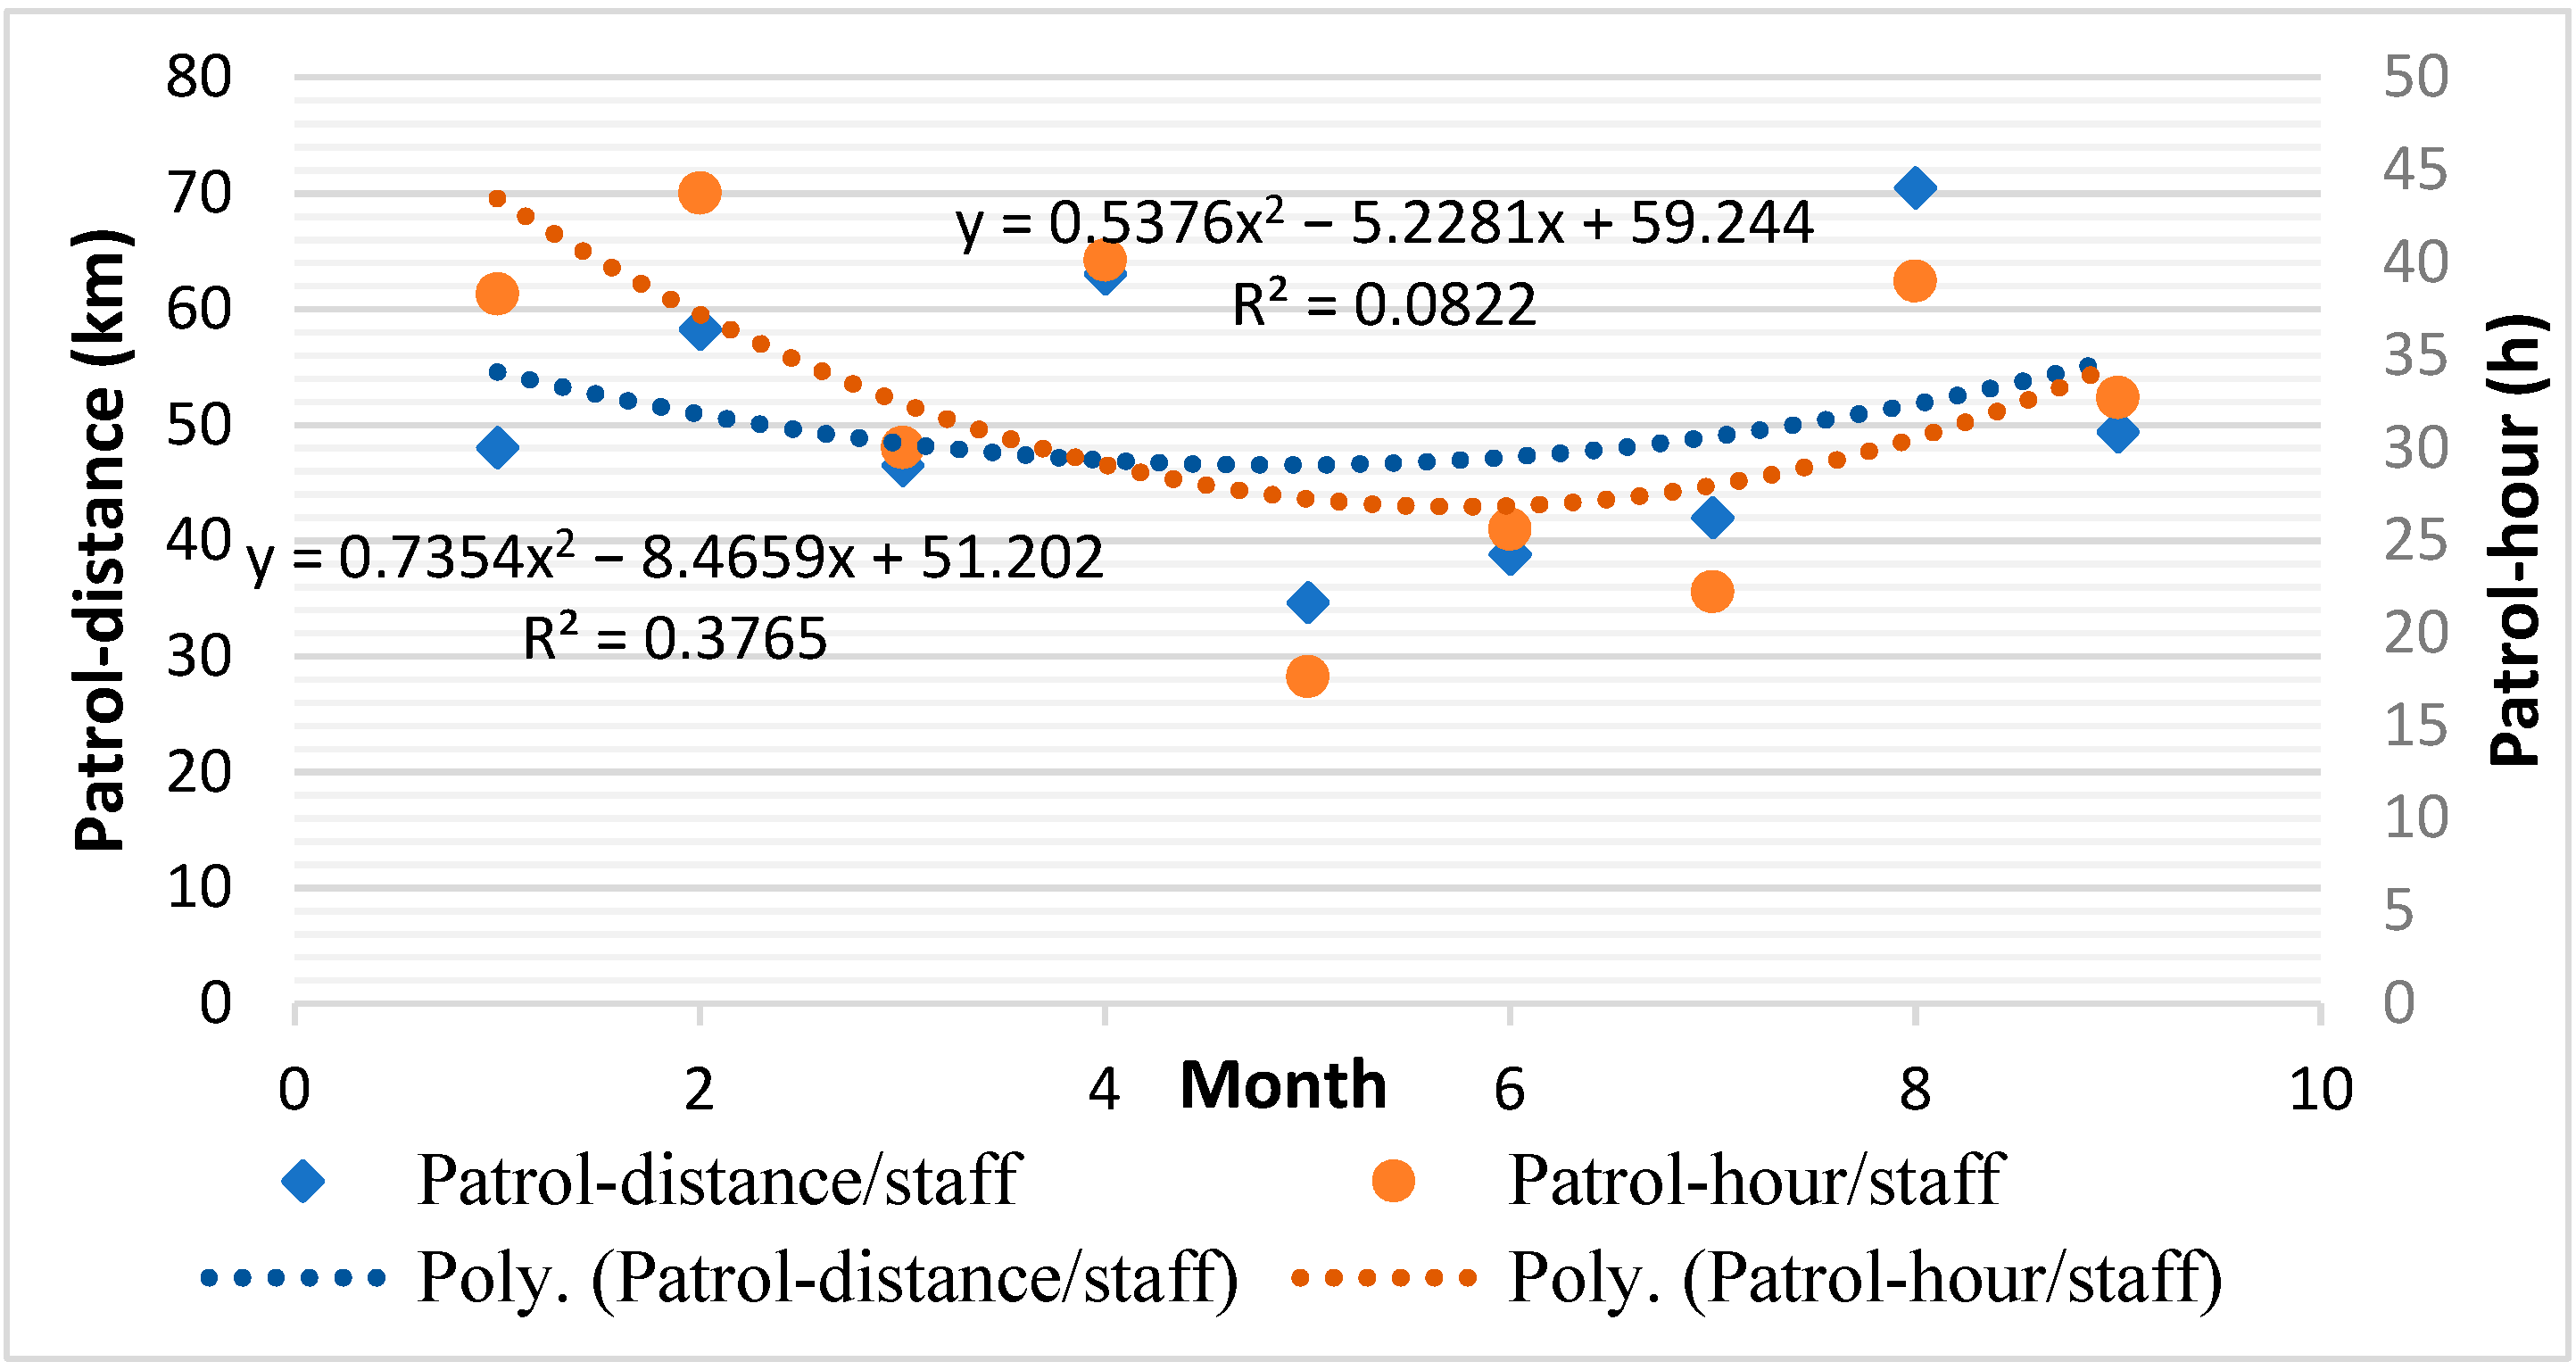
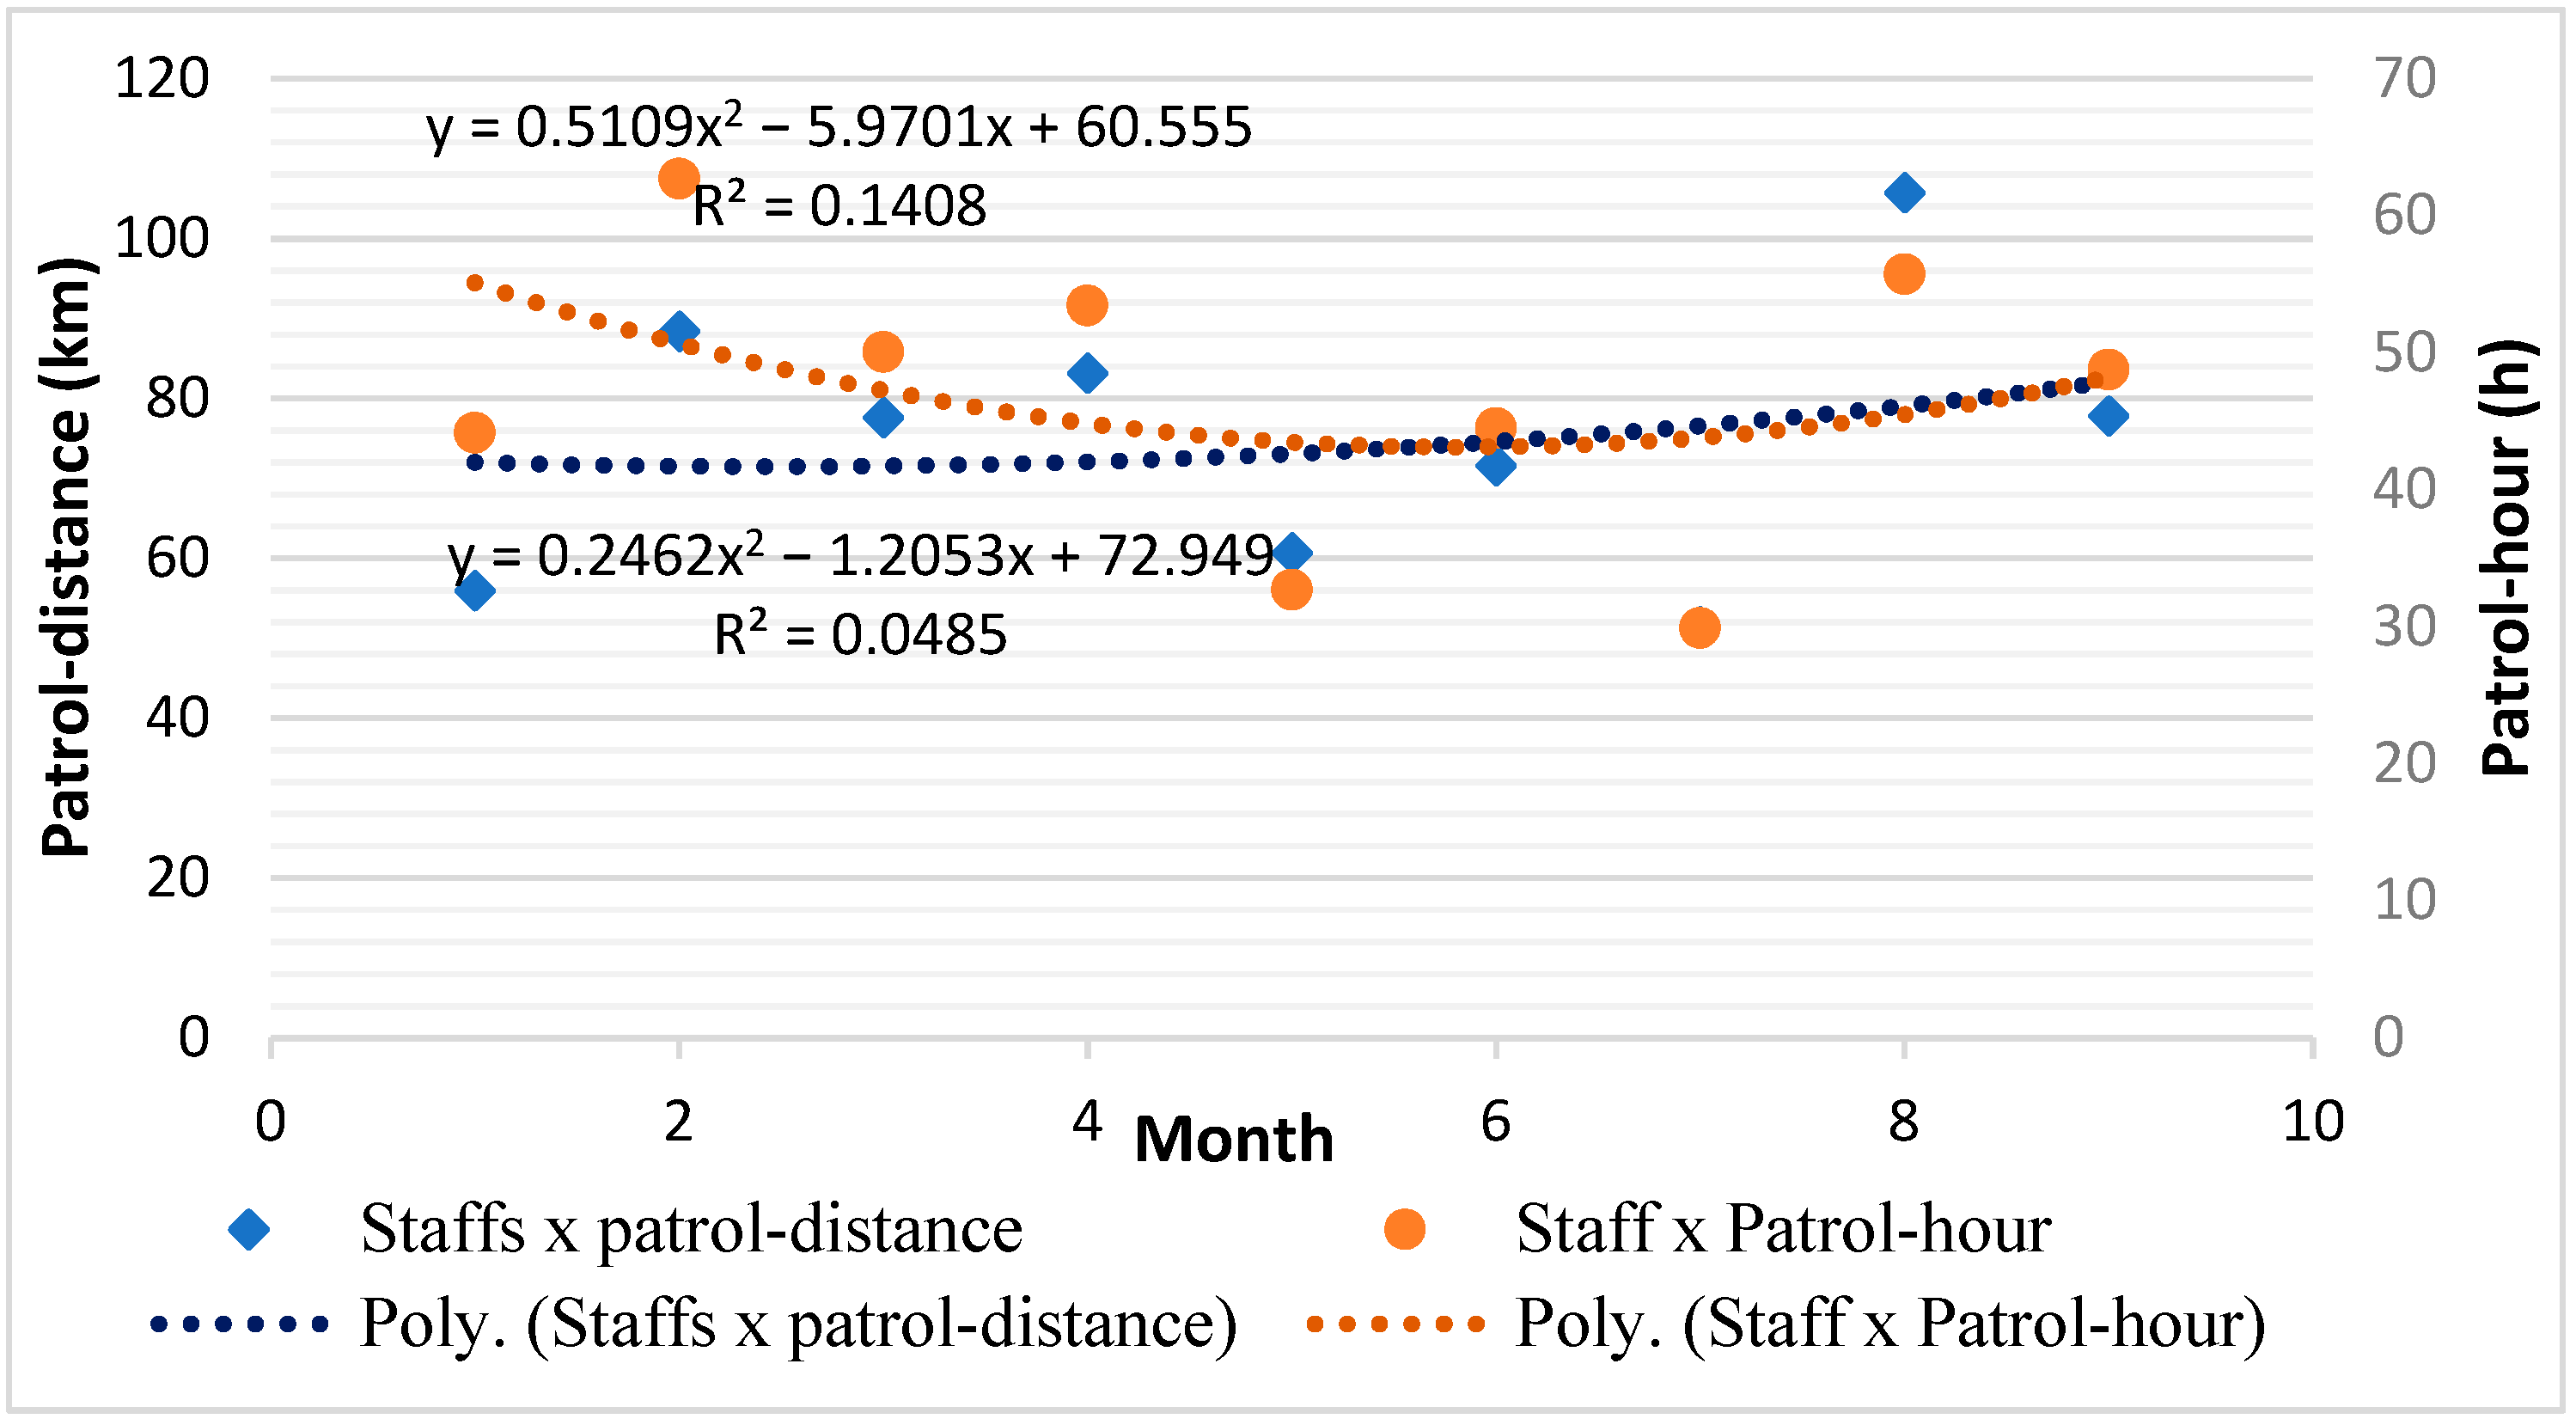
3.1.2. Correlation of Calculated Variables in Rain Season

Interestingly, the speed of patrol varied significantly throughout the months (H = 17.17, p < 0.05) which was due to various factors, including the number of serious illegal occurrences [38] and the actual patrol following the standard routes. However, there was no significant correlation between the speed of patrol and the number of rangers in Nam Tien (rs = 0.06, p > 0.05). The average speed of patrol increased slightly throughout the year (Figure 5), with a peak in August–September. This was probably an indicator of RPEs and may also have denoted how often illegal activities were encountered during the months.
Patrol effort, in terms of patrol-distance and patrol-hours, presented slightly decreasing trends in the rainy season. The average staff/patrol-distance was slightly higher than the staff/patrol-hours (Figure 6) and the data were significantly correlated with the number of rangers (rs = 0.25, p < 0.05; rs = 0.23, p < 0.05, respectively) and the number of patrol-days (rs = 0.44, p < 0.01; rs = 0.60, p < 0.01, respectively). A comparison of both indicators across the months studied showed no significant differences on a month-by-month basis (staff/patrol-distance: H = 9.34, p > 0.05; patrol-hour/staff: H = 12.04, p > 0.05) indicating that the number rangers patrolling in Nam Tien FS and the patrol-distance and number of patrol-hours remained consistent and were not affected by any external factors or differences in conditions.
Overall ranger effort in Nam Tien FS was calculated based on the total patrol-distance and patrol-hours, and the number of rangers (Figure 7). The number of rangers was found to be significantly correlated with the patrol-distance (rs = 0.69, p < 0.01), patrol-hours (rs = 0.23, p < 0.01), and similarly, the patrol-days were significantly correlated with the patrol-distance (rs = 0.88, p < 0.01) and the patrol-hours (rs = 0.60, p < 0.01). Furthermore, there were no significant differences in either the distance walked (H = 8.33; p > 0.05) nor the hours patrolled (H = 10.28; p > 0.05) on a month-by-month basis. The average number of rangers multiplied by the patrol-distance showed an increasing trend during the period studied whereas the number of rangers multiplied by the patrol-hours showed a generally decreasing trend (Figure 7).

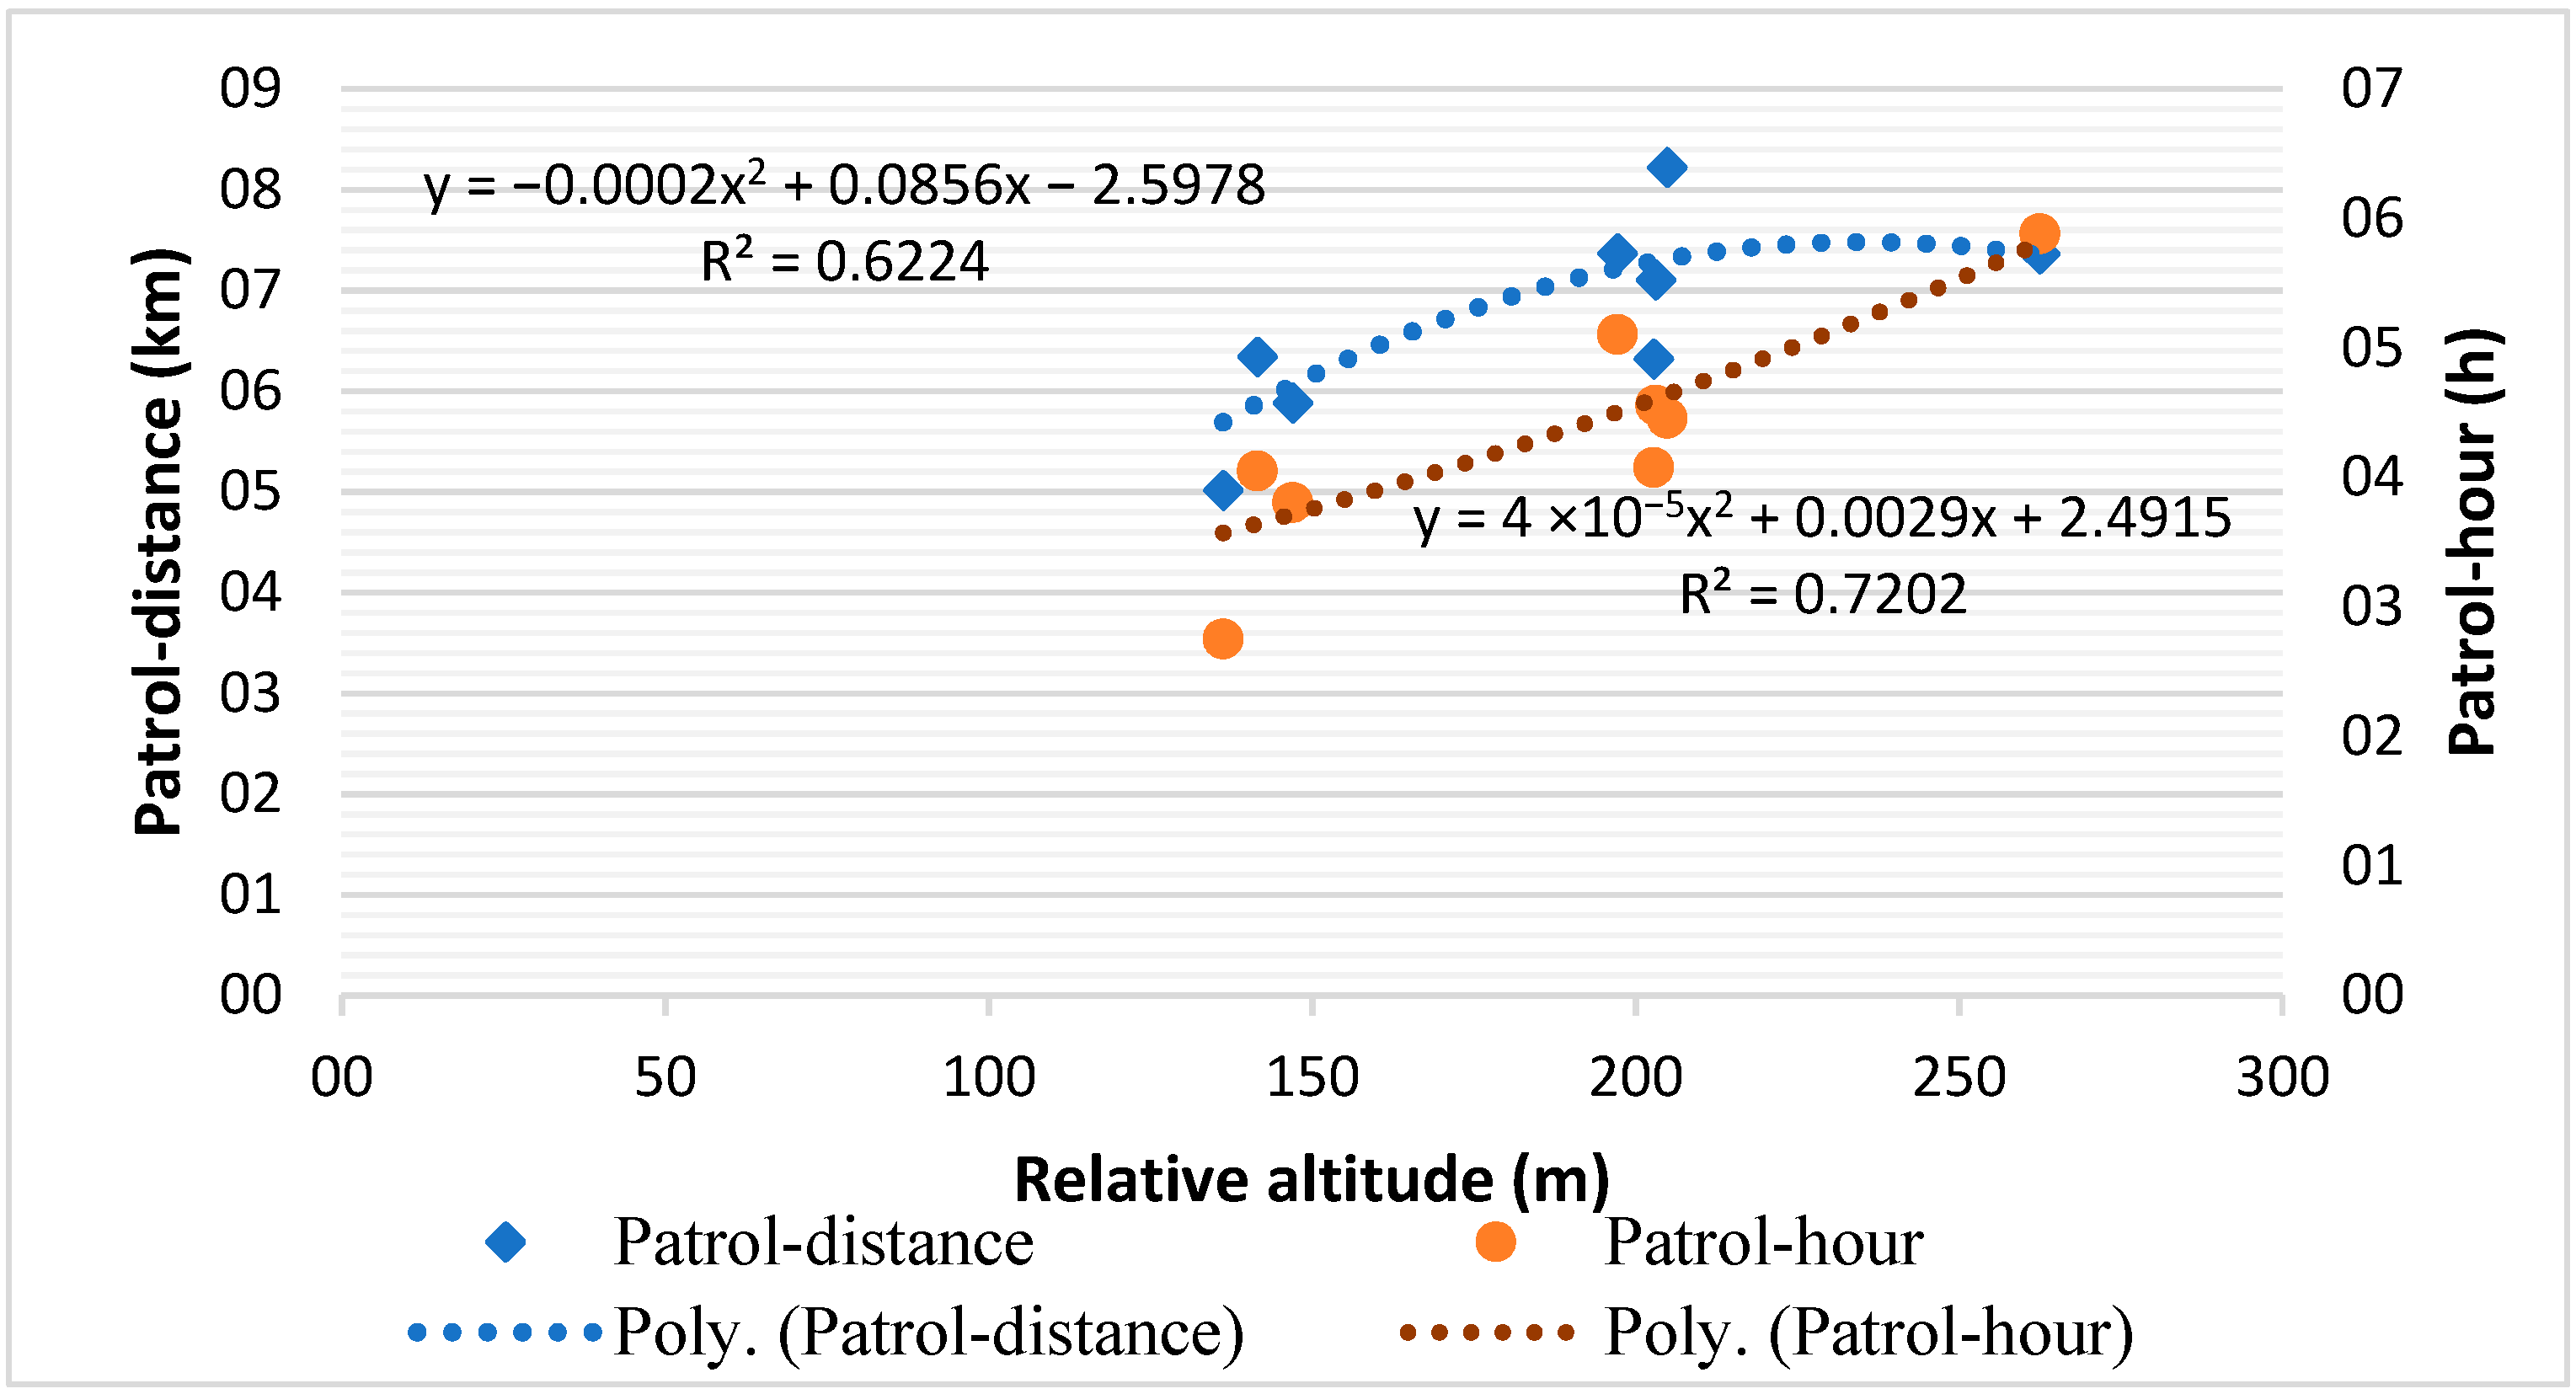
3.2. Fundamental Factors in Patrol Effort

Interestingly, the number of staff was still correlated with man-days (rs = 0.59, p < 0.05). The monthly average number of man-days, patrol-hours and the patrol-distance did not differ from other months during the period February–March (p > 0.05) because of the typical Tet holiday (Lunar New Year). However, the relative altitude covered by patrols was significantly different (U = 342, p < 0.05) because at this time, the rangers concentrated on patrolling in sensitive areas where the potential for the occurrence of illegal activity was higher compared to other months. There was also a significant increase in the speed of patrolling in these two months (U = 314, p < 0.05). However, there was no significant difference in the man-days (U = 428.5; p > 0.72), patrol-distance (U = 504.5; p > 0.05), patrol-hours (U = 404.5; p > 0.05) or the number of staff (U = 489.5; p > 0.05), as some part- time staff were employed to make up for the shortfall in the number of regular rangers at the station. In fact, the mean number of patrol-hours and patrol-days was higher during the two months of the rainy season (4.89 ± 2.18 and 0.74 ± 0.46, respectively) compared to the rest of the period (4.17 ± 2.22 and 0.67 ± 0.49, respectively). A shortfall in the number of rangers was apparent from the mean number of staff making up patrols in February–March (1.18 ± 0.39) compared to other months (1.22 ± 0.42). Furthermore, the relative altitude covered by patrols in February–March was higher (230.76 ± 128.00) than in other months (162.80 ± 101.55).
During the rainy season in August–September, there were no significant differences in any of the indicators of RPE, namely man-days, patrol-hours, patrol-distance, relative altitude or speed of patrolling (p > 0.05). Interestingly, the rate of precipitation was found to be significantly correlated with the number of staff measured by man-days (rs = 0.65, p < 0.05), patrol-hours (rs = 0.46, p < 0.05) and patrol-distance (p = 0.52, p < 0.05). Rangers might, therefore, not be able to patrol in inaccessible areas in this period, even though there was no significant difference in man-days (U = 554; p > 0.72), patrol-distance (U = 559.5; p > 0.05), patrol-hours (U = 551.5; p > 0.05) or the number of staff (U = 562; p > 0.05) in the rainy season compared to the rest of the period. Based on practical experience, even when human activity was made difficult by the weather conditions, the rangers continued to regularly patrol their areas. However, due to the effect of the rainy weather on the condition of patrol routes, the mean relative altitude in the rainy months was marginally lower (175 ± 103.47) compared to the rest of the period (178.46 ± 114.04), although this difference was not significant (U = 542.5; p > 0.05). The distance walked during August–September (7.36 ± 3.28 km) was higher than in other months (6.67 ± 2.88 km).

4. Discussion and Conclusions

This could be expected that there would be better patrol performance, since as the number of rangers increases, they can patrol over longer distances [31]. Moreover, the greater the number of rangers on patrol, the larger the area covered based on distance and hours on patrol [37]. Overall, the monthly salaries of the rangers and their basic logistics were similar during these months due to a 3-year increase in salary, and did not influence the motivation behind the patrol efforts [9] nor the number of tasks during a particular period [24,28]. The coverage of these patrol routes was stable during those months even though patrol movement was unpredictable and subject to adaptation based on lessons learned or natural occurrences [9].
Similarly to most protected areas in Vietnam, staff in Nam Tien FS regularly reduce the number of patrols during the period of the Lunar New Year festival and during the rainy season, and it has therefore been speculated that patrol efforts measured by, for instance, days, rangers, distance and time would be disrupted during these periods [9]. The Lunar New Year occurred during February–March, and the FS was confronted with a shortage of staff at that time [39], with half of the staff in Nam Tien FS taking some days off. Further, at this time of year, more people come to enjoy NRs as a way of welcoming the New Year. This period is especially problematic for rangers being on duty at the forest station because few of the rangers actually live in the area so are likely to suffer from homesickness during festival periods if they are separated from their families [39].
The aforementioned suggests that the rangers in Nam Tien were still patrolling in the field even under uncomfortable weather conditions when people might have taken advantage of the weather conditions to carry out illegal activities [9]. In almost all the sub-areas, the rangers generally used existing tracks at the peak of the wet season as a temporary measure [31] to enable patrolling to continue. The rainy season presents challenges to patrolling because of a lack of proper equipment. Finally, it was also notable that the local regulations were applied and decisions taken by the management of the NR were strictly according to the local regulations aimed at protecting the area, therefore, the management of the NR could be seen as being transparent during the period studied [11].
This study adds to the literature on patrol effort and reducing occupational stress in patrolling, specifically in the context of forest protection in special-use forests [37]. This highlights the strenuous nature of foot patrols due to the size of the forest areas and the challenging terrain [37]. Generally, this study indicates that there were strong and significant correlations amongst patrol indices such as days, hours, distance and speed during the months studied, even during the Lunar New Year festival and in the rainy season, and these periods had no influence on the index of patrol effort in Nam Tien FS. Previous research has focused on law enforcement efforts linked to the record of illegal activity encounters in some protected areas such as: Gana [1,24], the Central Luagwa Valley, Zambia [34] and Reina Isable in Uganda [1]. This study, however, presents another means of analyzing RPEs, based on both quantitative and qualitative indices in the protected areas in the Nam Tien FS, Pu Hu NR.
The methods adopted in this study, in relation to the patrolling of protected areas, have the potential to enhance patrol efforts in the field without requiring additional resources for patrols [1]. Besides consideration of the effectiveness of forest protection efforts [35], policymakers and management boards should focus on the challenges faced by forest rangers and understand how to analyze their RPEs [39]. Consideration should be given to conducting monthly assessments of rangers’ performance based on patrol effort [28], and it is important to support rangers in order to enhance regular patrolling to combat illegal activities. It is also vital for local authorities to increase the ability of rangers to enforce the patrolling activity. Finally, it is important for all stakeholders to recognize that RPEs are a positive means of promoting conservation and preventing illegal activities, such as hunting, poaching and logging. However, further research on patrolling efforts should be considered in the long-term period and the illegal activity encounters.

Author Contributions

All authors conceived the study, designed the questionnaire, and wrote the initial manuscript. L.N.T. collected the data. A.X.H. and N.T.H.N. analyzed the data, wrote the results, and provided critical revisions on the successive drafts. D.L.K. and K.T. provided critical revisions, reorganized the linking and definitions of the variables, analyses, and findings. All authors have read and agreed to the published version of the manuscript.

Funding

This research received the Postdoctoral Fellowship from Prince of Songkla University, Hat Yai, Thailand.

Institutional Review Board Statement

Not applicable.

Informed Consent Statement

Informed consent was obtained from all considerations involved in the study.

Data Availability Statement

The data used for this study is in Pu Hu Nature Reserve and only available to the researchers involved on the case studies.

Acknowledgments

These researches were supported by the Postdoctoral Fellowship from Prince of Songkla University, Hat Yai, Thailand. The authors would like to thank the scholars in the Faculty of Environmental Management, Prince of Songkla University, Hat Yai, Thailand, for advising the research. We are grateful to the forest rangers in Nam Tien forest station, the Department of Law Enforcement and the Department of Science and International Cooperation in Pu Hu Nature Reserve for sharing their ranger-collected and analyzed data, and providing suggestions about their experiences and skills.

Conflicts of Interest

The authors declare no conflict of interest.

Appendix A

This example of one patrol track by rangers is represented in software to estimate the number of distance and elevation.
Figure A1. The number of distance and elevation.
Sustainability 13 08407 g0a1

References

  1. Critchlow, R.; Plumptre, A.J.; Driciru, M.; Rwetsiba, A.; Stokes, E.J.; Tumwesigye, C.; Wanyama, F.; Beale, C.M. Spatiotemporal trends of illegal activities from ranger-collected data in a Ugandan national park. Conserv. Biol. 2015, 29, 1458–1470. [Google Scholar] [CrossRef]
  2. Messmer, T.A. The emergence of human-wildlife conflict management: Turning challenges into opportunities. Int. Biodeterior. Biodegrad. 2000, 45, 97–102. [Google Scholar] [CrossRef]
  3. Thapa, S.; Chapman, D.S. Impacts of resource extraction on forest structure and diversity in Bardia National Park, Nepal. For. Ecol. Manag. 2010, 259, 641–649. [Google Scholar] [CrossRef]
  4. Ormsby, A.; Kaplin, B.A. A framework for understanding community resident perceptions of Masoala National Park, Madagascar. Environ. Conserv. 2005, 32, 156. [Google Scholar] [CrossRef]
  5. Clark, N.E.; Boakes, E.H.; McGowan, P.J.K.; Mace, G.M.; Fuller, R.A. Protected areas in south Asia have not prevented habitat loss: A study using historical models of land-use change. PLoS ONE 2013, 8, e65298. [Google Scholar] [CrossRef] [PubMed]
  6. Cardinale, B.J.; Duffy, J.E.; Gonzalez, A.; Hooper, D.U.; Perrings, C.; Venail, P.; Narwani, A.; Mace, G.M.; Tilman, D.; Wardle, D.A.; et al. Corrigendum: Biodiversity loss and its impact on humanity. Nature 2012, 489, 326. [Google Scholar] [CrossRef] [Green Version]
  7. Dong, K.L.; Sutinee, S.; Hoa, A.X.; Dong, N.P.; Ali, S.; Manop, P.; Kuaanan, T. A Quick comparison of patrol efforts for supportive protection: A case study of two stations in Vietnam. Appl. Ecol. Environ. Res. 2018, 16, 1767–1781. [Google Scholar] [CrossRef]
  8. Bennett, N.J.; Roth, R.; Klain, S.C.; Chan, K.; Christie, P.; Clark, D.A.; Cullman, G.; Curran, D.; Durbin, T.J.; Epstein, G.; et al. Conservation social science: Understanding and integrating human dimensions to improve conservation. Biol. Conserv. 2017, 205, 93–108. [Google Scholar] [CrossRef] [Green Version]
  9. Wiafe, C. Wildlife laws monitoring as an adaptive management tool in protected area management in Ghana: A case of Kakum Conservation Area. Springerplus 2016, 5, 1440. [Google Scholar] [CrossRef] [Green Version]
  10. Thi, H.D.; Krott, M.; Böcher, M. The success of scientific support for biodiversity conservation policy: The case of Ngoc Son Ngo Luong nature reserve in Vietnam. J. Nat. Conserv. 2017, 38, 3–10. [Google Scholar] [CrossRef]
  11. Kahler, J.S.; Gore, M.L. Beyond the cooking pot and pocket book: Factors influencing noncompliance with wildlife poaching rules. Int. J. Comp. Appl. Crim. Justice 2012, 36, 103–120. [Google Scholar] [CrossRef]
  12. Jenks, K.E.; Howard, J.; Leimgruber, P. Do ranger stations deter poaching activity in national parks in Thailand? Biotropica 2012, 44, 826–833. [Google Scholar] [CrossRef]
  13. Kim, L.T.T.; Nichols, J.D.; Brown, K. Firewood extraction and use in rural Vietnam: A household model for three communes in Ha Tinh Province. Agrofor. Syst. 2017, 91, 649–661. [Google Scholar] [CrossRef]
  14. Ly, T.P.; Xiao, H. The choice of a park management model: A case study of Phong Nha-Ke Bang National Park in Vietnam. Tour. Manag. Perspect. 2016, 17, 1–15. [Google Scholar] [CrossRef] [Green Version]
  15. Berkes, F.; Berkes, M.K.; Fast, H. Collaborative integrated management in Canada’s north: The role of local and traditional knowledge and community-based monitoring. Coast. Manag. 2007, 143–162. [Google Scholar] [CrossRef]
  16. Berkeley, U.C.; Cole, A.C. Wildlife Monitoring and Conservation in a West African Protected Area. Ph.D. Thesis, University of California, Berkley, CA, USA, 2010. [Google Scholar]
  17. Lei, L. The GIS-based research on criminal cases hotspots identifying. Procedia Environ. Sci. 2012, 12, 957–963. [Google Scholar] [CrossRef] [Green Version]
  18. Niedziałkowski, K.; Blicharska, M.; Mikusiński, G.; Jedrzejewska, B. Why is it difficult to enlarge a protected area? Ecosystem services perspective on the conflict around the extension of the Białowieża National Park in Poland. Land Use Policy 2014, 38, 314–329. [Google Scholar] [CrossRef]
  19. Moreto, W.D. Occupational stress among law enforcement rangers: Insights from Uganda. Oryx 2016, 50, 646–654. [Google Scholar] [CrossRef] [Green Version]
  20. Jachmann, H. Law Enforcement Monitoring, An Adaptive Management Tool for Wildlife Management; Unpublished Technical Report; Wildlife Division: Accra, Ghana, 2004. [Google Scholar]
  21. Jachmann, H. Monitoring law-enforcement performance in nine protected areas in Ghana. Biol. Conserv. 2008, 141, 89–99. [Google Scholar] [CrossRef]
  22. Jachmann, H. Illegal wildlife use and protected area management in Ghana. Biol. Conserv. 2008, 141, 1906–1918. [Google Scholar] [CrossRef]
  23. N’Goran, P.K.; Boesch, C.; Mundry, R.; N’Goran, E.K.; Herbinger, I.; Yapi, F.A.; Kuehl, H.S. Hunting, law enforcement, and African primate conservation. Conserv. Biol. 2012, 26, 565–571. [Google Scholar] [CrossRef] [PubMed]
  24. Gong, M.; Fan, Z.; Zhang, X.; Liu, G.; Wen, W.; Zhang, L. Measuring the effectiveness of protected area management by comparing habitat utilization and threat dynamics. Biol. Conserv. 2017, 210, 253–260. [Google Scholar] [CrossRef]
  25. Dhanjal-Adams, K.L.; Mustin, K.; Possingham, H.P.; Fuller, R.A. Optimizing disturbance management for wildlife protection: The enforcement allocation problem. J. Appl. Ecol. 2016, 53, 1215–1224. [Google Scholar] [CrossRef]
  26. Gardner, T.A.; Von Hase, A.; Brownlie, S.; Ekstrom, J.M.; Pilgrim, J.D.; Savy, C.E.; Stephens, R.T.; Treweek, J.O.; Ussher, G.T.; Ward, G.; et al. Biodiversity offsets and the challenge of achieving no net loss. Conserv. Biol. 2013, 27, 1254–1264. [Google Scholar] [CrossRef]
  27. He, G.; Chen, X.; Beaer, S.; Colunga, M.; Mertig, A.; An, L.; Zhou, S.; Linderman, M.; Ouyang, Z.; Gage, S. Spatial and temporal patterns of fuelwood collection in Wolong Nature Reserve: Implications for panda conservation. Landsc. Urban Plan. 2009, 92, 1–9. [Google Scholar] [CrossRef]
  28. Gray, M.; Kalpers, J. Ranger based monitoring in the Virunga-Bwindi region of East-Central Africa: A simple data collection tool for park management. Biodivers. Conserv. 2005, 14, 2723–2741. [Google Scholar] [CrossRef]
  29. Shairp, R.; Veríssimo, D.; Fraser, I.; Challender, D.; Macmillan, D. Understanding urban demand for wild meat in Vietnam: Implications for conservation actions. PLoS ONE 2016, 11, e0134787. [Google Scholar] [CrossRef] [Green Version]
  30. Sassen, M.; Sheil, D.; Giller, K.E. Fuelwood collection and its impacts on a protected tropical mountain forest in Uganda. For. Ecol. Manag. 2015, 354, 56–67. [Google Scholar] [CrossRef]
  31. Steinmetz, R.; Srirattanaporn, S.; Mor-Tip, J.; Seuaturien, N. Can community outreach alleviate poaching pressure and recover wildlife in South-East Asian protected areas? J. Appl. Ecol. 2014, 51, 1469–1478. [Google Scholar] [CrossRef]
  32. Walsh, W.F.; Donovan, E.J. Job stress in game conservation officers. J. Police Sci. Adm. 1984, 12, 333–338. [Google Scholar]
  33. Dong, L.K.; Sinutok, S.; Manop, P.; Techato, K. Participation Patrolling Efforts by Local people: Case of Nam Tien Forest Station in Pu Hu Nature Reserve, Vietnam. In Proceedings of the 3rd International Conference on Energy and Environmental Science, Seoul, Korea, 26–29 January 2019. [Google Scholar] [CrossRef]
  34. Jachmann, A.H.; Billiouw, M. Elephant poaching and law enforcement in the central Luangwa Valley, Zambia. J. Appl. Ecol. 2017, 34, 233–244. [Google Scholar] [CrossRef]
  35. Dudley, N. Guidelines for Applying Protected Area Management Categories; No. 21; IUCN: Gland, Switzeland, 2008. [Google Scholar]
  36. Mukul, S.A.; Herbohn, J.; Rashid, A.Z.M.M.; Uddin, M.B. Comparing the effectiveness of forest law enforcement and economic incentives to prevent illegal logging in Bangladesh. Int. For. Rev. 2014, 16, 363–375. [Google Scholar] [CrossRef]
  37. Jachmann, H. Monitoring Illegal Wildlife Use and Law Enforcement in African Savanna Rangelands; Wildlife Resource Monitoring Unit: Lusaka, Zambia, 1998. [Google Scholar]
  38. Jachmann, H.; Blanc, J.; Nateg, C.; Balangtaa, C.; Debrah, E.; Damma, F.; Atta-Kusi, E.; Kipo, A. Protected area performance and tourism in Ghana. S. Afr. J. Wildl. Res. 2011, 41, 95–109. [Google Scholar] [CrossRef]
  39. Papworth, S.K.; Bunnefeld, N.; Slocombe, K.; Milner-Gulland, E.J. Movement ecology of human resource users: Using net squared displacement, biased random bridges and resource utilization functions to quantify hunter and gatherer behaviour. Methods Ecol. Evol. 2012, 3, 584–594. [Google Scholar] [CrossRef]
Figure 1. Location of case study area in Pu Hu NR.
Sustainability 13 08407 g001
Figure 2. The average patrol-distance efforts during the period of time.
Sustainability 13 08407 g002
Figure 3. The average patrol-hours efforts during the period of time.
Sustainability 13 08407 g003
Figure 4. Trend of average relative altitude with respect to distance and hours.
Sustainability 13 08407 g004
Figure 5. Trend of average patrol-speed by rangers.
Sustainability 13 08407 g005
Figure 6. Trends in patrol-hours and patrol-distance.
Sustainability 13 08407 g006
Figure 7. Trend of total efforts of patrol-distance and patrol-hours.
Sustainability 13 08407 g007
Table 1. Summary of sub-forest plots in protected area.
Sub-AreasName of CommunitiesSize of Sub-AreasDistance from Forest StationRelative Altitude
(m)
(Ha)(Km)
102Nam Tien12409–101200–1320
120Nam Tien10817–9926–1125
121Nam Tien7548–9850–930
124Nam Tien5748–9541–635
132Nam Tien6586–7230–335
142Nam Tien1002–4353–430
146Nam Tien6787–8454–540
147BNam Tien363–4600–752
142Thien Phu5457–8720–822
Publisher’s Note: MDPI stays neutral with regard to jurisdictional claims in published maps and institutional affiliations.

