Article

Enhancement of Biogas Production via Co-Digestion of Wastewater Treatment Sewage Sludge and Brewery Spent Grain: Physicochemical Characterization and Microbial Community

by
Khuthadzo Mudzanani
1,2,
Esta van Heerden
3,
Ryneth Mbhele
1 and
Michael O. Daramola
4,*
1
Council for Scientific and Industrial Research (CSIR), Smart Places, Water & Wastewater Infrastructure, P.O. Box 395, Pretoria 0001, South Africa
2
School of Chemical and Metallurgical Engineering, Faculty of Engineering and the Built Environment, University of the Witwatersrand, Wits, Johannesburg 2050, South Africa
3
iWater, 5 Walter Sisulu Rd, Park West, Bloemfontein 9301, South Africa
4
Department of Chemical Engineering, Faculty of Engineering, Built Environment and Information Technology, University of Pretoria, Hatfield, Pretoria 0028, South Africa
*
Author to whom correspondence should be addressed.
Sustainability 2021, 13(15), 8225; https://doi.org/10.3390/su13158225
Submission received: 4 April 2021 / Revised: 14 June 2021 / Accepted: 15 June 2021 / Published: 23 July 2021

Abstract

:
The present study intends to evaluate a synergy towards enhanced biogas production by co-digesting municipal sewage sludge (SS) with brewery spent grain (BSG). To execute this, physicochemical and metagenomics analysis was conducted on the sewage sludge substrate. The automatic methane potential test system II (AMPTS II) biochemical methane potential (BMP) batch setup was operated at 35 ± 5 °C, pH range of 6.5–7.5 for 30 days’ digestion time on AMPTS II and 150 days on semi-continuous setup, where the organic loading rate (OLR) was guided by pH and the volatile fatty acids to total alkalinity (VFA/TA) ratio. Metagenomics analysis revealed that Proteobacteria was the most abundant phyla, consisting of hydrolytic and fermentative bacteria. The archaea community of hydrogenotrophic methanogen genus was enriched by methanogens. The highest BMP was obtained with co-digestion of SS and BSG, and 9.65 g/kg of VS. This not only increased biogas production by 104% but also accelerated the biodegradation of organic matters. However, a significant reduction in the biogas yield, from 10.23 NL/day to 2.02 NL/day, was observed in a semi-continuous process. As such, it can be concluded that different species in different types of sludge can synergistically enhance the production of biogas. However, the operating conditions should be optimized and monitored at all times. The anaerobic co-digestion of SS and BSG might be considered as a cost-effective solution that could contribute to the energy self-efficiency of wastewater treatment works (WWTWs) and sustainable waste management. It is recommended to upscale co-digestion of the feed for the pilot biogas plant. This will also go a long way in curtailing and minimizing the impacts of sludge disposal in the environment.

1. Introduction

In South Africa, sewage sludge (SS) generated from municipal waste water treatment works (WWTW) remains a challenge. Most urban SS in the country is treated improperly prior to discharge [1,2]. This is due to the fact that most WWTWs lack trained operators and inadequate wastewater capital and operating funds. There is also a lack of planning to provide for the constant increase in urbanization, as well as a lack of human resources and technical skills [3]. Studies have shown that a substantial number of wastewater treatment works run by municipalities in Gauteng are producing effluent that does not meet DWAF standards. Some of the works produce effluent of low-quality by-products that are released to the environment [4,5,6]. This is mostly the case with underperforming WWTPs, for which some of the reasons are: unplanned treatment loads exceeding treatment capacity, under-budgeting by the municipality for wastewater equipment maintenance, and the use of personnel with insufficient understanding of the technology of wastewater treatment [3,7]. Due to various industrial processes, water is contaminated with undesirable compounds. These toxic compounds are harmful to people, animals, and the environment. However, these toxic harmful bacteria can otherwise be utilized in renewable energy production [8].
Renewable energy production is currently a major issue worldwide and in South Africa [9]. Its usage will relieve countries from non-renewable sources that heavily pollute the environment and compromise its ability to foster life [10]. The current National Development Plan goals are to procure at least 20,000 MW of renewable electricity by 2030 [11]. Despite what has been achieved so far, a lot of work remains to be conducted in order to achieve the country’s targets for universal access to clean and affordable energy [10]. As such, the optimization of energy efficiency is equally important to municipal WWTWs. Increasing energy costs and concerns about global climate change highlight the need to realize energy self-sufficiency in WWTWs. Energy self-sufficient WWTWs have been studied to reduce operation costs, energy consumption, and achieve carbon neutrality [12,13]. This will also make WWTWs self-sustainable and self-sufficient in terms of energy due to waste beneficiation.
Among others, a current promising method in place is anaerobic digestion (AD). The process has received lot of attention in the wastewater treatment plant AD because it can be used for sewage sludge stabilization, energy recovery from sludge, and waste management, thus reducing the concentration of organic matter. Even though anaerobic digestion is widely applied throughout the world, knowledge on the subject is quite limited, especially in South Africa. AD is a process in which bacteria breaks down the organic matter from a biomass material to produce biogas in the absence of oxygen [14]. Biogas is a promising renewable source of energy which combines the elimination of organic waste with the formation of a versatile energy carrier of methane. Four main reactions during methane production that constitute this metabolic pathway are: hydrolysis, acidogenesis, acetogenesis, and methanogenesis, as shown in Figure 1. Hydrolysis involves the breaking down of the complex organic polymer into simple soluble molecules by hydrolysing fermentative bacteria. The hydrolysis reaction converts polymers of carbohydrates, protein, and lipids into their respective monomers of sugar, amino acids, and long-chain fatty acids. The hydrolysed soluble substrates are fermented by acidogenic bacteria during the acidogenesis stage into VFAs with small amounts of CO2, H2, and acetic acid being produced [13,14,15]. These intermediate products are further oxidised to acetate H2 by homoacetogenic and obligatory H2 producing bacteria in the acetogenesis stage, respectively [16]. In the final step, methanogenesis, acetate and H2 are metabolised into CH4 by acetolactic and hydrogenotrophic methanogens. The acetolactic methanogen uses only acetic acid in the formation of CH4, whereas hydrogenotrophic methanogen uses H2 and CO2, as shown in Figure 1.
As a result of the complexity of the microbial communities and metabolic pathways involved, the microbiological process leading to biogas production requires an in-depth understanding that specifically focuses on the microbial communities governing the production of biogas. In addition, in order to maximize the biogas yield in AD, an understanding of the microbial community, especially that of an archaea and bacteria, is deemed necessary. This is particularly important in terms of the AD metabolic pathways, taxonomy profile, and diversity [15,16]. There are many literature reports that provide information about the methanogenesis pathway, a metagenomics study of the dominant microbes, and how to monitor their community shift. The basis of literature will assist by providing information on how to improve the process of economic viability for AD and to maximize CH4 yield, as well as to engineer the environmental parameters and augment the development of AD bio-catalytic bacteria [17,18].
A common problem usually encountered in biogas production is low biogas yield due to the use of single feedstock, i.e., sewage sludge. Too often, sludge is either recalcitrant to digestion or has a low or high C/N ratio. This can be improved by co-digesting the sludge with a co-substrate that increases the conversion of organic solids to biogas, thus increasing the production of methane. This will, in turn, boost energy production, making it possible to offset the required energy in the WWTWs’ processes [20,21]. Anaerobic co-digestion (ACD) is a practice which includes the mixing of more than two different feedstocks [22]. ACD has recently been proposed as a solution to the limitation of sewage sludge mono-digestion. Low organic load, poor C/N ratio, and low alkalinity are all characteristics of SS. Heavy metals, sulphates, and ammonia are also found in sludge; these act as AD inhibitors [23]. The addition of a substrate may improve process stability by improving nutrient balance and diluting inhibitory substances in the feedstock [24,25,26].
Brewery spent grains (BSG) are high in protein, lignocelluloses, and moisture, making them susceptible to microbial degradation. They also have a high C/N ratio and significant alkalinity, as well as a significant amount of easily biodegradable organic matter [27]. BSG is a major by-product of the beer-brewing industry and is thus regarded as waste. Therefore, it is not limited by cost or seasonality; it is readily available in large quantities. BSG can be produced from a variety of sources, including breweries, the ethanol industry, and households. The chemical composition of different sources of BSG varies depending on the chemical content of the parent feedstock. Due to the limited biodegradability of lignin, which results in low biogas yields and requires an extended hydraulic retention time (HRT), the mono-digestion of BSG is ineffective [27]. However, SS contains inorganic compounds that can disrupt the naturally ordered structure of BSG and remove lignin to make it less recalcitrant to biodegradability [25,26,27,28,29].
The objective of this study is to evaluate the impact of anaerobic co-digestion on methane production from sewage sludge and brewery spent grain blend. If the enhancement is achieved, this research aims to quantify the enhancement effect and assess its mechanism. This paper focuses on a physicochemical and metagenomics synergy analysis, especially in relation to the microbial communities that influence or inhibit the production of biogas.

2. Materials and Method

2.1. Substrate Sampling and Source

Sewage sludge was collected randomly from the municipal WWTWs in Gauteng Province, South Africa. Brewery spent grain (BSG) was collected from InBev SA, Rosslyn (Pretoria) in South Africa. The samples collected were stored in a 4 °C laboratory fridge prior to analysis to preserve their original structural quality. Samples were used on the day of collection, and some were reserved for physicochemical tests and metagenomics analysis.

2.2. Inoculum Preparation

For continuous AD process, efficiency can be reduced due to operational difficulties and instability problems associated with poor start-up and lack of adapted inoculum [30]. Hence, the seeding process has to be conducted using biologically active sludge and inoculum. Inoculum supplies the microorganism to the anaerobic digestion process, and is one of the most important factors since it has the ability to significantly influence methane yield results [28,30,31]. The standard method for preparing inoculum was followed in this order, and a quality check was performed to indicate whether the operational parameters of the digester were of good quality (see Table 1). The most common recommendation is to pre-incubate the inoculum for 1 to 5 days at 35 °C to degas and reduce the impact of its methane production. The inoculum used for both the batch and starting the semi-continuous AD processes was provided by IBERT, inside Cavalier Abattoir in Cullinan, Pretoria. IBERT Ptys provided the inoculum sourced from a plant treating abattoir waste.

2.3. Analysis Techniques

The measure of pH, total solids (TS), and volatile solids (VS) was performed according to standard methods procedures outlined in Eaton et al. (2015) [32]. To have a better understanding of microbial dynamics in the digester feed, the bacterial community was characterized. ZymoBIOMICS DNA extraction was used to extract gDNA from the samples, as per the manufacturer’s protocol. Universal 16S primers (27F and 1492R) tagged with universal PacBio adaptor sequences were used to generate full-length 16S amplicon for sequencing on the PacBio Sequel system. For alignment, raw subreads were processed through the SMRTlink (v6.0) circular consensus sequences (CCS) algorithm to produce highly accurate reads (>QV40). For data analysis, these highly accurate reads were then processed through usearch (https://drive5.com/usearch (accessed on 8 October 2019)), and taxonomic information was determined based on the Ribosomal Database Project’s 16s database v16 (http://rdp.cme.msu.edu/index.jsp (accessed on 31 October 2019)).
SEM was used to observe the samples’ morphologies. Preliminary images were obtained with a new generation Philips XL30 SEM, (Foster City, CA, United States). The SEM is useful for generating images of samples bombarded with beam of electrons. Image signal can only be generated by SEM if the sample is electrically conductive. Samples were mounted onto a stud using a double-sided carbon tape and placed in the SEM imaging chamber. The SEM has an accelerating voltage of 15–30 kV. The maximum voltage used was 20 kV. Images were captured at different magnifications. To collect the biogas analysis, the sample was taken from the gas chamber/eudiometer connected to the digester; the eudiometer reported the gas flowrate per day. The biogas composition data were collected on a daily basis using the Geotech 5000 biogas Analyzer. The instrument analyzed methane, carbon dioxide, and the balance of the gas, which can either be H2S, H2, and siloxanes.

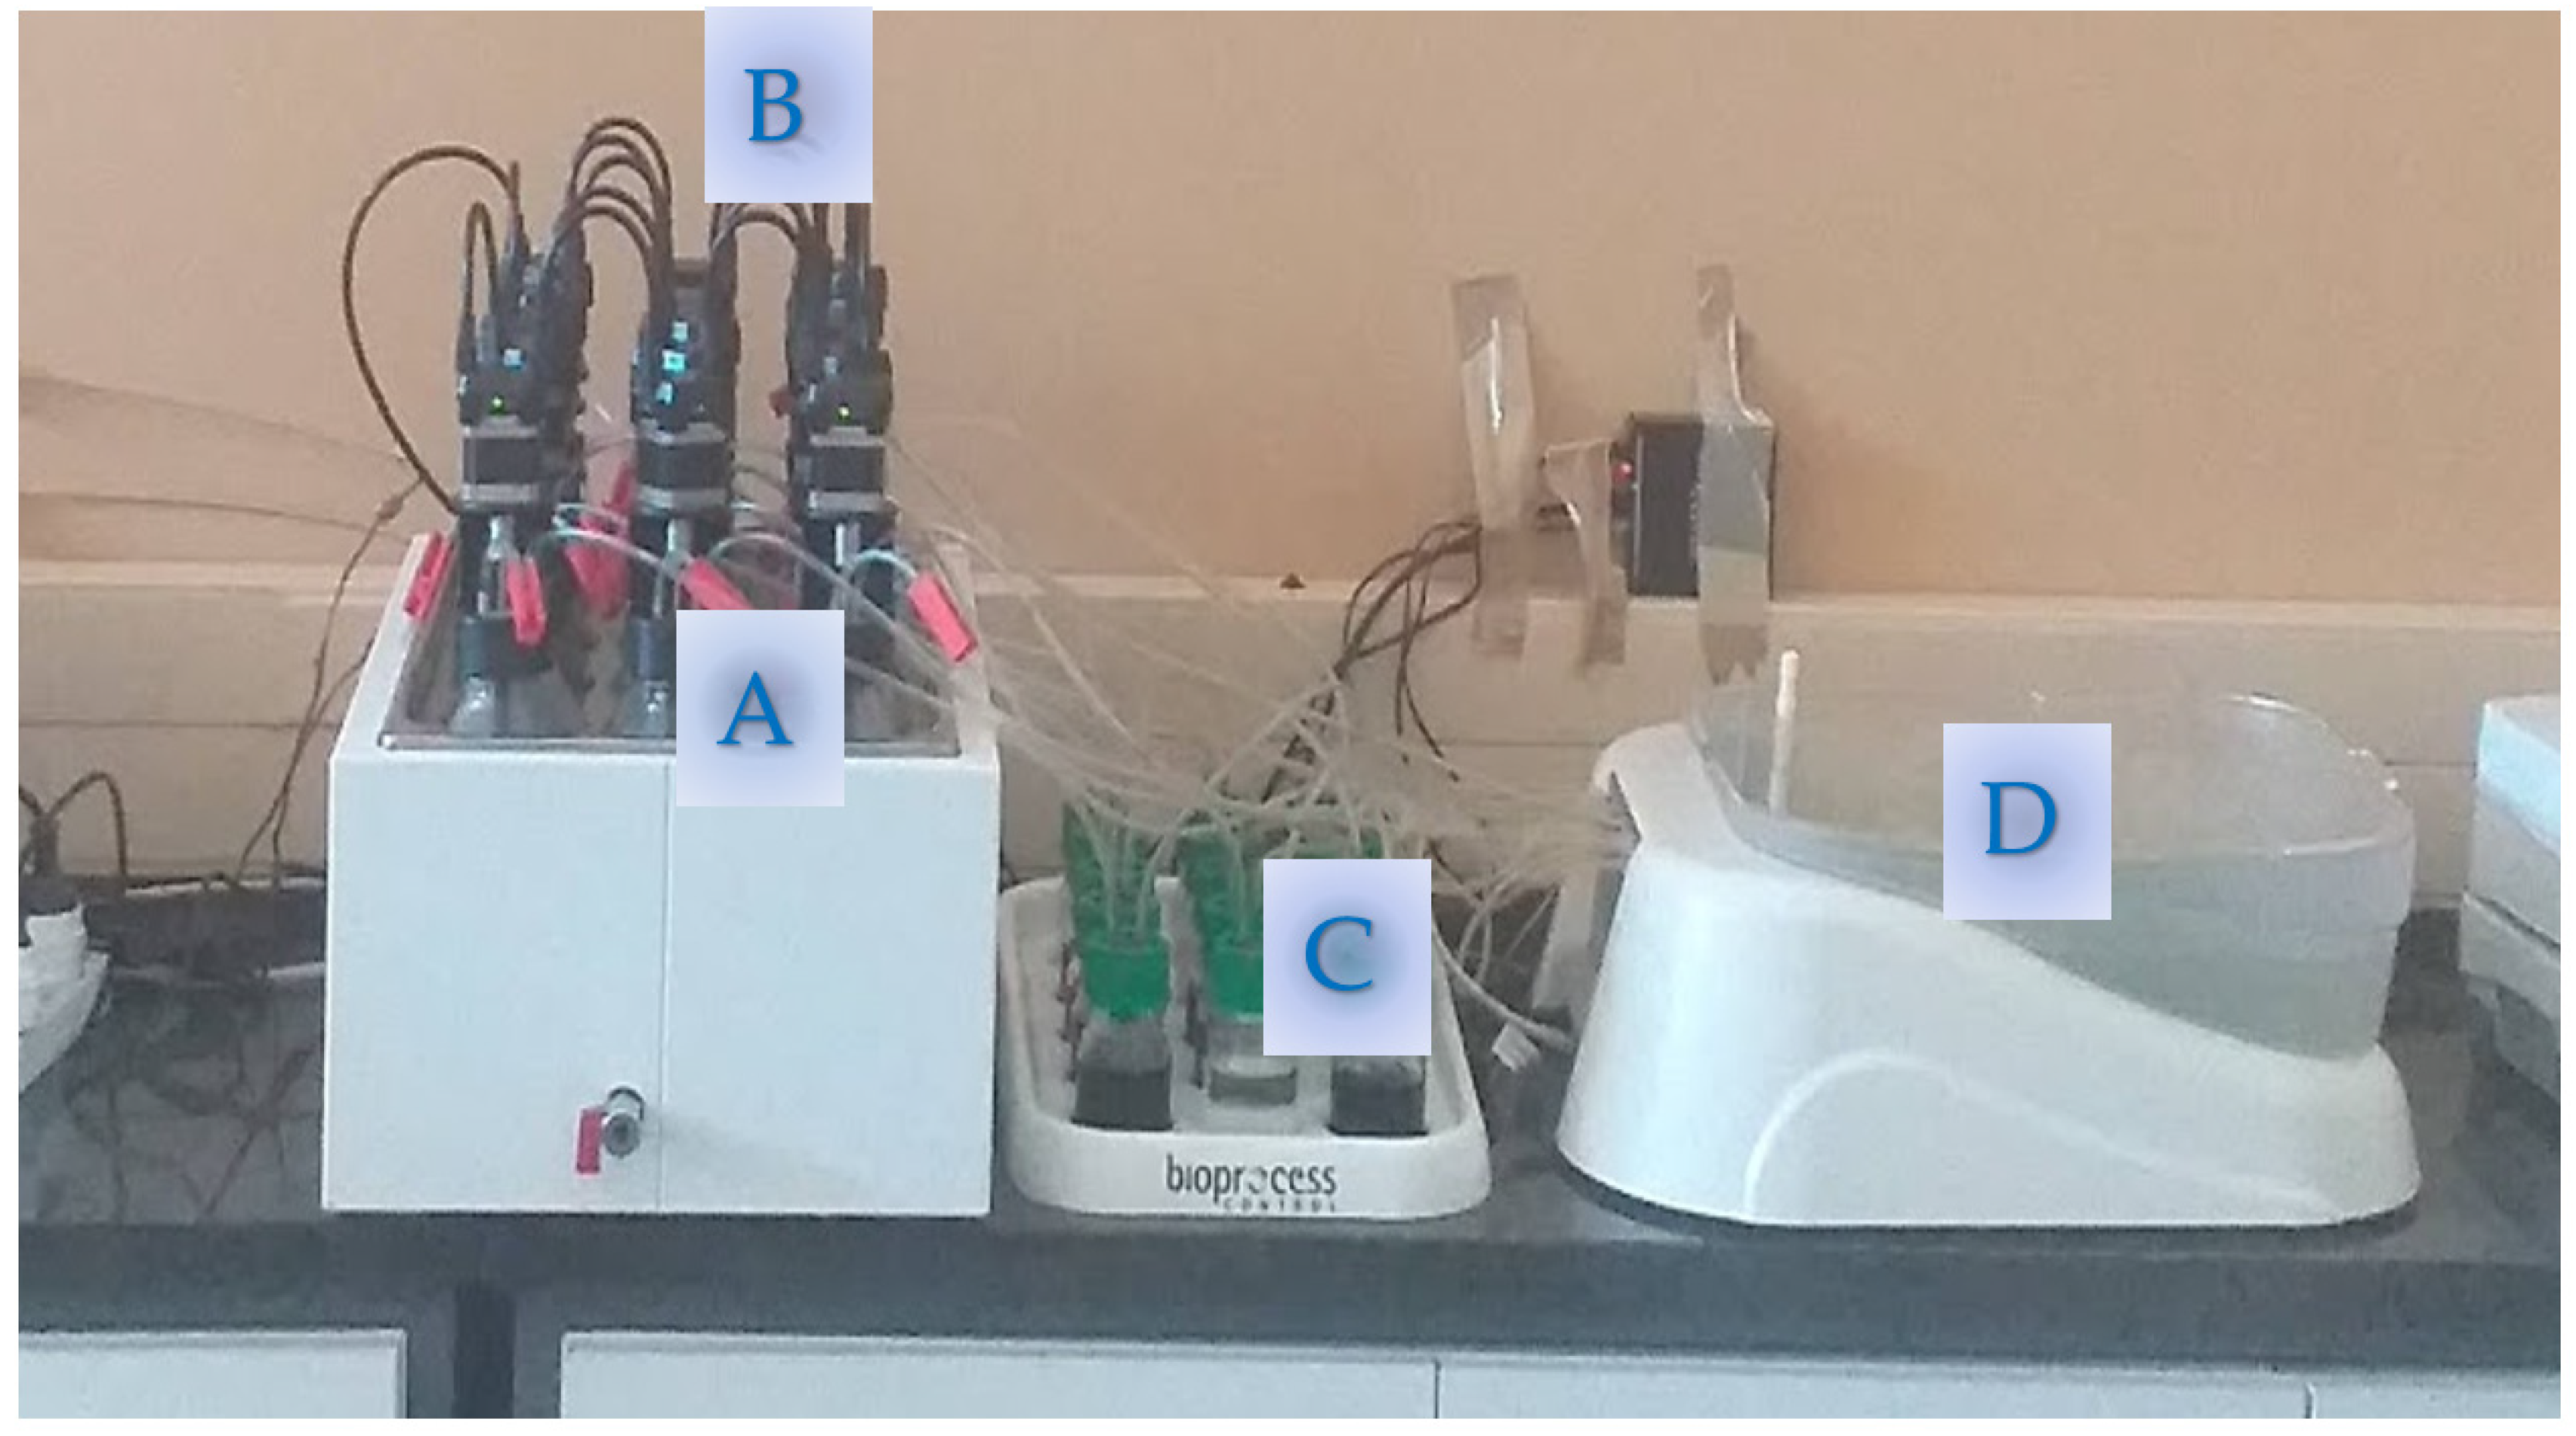
2.4. Batch Co-Digestion Experiment (Biochemical Methane Potential Apparatus)

Under laboratory conditions, the sludge was mixed at the recommended volume ratio of 50:50 (sludge: spent grain). It was then homogenized, screened through a 3 mm sieve, and portioned. The samples were analyzed for physicochemical parameters prior the BMP assay, which included the pH, total solids (TS), volatile solids (VS), total chemical oxygen demand (COD), Total Kjeldahl Nitrogen (TKN), total organic carbon (TOC), and total phosphorus (TP). The analysis was carried out according to the Standard Methods for the Examination of Water and Wastewater. The parameters were determined spectrophotometrically by the use of standard test kits (Hach-DR3900, USA) and the method available from the company website. The BMP assays were conducted based on the internally developed method at the university laboratory. Tests were carried out in triplicate, including a blank to ensure that the environmental samples have not been contaminated and a control to evaluate the methane on the inoculum. Schott’s glass bottles of 500 mL capacity, with 400 mL working volume were used to carry out the tests [33].
The substrate and the inoculum were introduced following a substrate/inoculum ratio in terms of volatile solids (VS). Once the bottles were closed, as shown in Figure 2, they were placed in a water bath-shaker in a controlled temperature of 35–40 ± 1 °C, in mesophilic conditions. The experiments were then carried out in duplicate using the AMPTS II designed specifically for BMP analysis. The inoculum-only test was used to account for the inoculum’s biogas contribution in all batch samples.
The duration of the experiments depends on the kind of substrate and subject of their productivity, where a production of less than 1% would indicate the end of the experiment. Once the assays were finished, the main parameters were analyzed in order to evaluate the effectiveness of the process, considering the removal results. The chemical oxygen demand (COD), VFA, alkalinity, pH level, and ammonia nitrogen and orthophosphate phosphorus were determined in the supernatant. The supernatant samples were obtained by centrifuging the sample at 4000 r min−1 for 30 min.

Characteristics of Sewage Sludge and Spent Grain

The characteristics of sewage sludge and spent grain are shown in Table 1. The characteristics of sewage sludge were reported as total solids (TS), volatile solids (vs), C/N ratio, and pH. The total solids and volatile solids were 3.6 (98.7%), 16.71 (97.5%), and 10.16 (98.1%) of sludge, grains, and the blend, respectively. These results correlate well with the results reported by [18]. It was reported that the favourable characteristic range for anaerobic digestion of sewage sludge in terms of TS and pH is 3–15% and 6.5–8.0, respectively [34]. The optimal C/N ratio is 15–30 to balance out the carbon and nitrogen requirements during anaerobic digestion [35]. The sewage sludge is shown to have a C/N ratio that is lower than recommended. Contrarily, spent grain is above the optimum range. Brewery spent grains are lignocellulosic materials which are known to contain high amounts of carbon and are recalcitrant to degradation, slowing down their decomposition rate [36]. However, when blended together at a 1:1 ratio, the resulting C/N was 19.51, which is favourable for anaerobic digestion.
The characteristics of sewage sludge and spent grain are shown in Table 1. The characteristics of sewage sludge were reported as total solids (TS), volatile solids (vs), C/N ratio, and pH. Please note that the %VS is presented as per solid content of the sample (per %TS). The total solids and volatile were 3.6 (98.7)%, 16.71 (97.5)% and 10.16 (98.1)% of sludge, grains, and the blend, respectively. These are similar to values obtained in a previous study conducted by Alemahdi et al. [18]. It was reported that the favourable characteristic range for anaerobic digestion of sewage sludge in terms of TS and pH is 3–15% and 6.5–8.0, respectively [34]. The optimal C/N ratio is 15–30 to balance out the carbon and nitrogen requirements during anaerobic digestion [35]. The sewage sludge is shown to have a C/N ratio that is lower than recommended. Contrarily, spent grain is above the optimum range. Brewery spent grains are lignocellulosic materials which is known to contain high amounts of carbon and are recalcitrant to degradation, slowing down decomposition rate [36]. However, when blended together at 1:1 ratio, the resulting C/N was 19.51 which is favourable for anaerobic digestion.

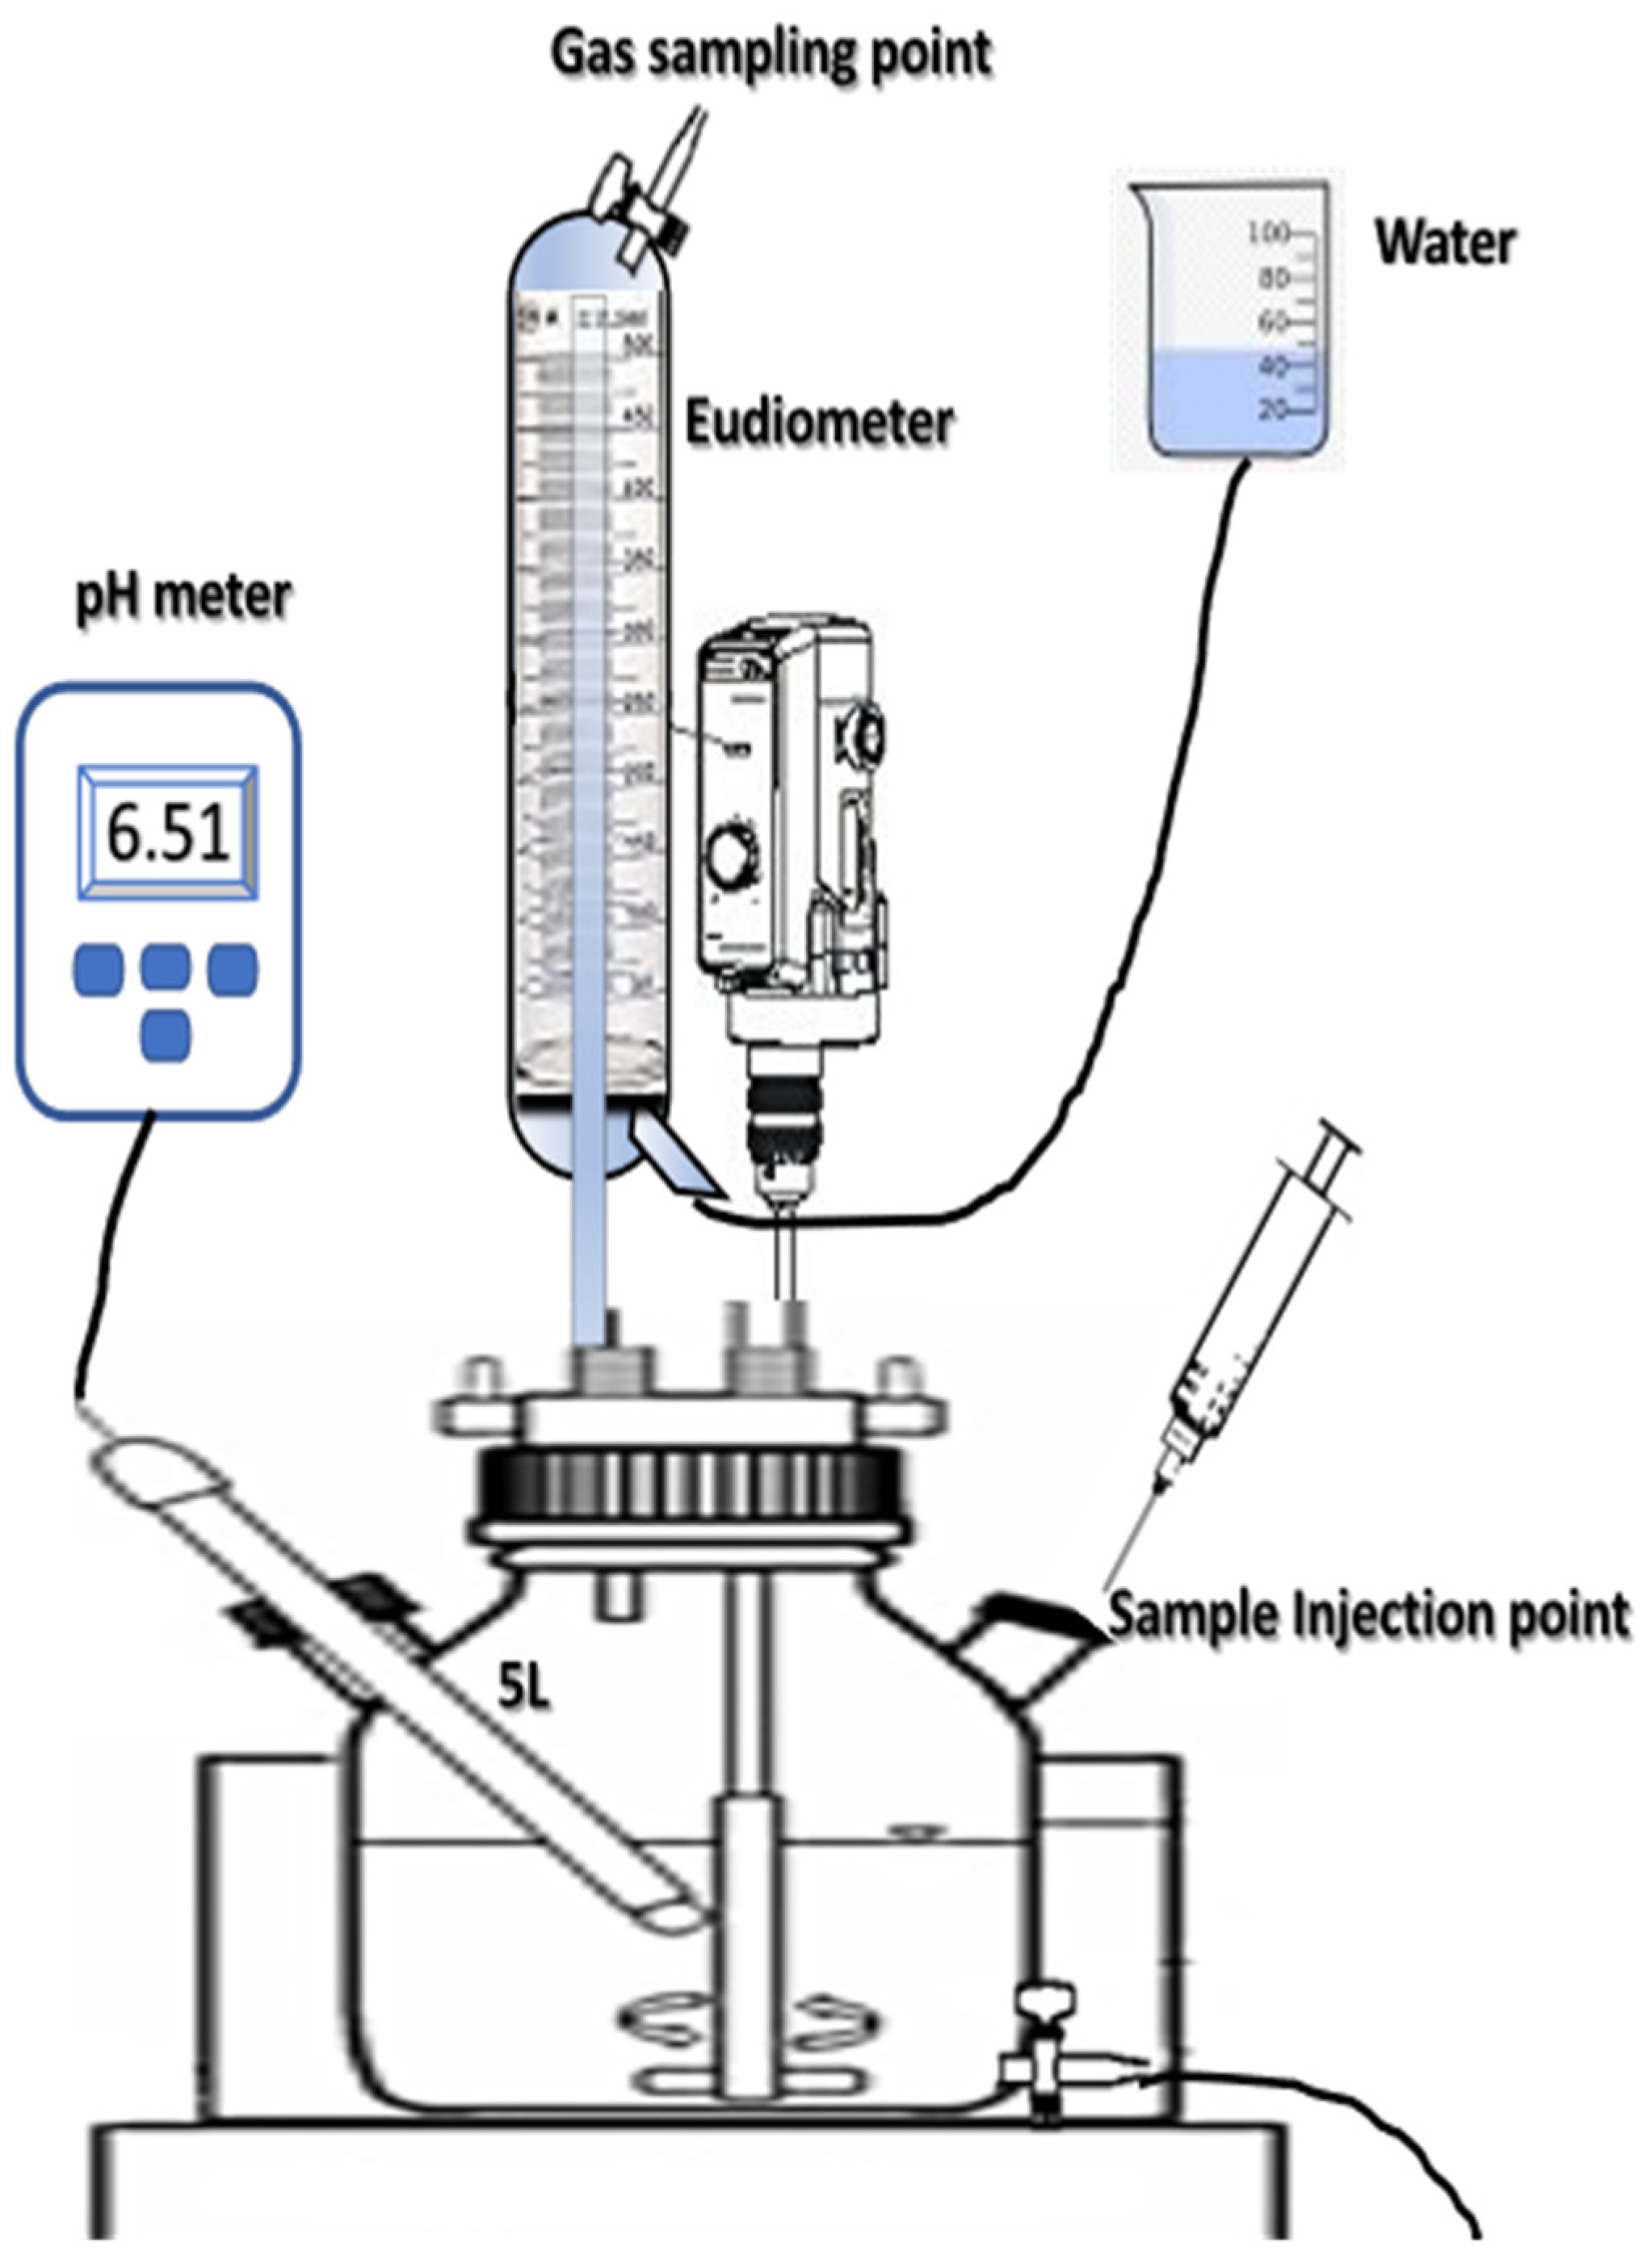
2.5. Semi-Continuous Experimental Set-Up

To investigate a nearly practical performance of the AD process, 5 L reactors were used, as shown in Figure 3. This setup was designed and fabricated for the semi-continuous digestion experiment. One of the digesters treated the substrate. Each cycle of the semi-continuous operation was for 24 h and included the following steps: feeding (~1 h); anaerobic digestion (23 h); and digestate partial draining (~1 h simultaneously with feeding). Both digesters were filled with only inoculum and sealed at the beginning of the experiment. The experimental set-up operated at 35–40 ± 1 °C, and the flowrate meter used to measure the biogas produced. The temperature of the digester was supplied by a 75 W submersible heating element; this was connected to a temperature controller. The operating volume of the digester unit was 3 L. The reactor was fitted with an IKA overhead stirrer that operated at 100 RPM over 10 min/h. The stirrer was programmed to switch on and off periodically as it communicated with the automatic timer. The semi-continuous test was conducted for a duration of 150 days. The experimental samples were collected daily in triplicate in a cycle of 24 h using a Geotech Biogas 5000 instrument. For co-digestion of sewage sludge and spent grain, a 1:1 ratio was used, and the results of co-digestion were compared with those from the control experiment, where the experiment contained only inoculum as a refence for methane production.
The start-up stage involved steadily raising the digester’s loading capability and then changing the microbial community’s routine substrate dose. A low organic loading rate (OLR) was used as the initial feeding to adapt the microbial population to the new substrate, as opposed to its source. Then, the OLR was slowly raised until the starting inoculum was entirely replaced and the microbial population had been acclimated. The starting OLR was set to 0.5 g VS/L.d for the first week; it was iteratively increased according to the standard OLR procedure outlined in [37]. The OLR was guided by volatile fatty acids to a total alkalinity ratio (VFA/TA). If the VFA/TA ratio was below 0.2 after a week, the OLR needed to be increased by 0.5 g VS/L.d for another week. However, if the VFA/TA ratio range was between the range of 0.2 and 0.4, the OLR needed to be maintained at 0.5 g VS/L.d.
There are cases where the VFA/TA was above 0.4; in this scenario, pH was used as a guidance for OLR. When the pH of the material was between 6.5–7.0, the OLR was reduced by 0.5 g VS/L.d; for a pH below 6.5 but above 6.0, OLR was reduced by 1.0 g VS/L.d. If the pH was lower than 6.0, the feeding was stopped and the material was neutralised with an alkaline substrate until the pH was between 6.5 and 7.0.

3. Results and Discussion
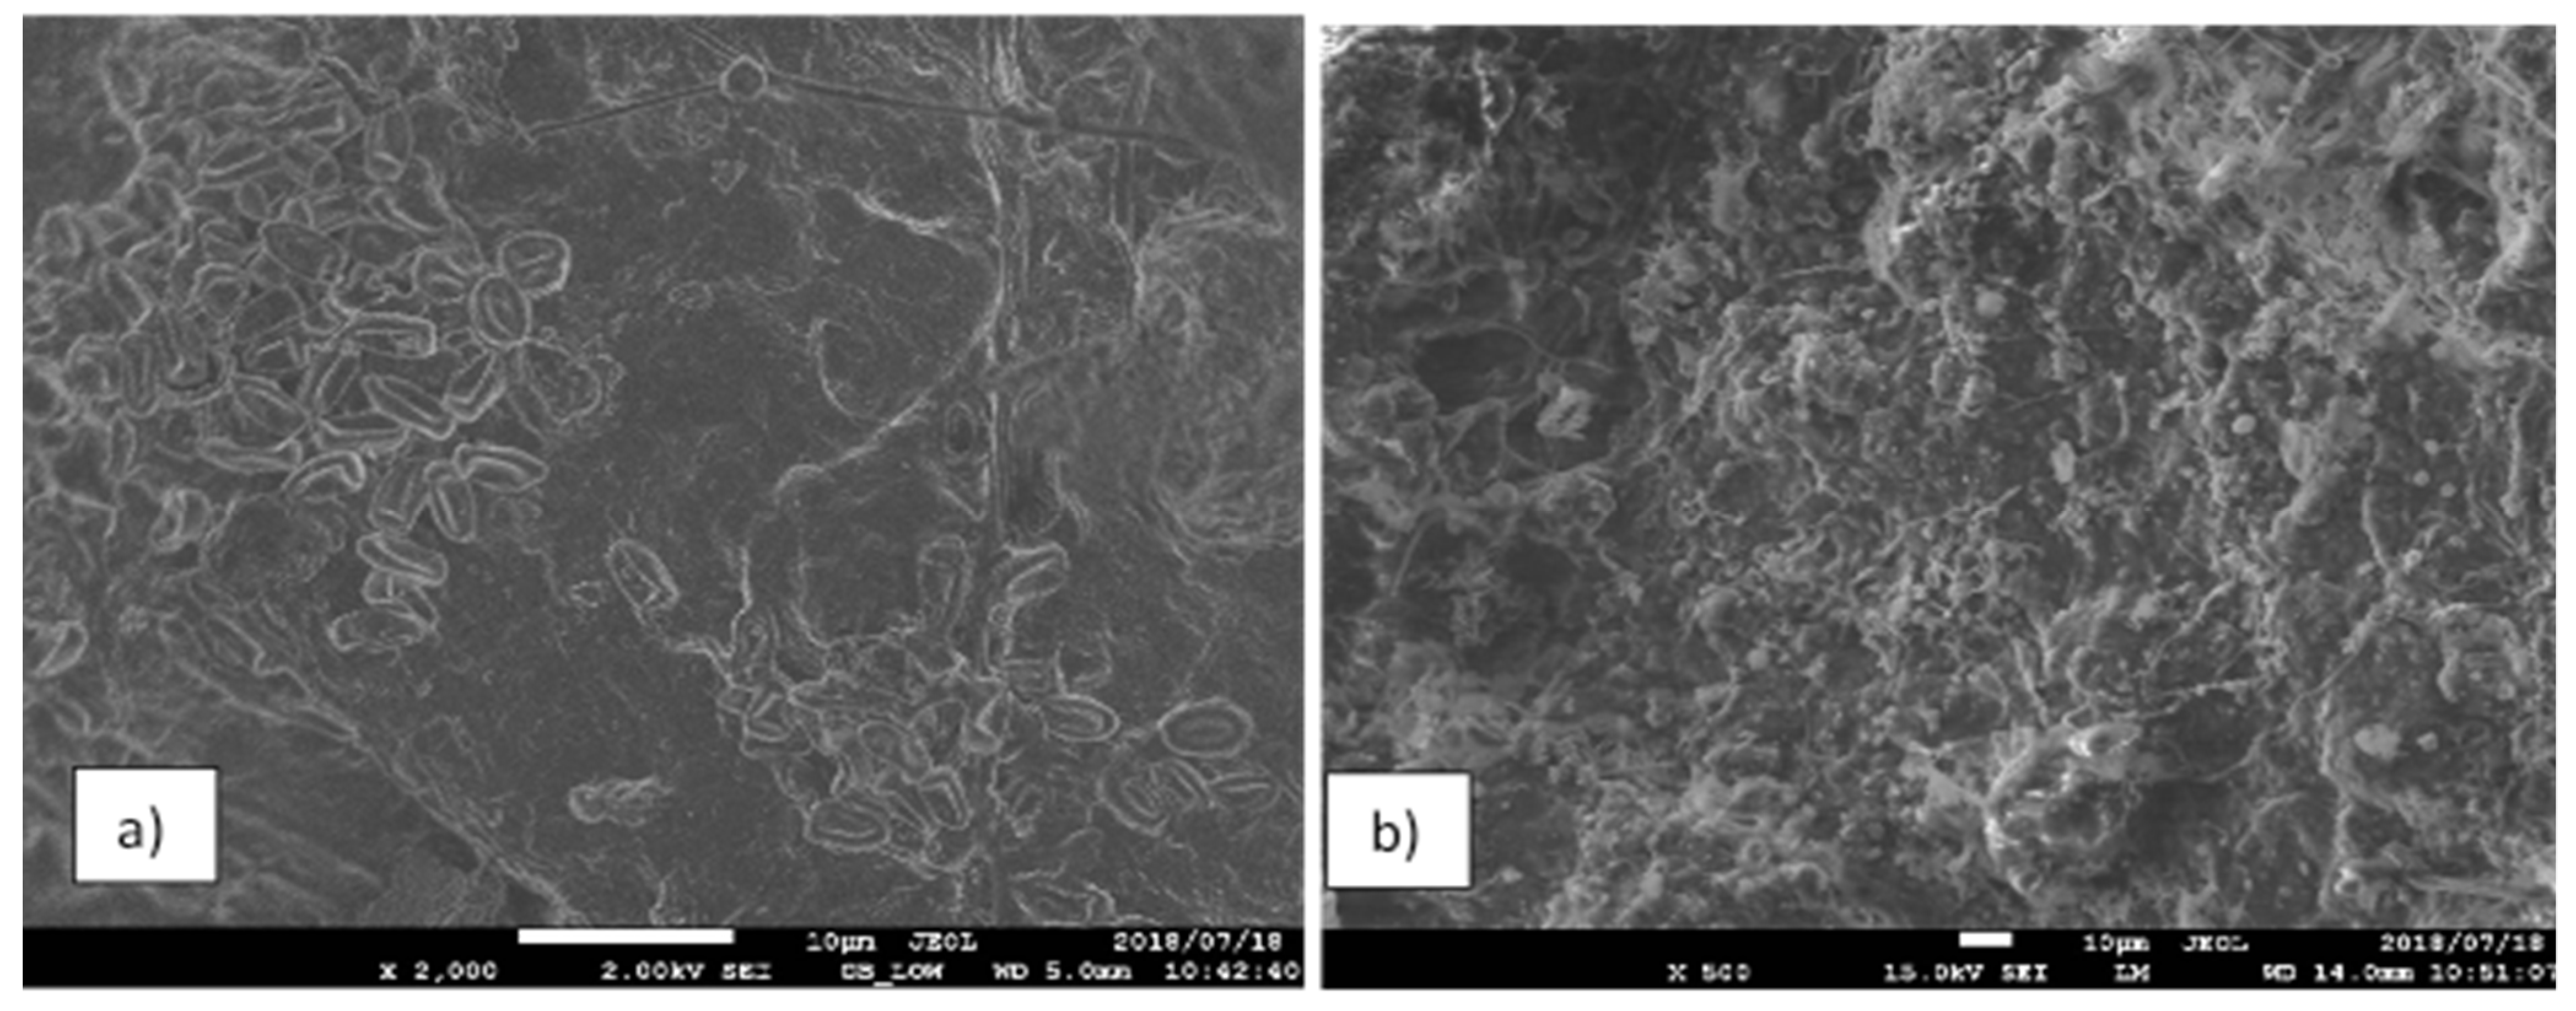
3.1. SEM Imaging

A scanning electron micrograph (SEM) was carried out to evaluate the morphology of the materials from a microbiological point of view. The micrographs were obtained from native sewage sludge and digested sewage sludge, according to the methodology described earlier in Materials and Methods. These micrographs were selected in order to show a representative image of the observed structures; the magnification may differ in order to highlight certain areas of interest. Since organic samples are sensitive and could easily react to the effect of the electron beam, the SEM used is a new generation microscope equipped with analytical techniques sufficient for complete characterization of a wide range of materials. It is made to reduce the sample vacuum, avoid surface damage, electrically conductive, void of free particles and volatile matter-free. Additionally, the reduced electron beam was used, and it was optimized so that image resolution did not suffer as a result.
As shown in Figure 4a microscopic observations showed that the raw sewage sludge exhibited a structure with a rough and granular texture, with a large amount of open porosity. This is similar to the images reported by Han et al. [38] and Yan et al. [39]. Figure 4a shows that large amounts of hydration products cover the surface of sludge particles. Figure 4b shows an excessive growth of filamentous microorganisms after anaerobic digestion. Different groups of filamentous bacteria were present, but no dominant type of morphology was observed. As a result, floccs are present in a skeleton form of structure which promotes the attachment of other microorganisms by their extracellular polymeric substances, according to the mechanism which was suggested by Alemahdi et al. [18]. Similar SEM images of wastewater sludge were described by the same source. It is well known that a large filamentous population causes detrimental effects on liquid waste treatment systems due mainly to the loss of sludge settling (bulking) and foam generation. However, relatively little is known regarding the factors that affect the growth of these filaments.

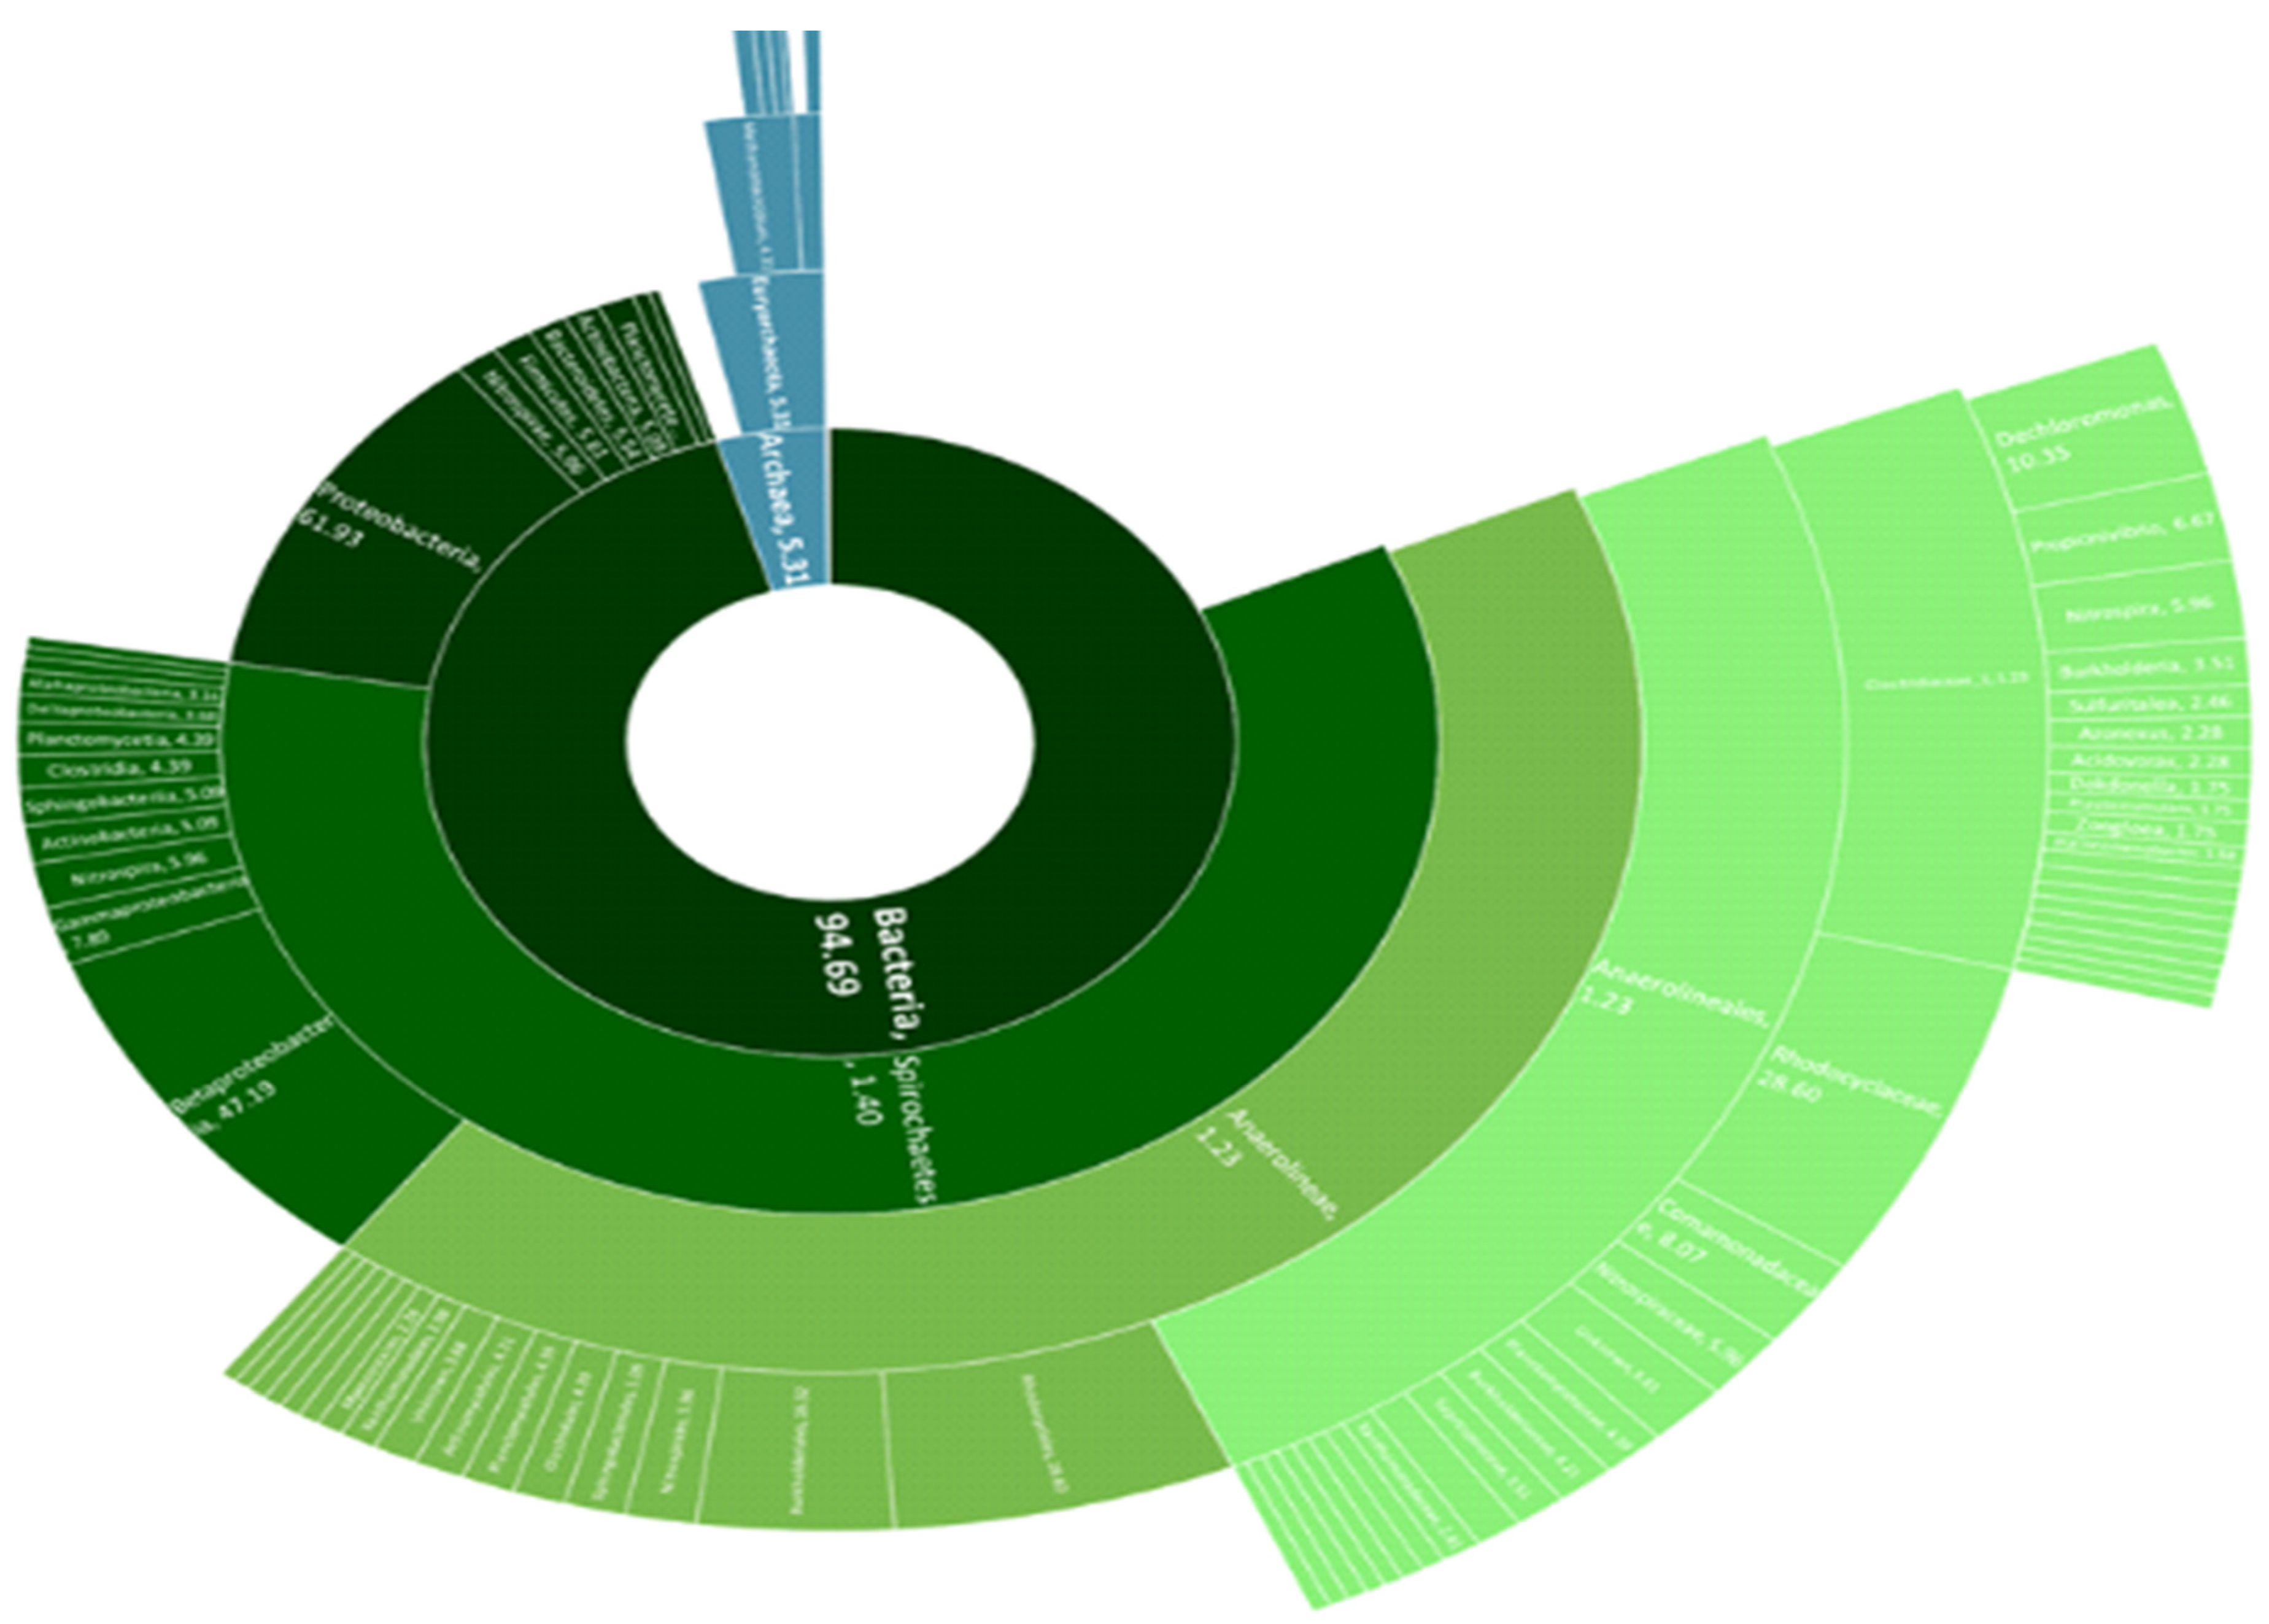
3.2. Taxonomic Profile of the Biogas Microbial Community

The taxonomic distribution of the microbial community indicated that the most abundant domain was the Bacteria, followed by the Archaea (Figure 5). This analysis reveals that 94 of the amplicons were of bacterial origin, whereas only one amplicon could be assigned to the kingdom of Archaea. Proteobacteria was most abundant followed by the group of Bacteroides, Firmicutes and Actinobacteria. Among the Proteobacteria subclass, Alpha- and Delta- were more dominant than Gamma- and Beta-proteobacteria. The genera that dominated were Dechloromonas Propionivibrio, and Nitrospira there. There is an acceptable count of methanogens and other species. Some of the sequences belong to the phylum Spirochaetae, with the most abundant class being Anaerolineae. This class contributed to the majority of the Bacteria domain in the sludge sample. In the Archaeal domain, the most abundant family was the Methanomicrobiales. These species have been identified frequently in the anaerobic digestion of sewage sludge and food waste [40,41].
Besides the appearance of Proteobacteria, there was an appearance of Nitrospirae, which uses urea as a source nutrient and converts it to carbon dioxide (CO2), which then reacts with hydrogen (H2) to form methane [42]. As indicated in Figure 5, about 5.61% of Firmicutes are unclassified; these are Gram positive bacteria known for carbohydrate metabolism [19]. Further sequences were assigned to the class Bacteroidetes, which is similar to Firmicutes; these are known for breaking down carbohydrates to simple sugars. Additionally, Bacteroidetes are good energy converters and amino acids metabolisers; hence, they appear frequently during AD and biogas production [43]. The phylum Chloroflexi and the class Actinobacteria were identified as non-abundant taxa. Only few sequences could be allocated to lower taxonomic ranks such as ‘family’ or ‘genus’ [44].

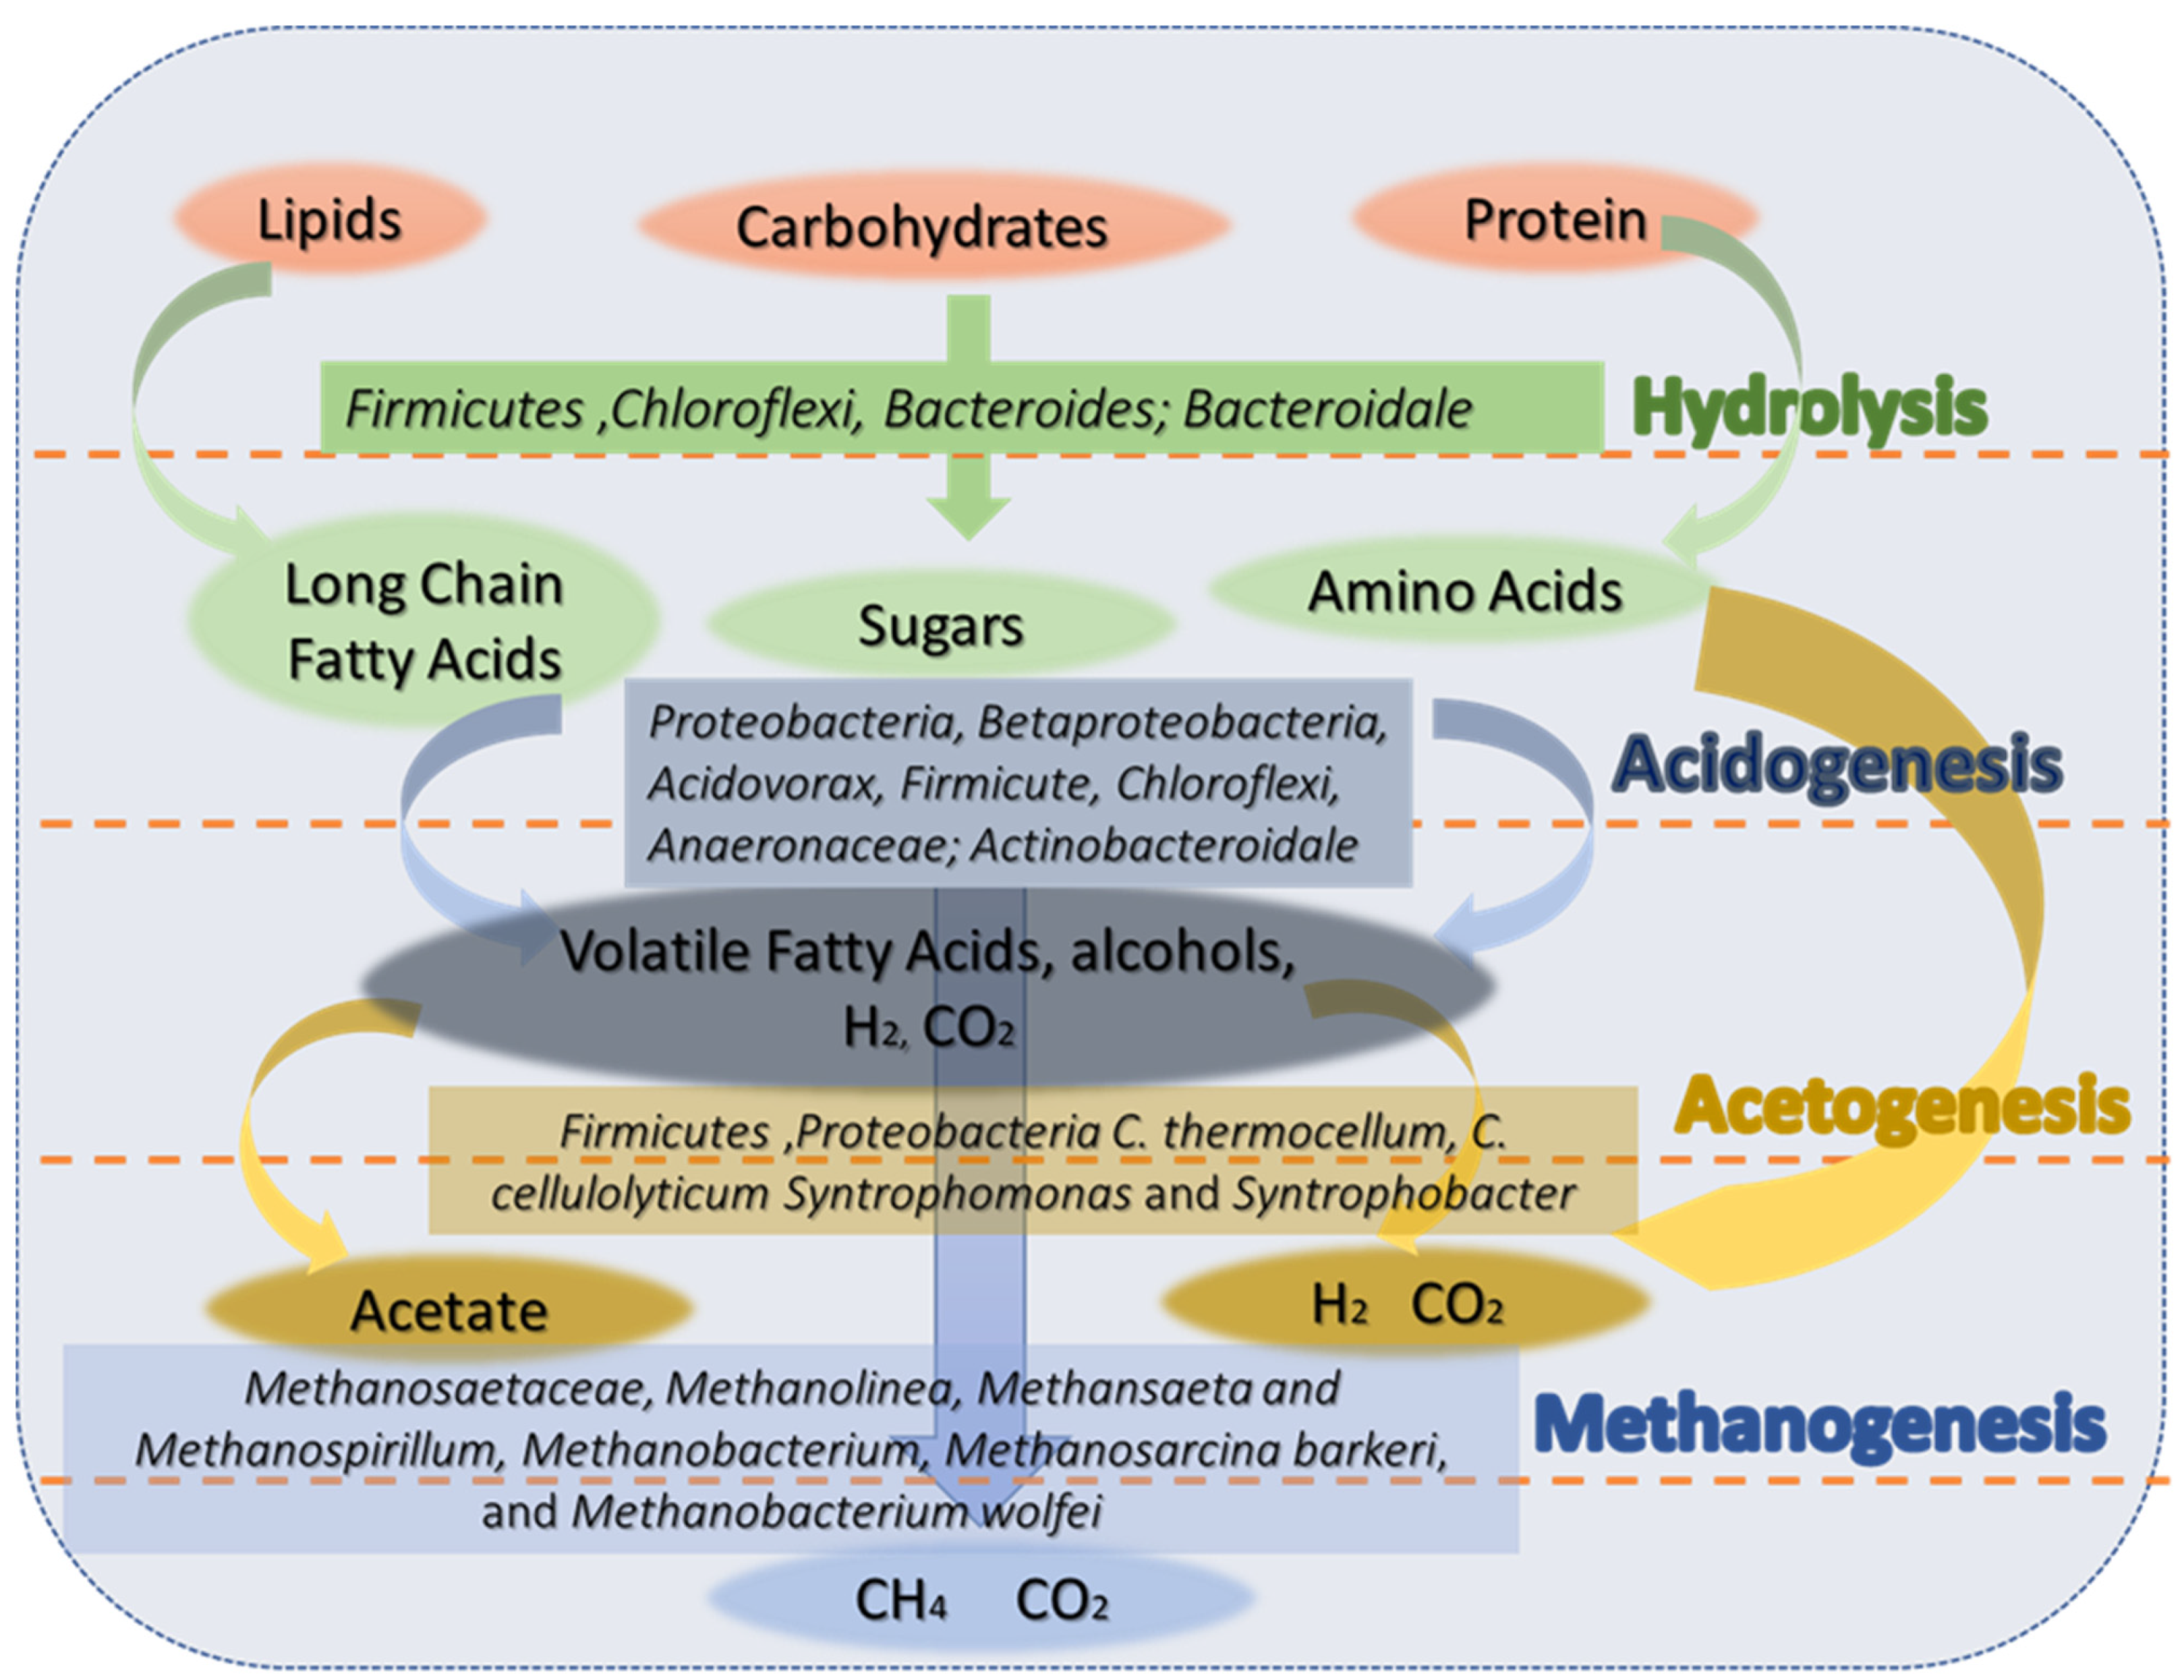
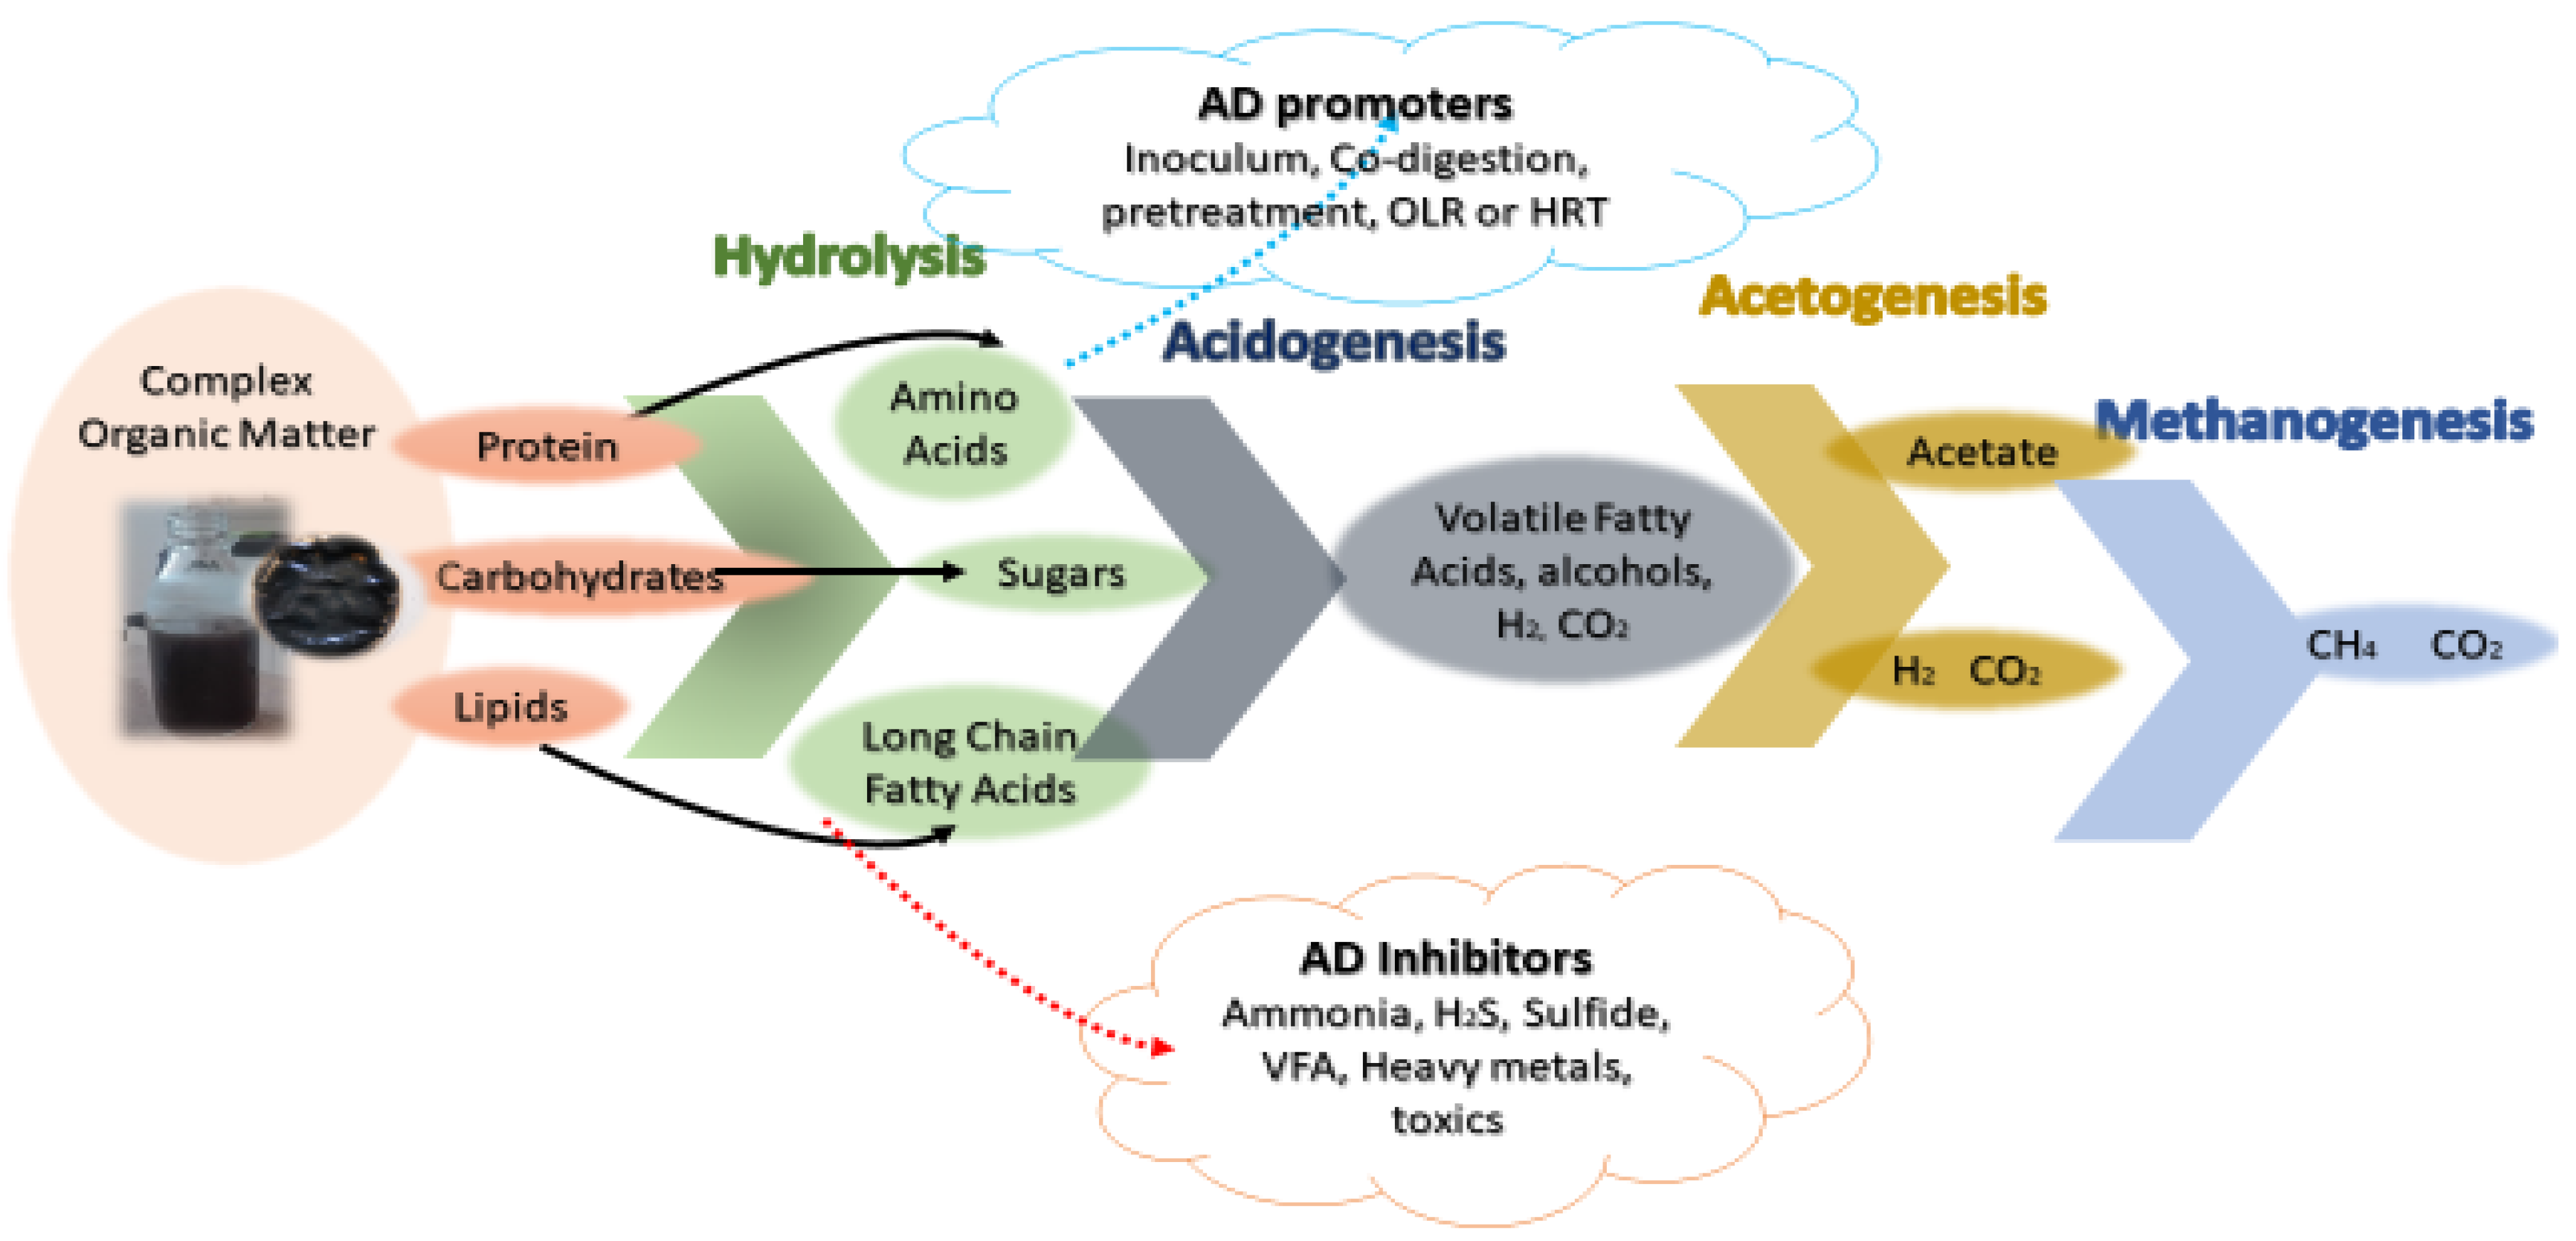
3.3. Metabolic Pathway Analysis

Anaerobic degradation requires the participation of various bacterial species, and each step is driven by a group of microorganisms such as hydrolytic, acid forming, acetogenic, and methanogenic archaea that produce carbon dioxide (CO2) and methane (CH4) as end products [45]. The first step in anaerobic degradation is the hydrolysis of complex organic substrates, which involves the breakdown of large molecules [46,47]. The communities of bacteria that are involved in this step are identified by efficient hydrolysis of plant biomass that is rich in lignocellulose. Most of these bacteria belong to the classes of Clostridia and Bacilli. As expected, the overwhelming majority of the identified abundant species in the AD system are members of the Betaproteobacteria (36.61%), Clostridia (14.81%) and Bacilli (6.18%) classes, together with members of the Mollicutes (1.75%), Gammaproteobacteria (3%), and Actinobacteria (5.09%) classes (Figure 6). Among the Clostridia, Clostridium thermocellum occurred most frequently and, in the Bacilli family, Bifidobacterium dominated. This species can hydrolyze cellulose efficiently by means of its extracellular cellulases, which are organised into cellulosomes [48].
The second stage is acidogenesis, in which the acid forming bacteria ferment the hydrolytic products into volatile fatty acids, acetate, and hydrogen [18,45]. In this study, the phyla that contain many known species of acidogens are Proteobacteria (61.93%), Firmicutes (5.61%), Bacteroidetes (5.54%), and Chloroflexi (2.28%). Under the phylum Proteobacteria, Betaproteobacteria dominated the most. In Firmicutes, Lactobacillus gave a highest read count, as did Anaerolinaceae in the phylum Chloroflexi. Acidovorax dominated in the phylum Actinobacteria and in a few thermophilic bacteria. The fermentation pathways yield organic acids such as acetate and butyrate, or acetone, butanol, and ethanol [18]. In the phylum Firmicutes and Proteobacteria are the genera Syntrophomonas and Syntrophobacter that generate lactate, acetate, and butyrate from sugars; this is also performed through their hydrogenase process, which produce H2. Similarly to C. thermocellum, C. cellulolyticum is a well-known strain that degrades cellulose to acetate and evolves CO2 and H2. C. saccharolyticum, which also possesses cellulolytic activity. The fermentation products include acetate, ethanol, H2, and CO2. The last stage is methanogenesis, in which the most commonly observed methanogenic genera such as Methanolinea, Methansaeta, and Methanospirillum produce methane [40,41]. The archaea community of hydrogenotrophic methanogen genus enrichment includes methanogens such as Methanobacterium, thermoautotrophicum, Methanosarcina barkeri, and Methanobacterium wolfei.

3.4. Anaerobic Co-Digestion Experiments

3.4.1. Methane Production: Batch Studies

The results of cumulative biogas production profiles for mono-digestion of sewage sludge and spent grain, along with co-digestion of a 1:1 ratio, is shown in Figure 7. As evident from Table 1, the C/N ratio and TS of both individual feedstocks were outside the optimal range for AD; however, when blended, they were within the optimal range [49]. As a result, biogas production was increased in volume using co-digested samples compared to sewage sludge alone. Approximately 95, 645, and 320 mL/kg of feed methane were produced from the mono-digestion of sewage sludge and spent grain and co-digestion of the two feedstocks mixed at ratio of 1:1, respectively. These results are consistent with data from the literature [33,34,50]. It can be observed that biogas production rapidly increased from day 1 until day 10 for most of our sample, except for spent grain mono-digestion. This is due to the intra and intermolecular hydrogen bonds creating crystal structures of difficult ace. Additionally, the presence of low soluble COD and the lignocellulose in the grains caused low biodegradability and a slower biodegradation rate [51].
The highest BMP was obtained with the co-digestion of SS and BSG, and 965 mL/kg of feed. This is a three-fold increase compared to the assay of sludge mono-digestion. Noteworthy is the fact that, just after 2 days, methane production reached 80% of the maximum, stabilizing at 10 days (Figure 7). The improvement in methane production could be attributed to the favourable balancing out of C/N ratio, TS, and the microbial community [18,45]. Co-digestion increases the organic matter available as volatile fatty acids (VFAs) and biogas productivity, as a consequence of the subsequent degradation of VFAs by methanogens [52]. Furthermore, in the microbiological interpretation, co-digestion is the introduction of the hydrolytic-acidogenic species which increase the biodegradability of the blend [53]. It was also noticed that, during the steady-state period, a significant shift occurred, with Proteobacteria becoming the most abundant phylum and hydrogenotrophic methanogens dominating over aceticlastic methanogens [54].

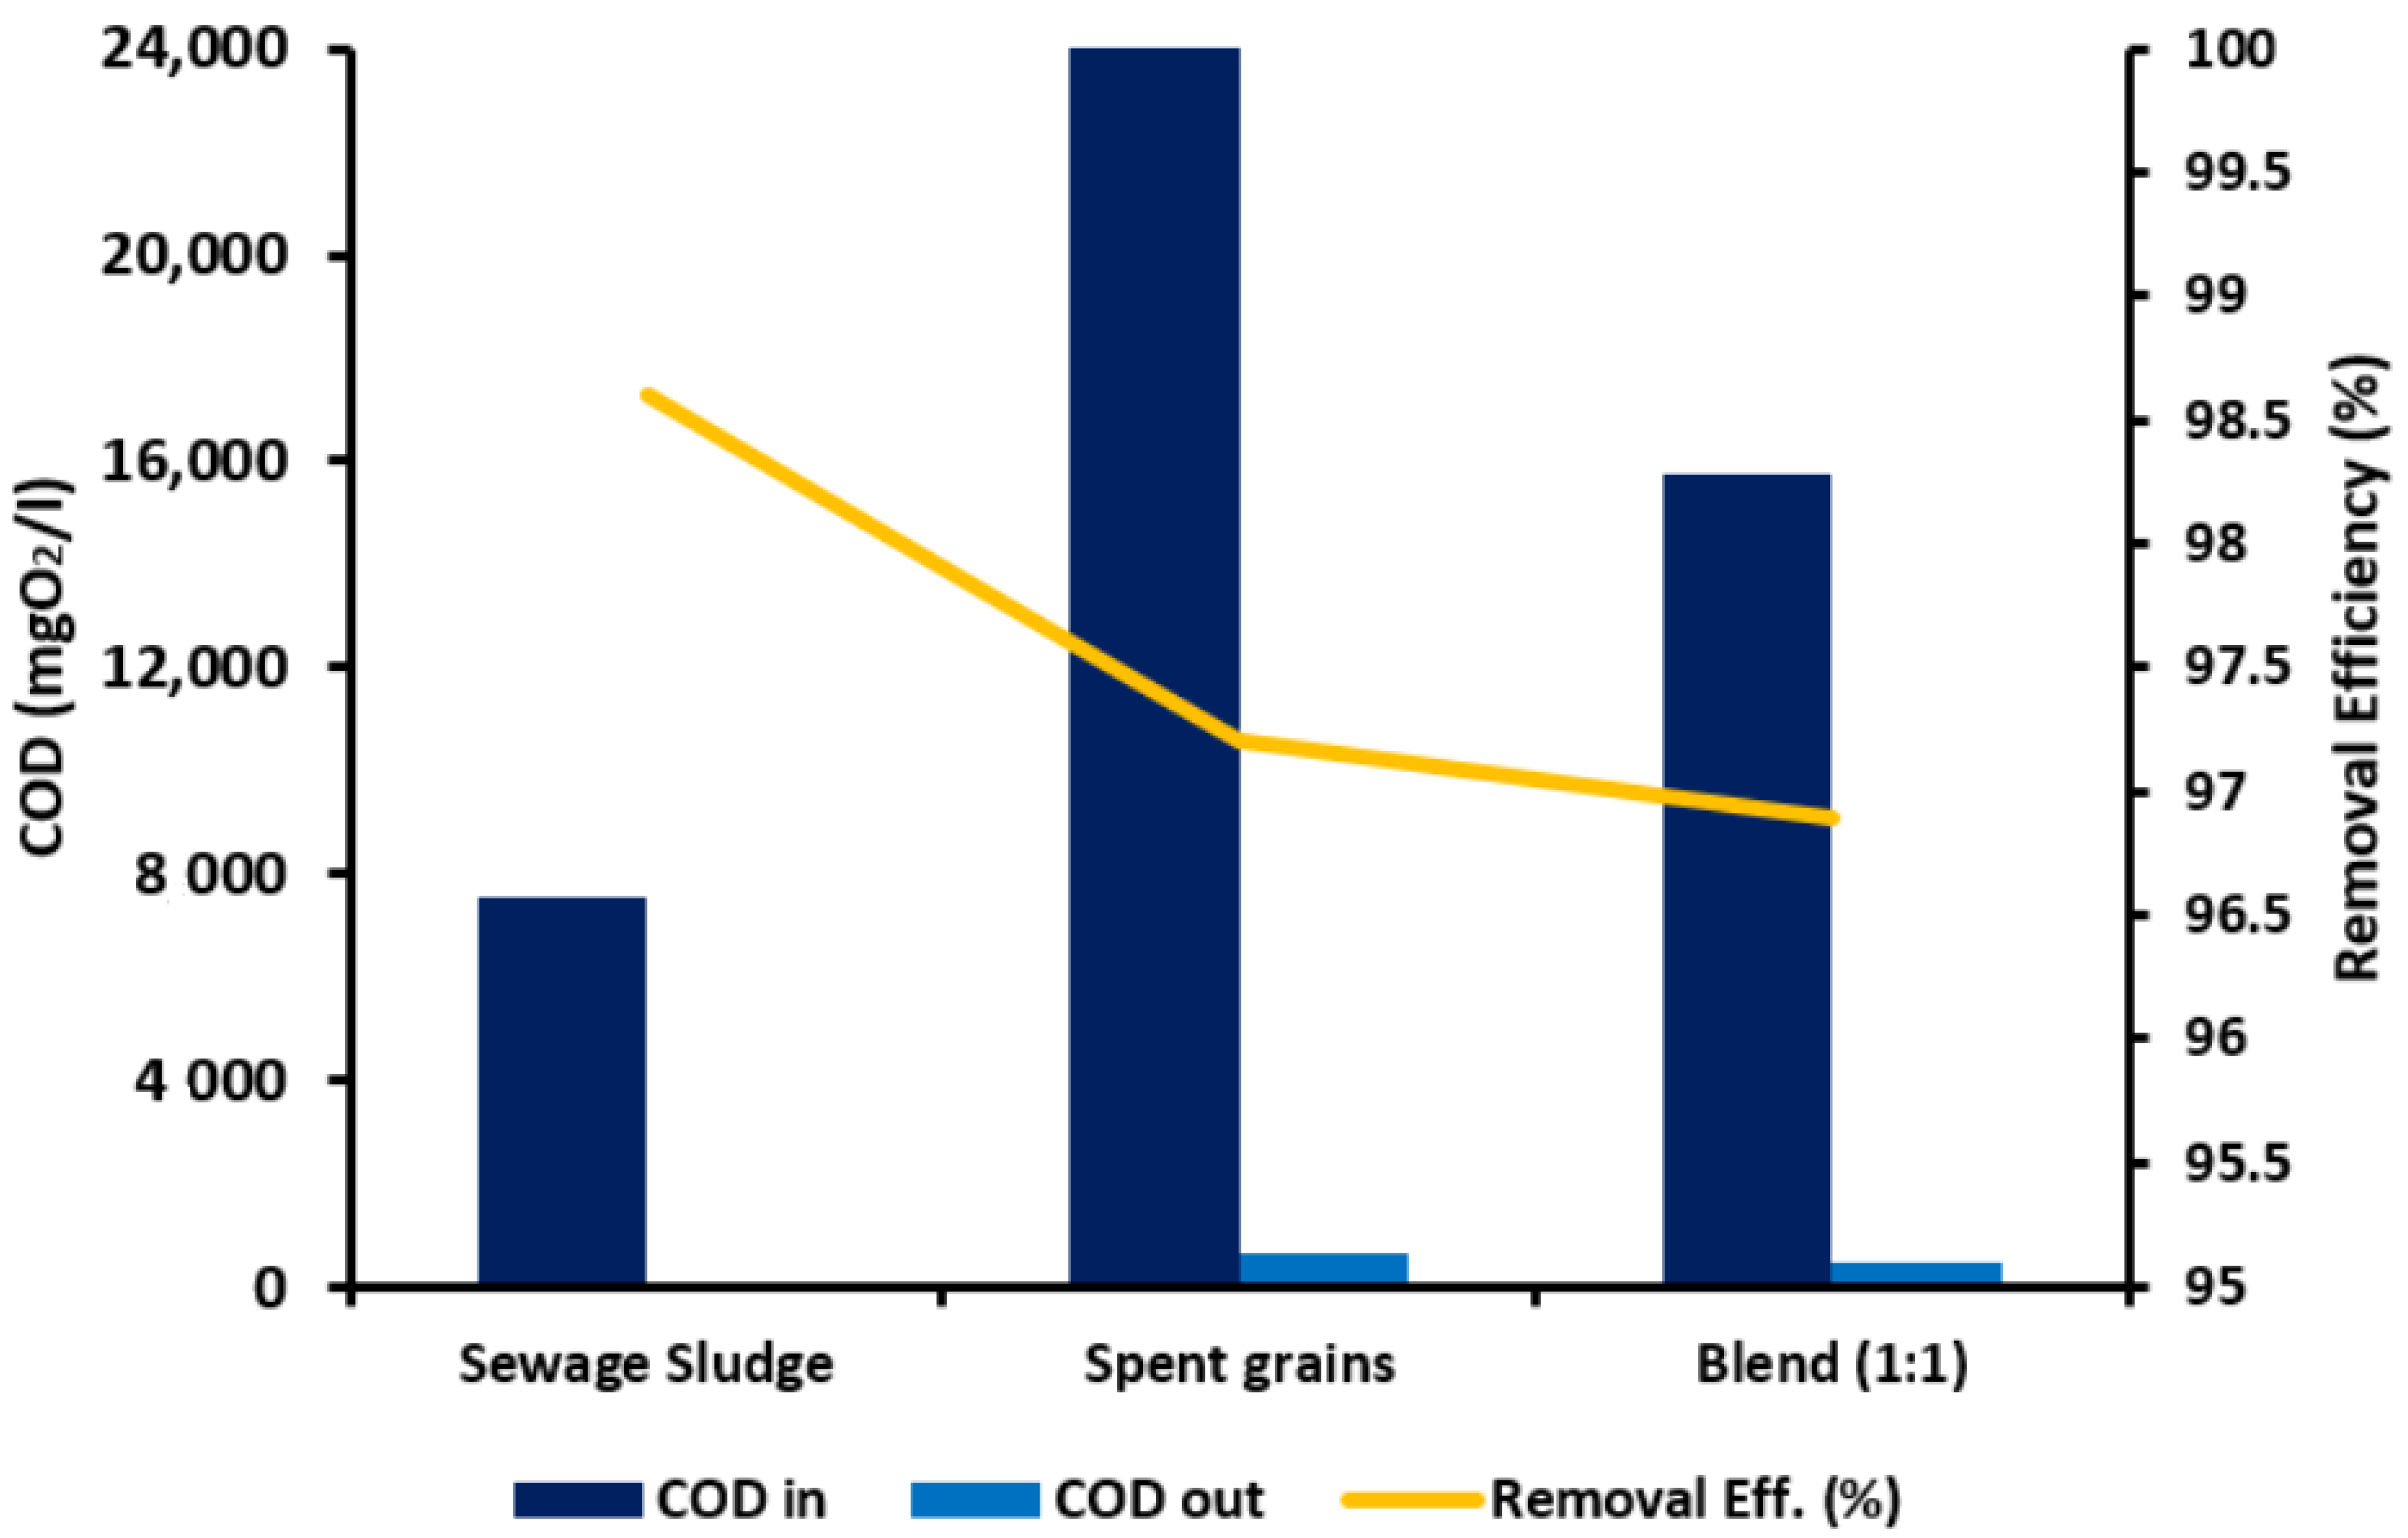
3.4.2. COD Removal Efficiency in AD

During AD, the bacteria convert COD to methane and carbon dioxide. As such, the COD removal efficiency can be used to assess the accomplishment of the process in producing methane. In this study, all the samples exhibited excellent COD removal above 65%, as indicated in Figure 8, indicating that COD can be successfully treated during both mono-digestion and co-digestion processes [55,56]. The effluent COD concentration was below 7.0 g O2/kg. Similar results of COD removal efficiency were reported elsewhere. Studies conducted by [57,58,59] show that high COD removal efficiency was achieved when organic loading rate was increased and constant HRT was maintained in the AD system. In addition, the pH of the system was closely monitored on daily basis to avoid a pH drop to below 6.5, which could result in low COD conversion.

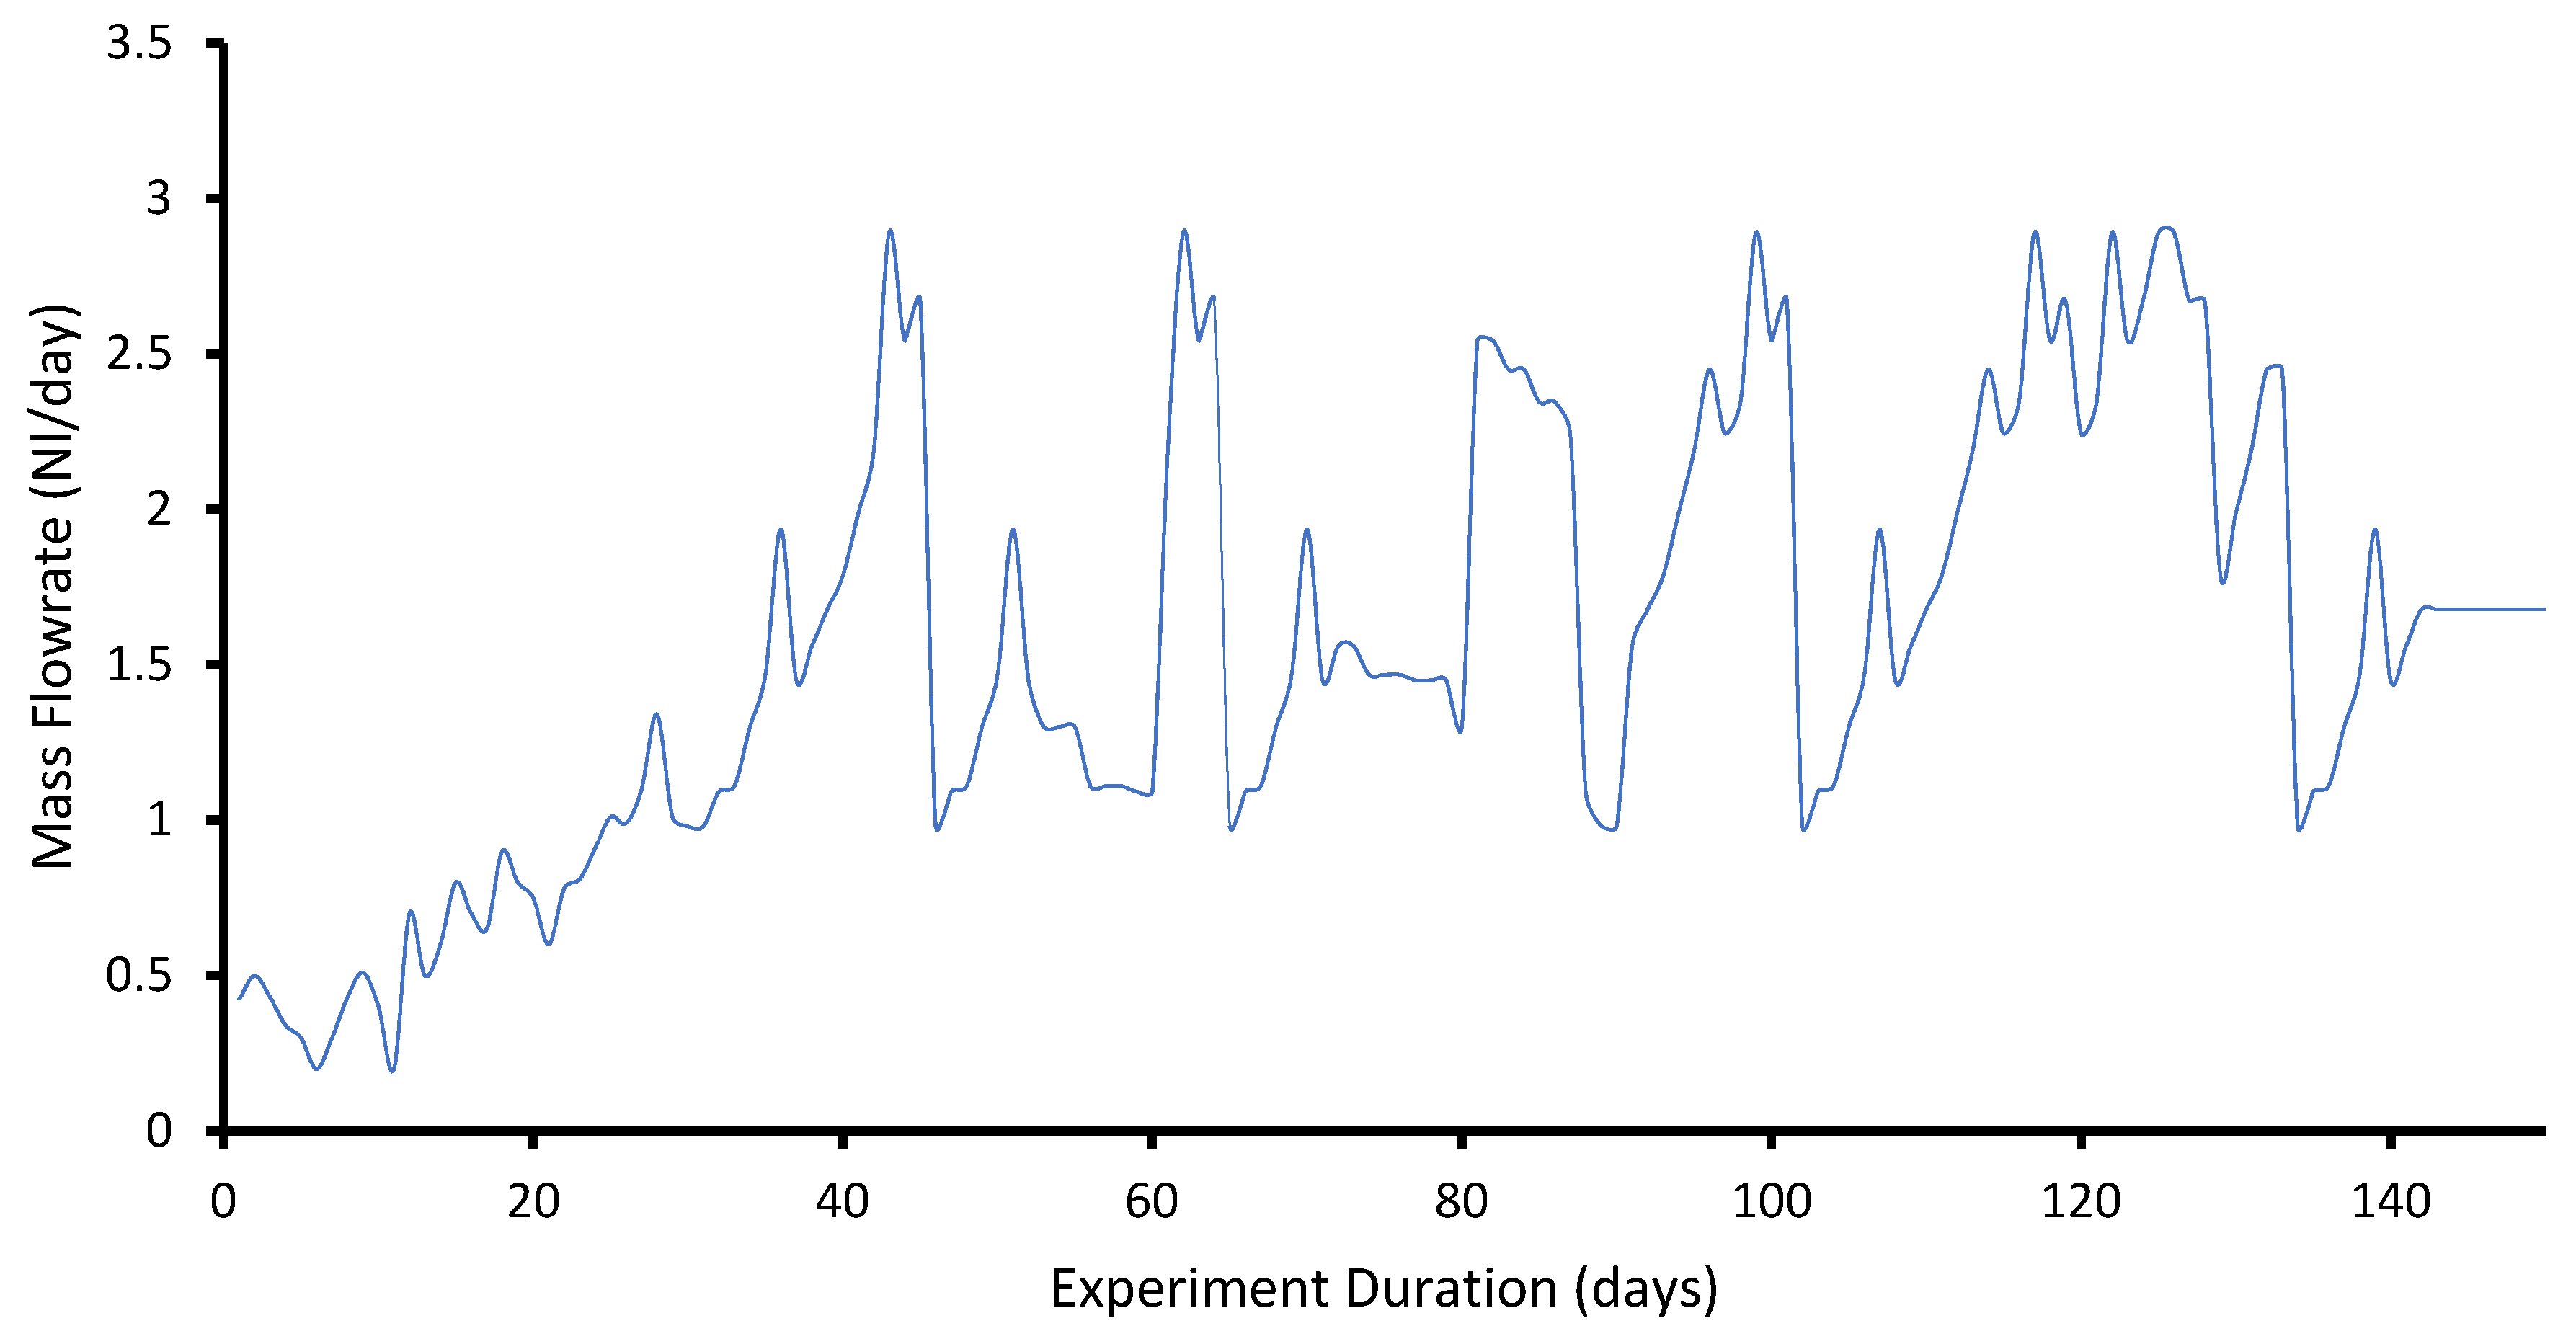
3.5. Biogas Production: Semi-Continuous Studies

The result of the semi-continuous experiment revealed that, although co-digestion of sewage sludge with spent grain caused an enhancement of the AD process during the BMP study, this was not necessarily the case, as can be observed in Figure 9. The performance characteristics in the sludge substrate experiment were reduced from the co-digestion in batch studies. Although the target of this research work was to achieve CH4 concentrations close to those of natural gas under mesophilic conditions (i.e., CH4 concentration >90%), the highest recorded by the optimal process was 77.61% on the second day. The inability to achieve a CH4 concentration of >90% can be attributed to the unstable operating conditions, especially temperature, in which this experiment was conducted; that limited the extent of mineralisation of the metals and the rate of reaction. A significant reduction in the biogas yield, from 10.23 to 2.02 NL/day, was also observed when the OLR reached a level of 2.90 gVS/L.day.
It was also observed after day 40, the co-digestion phase boosted CH4 production and biogas by 60%. This is attributable to a more balanced substrate feed for the digester. Despite a decrease in biogas production the next day, an overall average in OLR was 18% higher than in the first digestion phase. The OLR was not increased excessively to enhance the volumetric biogas yield; rather, it was kept within 1.4–2.5 gVS/L.day, a level that favours higher biogas production. After 140th day, the digester had a specific biogas of 1.678 NL/gVS, on average, which was about 10 percent greater than results reported in the literature [60,61,62].

4. Conclusions

This study aimed to improve the anaerobic digestion process of sewage sludge by co-digesting with brewery spent grains. The first objective was to understand the physicochemical and the microbial community involved in the AD and the complex interaction among microbes in an AD environment. The physicochemical and the metagenomics analysis was conducted using the Standard Methods for the Examination of Water and Wastewater. Anaerobic co-digestion was carried out with batch and semi-continuous laboratory setup. From the results gathered from this study, the following can be claimed with confidence:
  • The microbial analysis indicated that Proteobacteria is the most abundant phylum, followed by the Bacteroidetes, Firmicutes, and Actinobacteria. The Bacteroidetes consist of fermentative bacteria, which are capable of hydrolysing and fermenting organic substances and acids into CO2 and H2. During the steady-state period, a significant shift occurred, with Proteobacteria becoming the most abundant phylum and hydrogenotrophic methanogens dominating over aceticlastic methanogens. The archaea community of hydrogenotrophic methanogen genus enrichment includes methanogens such as Methanobacterium, thermoautotrophicum, Methanosarcina barkeri, and Methanobacterium wolfei.
  • The results confirm that the conducted BMP tests can definitely be used to assess the biogas and methane production from the co-digestion process. It was found that the cumulative biogas production of the mixture of sewage sludge and spent grain increased with increasing proportions of the spent grains. However, a negative effect on kinetics was observed in the presence of BSG and a major decline was observed for shortened HRT of 18 d, which seems to indicate the need to extend HRT. Importantly, the application of BSG, the substrate that is rich in organic compounds, significantly enhanced methane production. Regardless of the HRT, a stable process performance was maintained in co-digestion runs. However, a significant reduction in the biogas yield, from 10.23 to 2.02 NL/day, was also observed in a semi-continuous setup when the OLR reached a level of 2.90 gVS/L.day.
Therefore, the anaerobic co-digestion of SS and BSG might be considered as a cost-effective solution that could contribute to the energy self-efficiency of WWTPs and sustainable waste management. However, the operating conditions should be optimized and monitored at all times. Based on the experimental results, it is recommended that co-digestion of the feed for the pilot biogas plant is upscaled. The feed should comprise sludge from WWTP sludge and brewery spent grains.

Author Contributions

In this research the following author contributed to this part of the study. Conceptualization: K.M. and M.O.D.; Methodology: K.M.; Validation: K.M., M.O.D. and E.v.H.; Formal Analysis: K.M.; Investigation: K.M.; Resources: K.M.; Data Curation: M.O.D. and E.v.H.; Writing—Original Draft Preparation: K.M.; Writing—Review & Editing: M.O.D.; Visualization: K.M.; Supervision: M.O.D.; Project Administration: R.M.; Funding Acquisition: R.M. All authors have read and agreed to the published version of the manuscript.

Funding

This research and APC was funded by the Council for Scientific and Industrial Research (CSIR).

Institutional Review Board Statement

Not applicable.

Informed Consent Statement

Not applicable.

Data Availability Statement

The authors confirm that the data supporting the findings of this study are available within the article.

Acknowledgments

This research was supported by the Council for Scientific and Industrial Research (CSIR), University of Johannesburg, PEETS and the University of the Witwatersrand, Johannesburg (CHMT).

Conflicts of Interest

The authors declare no conflict of interest.

References

  1. Mitchell, S.A.; de Wit, M.P.; Blignaut, J.N.; Crookes, D. Waste Water Treatment Plants: The Financing Mechanisms Associated with Achieving Green Drop Rating; Water Research Commission: Pretoria, South Africa, 2014. [Google Scholar]
  2. Van der Merwe-Botha, M.; Juncker, K.; Visser, A.; Boyd, R. Guiding Principles in the Design and Operation of a Wastewater Sludge Digestion Plant with Biogas and Power Generation: Report to the Water Research Commission; Water Research Commission: Pretoria, South Africa, 2016. [Google Scholar]
  3. Ntombela, C.; Funke, N.; Meissner, R.; Steyn, M.; Masangane, W. A Critical Look at South Africa’s Green Drop Programme. Water SA 2016, 42, 703–710. [Google Scholar] [CrossRef] [Green Version]
  4. Masindi, V.; Chatzisymeon, E.; Kortidis, I.; Foteinis, S. Assessing the sustainability of acid mine drainage (AMD) treatment in South Africa. Sci. Total Environ. 2018. [Google Scholar] [CrossRef] [Green Version]
  5. WRC. Permissible Utilisation and Disposal of Sewage Sludge, 1st ed.; Water Research Commission: Pretoria, South Africa, 1997; p. 83. [Google Scholar]
  6. Herbig, F.J.W. Talking dirty—Effluent and sewage irreverence in South Africa: A conservation crime perspective. Cogent Soc. Sci. 2019, 5, 1–18. [Google Scholar] [CrossRef]
  7. Hansen, K. Overview of Wastewater Treatment in South Africa; AWARD Technical Report Series; Association for Water and Rural Development (AWARD): Hoedspruit Limpopo, South Africa, 2015; pp. 25–63. [Google Scholar]
  8. Wirth, R.; Kovács, E.; Maróti, G.; Bagi, Z.; Rákhely, G.; Kovács, K.L. Characterization of a biogas-producing microbial community by short-read next generation DNA sequencing. Biotechnol. Biofuels 2012, 5, 41. [Google Scholar] [CrossRef] [PubMed] [Green Version]
  9. Department of Energy. State of Renewable Energy in South Africa; Department of Energy: Pretoria, South Africa, 2017. [Google Scholar]
  10. Department of Energy. The South African Energy Sector Report 2019; Department of Energy: Pretoria, South Africa, 2019. [Google Scholar]
  11. National Planning Commission. National Development Plan (2030); National Planning Commission: Pretoria, South Africa, 2010; p. 70. ISBN 978-0-621-41180-5. [Google Scholar]
  12. Franks, L.; Euston-Brown, M.; Ferry, A.; Giljova, S. Municipal Wastewater Treatment Works—Biogas to Energy; GIZ-SALGA Municipal Renewable Energy Case Study Series; SALGA: Johannesburg, South Africa, 2013; pp. 1–6. [Google Scholar]
  13. Oke, M.A.; Suffian, M.; Annuar, M.; Simarani, K. Mixed Feedstock Approach to Lignocellulosic Ethanol Production—Prospects and Limitations. BioEnergy Res. 2016. [Google Scholar] [CrossRef] [Green Version]
  14. Cavinato, C. Anaerobic Digestion Fundamentals I; Summer School on Biogas Technology for Sustainable Second-Generation Biofuel Production; University of Jyvaskyla: Venezia, UK, 2011; pp. 1–47. [Google Scholar]
  15. Guo, J.; Peng, Y.; Ni, B.J.; Han, X.; Fan, L.; Yuan, Z.; Liu, C.; Li, H.; Zhang, Y.; Si, D.; et al. The Microbiology of Anaerobic Digesters. Environ. Technol. 2015, 14, 1–11. [Google Scholar] [CrossRef]
  16. Doloman, A.; Soboh, Y.; Walters, A.J.; Sims, R.C.; Miller, C.D. Qualitative Analysis of Microbial Dynamics during Anaerobic Digestion of Microalgal Biomass in a UASB Reactor. Int. J. Microbiol. 2017, 17. [Google Scholar] [CrossRef] [PubMed] [Green Version]
  17. Martin Vincent, N.; Wei, Y.; Zhang, J.; Yu, D.; Tong, J. Characterization and Dynamic Shift of Microbial Communities during Start-Up, Overloading and Steady-State in an Anaerobic Membrane Bioreactor. Int. J. Environ. Res. Public Health 2018, 15, 1399. [Google Scholar] [CrossRef] [Green Version]
  18. Alemahdi, N.; Che Man, H.; Abd Rahman, N.; Nasirian, N.; Yang, Y. Enhanced mesophilic bio-hydrogen production of raw rice straw and activated sewage sludge by co-digestion. Int. J. Hydrogen Energy 2015, 40, 16033–16044. [Google Scholar] [CrossRef] [Green Version]
  19. Campanaro, S.; Treu, L.; Kougias, P.G.; De Francisci, D.; Valle, G.; Angelidaki, I. Metagenomic analysis and functional characterization of the biogas microbiome using high throughput shotgun sequencing and a novel binning strategy. Biotechnol. Biofuels 2016, 9, 1–17. [Google Scholar] [CrossRef] [Green Version]
  20. Martínez, E.J.; Gil, M.V.; Fernandez, C.; Rosas, J.G.; Gómez, X. Anaerobic Codigestion of Sludge: Addition of Butcher’ s Fat Waste as a Co-substrate for Increasing Biogas Production. PLoS ONE 2016, 11, 1–13. [Google Scholar] [CrossRef]
  21. Zahan, Z.; Othman, M.Z.; Rajendram, W. Anaerobic Codigestion of Municipal Wastewater Treatment Plant Sludge with Food Waste: A Case Study. Biomed. Res. Int. 2016, 201. [Google Scholar] [CrossRef] [Green Version]
  22. Oliveira, J.V.; Alves, M.M.; Costa, J.C. Biochemical methane potential of brewery by-products. Clean Technol. Environ. Policy 2018, 20, 435–440. [Google Scholar] [CrossRef]
  23. Jeung, J.H.; Chung, W.J.; Chang, S.W. Evaluation of anaerobic co-digestion to enhance the efficiency of livestock manure anaerobic digestion. Sustainability 2019, 11, 7170. [Google Scholar] [CrossRef] [Green Version]
  24. Singh, A.; Kamble, S.; Kazmi, A.; Starklhors, M. Environmental and economic performance evaluation of municipal wastewater treatment plants in India: A life cycle approach. Water Sci. Technol. 2019, 79, 1102. [Google Scholar] [CrossRef] [Green Version]
  25. Dido, M.S.; Rieker, C.; Bursche, J.; Lopez Velarde Santos, M.; Hamhaber, J. Anaerobic Digestion of spent grains: Potential use in small-scale Biogas Digesters in Jos, Nigeria. Koln Bibl. Tech. Hochschule Koln 2014, 46, 19–25. [Google Scholar]
  26. Lebiocka, M.; Montusiewicz, A.; Cydzik-Kwiatkowska, A. Effect of bioaugmentation on biogas yields and kinetics in anaerobic digestion of sewage sludge. Int. J. Environ. Res. Public Health 2018, 15, 1717. [Google Scholar] [CrossRef] [Green Version]
  27. Szaja, A.; Montusiewicz, A.; Lebiocka, M.; Bis, M. The effect of brewery spent grain application on biogas yields and kinetics in co-digestion with sewage sludge. PeerJ 2020, 8. [Google Scholar] [CrossRef] [PubMed]
  28. Gonzalez-Fernandez, C.; Barreiro-Vescovo, S.; de Godos, I.; Fernandez, M.; Zouhayr, A.; Ballesteros, M. Biochemical methane potential of microalgae biomass using different microbial inocula. Biotechnol. Biofuels 2018, 11, 1–11. [Google Scholar] [CrossRef]
  29. Gonzalez-Gil, L.; Carballa, M.; Lema, J.M. Cometabolic Enzymatic Transformation of Organic Micropollutants under Methanogenic Conditions. Environ. Sci. Technol. 2017. [Google Scholar] [CrossRef] [PubMed]
  30. Pellera, F.M.; Gidarakos, E. Effect of substrate to inoculum ratio and inoculum type on the biochemical methane potential of solid agroindustrial waste. J. Environ. Chem. Eng. 2016, 4. [Google Scholar] [CrossRef]
  31. Achinas, S.; Euverink, G.J.W. Effect of combined inoculation on biogas production from hardly degradable material. Energies 2019, 12, 217. [Google Scholar] [CrossRef] [Green Version]
  32. Eaton, A.D.; Clesceri, L.S.; Franson, M.A.H.; American Public Health Association; Rice, E.W.; Greenberg, A.E. Standard Methods for the Examination of Water & Wastewater. Am. Public Health Assoc. 2005, 21, 256–269. [Google Scholar]
  33. Nielfa, A.; Cano, R.; Pérez, A.; Fdez-Polanco, M. Co-digestion of municipal sewage sludge and solid waste: Modelling of carbohydrate, lipid and protein content influence. Waste Manag. Res. 2015, 33, 241–249. [Google Scholar] [CrossRef] [PubMed]
  34. Dioha, I.J.; Ikeme, C.; Nafi, T.; Soba, N.I.; Mbs, Y. Effect of Carbon to Nitrogen Ratio on Biogas Production. Int. Res. J. Nat. Sci. 2013, 1, 1–10. [Google Scholar]
  35. Wang, Q.; Liang, Y.; Zhao, P.; Li, Q.X.; Guo, S.; Chen, C. Potential and optimization of two-phase anaerobic digestion of oil refinery waste activated sludge and microbial community study. Sci. Rep. 2016, 6, 1–10. [Google Scholar] [CrossRef] [PubMed] [Green Version]
  36. Mudzanani, K.; Ejekwu, O.; Ayeni, A.O.; Daramola, M.O. Dissolution kinetics of corncob in lithium perchlorate solvent system. In Proceedings of the 7th European Biomass Conference and Exhibition (EUBCE 2019), Lisbon, Portugal, 27–30 May 2019. [Google Scholar]
  37. Masebinu, S.O. Anaerobic Digestion Process Stabilisation and In-Situ Upgrading of a Biogas System. Ph.D. Thesis, University of Johannesburg, Johannesburg, South Africa, 2018. [Google Scholar]
  38. Han, M.; Zhang, J.; Chu, W.; Zhou, G.; Chen, J. Surface-modified sewage sludge-derived carbonaceous catalyst as a persulfate activator for phenol degradation. Int. J. Environ. Res. Public Health 2020, 17, 3286. [Google Scholar] [CrossRef]
  39. Yan, A.; Li, J.; Liu, L.; Ma, T.; Liu, J.; Ni, Y. Centrifugal dewatering of blended sludge from drinking water treatment plant and wastewater treatment plant. J. Mater. Cycles Waste Manag. 2018, 20, 421–430. [Google Scholar] [CrossRef]
  40. Cuetos, M.J.; Martinez, E.J.; Moreno, R.; Gonzalez, R.; Otero, M.; Gomez, X. Enhancing anaerobic digestion of poultry blood using activated carbon Enhancing anaerobic digestion of poultry blood. J. Adv. Res. 2017, 8, 297–307. [Google Scholar] [CrossRef]
  41. Siddique, M.N.I.; Wahid, Z.B.A. Enhanced Methane Yield by Codigestion of Sewage Sludge with Microalgae and Catering Waste Leachate. Water Environ. Res. 2018, 90, 835–839. [Google Scholar] [CrossRef] [PubMed]
  42. Derilus, D.; Forestil, A.; Fortuné, J.; Polyanska, O.; Louime, C.; Gervais, G.; Massey, S.E. Functional Metagenomics Characterization of an Anaerobic Saltwater Bioreactor. J. Renew. Energy 2019, 2019, 4527628. [Google Scholar] [CrossRef]
  43. Treu, L.; Kougias, P.G.; Campanaro, S.; Bassani, I.; Angelidaki, I. Deeper insight into the structure of the anaerobic digestion microbial community; The biogas microbiome database is expanded with 157 new genomes. Bioresour. Technol. 2016, 216, 260–266. [Google Scholar] [CrossRef] [PubMed] [Green Version]
  44. Zhang, W.; Zhang, L.; Li, A. Enhanced anaerobic digestion of food waste by trace metal elements supplementation and reduced metals dosage by green chelating agent [S, S]—EDDS via improving metals bioavailability. Water Res. 2017, 84, 266–277. [Google Scholar] [CrossRef] [PubMed]
  45. Ghosh, P.; Kumar, M.; Kapoor, R.; Kumar, S.S.; Singh, L.; Vijay, V.; Vijay, V.K.; Kumar, V.; Thakur, I.S. Enhanced biogas production from municipal solid waste via co-digestion with sewage sludge and metabolic pathway analysis. Bioresour. Technol. 2020, 296, 90–123. [Google Scholar] [CrossRef] [PubMed]
  46. Oladejo, J.; Shi, K.; Luo, X.; Yang, G.; Wu, T. A review of sludge-to-energy recovery methods. Energies 2019, 12, 60. [Google Scholar] [CrossRef] [Green Version]
  47. Jingura, R.M.; Kamusoko, R. Methods for determination of biomethane potential of feedstocks: A review. Biofuel Res. J. 2017, 4. [Google Scholar] [CrossRef]
  48. De Mandal, S.; Chatterjee, R.; Kumar, N.S. Dominant bacterial phyla in caves and their predicted functional roles in C and N cycle. BMC Microbiol. 2017, 17, 1–9. [Google Scholar] [CrossRef] [PubMed] [Green Version]
  49. Wei, L.; Qin, K.; Ding, J.; Xue, M.; Yang, C.; Jiang, J.; Zhao, Q. Optimization of the co-digestion of sewage sludge, maize straw and cow manure: Microbial responses and effect of fractional organic characteristics. Sci. Rep. 2019, 9, 1–10. [Google Scholar] [CrossRef] [Green Version]
  50. Liu, X.; Wang, M.; Hu, X.; Song, Y. Effect of Total Solids Content on the Biogas Production and Phosphorus Release from Excess Sludge. Adv. Mater. Res. 2014, 1010, 1006–1009. [Google Scholar] [CrossRef]
  51. Zhang, Y.; Culhaoglu, T.; Pollet, B.; Melin, C.; Denoue, D.; Barriere, Y.; Baumberger, S.; Mechin, V. Impact of lignin structure and cell wall reticulation on maize cell wall degradability. J. Agric. Food Chem. 2011, 59, 10129–10135. [Google Scholar] [CrossRef]
  52. Ruan, D.; Zhou, Z.; Pang, H.; Yao, J.; Chen, G.; Qiu, Z. Enhancing methane production of anaerobic sludge digestion by microaeration: Enzyme activity stimulation, semi-continuous reactor validation and microbial community analysis. Bioresour. Technol. 2019, 289, 121643. [Google Scholar] [CrossRef] [PubMed]
  53. Xue, S.; Zhao, N.; Song, J.; Wang, X. Interactive Effects of Chemical Composition of Food Waste during Anaerobic Co-Digestion under Thermophilic Temperature. Sustainability 2019, 11, 2933. [Google Scholar] [CrossRef] [Green Version]
  54. Goswami, R.; Chattopadhyay, P.; Shome, A.; Banerjee, S.N.; Chakraborty, A.K.; Mathew, A.K.; Chaudhury, S. An overview of physico-chemical mechanisms of biogas production by microbial communities: A step towards sustainable waste management. 3 Biotech 2016. [Google Scholar] [CrossRef] [Green Version]
  55. Kim, J.; Park, C.; Kim, T.-H.; Lee, M.; Kim, S.; Kim, S.-W.; Lee, J. Effects of various pretreatments for enhanced anaerobic digestion with waste activated sludge. J. Biosci. Bioeng. 2003, 95, 271–275. [Google Scholar] [CrossRef]
  56. Yeneneh, A.M.; Sen, T.K.; Ang, H.M.; Kayaalp, A. The role of sludge pretreatment on the enhancement of anaerobic digester performance in wastewater treatment plants. In Physical, Chemical and Biological Treatment Processes for Water and Wastewater; Nova Publishers: Hauppauge, NY, USA, 2015; pp. 251–282. [Google Scholar]
  57. Zhang, J.; Zhao, W.; Zhang, H.; Wang, Z.; Fan, C.; Zang, L. Recent achievements in enhancing anaerobic digestion with carbon- based functional materials. Bioresour. Technol. 2018, 266, 555–567. [Google Scholar] [CrossRef] [PubMed]
  58. Bong, C.P.C.; Lim, L.Y.; Lee, C.T.; Klemeš, J.J.; Ho, C.S.; Ho, W.S. The characterisation and treatment of food waste for improvement of biogas production during anaerobic digestion—A review. J. Clean. Prod. 2018, 172. [Google Scholar] [CrossRef]
  59. Dhinakaran, S.; Navaneethagopalakrishnan, A. Feasibility studies on performance improvement for tannery effluent through chemical oxidation- biological treatment. J. Chem. Pharm. Sci. 2015, 2015, 439–442. [Google Scholar]
  60. Ahring, B.K.; Sandberg, M.; Angelidaki, I. Volatile fatty acids as indicators of process imbalance in anaerobic digestors. Appl. Microbiol. Biotechnol. 1995, 43, 559–565. [Google Scholar] [CrossRef]
  61. Tian, X.; Trzcinski, A. Effects of Physico-Chemical Post-Treatments on the Semi-Continuous Anaerobic Digestion of Sewage Sludge. Environments 2017, 4, 49. [Google Scholar] [CrossRef] [Green Version]
  62. Sakeus, K. Anaerobic Digestion of Dairy Manure Wastewater, Food and Fruit Waste, A Sustainable Source of Bio-Energy and Waste Management. Master’s Thesis, Stellenbosch University, Stellenbosch, South Africa, 2016. [Google Scholar]
Figure 1. A simplified schematic presentation of the anaerobic digestion phases, adapted from [19].
Sustainability 13 08225 g001
Figure 2. The biochemical methane potential test using the automatic methane potential test system (AMPTS II). The AMPTS II instrument has a (A) temperature-controlled water bath for fifteen 500 mL bottle reactors, as well as (B) an automatic motorized mixer with continuous or intermittent clockwise and anti-clockwise spinning. The digester biogas is routed through (C) an 80 mL alkaline reagent to absorb CO2 and other non-methane gases present in the biogas that is produced. The purified biogas leaves the alkaline reagent unit as pure methane and goes into (D) a water displacement measuring unit with 15 parallel operating tipping bucket cells. Periodical monitoring analyses were performed for both methane productions.
Sustainability 13 08225 g002
Figure 3. The semi-continuous test was conducted for a duration of 150 days.
Sustainability 13 08225 g003
Figure 4. SEM micrographs of sewage sludge: (a) Raw sludge before anaerobic digestion; (b) digested sewage sludge.
Sustainability 13 08225 g004
Figure 5. The taxonomic distribution of the microbial community in the sewage sludge sample.
Sustainability 13 08225 g005
Figure 6. The microbial metabolic pathway during anaerobic digestion constructed using the most abundant AD species, adapted from [19].
Sustainability 13 08225 g006
Figure 7. Cumulative methane yield (NmL/gVS) for sewage sludge (SS) and brewery spent grain (BSG) mono-digestion and co-digestion.
Sustainability 13 08225 g007
Figure 8. The COD of the feed after the BMP study, and the COD removal efficiency.
Sustainability 13 08225 g008
Figure 9. Semi-continuous biogas production per day.
Sustainability 13 08225 g009
Table 1. Characterization of the biochemical methane potential feedstock.
ParametersInoculumSewage SludgeBrewery Spent GrainsBlend (1:1)
pH7.206.906.106.64
Total solids (w/w%)1.343.6016.7210.16
Volatile solids (w/w%)1.5898.7097.5098.10
Carbon content, %37.1435.2387.3061.27
Nitrogen content, %3.238.602.505.55
C/N ratio11.504.1034.9219.51
Publisher’s Note: MDPI stays neutral with regard to jurisdictional claims in published maps and institutional affiliations.

