Abstract
Heat pumps are currently being developed to reduce the energy footprint for residential and commercial building space conditioning and water heating loads in cold climates. To mitigate the nocuous impact of greenhouse gas emissions on the environment, and to create a carbon-neutral building stock, alternate lower-GWP refrigerants must also replace the predominant use of R-410A, without re-engineering the mechanical hardware. In this paper, we analyze the performance of lower-GWP alternative refrigerants (R-32, R-452B, R-454B, and R-466A) relative to the conventional R-410A and draw conclusions on the relative performances to meet cooling loads. The simulations are accomplished using the heat pump design model, a well-known, public-domain design tool with a free web interface and downloadable desktop version to support public use and the HVAC R&D community. The contributions contain detailed, hardware-based heat exchanger and system analyses to provide a comprehensive assessment. The results of the simulation are scrutinized from the first (capacity and energy efficiency) and second laws (exergy analysis) to identify sources of systemic inefficiency, the root cause of lost work. This rigorous approach provides an exhaustive analysis of alternate lower-GWP refrigerants to replace R-410A using the same hardware. The results have practical value in engineering heat pumps in an economy that is compelled to alter by the consequences and uncertainties of climate change, to reduce its anthropogenic carbon footprint.
1. Introduction
Rising levels of GHG in the atmosphere cause changes that permeate in the ecosystem, due to the delicate interconnectedness of animate and inanimate subjects or objects. While the focus and conversations gravitate around atmospheric GHG levels, the dire effects of GHG on the oceans and cryosphere are equally important. Oceans cover 71% of the Earth’s surface and contain about 97% of the Earth’s water. Of the frozen parts of the Earth (cryosphere), approximately 10% of the Earth’s landmass is covered by glaciers or ice sheets [1]. Between 2006 and 2015, the Greenland ice sheet lost ice mass at an average rate of 278 ± 11 Gt y−1, mostly due to surface melting; the Antarctic ice sheet lost mass at an average rate of 155 ± 19 Gt y−1, and glaciers outside Greenland and Antarctica lost mass at an even higher average rate of 220 ± 30 Gt y−1 [1]. The year 2016 was ranked as the warmest on record. The global phasedown of hydrofluorocarbons (HFCs) is estimated to reduce warming by 0.5 °C by 2100. Challenges to global warming require the reduction of GHG emissions, and the increased use of renewable energy. Heat pumps extract energy from renewable sources and convert it to more useable forms for space conditioning and for water heating. They can be powered by renewable sources of electricity and must be engineered to use low-GWP refrigerants for a sustainable economy.
Early refrigerants up until 1930 included air, water, carbon dioxide, and ammonia, which today are classified as low-GWP natural refrigerants. However, some early refrigerants also included sulfur dioxide (toxic, corrosive), ethers (toxic) and hydrocarbons such as propane and butane (flammable). In 1930, chlorofluorocarbons (CFCs) were introduced as an “ideal” refrigerant for refrigerators because of their properties and chemical stability. CFCs were also used as a solvent, propellant, and blowing agent. The 1930s to 1960s saw even more CFCs entering the economy. By 1963, these refrigerants represented 98% of the organic fluorine industry. Following Molina and Rowland’s pioneering work on ozone depletion [2], concerns regarding the role of CFCs in the thinning of the earth’s ozone layer began to grow. These concerns led to the ratification of the Montreal Protocol in 1987 that required the phasing out of CFCs and hydrochlorofluorocarbons (HCFCs). Hydrofluorocarbons (HFCs) emerged as a replacement for CFCs and HCFCs because of their lower first cost. Among the HFC and HFC blends used are R-134A, R-410A, R-407C, etc. However, although their ODP is negligible, their GWPs are 1300, 1924, and 1732, respectively. The Kigali amendment to the Montreal Protocol further emphasized HFC phase-down, allowing the transition to hydrofluoroolefins (HFOs) as alternate refrigerants. HFOs have an ODP = 0 and low-GWP. However, HFOs are not drop-in refrigerants. They require substantial hardware modifications and changes in compressor design because of the lack of compatibility issues with lubricants. Hence, their replacement in retrofit is not possible. In order to cope with this issue, the Environmental Protection Agency (EPA) in the United States, under Section 612 of the amended Clean Air Act (CAA) off 1990, introduced the significant new alternatives policy (SNAP) program to evaluate the use of low-GWP fluids as a direct, drop-in substitute for refrigerants such as R-410A, which this work addresses for application to heat pumps that may be used in cold climates. McLinden and Huber [3] elegantly describe the evolution of refrigerants, from the 1920s to the 2010s, and the search for new refrigerants.
Currently, R-410A is the refrigerant used almost exclusively in residential heat pumps, and research has focused on finding low-GWP alternatives to R-410A. Lower-GWP replacements for R-410A should possess the following key characteristics: (1) similar volumetric capacity, to enable available compressors to provide a similar cooling capacity; (2) equal or higher energy efficiency; (3) accommodate the same or a wider working envelope, i.e., an adequately high refrigerant critical temperature for high ambient operation; and (4) possess similar or moderately higher compressor discharge temperature levels, to prevent the need to change the compressor lubricant and maintain the same level of reliability.
Among efforts to meet the Kigali Agreement, there is a worldwide effort to find alternate low- or lower-GWP refrigerants. The American Heating and Refrigeration Institute (AHRI) launched an industry-wide cooperative program known as the low-GWP alternate refrigerants evaluation program (Low-GWP AREP) [4] to evaluate refrigerants for major product categories, identifying thirty-eight alternate refrigerant candidates for further evaluation. The American Society for Heating Refrigeration and Air-conditioning (ASHRAE) published a report in 2019 [5], describing industry efforts to identify lower-GWP replacement refrigerants to replace R-410A in ducted residential and light commercial packaged units. The viewpoint of the experts in the industry is to look for options among lower-GWP refrigerants with clear advantages in total equivalent warming index (TEWI) and life-cycle cost performance (LCCP), relative to existing high-GWP refrigerants. Tightening European F-gas regulations have suggested myriad alternative refrigerant replacements containing HFC/HFO/HC/R744 mixtures. R-430A (GWP of 107) presents the closest values to R-134a, exceeding the COP values for all working conditions in room air conditioners [6]. Replacements for R-410A include R-446A, R-447A, R-447B, R-452B, R-459B. Pham and Rajendran [7] reviewed the technical and policy search for next-generation refrigerants with both low-GWP and LCCP factors, with a focus on replacing R-410A in unitary air conditioning and heat pumps. They concluded that R-32 (GWP of 675) offers an attractive lower-GWP solution for mainstream air-conditioning and heat pump applications, especially in new equipment re-designed to optimize performance. They further argue that the GWPs of HFOs are constrained to less than 500, not much lower than the GWP of 675 for R-32. Furthermore, HFOs remain very expensive. A theoretical screening of refrigerant mixtures by Yu [8] came up with thirty-four mixtures with a GWP < 150 that matched the volumetric capacity and COP of R-410A, of which a smaller subset of four refrigerants also offered almost the same pressure as that of R-410. The four refrigerants are: R32/R1123/R161/R1131 (20/40/10/30), R1123/R161/R1131 (65/5/30), R1123/R152a/R1311 (65/5/30), and R1123/R1234ze(E)/R1311 (65/5/30). Issues pertaining to lubricant compatibility/miscibility, etc., are yet to be determined and confirmed experimentally. Yang [9] evaluated blends of HFC32/HFO1234yf and HFC32/HFO1234ze(E), with a GWP of about 300 for domestic heat pumps with reduced life cycle environmental impact, as promising substitutes for R-410A. Sieres [10] investigated R-452B and R-454B as drop-in replacements for R-410A in liquid-to-water heat pumps, with the caveat that there is an optimum refrigerant charge that maximizes the COP, to be determined experientially.
Potential lower-GWP refrigerants for R-410A used in this study are indicated in Table 1. The R-410A replacements are mostly blends containing R-32 with HFCs (R-125) and HFOs (R-1234yf) (see footnotes to Table 1). Candidate refrigerants have approximately 70% lower GWPs than R-410A. Some compositions of R-32 and R-1234yf are mildly flammable and are classified as A2L. R-466A is an A1 refrigerant, i.e., non-flammable. These refrigerant blends have negligible temperature glides. All the listed alternatives have higher critical temperatures than R-410A, making them more suitable for high condensing temperature operation, enabling them to be used in integrated heat pumps with water heating capability while simultaneously providing space cooling.

Table 1.
Replacement refrigerants for R-410A that have lower global warming potentials (GWPs).
This study compares short-term replacements of R-410A, i.e., direct drop-in without modifying the existing hardware and manufacturing lines. These replacements require comparable volumetric capacity and energy efficiency to R-410A and have negligible temperature glides. The industry has selected those refrigerants having lower GWPs of around 700 as short-term options, as shown in Table 1. Refrigerants having GWPs < 150 will be long-term replacements, which tend to have significant temperature glides, and need a re-design of the system and components. To do this, the performance of a heat pump is simulated with R-410A and then with each of the alternatives. The results of the simulations are used to compare the performance of the heat pump with each alternative to its performance relative to R-410A. The simulations are performed using the DOE/ORNL heat pump design model (HPDM) [11], a research tool developed by the U.S Department of Energy for industry and academics. In addition to an online version, the HPDM is also provided in a free, downloadable desktop version. More than three major US manufacturers have adopted HPDM as their in-house product design tool. In particular, the Emerson Company has integrated HPDM into their compressor selection and system simulation software, and they developed their own interface and have distributed it to over 80 worldwide equipment manufacturers. In a report published by RTI International [12], the DOE/ORNL heat pump design model was acknowledged as one of the five most rewarding investments made by the U.S. Department of Energy in HVAC, water heating, and appliance technologies since 1976. The model has been used worldwide over 350,000 times, with extensive scientific and technical literature validating the simulations [1,12,13,14,15,16].
2. Refrigerant Properties
The crucial properties for candidate low-GWP refrigerants have been discussed extensively elsewhere [17,18] and shall be mentioned briefly for completeness. The latent heat of vaporization per unit mass of a refrigerant and the critical temperature determines its working range. The volumetric heat of vaporization indicates the evaporating capacity per unit of volumetric flow rate. This should be as high as possible. Refrigerants with smaller volumetric vaporization heat have reduced cooling capacities at a fixed compressor displacement volume when used as a drop-in replacement.
Heat transfer and refrigerant pressure drop influence the refrigerant saturation temperature. Lower saturation temperature leads to a smaller cooling capacity when using the same compressor. Whether an alternative lower-GWP refrigerant leads to higher or lower capacity depends on the trade-off between its volumetric heat of vaporization and the resultant suction saturation temperature, influenced by its heat transfer characteristics, determined by its transport and thermo-physical properties [17,18].
3. Model Description, Features, and Assumptions
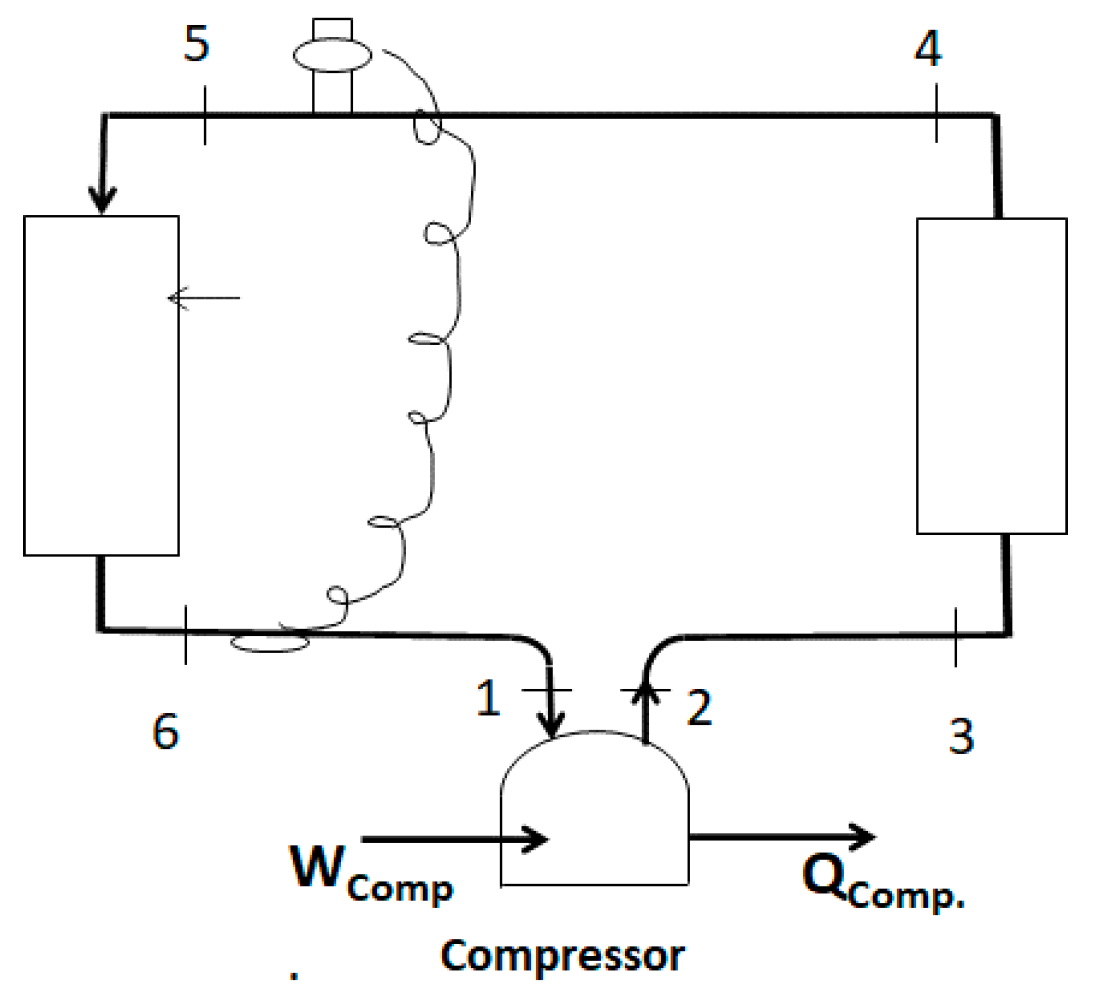
The DOE/ORNL heat pump design model [19] was used to model a baseline heat pump with R-410A as the refrigerant. The simple cycle consists of a 2-speed compressor, a condenser, an expansion valve, and an evaporator with connecting refrigerant lines [19], as shown in Figure 1.
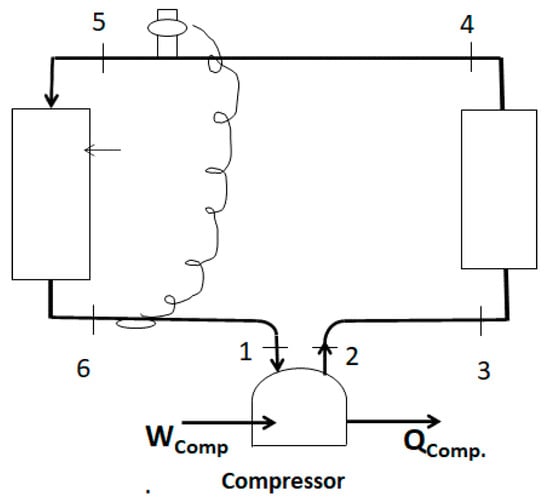
Figure 1.
Representation of the simple cycle HPDM, with numbers referring to state points.
Relevant features of the HPDM, related to this study, are discussed extensively in [18,19] and are described concisely below.
3.1. Compressor Model
The compressor performance mapping approach, using ten coefficients per the ANSI/AHRI Standard 540 [20], is used to calculate the compressor mass flow rate and power consumption. To consider the refrigerant side energy balance across the compressor, a compressor shell heat loss ratio is inputted to account for the ratio of compressor power lost to the surrounding air. It also considers the actual suction state, to correct the map mass flow prediction using the method of Dabiri and Rice [15]. In lieu of actual compressor test data, we utilized original compressor maps specifically developed for R-410A, with corrections to represent the performance of existing compressors with alternative lower-GWP refrigerants [18]. The compressor volumetric and total efficiencies at the same suction and discharge pressures as for R-410A are reduced as a function of the suction and discharge pressures.
3.2. Heat Exchanger Model
For the fin and tube condenser, a segment-to-segment approach was used that divides a single tube into numerous mini-segments, in which each tube segment has individual air-side and refrigerant-side entering states including possible phase transitions. An ε-NTU approach [21] is used for heat transfer calculations within each segment. The air-side fin is simplified as an equivalent annular fin. Both refrigerant and air-side heat transfer and pressure drops are considered. The coil model can simulate arbitrary tube and fin geometries and circuitries, any refrigerant side entering and exiting states, and maldistribution, and can accept two-dimensional air side temperature, humidity, and local velocity inputs. The tube circuitry and 2-D boundary conditions are provided via an input file.
For the evaporator design, the same segment-to-segment approach is used as described above, with the discrimination of including the capability to simulate dehumidification. The method of Braun et al. [21] is used to simulate cases of water condensing on an evaporating coil, where the driving potential for heat and mass transfer is the difference between specific enthalpies of the inlet air and saturated air at the refrigerant temperature. As noted, the segment-to-segment modeling approach can reveal the glide of a zeotropic refrigerant, since the temperature increment is accounted for in each individual segment along the refrigerant flow path. As Table 1 stipulates, glides are accounted for by the segment-to-segment heat exchanger modeling approach among the suggested alternate low-GWP refrigerants.
3.3. Heat Transfer and Pressure Drop Correlations
After an extensive literature survey, the heat transfer coefficients of Thome and Hajal [22] and Cavallini and Doretti [23] were selected to account for local flow patterns, based on the refrigerant properties. Evaporation depends on the refrigerant flow pattern and the wetted surface inside a horizontal smooth tube, as described using a flow map prediction. The model covers stratified flow, stratified-wavy, annular-wavy, intermittent, annular flow, annular flow with partial dry-out, and mist flow in evaporation. Details of the heat transfer coefficient and the flow map are discussed in [17,18]. The local evaporation heat transfer coefficient calculated from [22] reasonably predicts degradation of the heat transfer coefficient at high quality due to the drying out of the liquid film, an advantage over other correlations that are unable to quantify this. The condensation heat transfer coefficient of Cavallini and Doretti [23] also utilizes the flow pattern prediction that is used for the evaporation heat transfer coefficient. The generalized pressure drop correlation of Choi et al. [24] is used for both the evaporation and condensation of alternate low-GWP refrigerants.
Heat transfer correlations developed for pure refrigerants must be corrected if they are to be used for zeotropic refrigerants. We used the proposed corrections suggested by Stephan [25] for condensation and for evaporation. In this method, the mixture heat transfer coefficient is defined as:
where is the heat transfer coefficient computed from a pure refrigerant heat transfer model, and is the heat transfer coefficient of the vapor phase, which can be calculated with the Dittus–Boelter equation. is the ratio between the sensible heat transfer and the total heat transfer. Bell [26] suggested that if the total isobaric temperature glide is around 7–8 °C, then can be approximated as:
where is the temperature glide, is the enthalpy of latent heat of the mixture, is the quality, and is the vapor-specific heat.
We use air-side heat transfer correlations specific to individual fin types, respectively, for dry and wet surfaces. Details of the expansion devices, fans and blowers, and refrigerant lines are discussed elsewhere [17,18]. For the refrigerant properties, we programmed interface functions to call REFPROP 10.0 [27] directly.
4. Model Description, Features, and Assumptions
The DOE/ORNL heat pump design model (HPDM) with a two-speed compressor simulated the performances for all refrigerants. The two-speed heat pump has a rated cooling capacity of 5-ton/17.6 kW at 35 °C ambient temperature/26.7 °C indoor dry-bulb (DB) temperature, and 19.4 °C indoor wet-bulb temperature (WB). The high and low speeds of the scroll compressor provide 100% and 67% of the rated capacity, respectively. The indoor and outdoor heat exchangers are described in Table 2. To model the system, the evaporator exit was assumed to have a constant superheat degree of 10 R (5.6 K).
Table 2.
Parameters of Indoor and Outdoor Units.
This study is based on the AHRI 210/240 standard (AHRI, 2008) rating conditions for 2-speed heat pumps. In cooling mode, the heat pump should provide performance metrics at 35 °C and 27.8 °C ambient temperature, and an indoor condition of 26.7 °C DB/19.4 °C WB.
Table 3 below presents the predicted cooling performances of the heat pump using R-410A at the low- (_L) and high-speed (_H) levels, including cooling capacities (kW), cooling COPs (W/W), compressor discharge temperature (C/F) and compressor efficiency, as defined by Equation (2).
Table 3.
Parameters of indoor and outdoor units.
The two-speed scroll compressor uses the full displacement volume at 100% capacity. At 67% capacity, only part of the scroll is utilized, which causes more loss factors. As a result, the compressor efficiency of the low speed is roughly 7% lower than the high speed. The shell loss ratio, relative to the compressor power, is 10% for all the cooling conditions.
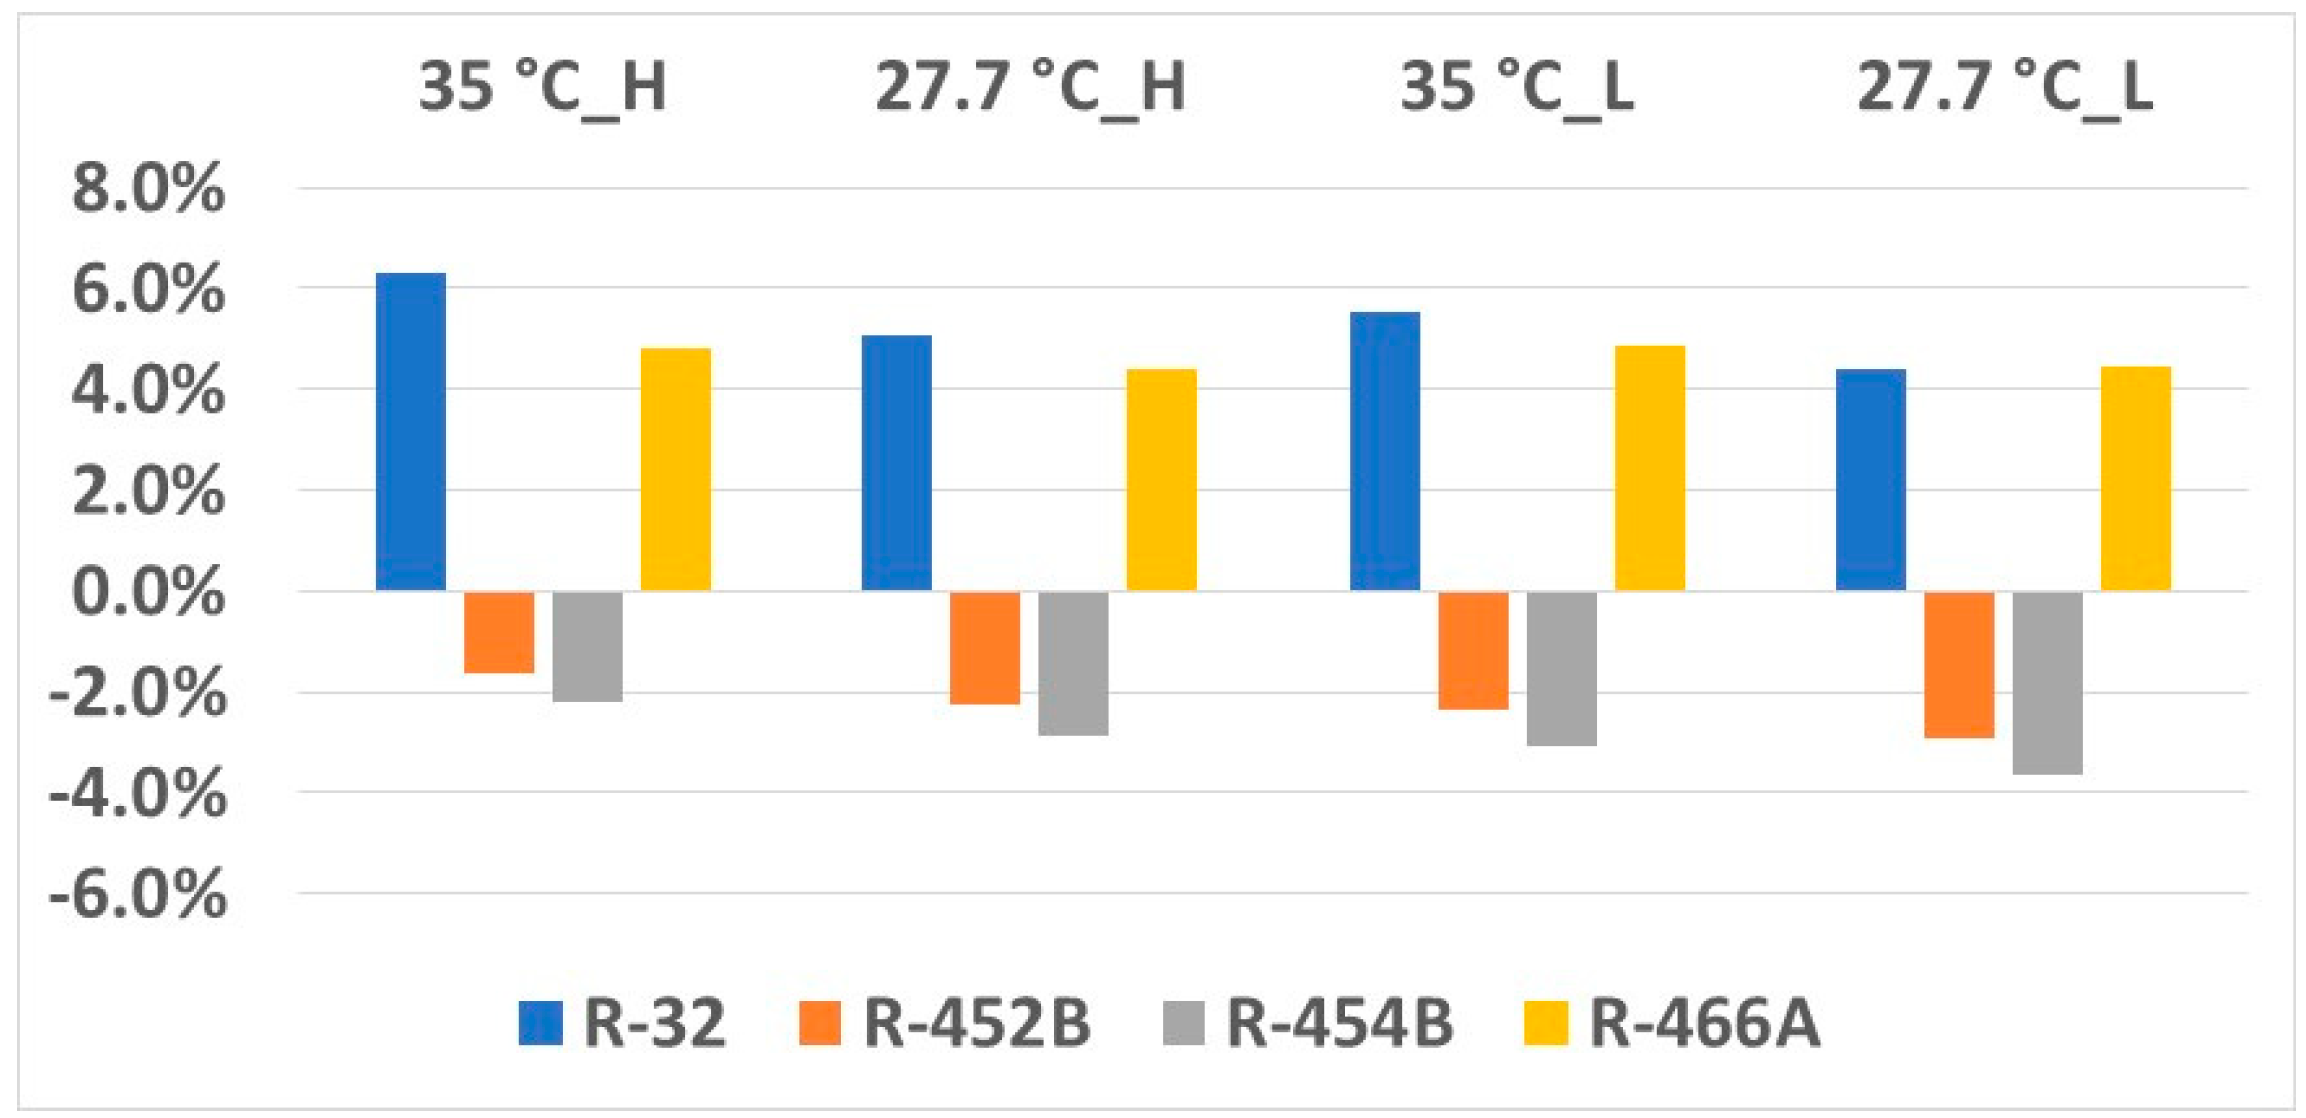
Figure 2 shows cooling capacity variations of the drop-in alternative refrigerant compared to R-410A. R-32 and R-466A result in 4% to 6% higher cooling capacities in all conditions, whereas R-452B and R-454B lead to approximately 2% smaller capacities.
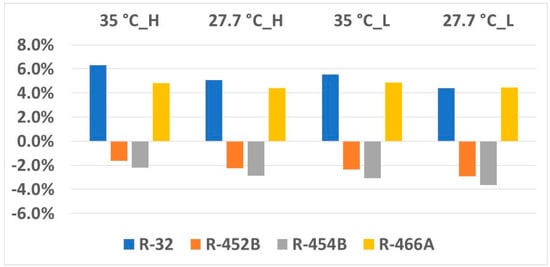
Figure 2.
Capacity variation in cooling mode.
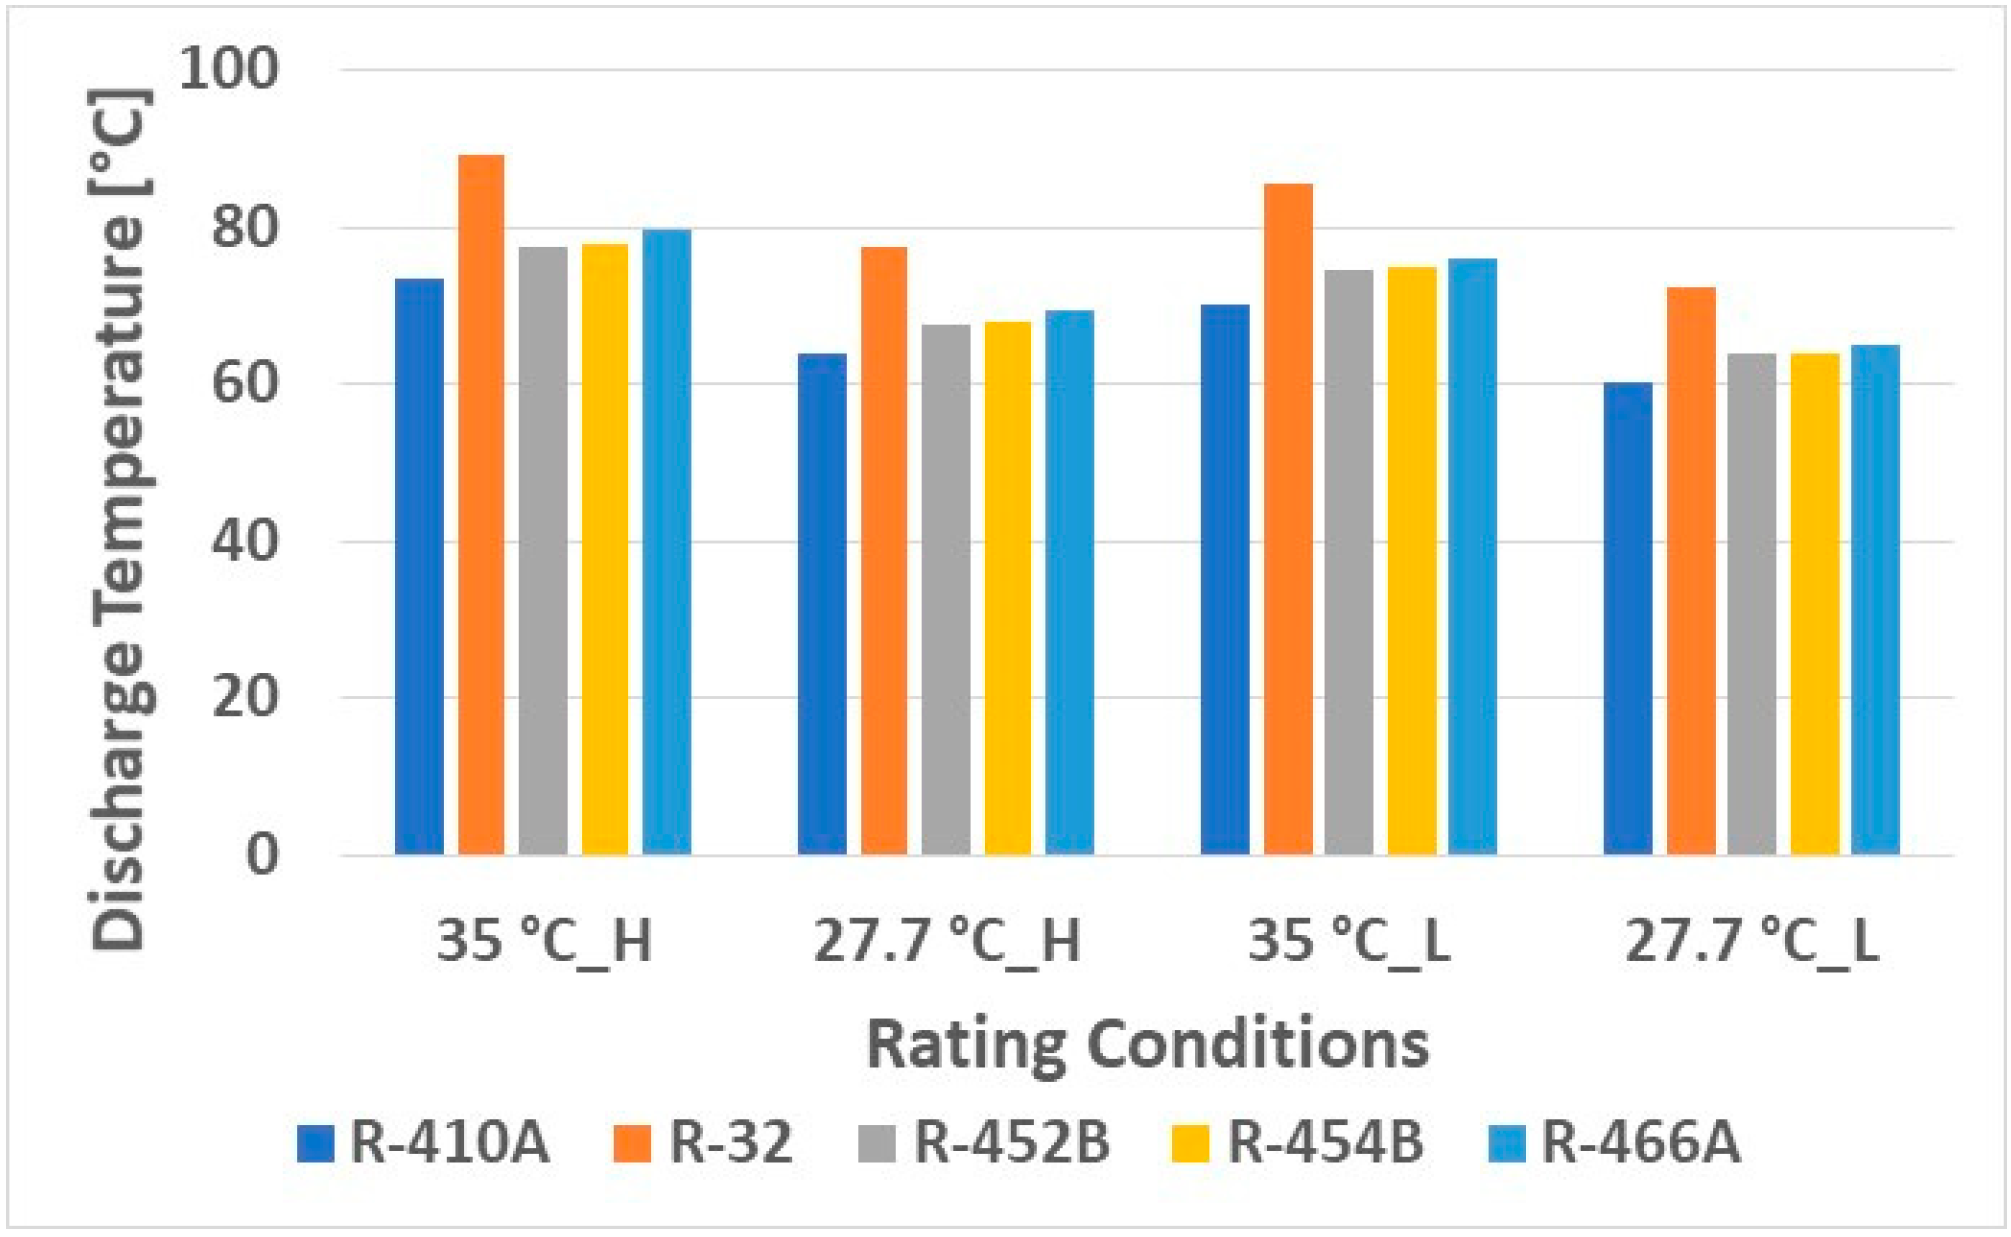
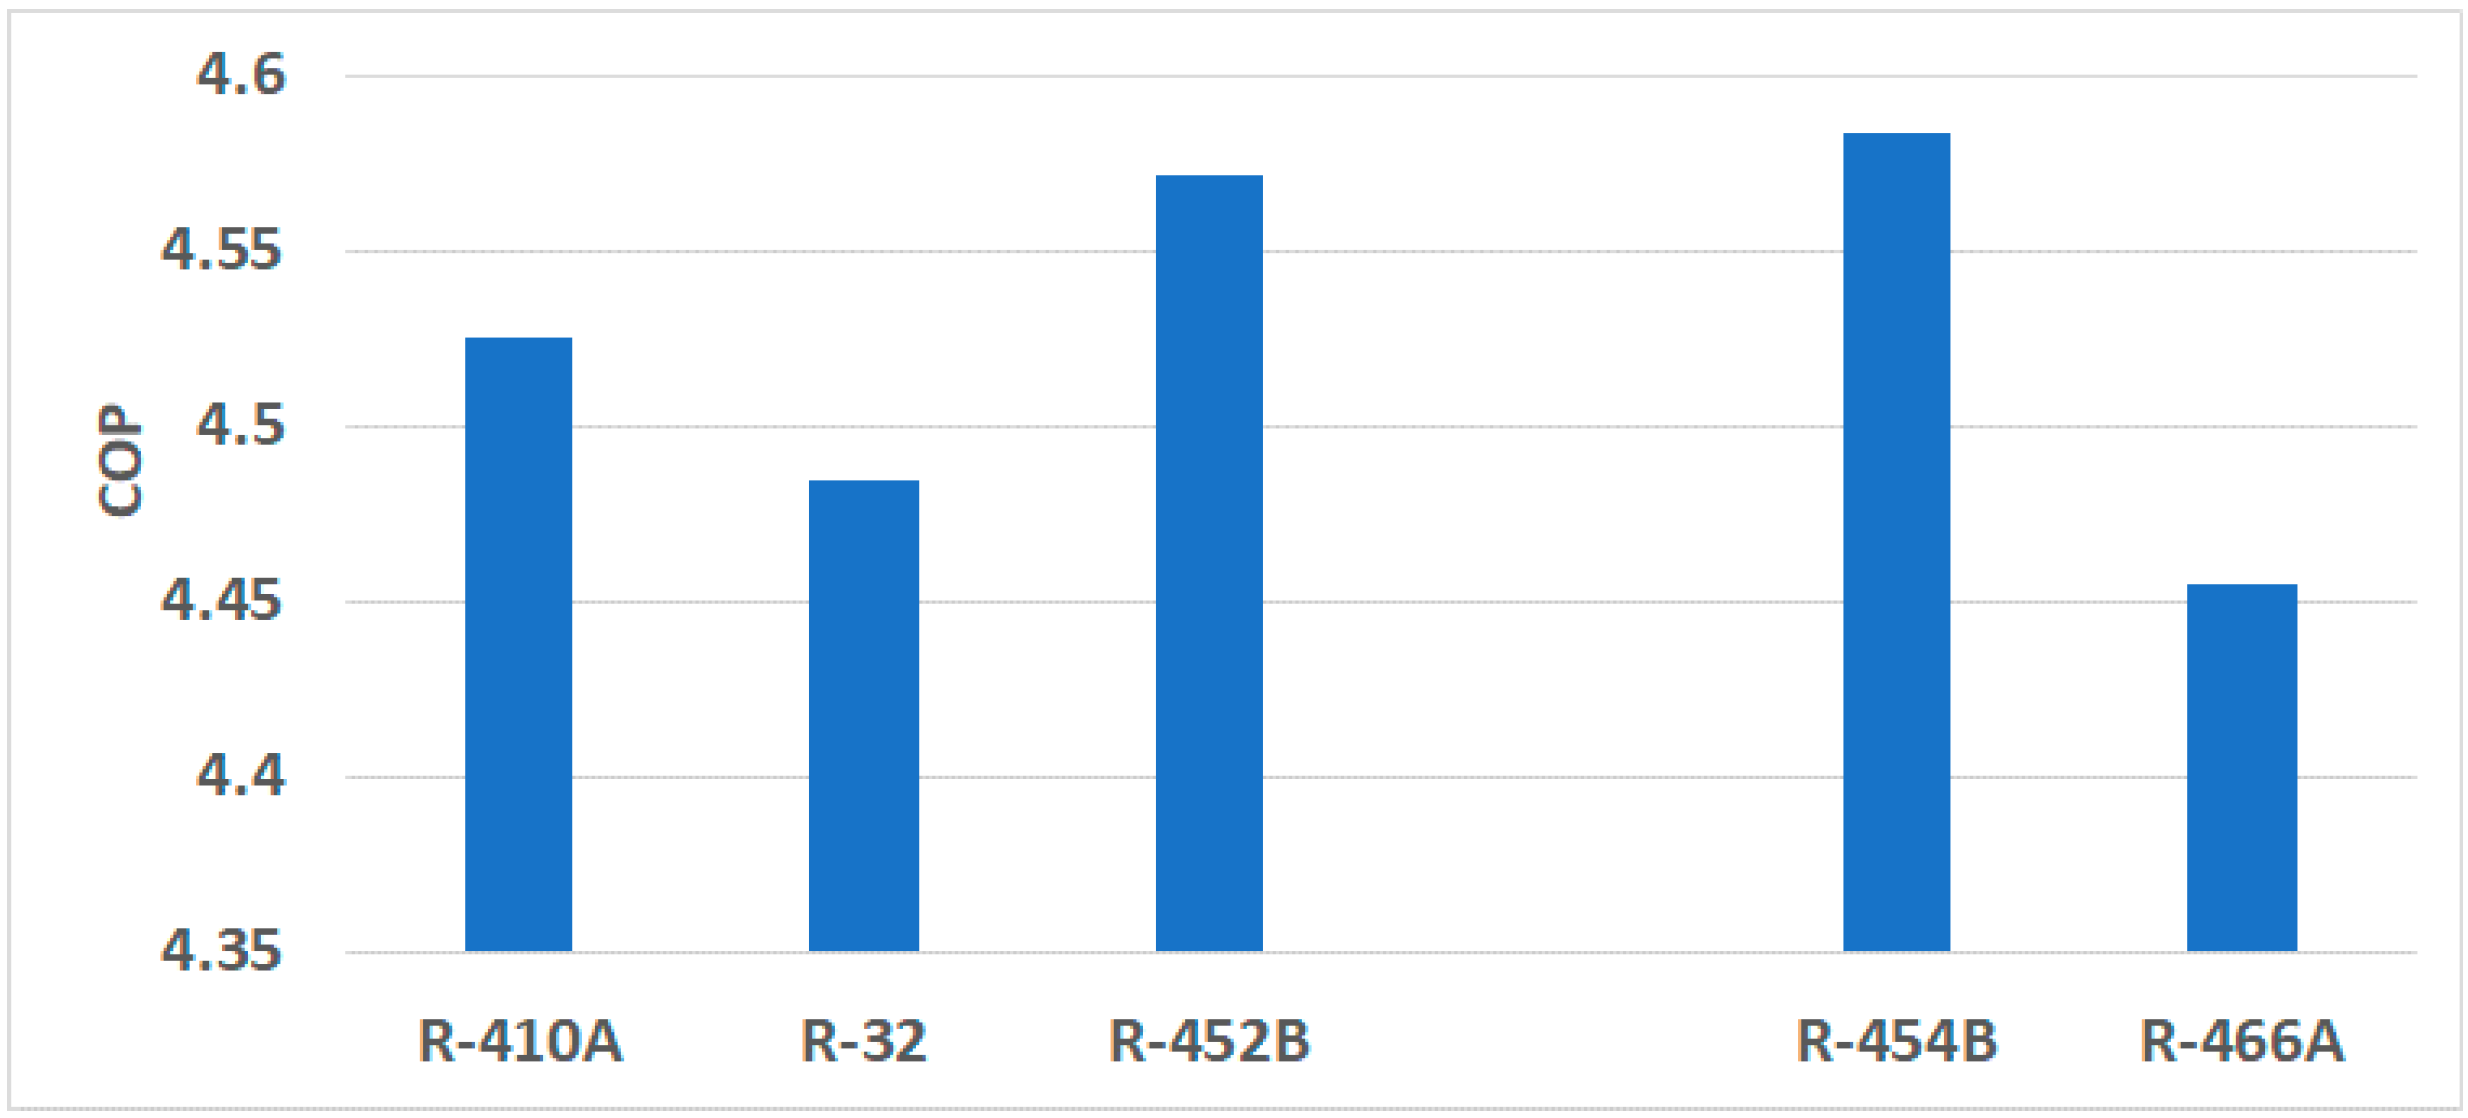
Figure 3 shows increments in cooling COPs. With the same heat exchangers, larger cooling capacity tends to cause higher condensing temperatures and lower evaporating temperatures, degrading the efficiency because the temperature lift is higher. Consequently, R-32 and R-466A have larger volumetric capacities at the expense of reduced COPs. R-452B and R-454B result in higher COPs. Figure 4 presents the compressor discharge temperatures. R-32 has significantly higher discharge temperatures, up to 16.67 K (30R). The other alternative refrigerants show slightly higher temperatures, up to 5.56 K (10R). At the low speed, the discharge temperatures are lower than those at the high speed, because the condensing temperature is reduced at the part-load operation. Figure 5 compares the seasonal cooling COPs, calculated from AHRI 210/240. They differ slightly, ranging from 4.45 to 4.58. R-454B results in the highest COP, and R-466A results in the lowest COP.
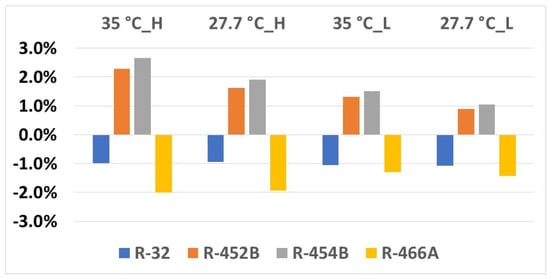
Figure 3.
COP variations in cooling mode.
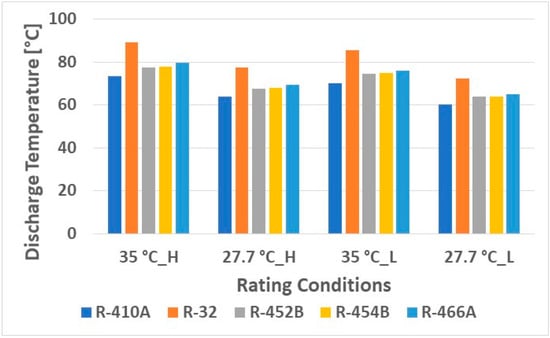
Figure 4.
Compressor discharge temperatures.

Figure 5.
Seasonal cooling COPs.
The systemic COPs based on the first law present an adumbrate view of energy efficiency. To investigate systemic inefficiency and where the opportunity for further efficiency improvements may be found, an exergy analysis is imperative, utilizing both the first and second law of thermodynamics.
5. General Mass, Energy, and Exergy Balances
Cycle analyses are based on the values of stated variables at stated points corresponding to Figure 1, obtained from the HPDM simulations, and thermodynamic properties from REFPROP 10.0 [27].
The general mass and energy balance equations are given by Equations (3) and (4), respectively,
where is the rate of thermal energy exchanged between the control volume (CV) around a specific component of the heat pump and the surroundings at ; is the rate of work input to the compressor; represent enthalpy, kinetic energy, and potential energy, respectively; and is the refrigerant mass flow rate. Under a steady state, the steady flow assumption of the model, transient terms, and in Equations (3) and (4), respectively, reduce to zero.
The general exergy balance equation [28], applied across each discrete component under evaluation, is:
where is the sum of the entropy generation rates due to internal irreversibility and those from irreversible thermal energy transfer between the CV surrounding each component, and its surrounding. This method of exergy analysis of heat pumps has been validated and applied to low-GWP heat pumps, and in more complex cases (due to interaction with both the ground and the ambient air) for ground source heat pumps [29,30,31] and for cold-climate heat pumps [18].
Irreversibility, the thermodynamic measure of the lost opportunity to do useful work is related to the rate of entropy generation by:
The mass flow rate and values of state functions around the CV for each heat pump component are obtained from the HPDM model. The application of Equations (3)–(6) to the particular heat pump component and its corresponding state points (see Figure 1) yield the component and systemic irreversibility and energy balances shown in Table 4.
Table 4.
Stated variables at various stated points as shown in Figure 1.
6. Energy, Entropy Generation, and Irreversibility
The work input to the compressor obtained from the HPDM model for each outdoor temperature is the algebraic sum of and , which equals as shown in Table 5. The negative sign for is because heat is flowing out of the compressor CV, as per IUPAC convention (energy inflow is positive, outflow is negative). From entropy generation rate, , the total compressor irreversibility is , where is the ambient temperature specified in the headings of Table 5.
Table 5.
Thermal and mechanical energy exchanges using HPDM and applications of Equations (3)–(6).
For a rigorous analysis, we must show consistency between the compressor work input () from the HPDM model and that calculated from irreversibility analysis. The total actual work input to the compressor must be the sum of the Carnot work and the irreversibility losses. The Carnot COP (cooling mode) for an ideal heat pump with no irreversibility is given by:
where is the heat reject temperature, specified on the header of Table 4, and is the indoor set-point temperature (26.67 °C). The total cyclic irreversibility, , is the sum of the irreversibility of each component: the compressor, condenser, EXV, and line loss between the evaporator and the compressor inlet , and the line loss from the compressor outlet to the evaporator inlet . The actual work input must be the sum of the ideal work (Carnot work) and the lost work due to irreversibility.
Thus, in Table 5, and is in reasonable agreement with the work input to the heat pump (HP), derived from the model. This calculation is performed for each ambient temperature. We emphasize that the work computed from irreversibility analysis for the heat pump cycle and that obtained from the HPDM model are consistent, complementary, and therefore validate our analyses.
7. Component-Wise Irreversibility
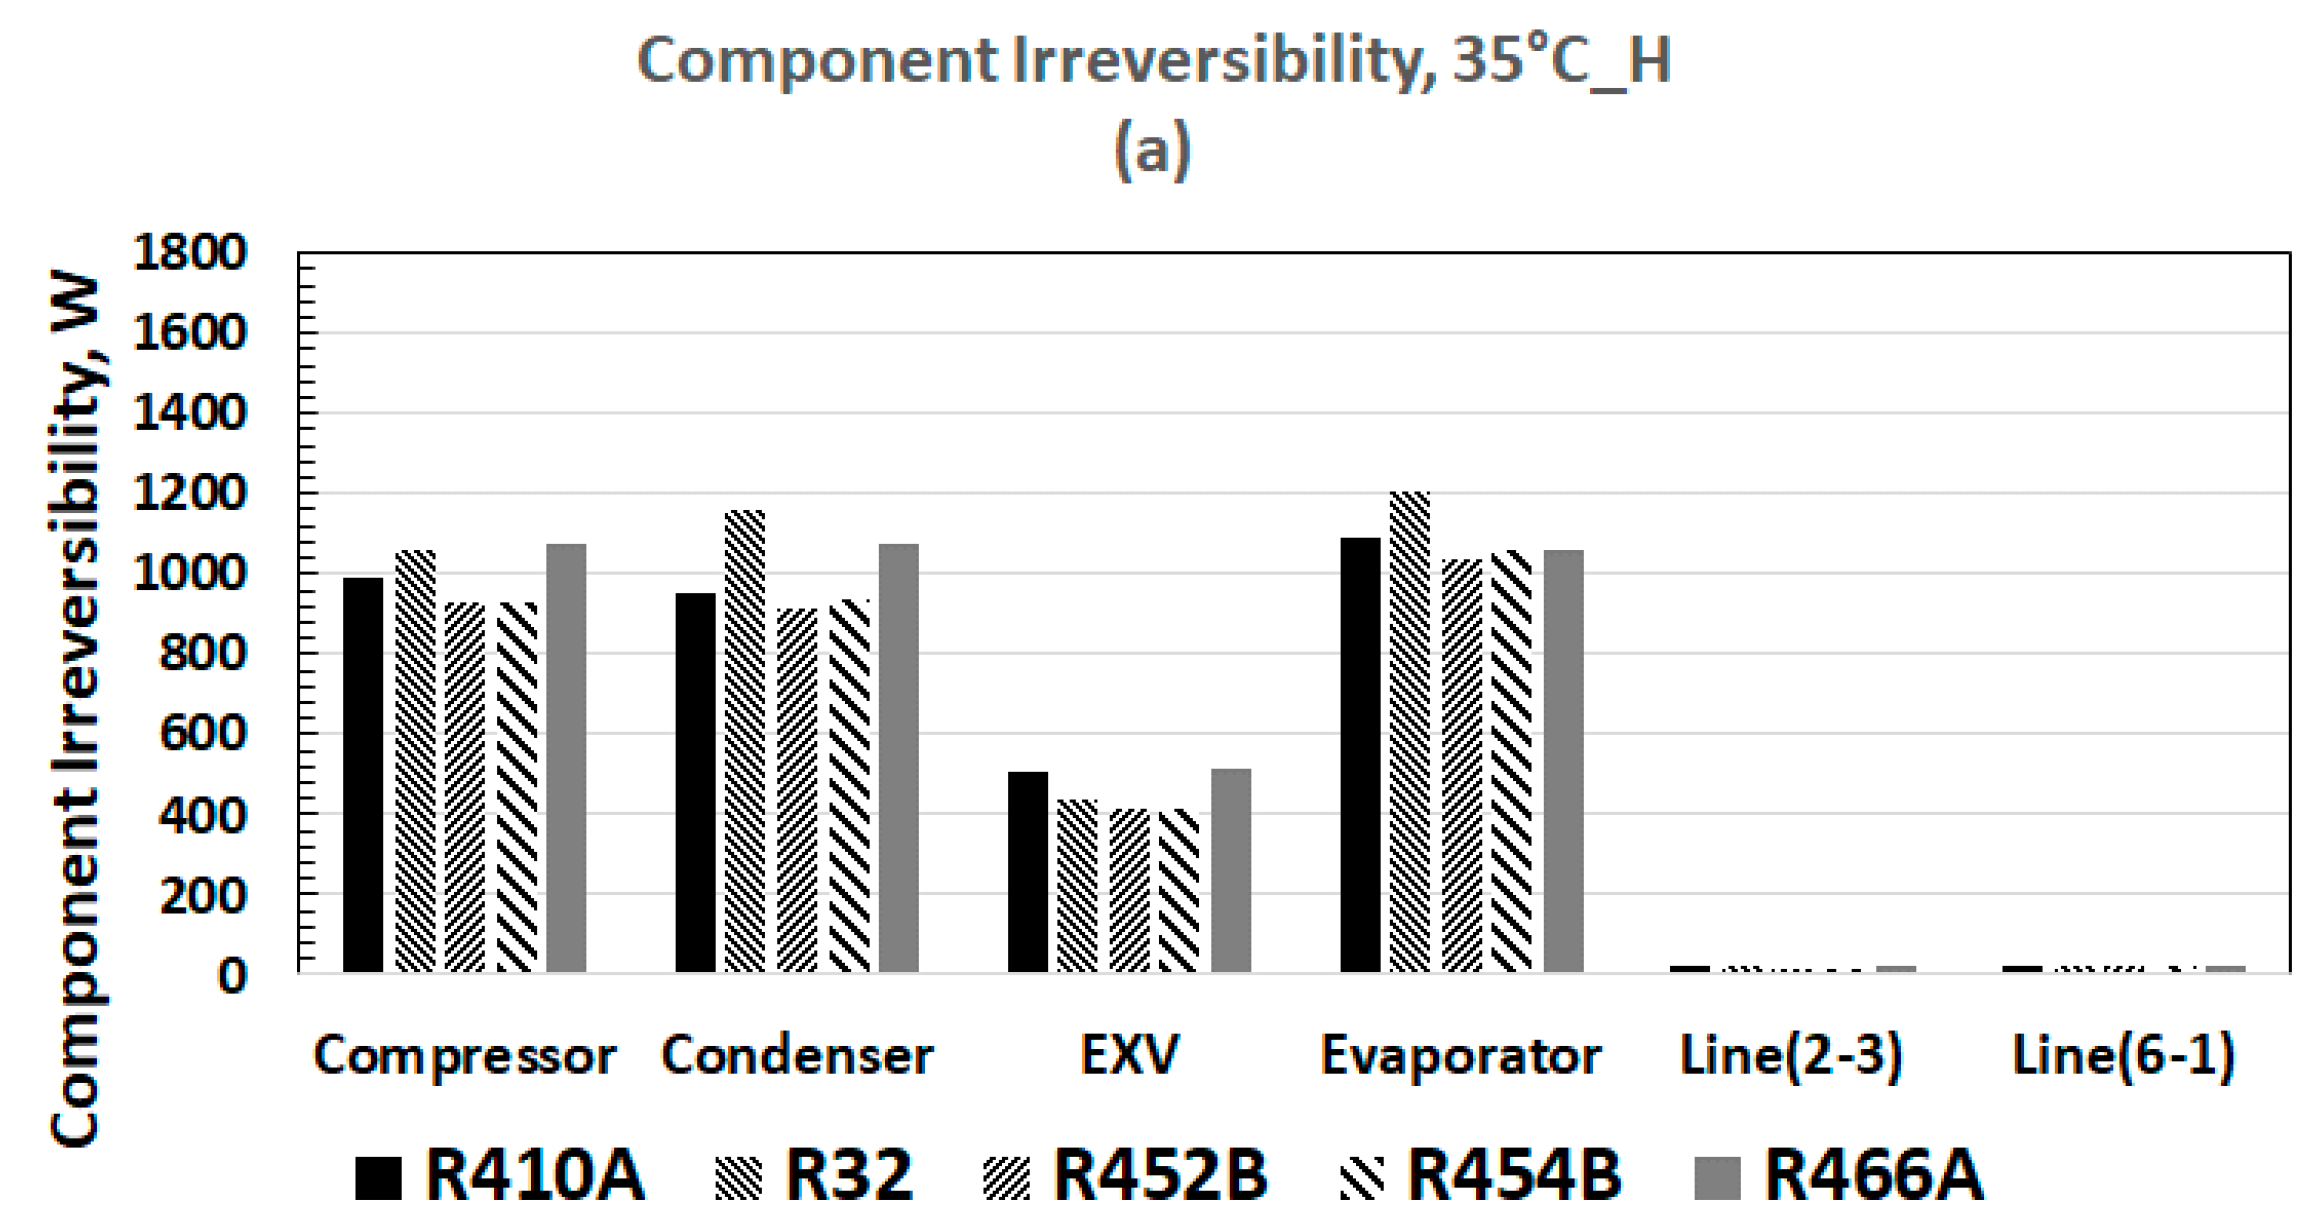
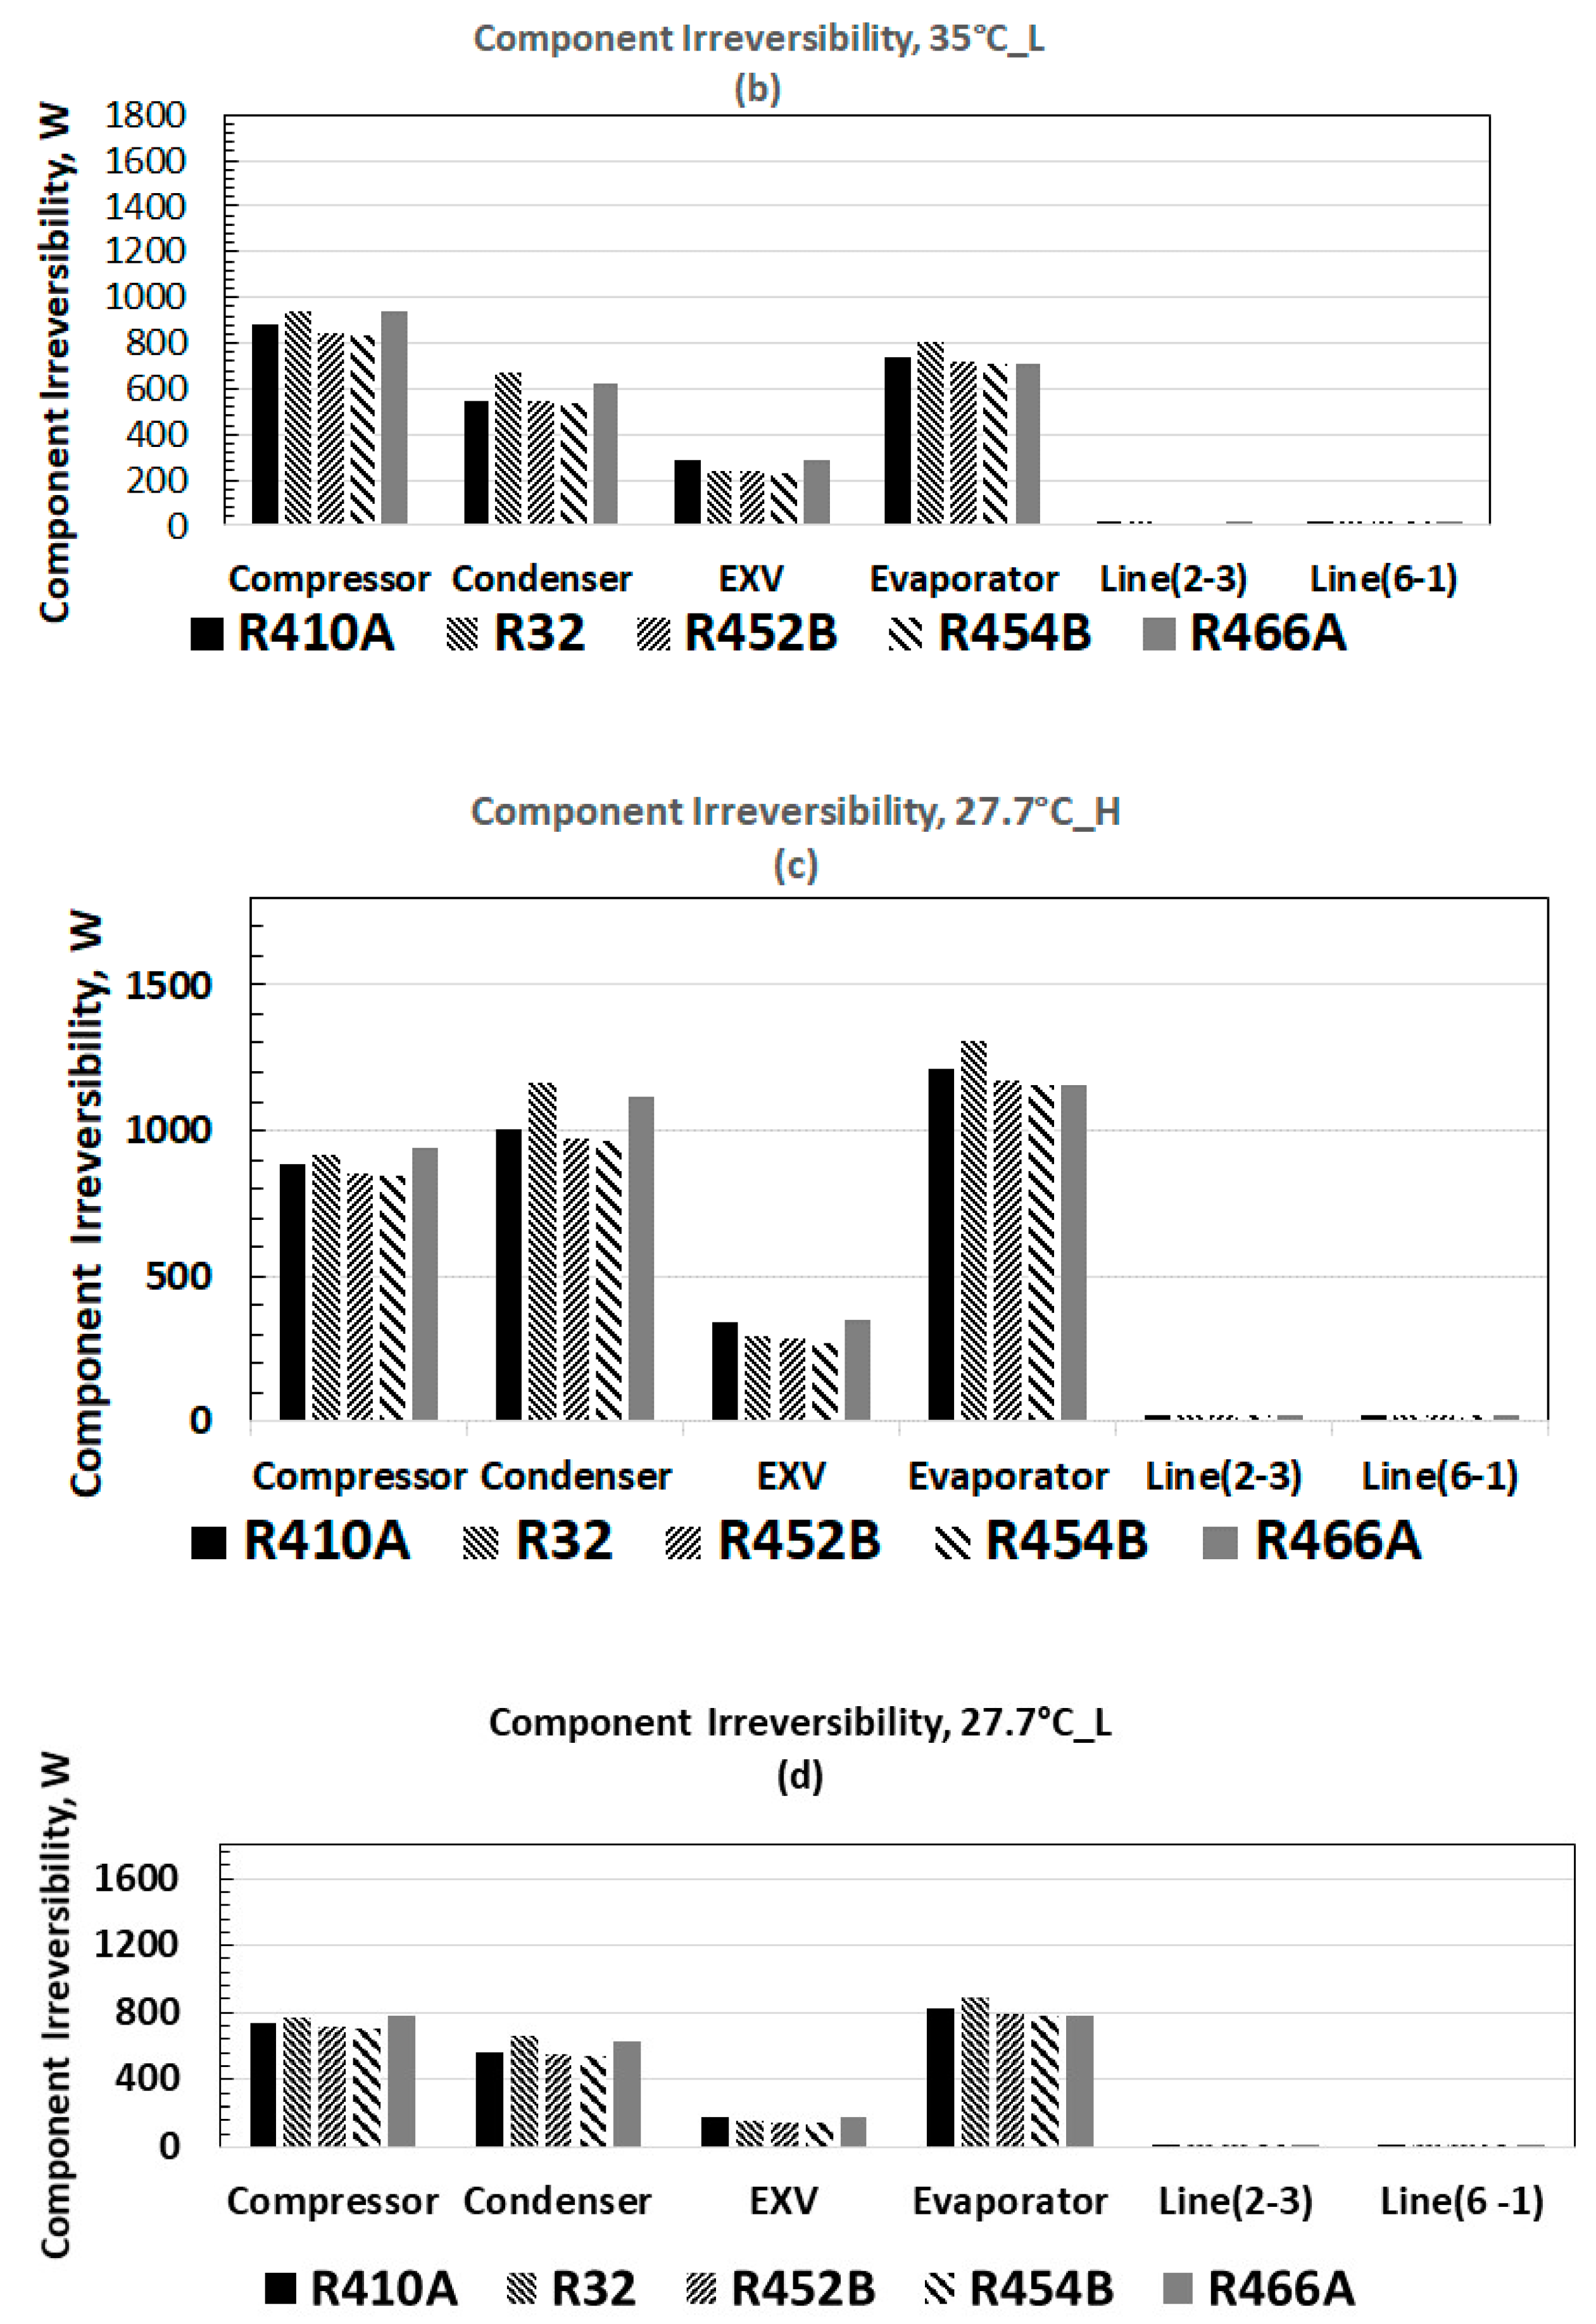
More detailed information on the systemic irreversibility is derived from the component-level irreversibility for each temperature level in AHRI 210/240, as shown in Figure 6. The structure of component-level irreversibility between the high speed at 35 °C and 27.7 °C ambient temperatures are similar, just like the similarity between the low-speed cases. However, the irreversibility structure is different between the two speeds for each ambient temperature. The total irreversibility is also higher for the high speed vs. the low speed, as might be expected (rapid processes have higher entropy losses). Evaporator irreversibility is comparable to that of the compressor in all cases. In high-speed operation, the condenser and evaporator irreversibility dominate cyclic irreversibility.
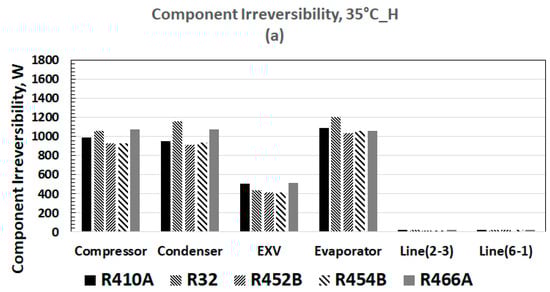
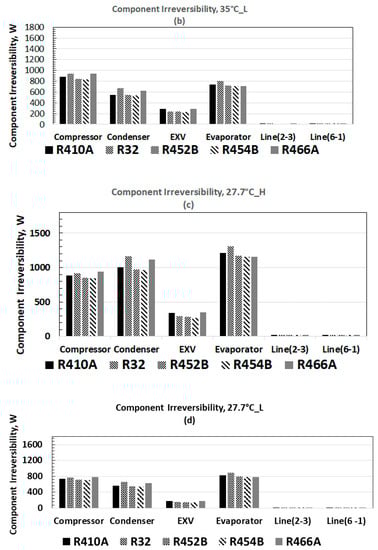
Figure 6.
Irreversibility structure of HP components at ambient temperatures specified by AHRI 210/240 standard. (a) 35 °C, high-speed; (b) 35 °; (b) 35 °C, low-speed; (c) 27.7 °C, low-speed; (c) 27.7 °C, high-speed; and (d) 27.2 °C, high-speed; and (d) 27.2 °C, low-speed. Space cooling temperature in all cases is at 26.67 °C, as per standard.
The comparative irreversibility and the cooling COP relative to Carnot for all refrigerants at each AHRI 210/240-rated condition are even more telling (Figure 7). The total systemic irreversibility of R-452B and R-45B are the least significant. Regarding performance relative to Carnot, the pattern is unescapable in going from high (35 °C) to low temperature (27.7 °C), regardless of the speed. At 27.7 °C, the Carnot heat pump efficiency is great, making the relative efficiency compared to the Carnot efficiency small. The opposite is true at 35 °C, where both the Carnot and the HP efficiency are smaller, making their ratio greater.
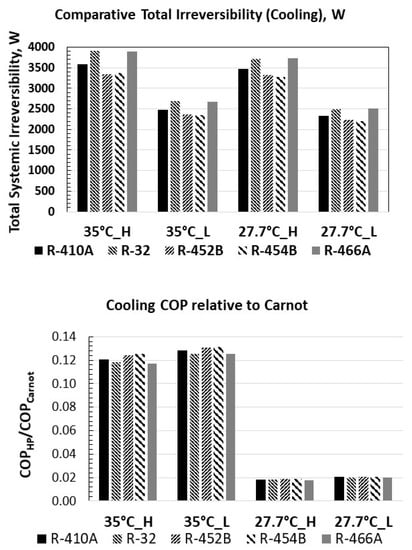
Figure 7.
Performance of refrigerants in the HP (top) at various AHRI 210/240-rated conditions, and (bottom) in comparison to the Carnot efficiency at the same rated conditions.
8. Results
Our analyses, based on AHRI 210/240 rating conditions, indicate that the low-GWP refrigerants listed in Table 1 are valid replacements for R-410A in terms of COP and systemic irreversibility. R-452B and R-454B consume less compressor work and have similar evaporator duty relative to R-410A, as supported by previous work [1,3]. The evaporator duty for R-32 is among the highest relative to other refrigerants (Table 5). The higher evaporator duty is reflected in slightly higher systemic losses for R-32. Compressor irreversibility losses at high speed are generally greater than at low speed at the same rating conditions (Figure 6). At high speed, the evaporator and condenser irreversibility are predominant (Figure 6). Irreversibility losses in the EXV are low. Irreversibility losses in the connecting lines are negligible. These losses, though small, may be further reduced with better thermal insulation. Opportunities for reducing the irreversibility losses in the evaporator and condenser may involve improved design. The differences in COP of the HP for the refrigerants at the respective rating conditions are small, but Carnot efficiency trends are higher when the temperature lift gets smaller. This is why the COP relative to Carnot COP (Figure 7) drops lower at smaller temperature lifts. The calculation of the actual compressor work, from exergy analysis and that obtained from the HPDM model (first law basis), are in very good agreement. The agreement in the energy balances obtained from the model and by using the state points, with corresponding values of state variables using REFPROP ver. 10 [13], are also in excellent agreement.
9. Conclusions
It is technically feasible to replace R-410A (GWP 1934) with lower-GWP refrigerants (Table 2) without changing the heat-pump hardware. Cooling capacity increments of the drop-in alternative refrigerant compared to R-410A are 4% and 6% better for R-32 and R-466A, respectively, and 2% worse for R-452B and R-454B, respectively.
We conclude that seasonal cooling COPs, calculated using AHRI 210/240 specifications, show slight variation from 4.45 to 4.58. R-454B results in the highest COP, and R-466A results in the lowest COP (Figure 5). Systemic irreversibility calculated from using both the first and the second laws of thermodynamics pointed toward slightly lower compressor irreversibility with R-452B and R-454B, relative to the other refrigerants, for high and low compressor speeds. Evaporator irreversibility exceeded compressor irreversibility, except for the 35 °C low-speed condition, where it was marginally less. The conclusion from the irreversibility analysis strongly suggests that to mitigate lost work, it is essential to focus on heat exchanger technology to reduce the condenser and evaporator irreversibility. The total systemic irreversibility is least significant for R-452B and for R-454B, for all conditions of temperature and compressor speed.
All the candidate low-GWP refrigerants have better efficiency and performance characteristics. The energy input to the compressor, systemic irreversibility, and condenser duty are important considerations before selecting a refrigerant. In particular, R-452B and R-454B have the lowest systemic irreversibility. Overall, any of the four alternative refrigerants are viable drop-in replacements.
Author Contributions
B.S. performed the modeling and simulations using the heat pump design model; M.R.A. performed the exergy analysis, based on the state properties obtained from the simulations and modeling effort. Both authors have read and agreed to the published version of the manuscript.
Funding
Funding was provided by the U.S. Department of Energy, Building Technologies Office.
Institutional Review Board Statement
Not applicable.
Informed Consent Statement
Not applicable.
Data Availability Statement
Not applicable.
Acknowledgments
We are grateful to Antonio Bouza, Program Manager for the Emerging Technologies office related to heating, ventilation, air conditioning, refrigeration, and appliances for his support and encouragement.
Conflicts of Interest
This manuscript has been authored by UT-Battelle, LLC, under contract DE-AC05-00OR22725 with the US Department of Energy (DOE). The US government retains and the publisher, by accepting the article for publication, acknowledges that the US government retains a nonexclusive, paid-up, irrevocable, worldwide license to publish or reproduce the published form of this manuscript, or allow others to do so, for US government purposes. The DOE will provide public access to these results of federally sponsored research in accordance with the DOE Public Access Plan (http://energy.gov/downloads/doe-public-access-plan).
Nomenclature
| AHRI | Air-Conditioning, Heating, and Refrigeration Institute |
| ASHRAE | American Society of Heating, Refrigeration, and Airconditioning Engineering |
| CFC | Chlorofluorocarbon |
| COP | Coefficient of Performance, dimensionless |
| CV | Control Volume |
| D | Density |
| EXV | Expansion Valve |
| E | Energy, J/s |
| %∆E | Percent energy change relative to input energy, dimensionless |
| g | Gravitational acceleration, m/s2 |
| GWP | Global Warming Potential |
| HP | Heat Pump |
| HPDM | Heat Pump Design Model |
| h | Enthalpy, kJ/kg |
| HT | Heat transfer coefficient, W/m2/K |
| I | Irreversibility, J/s |
| LCCP | Life Cycle Cost Performance |
| m | Mass flow rate, kg/h |
| Q | Rate of heat transfer, J/s |
| s | specific entropy, kJ/kg-K |
| T | Temperature, K |
| TEWI | Total Equivalent Warming Index |
| v | Velocity, m/s |
| W | Rate of work, J/s |
| z | Height above datum, m |
| Subscripts | |
| a | Actual, or air |
| Carnot | Carnot |
| Comp. | Compressor |
| Cond. | Condenser |
| Evap. | Evaporator |
| EXV | Expansion valve |
| In | Inflow |
| i | Inlet |
| Out | Outflow |
| o | Outlet |
| r | Refrigerant |
| total | Total value of a category |
| (2–3) | Connecting line, compressor to condenser inlet |
| (6–1) | Connecting line, evaporator to compressor inlet |
| Greek | |
| σ | Rate of entropy generation, W/K |
| Efficiency | |
| Acronym | |
| AHRI | Air-Conditioning, Heating, and Refrigeration Institute of the United States |
| DB | Dry Bulb temperature |
| DOE | Department of Energy, U.S. |
| GHG | Greenhouse Gas |
| GWP | Global Warming Potential |
| HP | Heat Pump |
| HFC | Hydrofluorocarbons |
| HFO | Hydrofluoroolefin |
| HPDM | DOE/ORNL Heat Pump Design Model |
| HVAC | Heating, Ventilation, Air Conditioning |
| ODP | Oxygen Depletion Potential |
| ORNL | Oak Ridge National Laboratory |
| WB | Wet Bulb temperature |
References
- IPCC. 2019: Summary for Policymakers. In IPCC Special Report on the Ocean and Cryosphere in a Changing Climate; Pörtner, H.-O., Roberts, D.C., Masson-Delmotte, V., Zhai, P., Tignor, M., Poloczanska, E., Mintenbeck, K., Nicolai, M., Okem, A., Petzold, J., et al., Eds.; IPCC: Geneva, Switzerland, 2019. [Google Scholar]
- Molina, M.J.; Rowland, F.S. Stratospheric sink for chlorofluoromethanes: Chlorine atom-catalysed destruction of ozone. Nature 1974, 249, 810–812. [Google Scholar] [CrossRef]
- McLinden, M.O.; Huber, M.L. (R) Evolution of refrigerants. J. Chem. Eng. Data 2020, 65, 4176–4193. [Google Scholar] [CrossRef]
- Wang, X.; Amrane, K.; Johnson, P. Low Global Warming Potential (GWP) Alternative Refrigerants Evaluation Program (Low-GWP AREP). International Refrigeration and Air Conditioning Conference. Paper 1222. 2012. Available online: http://docs.lib.purdue.edu/iracc/1222 (accessed on 7 July 2021).
- McGowan, M.K. Progress Report on Alternative Refrigerants. ASHRAE J. 2019, 61, 38–41. [Google Scholar]
- Heredia-Aricapa, Y.; Belman-Flores, J.M.; Mota-Babiloni, A.; Serrano-Arellano, J.; García-Pabón, J.J. Overview of low GWP mixtures for the replacement of HFC refrigerants: R134a, R404A and R410A. Int. J. Refrig. 2020, 111, 113–123. [Google Scholar] [CrossRef]
- Pham, H.M.; Rajendran, R. R32 and HFOs as Low-GWP Refrigerants for Air Conditioning. International Refrigeration and Air Conditioning Conference. Paper 1235. 2012. Available online: http://docs.lib.purdue.edu/iracc/1235 (accessed on 18 July 2021).
- Yu, B.; Ouyang, H.; Shi, J.; Liu, W.; Chen, J. Evaluation of low-GWP and mildly flammable mixtures as new alternatives for R410A in air-conditioning and heat pump system. Int. J. Refrig. 2021, 121, 95–104. [Google Scholar] [CrossRef]
- Yang, C.; Seo, S.; Takata, W.; Thu, K.; Miyazaki, T. The life cycle climate performance evaluation of low-GWP refrigerants for domestic heat pumps. Int. J. Refrig. 2021, 121, 33–42. [Google Scholar] [CrossRef]
- Sieres, J.; Ortega, I.; Cerdeira, F.; Alvarez, E. Drop-in performance of the low-GWP alternative refrigerants R452B and R454B in an R410A liquid-to-water heat pump. Appl. Therm. Eng. 2021, 182, 116049. [Google Scholar] [CrossRef]
- Shen, B.; Rice, K. DOE/ORNL Heat Pump Design Model. 2016. Available online: http://hpdmflex.ornl.gov/ (accessed on 18 July 2021).
- Gallaher, M.; Scott, T.; Oliver, Z.; Clark-Sutton, K.; Anderson, B. Benefit-Cost Evaluation of US Department of Energy Investment in HVAC, Water Heating, and Appliance Technologies. 2017. Available online: https://www.energy.gov/eere/buildings/downloads/benefit-cost-evaluation-us-department-energy-investment-hvac-water-heating (accessed on 18 July 2021).
- DOE/ORNL Heat Pump Design Model, Related Reports/Papers. Available online: https://web.ornl.gov/~doehpdm/hpdm/Related_Reports.html (accessed on 18 July 2021).
- Rice, C.K. The Effect of Void Fraction Correlation and Heat Flux Assumption on Refrigerant Charge Inventory Predictions. ASHRAE Trans. 1987, 93, 341–367. [Google Scholar]
- Dabiri, A.E.; Rice, C.K. A Compressor Simulation Model with Corrections for the Level of Suction Gas Superheat. ASHRAE Trans. 1981, 87, 771–782. [Google Scholar]
- Shen, B.; Shrestha, S.S.; Abdelaziz, O. Model Validations for Low-GWP refrigerants in Mini-Split Air Conditioning Units. Sci. Technol. Built Environ. 2016, 22, 1254–1262. [Google Scholar] [CrossRef] [Green Version]
- Mahderekal, I.; Shen, B.; Vineyard, E.A. System Modeling of Gas Engine Driven Heat Pump. In Proceedings of the International Refrigeration and Air Conditioning Conference at Purdue, West Lafayette, IN, USA, 16–19 July 2012. [Google Scholar]
- Shen, B.; Ally, M.R. Energy and Exergy Analysis of Low-Global Warming Potential Refrigerants as Replacement for R410A in Two-Speed Heat Pumps for Cold Climates. Energies 2020, 13, 5666. [Google Scholar] [CrossRef]
- Shen, B.; Abdelaziz, O.; Shrestha, S.; Elatar, A. Model-Based Optimizations of Packaged Rooftop Air Conditioners Using Low Global Warming Potential Refrigerants. Int. J. Refrig. 2018, 87, 106–117. [Google Scholar] [CrossRef]
- ANSI/AHRI Standard 540-99. Positive Displacement Refrigerant Compressors and Compressor Units; Air Conditioning and Refrigeration Institute: Arlington, VA, USA, 2010. [Google Scholar]
- Braun, J.E.; Klein, S.A.; Mitchell, J.W. Effectiveness models for cooling towers and cooling coils. ASHRAE Trans. 1989, 95 Pt 2, 164–174. [Google Scholar]
- Thome, J.R.; Hajal, J. Two-Phase Flow Pattern Map for Evaporation in Horizontal Tubes: Latest Version. Heat Transf. Eng. 2002, 24, 1–2. [Google Scholar] [CrossRef]
- Cavallini, A.; Col, D.D.; Doretti, L.; Matkovic, M.; Rossetto, L.; Zilio, C.; Censi, G. Condensation in Horizontal Smooth Tubes: A New Heat Transfer Model for Heat Exchanger Design. Heat Transfer. Eng. 2006, 27, 1–38. [Google Scholar] [CrossRef]
- Choi, J.Y.; Kedzierski, M.A.; Domanski, P.A. Generalized pressure drop correlation for evaporation and condensation in smooth and micro-fin tubes. In Proceedings of the International Institute of Refrigeration (IIR), Paderborn, Germany, 3–5 October 2001; Volume 1, pp. 9–16. [Google Scholar]
- Stephan, K. Heat Transfer in Condensation and Boiling; Springer: New York, NY, USA, 1992; p. 84. [Google Scholar]
- Bell, K.J. An approximate generalized design method for multicomponent/partial condensers. In AIChE Symposium Series; American Institute of Chemical Engineers: New York, NY, USA, 1972; Volume 69, pp. 72–79. [Google Scholar]
- Lemmon, E.W.; Bell, I.H.; Huber, M.L.; McLinden, M.O. NIST Standard Reference Database 23: Reference Fluid Thermodynamic and Transport Properties-REFPROP, Version 10.0; National Institute of Standards and Technology, Standard Reference Data Program: Gaithersburg, MD, USA, 2018.
- Warke, K., Jr. Advanced Thermodynamics for Engineers; McGraw-Hill: New York, NY, USA, 1995; ISBN 0-07-068292-5. [Google Scholar]
- Ally, M.R.; Munk, J.D.; Baxter, V.D.; Gehl, A.C. Data, exergy, and energy analyses of a vertical-bore, ground-source heat pump for domestic water heating under simulated occupancy conditions. Appl. Therm. Eng. 2015, 89, 192–203. [Google Scholar] [CrossRef] [Green Version]
- Ally, M.R.; Munk, J.D.; Baxter, V.D.; Gehl, A.C. Exergy and energy analysis of a ground-source heat pump for domestic water heating under simulated occupancy conditions. Int. J. Refrig. 2013, 36, 1417–1430. [Google Scholar] [CrossRef]
- Ally, M.R.; Munk, J.D.; Baxter, V.D.; Gehl, A.C. Exergy analysis and operational efficiency of a horizontal ground-source heat pump system operated in a low-energy test house under simulated occupancy conditions. Int. J. Refrig. 2012, 35, 1092–1103. [Google Scholar] [CrossRef]


Publisher’s Note: MDPI stays neutral with regard to jurisdictional claims in published maps and institutional affiliations. |
© 2021 by the authors. Licensee MDPI, Basel, Switzerland. This article is an open access article distributed under the terms and conditions of the Creative Commons Attribution (CC BY) license (https://creativecommons.org/licenses/by/4.0/).