Article

Sand- and Clay-Photocured-Geomembrane Interface Shear Characteristics Using Direct Shear Test

School of Civil Engineering, Architecture and Environment, Hubei University of Technology, Wuhan 430068, China
*
Author to whom correspondence should be addressed.
Sustainability 2021, 13(15), 8201; https://doi.org/10.3390/su13158201
Submission received: 23 April 2021 / Revised: 8 July 2021 / Accepted: 12 July 2021 / Published: 22 July 2021

Abstract

:
It is well known that geomembranes frequently and easily fail at the seams, which has been a ubiquitous problem in various applications. To avoid the failure of geomembrane at the seams, photocuring was carried out with 1~5% photoinitiator and 2% carbon black powder. This geomembrane can be sprayed and cured on the soil surface. The obtained geomembrane was then used as a barrier, separator, or reinforcement. In this study, the direct shear tests were carried out with the aim to investigate the interfacial characteristics of photocured geomembrane–clay/sand. The results show that a 2% photoinitiator has a significant effect on the impermeable layer for the photocured geomembrane–clay interface. As for the photocured geomembrane–sand interface, it is reasonable to choose a geomembrane made from a 4% photoinitiator at the boundary of the drainage layer and the impermeable layer in the landfill. In the cover system, it is reasonable to choose a 5% photoinitiator geomembrane. Moreover, as for the interface between the photocurable geomembrane and clay/sand, the friction coefficient increases initially and decreases afterward with the increase of normal stress. Furthermore, the friction angle of the interface between photocurable geomembrane and sand is larger than that of the photocurable geomembrane–clay interface. In other words, the interface between photocurable geomembrane and sand has better shear and tensile crack resistance.

1. Introduction

Existing geomembranes are mainly made from polyethylene (PE), polyester (PET), polypropylene (PP), and polyvinyl chloride (PVC), which can be thermally and mechanically processed to form a continuous film [1]. Geomembrane is an excellent drainage barrier and has been widely used in landfills, water channels, detention ponds, and reservoirs [2]. However, since the geomembrane is made into fixed sizes in the processing, it is necessary to cut and weld the geomembrane to make it fit into a large area of soils at the construction site [3]. Due to the difference of interface characteristics between soil and geomembrane, the welding and joint between geomembrane plates are prone to failure, which accounts for 20% of various failure modes of geomembrane [4]. Therefore, it is essential to investigate some novel geomembranes to match the reliable requirements.
Photocured geomembrane is a new impermeable material with excellent mechanical and hydraulic properties. This geomembrane can be formed through the photocuring chain reaction between the acrylic monomer and the photoinitiator (reaction initiator) in which carbon black powder is added as an ultraviolet (UV) blocker to improve durability. More importantly, photocured geomembranes made from proper raw materials are environmentally-friendly and are not harmful to human health [5,6,7]. Therefore, studying photocured geomembrane seems to be a popular issue in civil engineering.
In the past, many researchers have made great efforts to study the geomembrane. The interface characteristics between geomembrane and clay/sand have always been an important direction in the field of geomembrane research. The composite liner system of landfills usually consists of multiple soil–geomembrane interfaces. Fleming et al. [8] found through direct shear tests that the shear mechanism of the interface between sand and the geomembrane is different under different normal stress. Punetha et al. [9] performed microscopic analysis of the geomembrane–sand interface by electron microscopy to explain the reason for the shift in the shear mechanism. Feng et al. [10] analyzed the geomembrane–sand interface by Digital Elevation Model (DEM) software and found that the roughness of the geomembrane surface was an important factor affecting the shear characteristics of the interface. Gao et al. [11] improved the shear strength of the reinforcement-soil interface to a certain extent by adding ribs to the geomembrane. Cen et al. [12] conducted a shear test on high density polyethylene (HDPE) geomembrane and sand with a piece of cyclic shear equipment and found that under different normal stresses, for large shear displacements, the interface friction angle tends toward a stable value. For small shear displacement amplitudes, the damping ratio is greater than zero and shows a downward trend. When the shear displacement amplitude is large, the damping ratio increases with the increase of the shear displacement amplitude. Rowe et al. [13] studied the changes in tensile properties of HDPE geomembrane in landfills. The results show that setting a proper protective layer on the geomembrane (GMB) can limit the local tensile strain of the geomembrane to less than 3%; choosing a suitable slope angle and geotextile protective layer can limit the GMB strain to less than 2%. Izgin and Wasti [14] studied the influence of sand shape on the interface friction performance of geomembrane and found that the interface friction performance of sand with round particles is better than that of sand with angular particles. Gao and Koerner [15,16] found that the shear strength of the interface between the soil and the geotextile or geomembrane is less than the shear strength of the soil itself. Ling et al. [17] measured the friction coefficient and shear strength of the contact interface between the geomembrane and clay with a 100 mm × 100 mm direct shear apparatus and analyzed the relationship between the shear displacement and the maximum shear stress on the contact interface. Gao et al. [18] studied the interfacial shear strength between HDPE geomembranes of different shapes and sandy soils were investigated by extensive direct shear tests under different normal stresses. The results show that the cohesion increases and the angle of internal friction decreases for strip geomembranes, while all block geomembranes increase significantly. However, they did not study the photocurable polymer. It has been an important direction in the field of geomembrane research to further explore the interface characteristics between geomembrane and clay/sand.
Natalia Abramova et al. [19] used a sensor-array-based analysis system to cover the photocured polymer film on the chip, which can realize the automated analysis of serum components. Xiang et al. [20] investigated experimentally and theoretically the dependence of the material properties of photocured polymers on the intensity of the curing light. The change in viscosity with the displacement rate and light intensity is given to show the strong dependence of viscosity on deformation displacement rate and light intensity. The effect of free chains on the mechanical response is also discussed. Kim et al. [21] used photocured film to have strong antibacterial activity against E. coli and staphylococcus aureus, and its antibacterial activity only depends on the concentration of allowable daily intake (ADI) in the polymer coating. At present, there is no relevant report on the research on the interface characteristics of photocured geomembrane and clay/sand. These studies are limited to the study of the photocurable film, and the study of the interface characteristics between the photocurable geomembrane and clay/sand is still blank. To date, there is no study addressing the aforementioned key design issues, thus, there is an urgent need to substantially increase our knowledge about.
In view of the above facts, this paper studies the problems of the author’s inadequate research. The interfacial shear characteristics of different UV-cured geomembranes were analyzed, and the interfacial shear force–shear displacement curve and the interfacial peak shear stress and interfacial shear strength friction coefficient of different UV-cured geomembrane were obtained. Therefore, the research results of this paper are of great significance to the practical application of geomembrane.

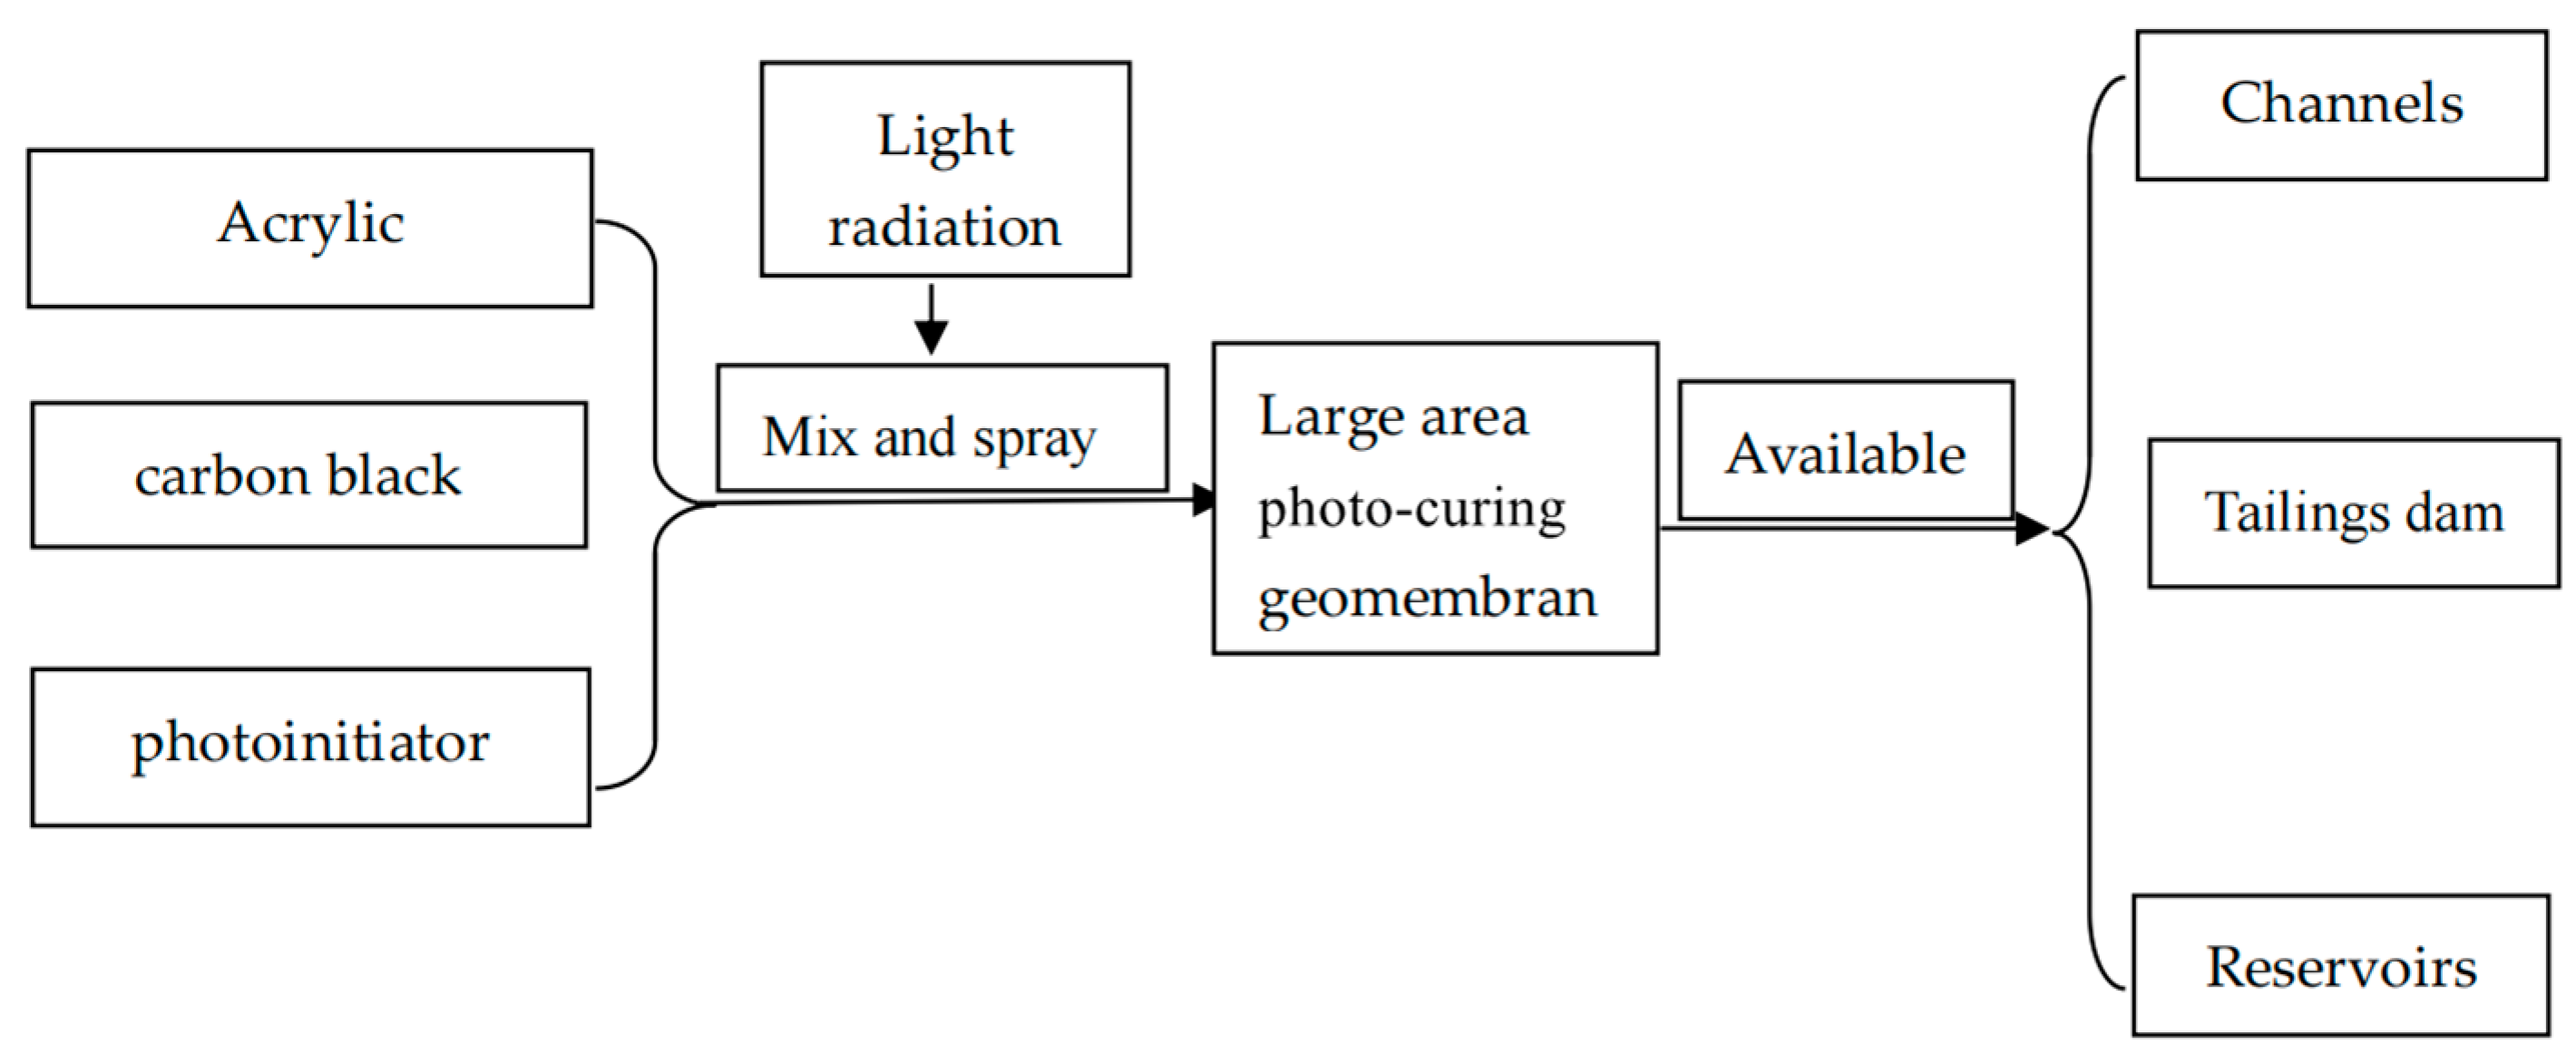
2. Principle of Photocuring Reaction

Photopolymerisation reaction: Photoinitiators absorb light at certain wavelengths. The absorption of light is accompanied by the release of the radical R•, which can react with the functional group of the acrylic monomer M to form an RM• with a π-bond [22]. The formed RM• acts as a radical, which can continue to bind to other acrylic monomer Ms. Thus, the polymerization reaction can continue until another radical is encountered and the chain reaction is terminated, forming a long chain of molecules with closed ends. Figure 1 shows the process and use of photocured chain reactions to form photocured geomembrane.
In this study, in addition to the monomer and photoinitiator, carbon black powder was also used as additive to block ultraviolet radiation and prevent material aging. In this way, the photocurable geomembrane is made. After the photocurable geomembrane is made in a large area, it is applied to the tunnel, tailings dam, and reservoir.
The complete photocuring reaction process is shown in Figure 1.

3. Materials and Processes for Manufacturing Photocured Geomembrane

3.1. Materials

In this paper, acrylic monomers and carbon black powder are used in the experiment, as shown in Table 1 and Figure 2.
Acrylic monomers: the acrylic monomers with multiple unsaturated bonds are proposed as the basic reactants for the photocuring reaction. Acrylic monomers are actually vinyl esters containing carbon–carbon double bonds, one of which is attached to a carbonyl carbon. Acrylate monomers are used extensively in polymerization reactions for the applications in industry, construction, water conservation, and horticulture and have been widely used in photocuring because of their low price, harmlessness to humans and animals, and the processability of the product. According to statistics, over 90% of the photocuring reactions employed today are based on acrylic monomers [2,22,23]. Therefore, the acrylic monomers are representative of wide applications.
Carbon black powder: Geomembranes typically contain 1% to 3% carbon black powder [1], which is used as an additive to obtain in this research.
Photoinitiator and light source: In this paper, it is proposed to use UV light (200 nm < wavelength < 400 nm). Long-wave UV light exists in nature at extremely low intensities and will not have a major impact on the curing reaction. Due to low energy, it will not adversely affect the health of personnel on site, nor will it change the properties of the monomer [24,25]. Experiments were conducted using intensities of 1 mW/cm2 to 5 mW/cm2 of UV light emitted through a UV flat light source to ensure consistency of intensity over a large area.
In the experimental raw materials, photoinitiators are selected at the percentage of 1–5% [2] while carbon black powder was selected at the percentage of 2% [1]. The added photoinitiator content is generally no more than 5%. In this paper, 1–5% photoinitiator is preferable in order to study the effect of photoinitiator content on light-curing reaction.

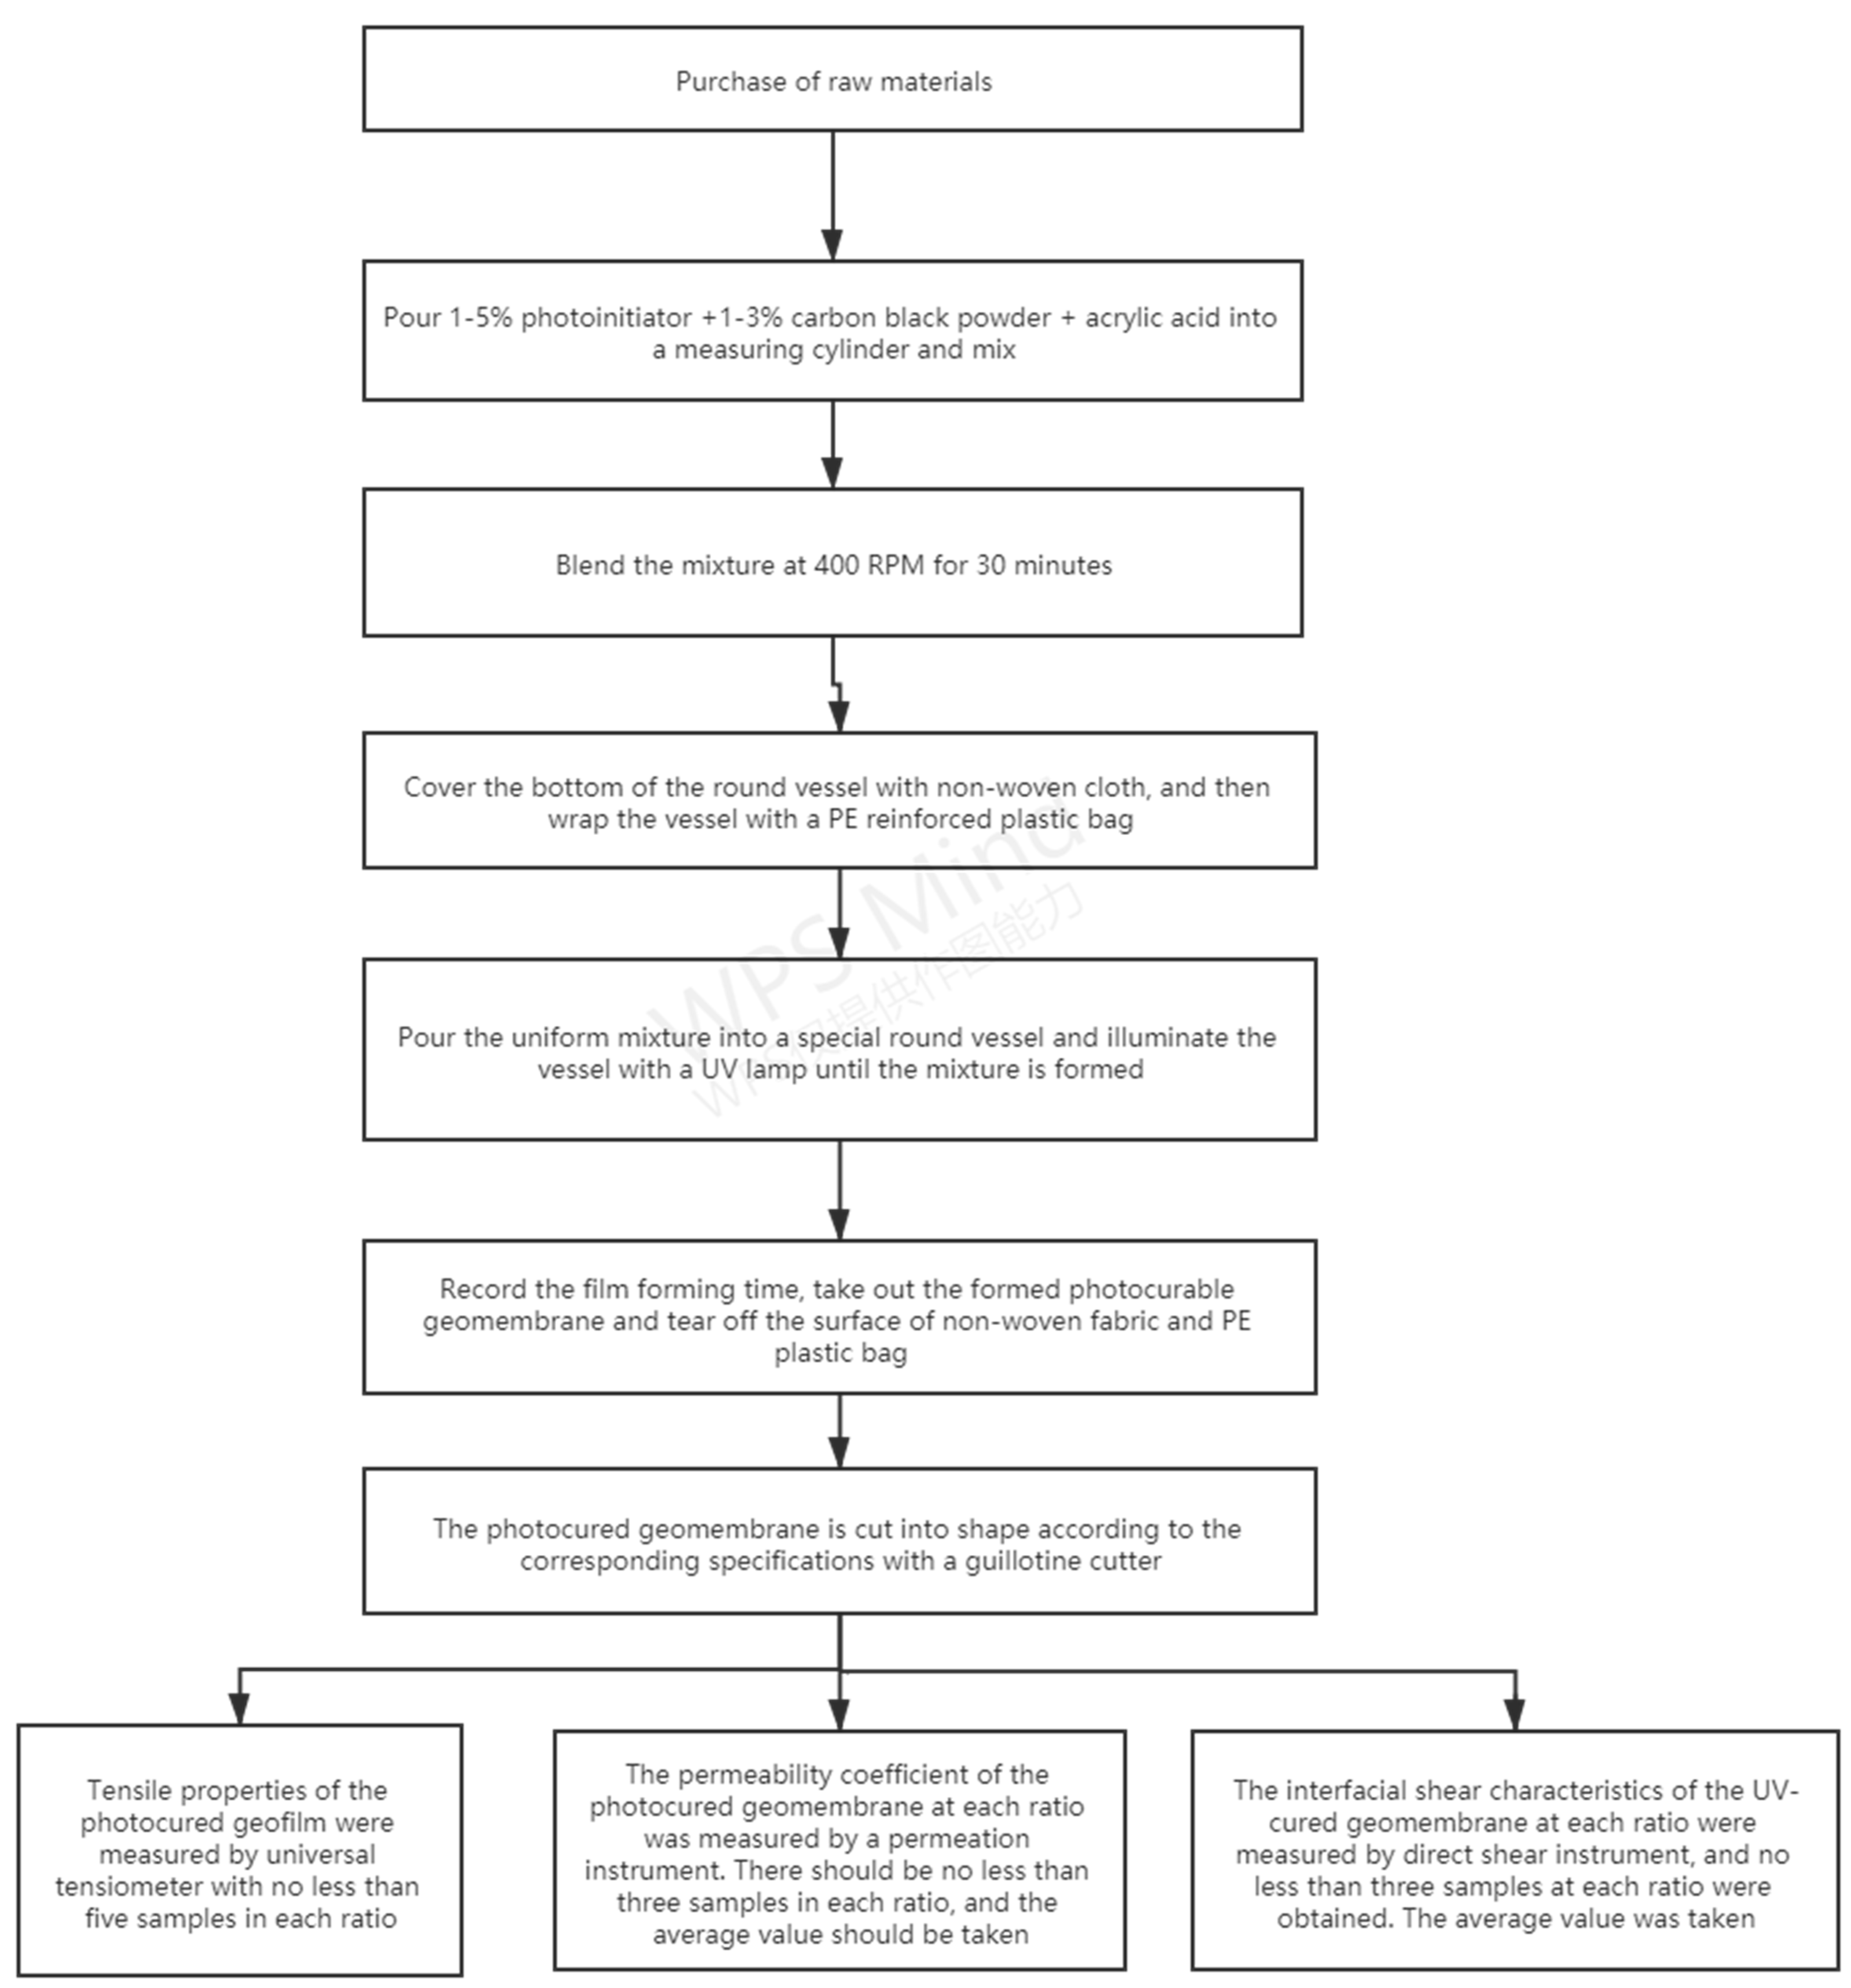
3.2. Material Production Procedure

Photocured geomembrane test ratios can be found in Table 2. The test was performed at room temperature (22 °C) and the procedure was as follows. The acrylic monomers, 1–5% photoinitiator, and 2% carbon black powder were poured into the measuring cylinder and mixed to form a monomer mixture. Then, the mixer was used to stir the mixture at 400 rpm for 30 min to ensure that the mixture fully uniform. The ultraviolet lamp was placed 3 cm away from the special round vessel. In this study, the UV wavelength was used to stimulate the UV curing reaction is 360 nm. It is emitted by a 250 W UV lamp. The mixture was then poured into a special round vessel. The UV lamp was turned on to irradiate the mixed liquid stimulated luminescence curing chain reaction, and the photocured geomembrane is generated after several hours, as shown in Figure 3. The light-cured geomembrane was taken out and the cutter was used to cut it into the desired shape. Then, the direct shear test of geomembrane and filler was directly carried out.

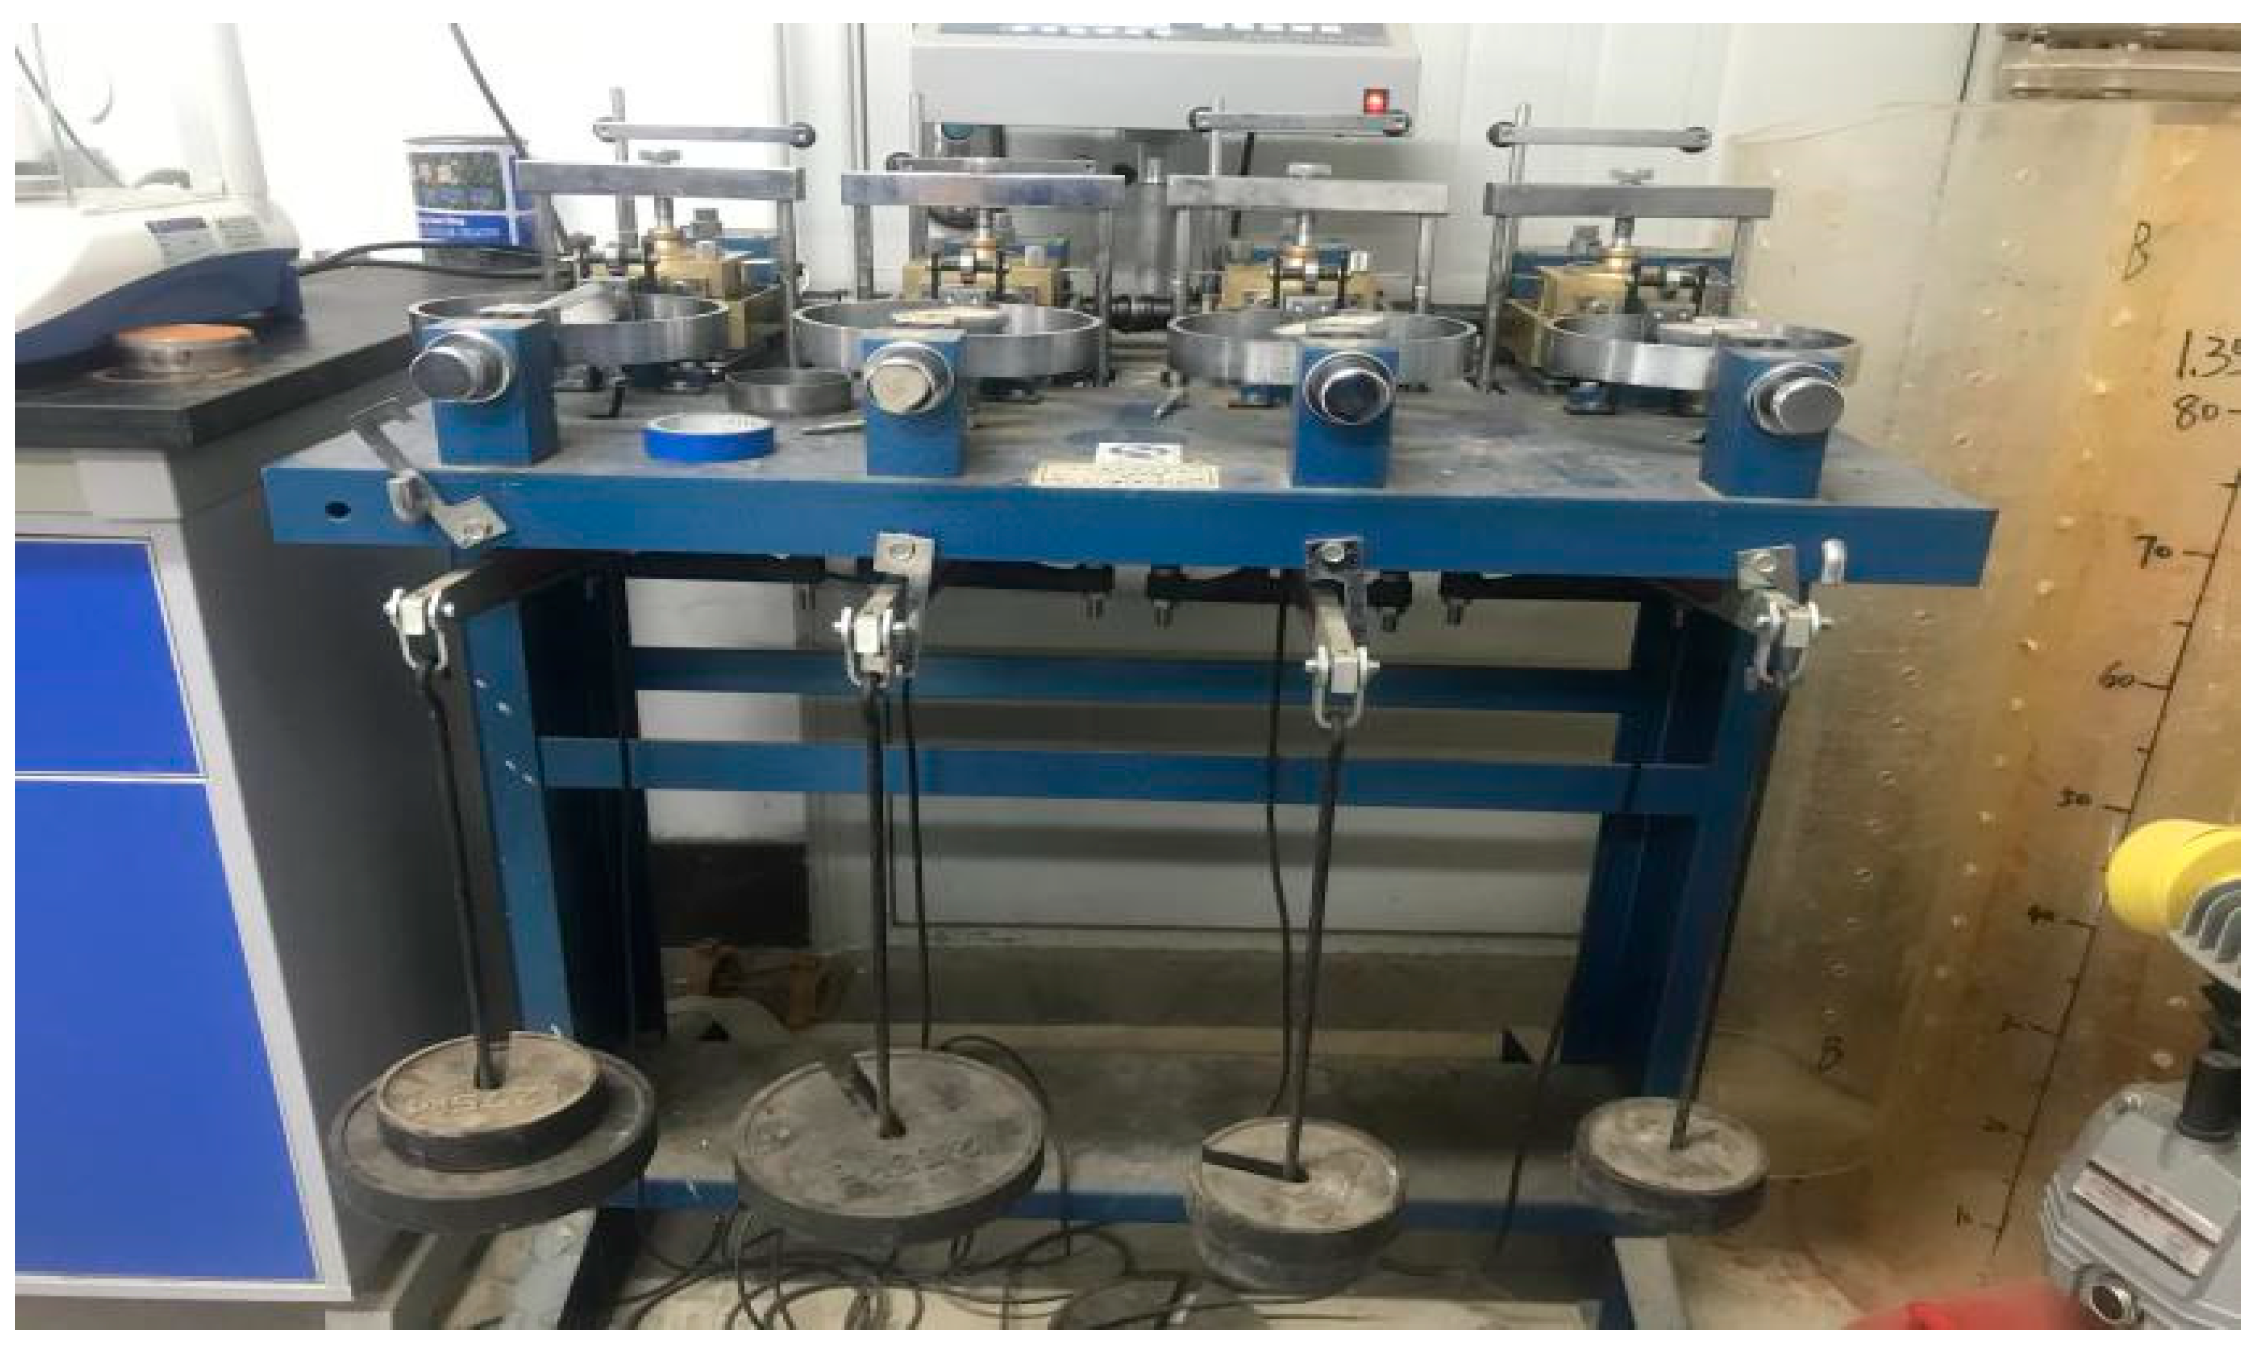
4. Direct Shear Tests

To investigate the effect of photocured geomembranes in practical engineering applications, a series of direct shear tests with different soil materials (sand and clay) and photocured geomembranes were carried out in this study. The photocured geomembrane has a diameter of 300 mm and a thickness of 2 mm. The sand used in this study is in near-dry conditions with a water content of 0.79%. The sand density is 2.69 g/cm3. The coefficient of uniformity (Cu) is 5.2, and the curvature coefficient (Cc) is 1.2. The soil is well-graded sand per the Unified Soil Classification System (USCS). The particle size distribution is shown in Figure 4. The properties of the clay are listed in Table 3.
The test utilized a ZJ-type strain-controlled direct shear apparatus, as shown in Figure 5. The test was carried out per the “Standard for Geotechnical Test Methods” (GBT 50123_2019) [26] and the “Technical Specifications for the Application of Geosynthetics” [27]. The test procedure for the photocured geomembrane-clay is as follows. Before the test, the clay was dried, crushed, ground, and then passed through a set of sieves with the opening from 2 mm (top) to 0.425 mm (bottom), and the required water was added to reach the optimum moisture content and then allowed to stand for three days. During the test, first place a hardwood base with the same height as the lower shear box in the lower shear box. Then, glue the photocured geomembrane to the hardwood base with epoxy resin. The membranes should be flat and free of folds and wrinkles to ensure that the cut surface is the photocured geomembrane–clay interface. Then, weigh 102 g of the clay after standing still, and compact it into three layers. The compaction of each layer of clay is 90%. The test procedure for photocured geomembrane-sand is as follows: During the test, first place a hardwood base with the same height as the lower shear box in the lower shear box, and then glue the photocured geomembrane with epoxy resin. For hardwood bases, the bonded geomembrane should be flat and free of folds and wrinkles to ensure that the cut surface is the photocured geomembrane–sand soil interface. The upper shear box is loaded with sand samples into three layers according to the unified standard and layered and compacted to ensure that the sand body density is 52%.
The production flow chart of geomembrane is shown in Figure 5.
A strain-controlled direct shear test was employed in the study with a rate of 0.8 mm/min. The normal stresses applied were 50 kPa, 100 kPa, 200 kPa, and 300 kPa (Figure 6, from right to left). The test is stopped when the shear displacement reaches 18 mm. The final peak shear stress is reported using the average value from three specimens tested per normal stress applied and specimen composition.

5. Test Results and Analysis

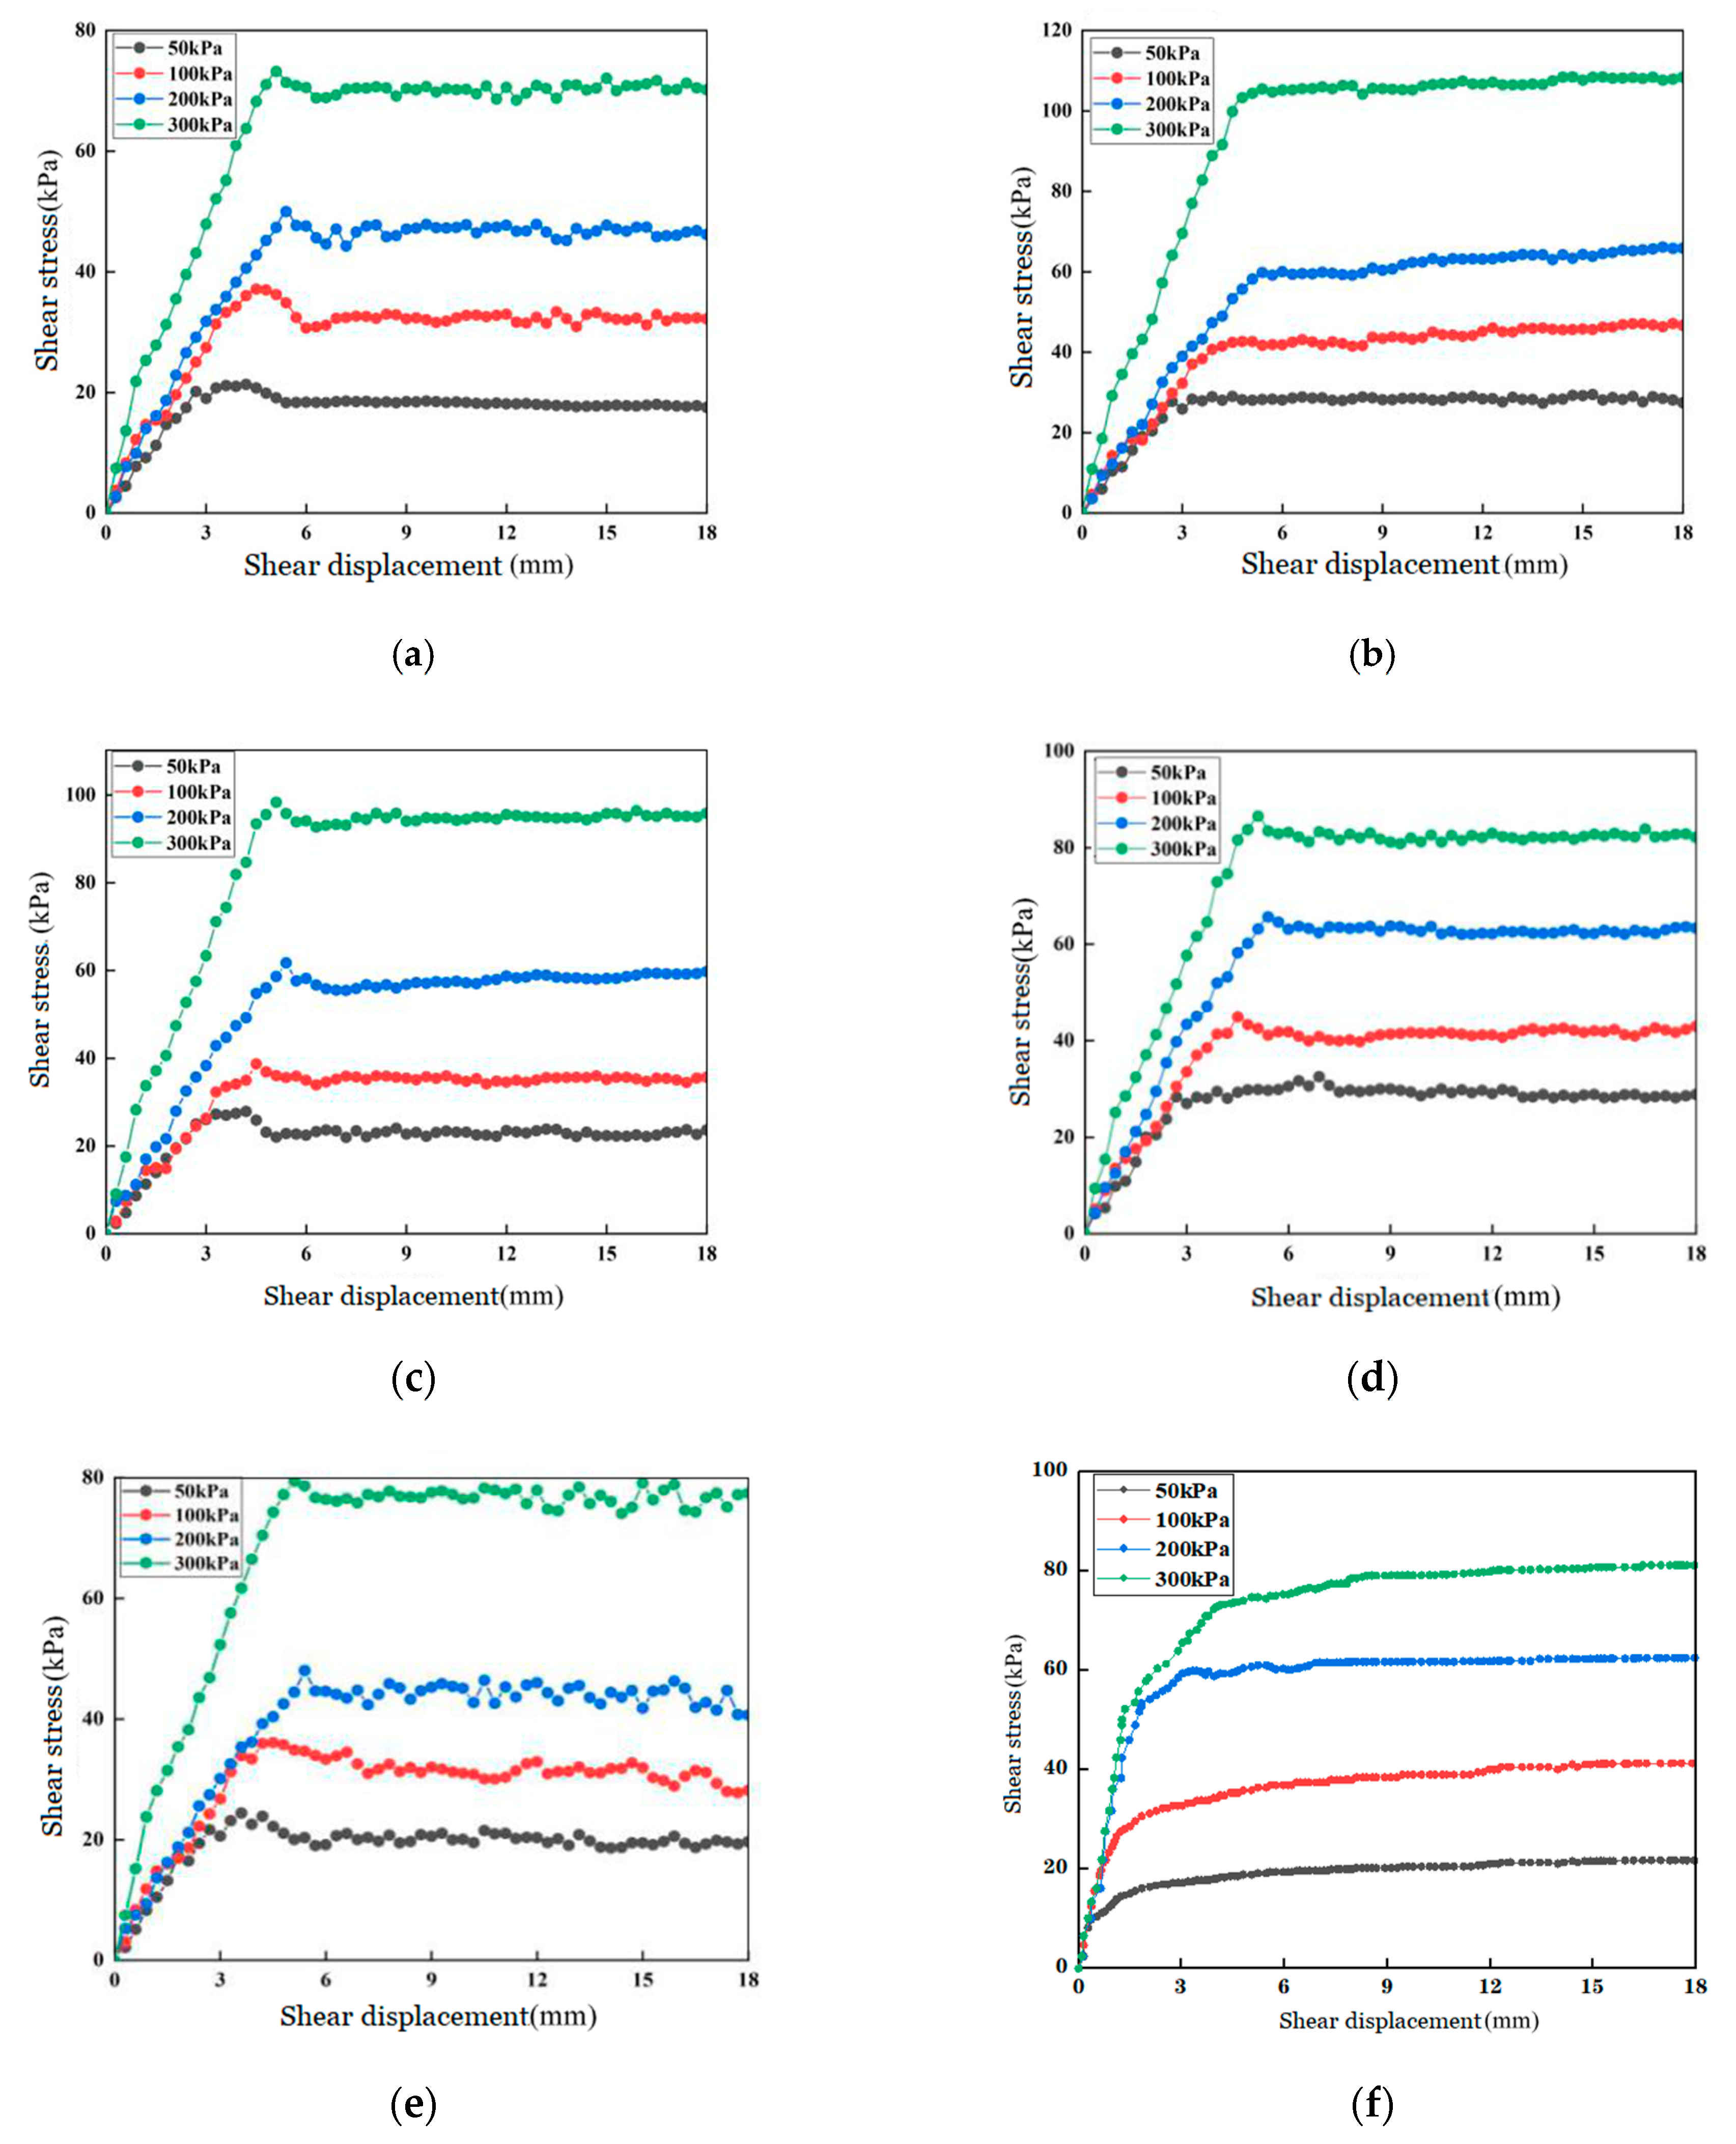
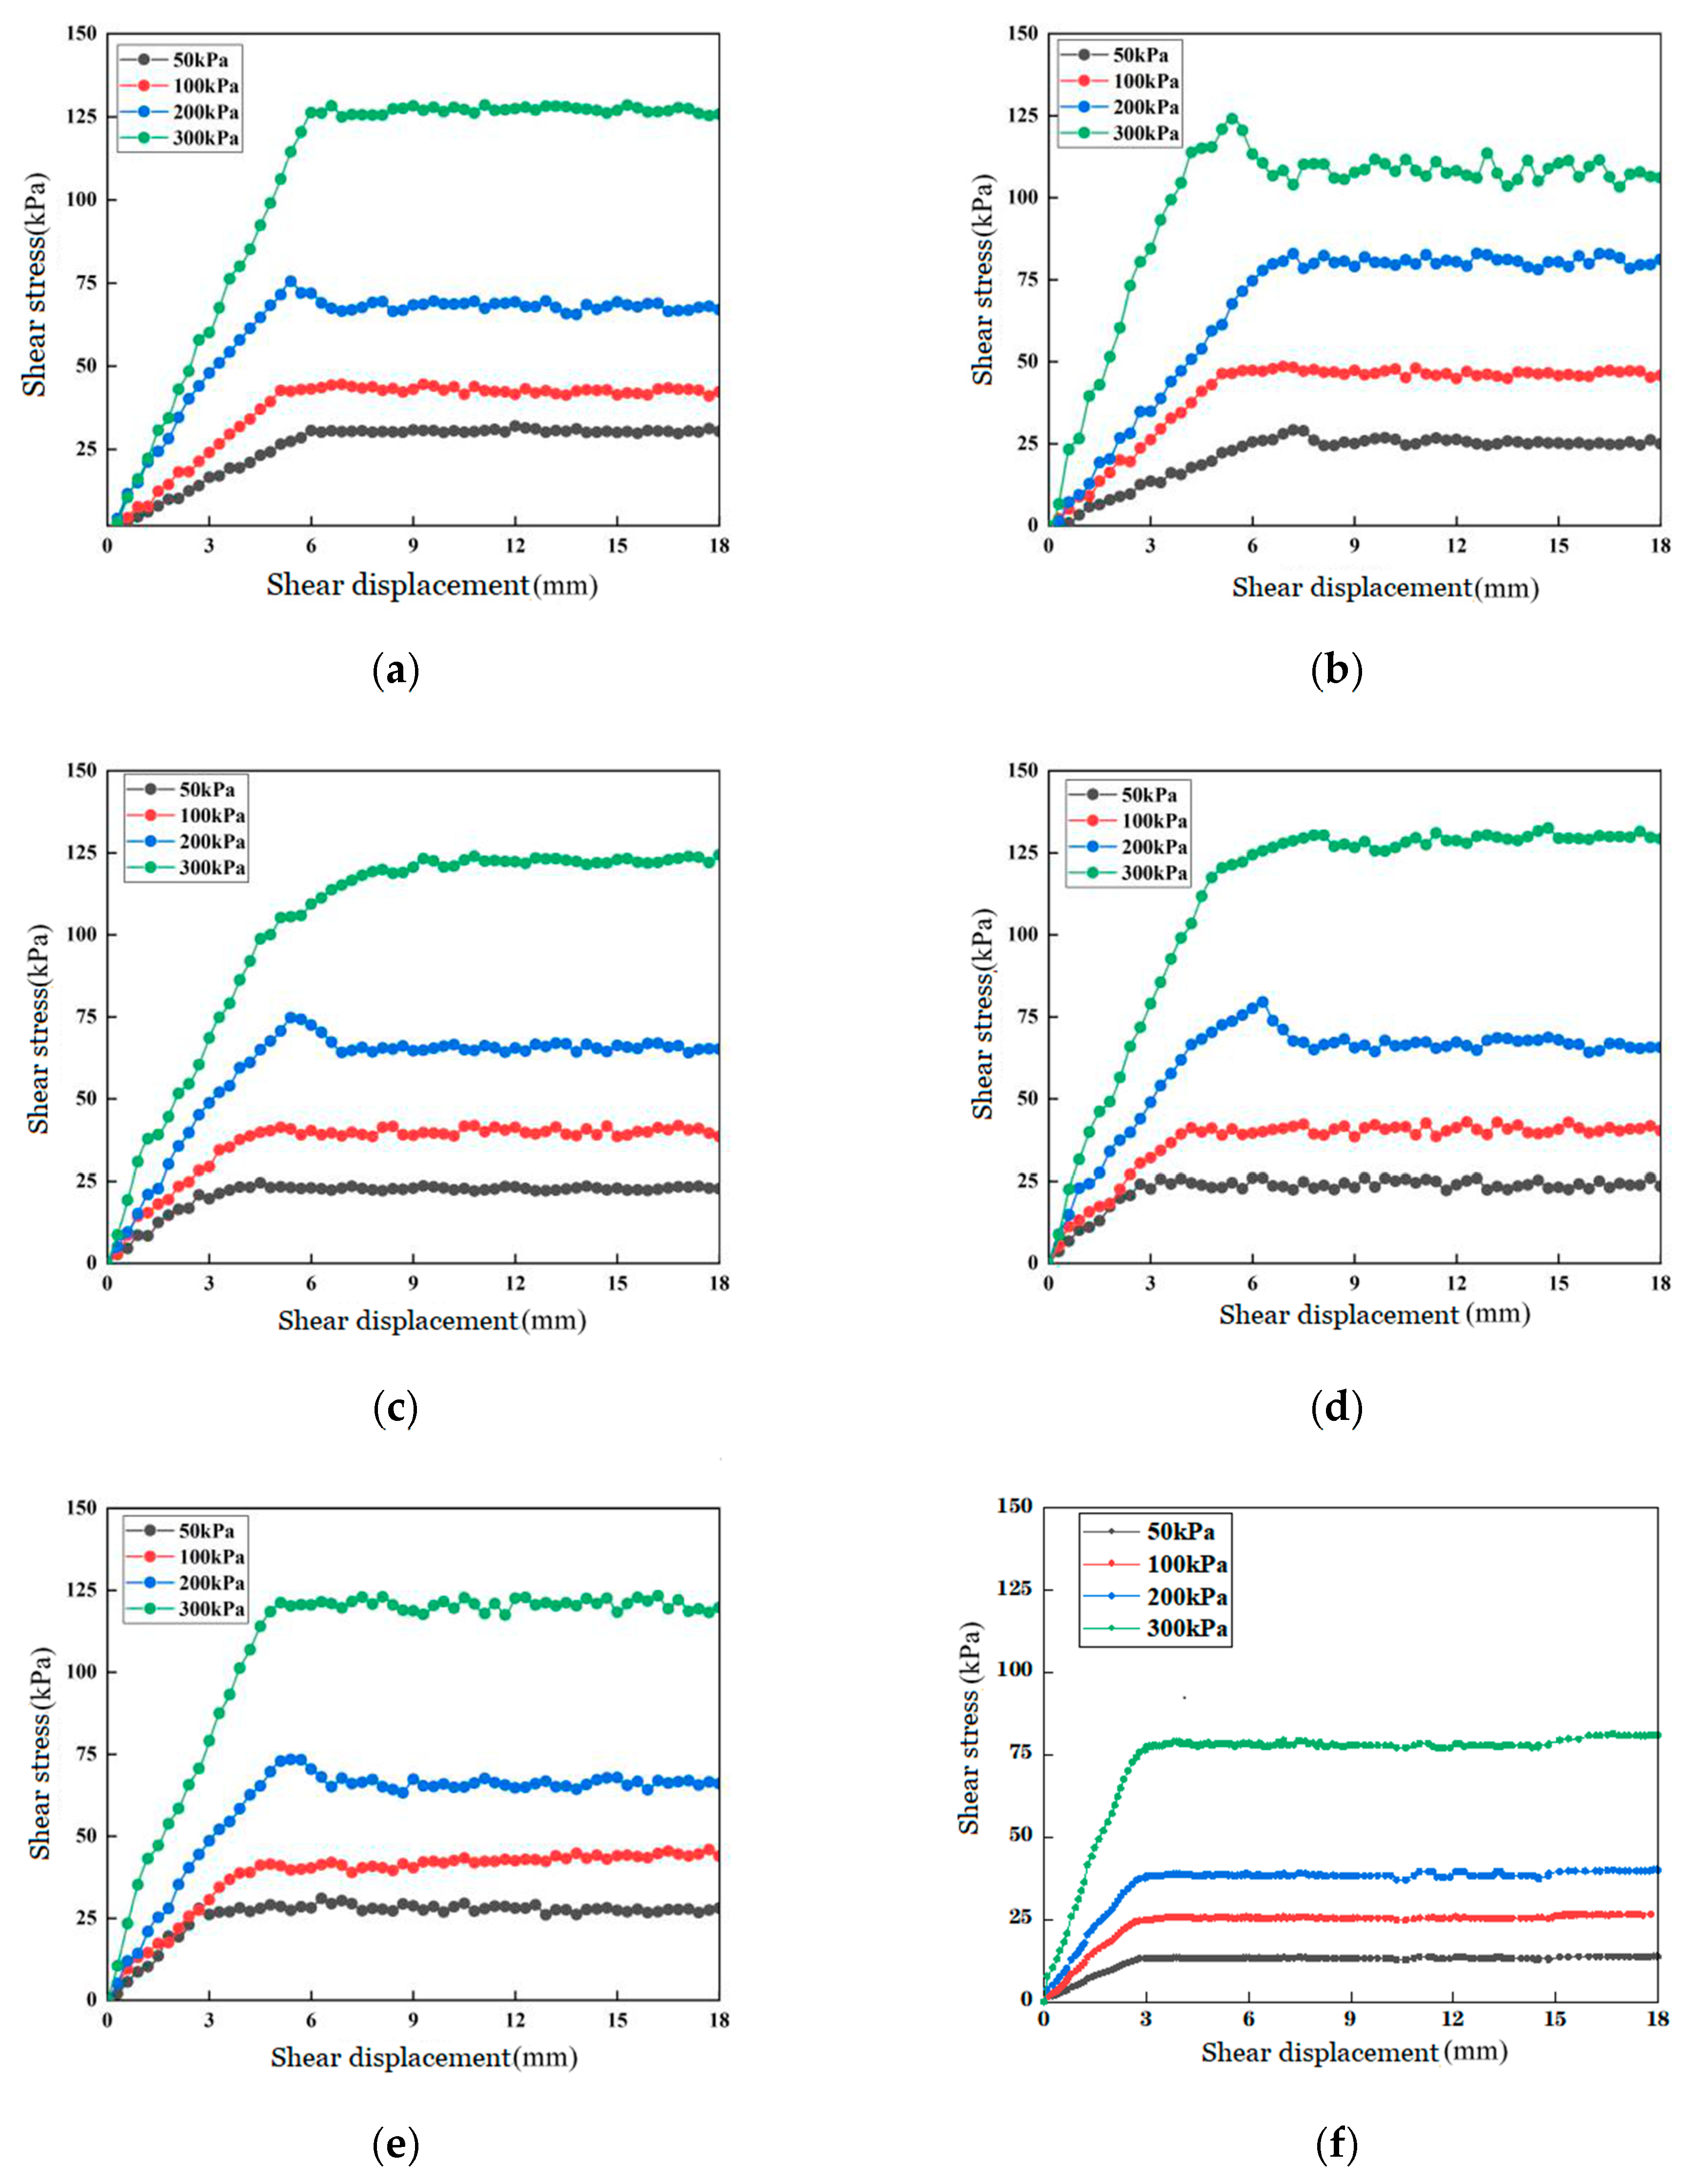
5.1. Measured Shear Stress-Displacement Response

Figure 7 shows the variation of the shear stress–shear displacement response and the peak shear stress with normal stress at the interface between the clay and the photocured geomembrane with different ratios. The shear stress increases rapidly for clay in the range of 0–4 mm shear displacement. Due to the increasing normal stress, the peak shear stress of the 2% photoinitiator geomembrane is the largest and slightly higher than the peak shear stress of the 4% dope level, followed by the 3% and 5% doping levels, and the 1% doping level is relatively the smallest. The shear stress increases gradually with the normal stress. The shear stress–shear displacement curve at the interface between the geomembrane and the clay for 1%, 3%, 4%, and 5% photoinitiator goes through three stages: at the beginning, the interfacial shear stress between the clay and the geomembrane increases rapidly between shear displacement (0–4 mm), then increases approximately linearly to the peak, and a slight non-linear decrease curve showing weak strain weak characteristics is observed; finally, the interface residual shear stress is reached and remains basically constant. The geomembrane–clay interface of 1%, 3%, 4%, and 5% photoinitiator is under the action of normal stress, and a small amount of clay is embedded in the surface of the photocured geomembrane. In the shearing process, the surface layer of the photocured geomembrane is continuously scratched by the clay and penetrates into the interior, and the interfacial shear stress reaches its peak with the increase of the shear displacement. However, with the change in the shear surface, the shear surface changes from the photocured geomembrane–clay interface to the internal shear of the clay. The reason for this is that the clay embedded in the photocured geomembrane is closely combined with the photocured geomembrane. As a result, during the shearing process, the clay embedded in the photocured geomembrane and the clay not embedded in the photocured geomembrane are sheared, and this state will be maintained for a long time. Macroscopically, it shows that the interface shear stress has a non-linear and small decrease, and it basically remains unchanged after reaching the interface residual shear stress.
The shear stress–shear displacement curve of the 2% photoinitiator geomembrane and clay interface shown in Figure 7 has gone through two stages: the curve first increases linearly to the peak value of the interface shear stress and then remains basically unchanged. The curve shows strong characteristics of the strain. The reason for this is that the geomembrane with the 2% photoinitiator is harder, and the clay particles slide and rub on the surface of the geomembrane during the shearing process under the action of lower normal stress. As the normal stress increases, clay particles are dented the geomembrane on the surface of the geomembrane. Under the action of normal stress, the clay particles have both sliding and scratching effects on the surface of the geomembrane, which causes the friction at the interface to increase. When the normal stress continues to increase, the clay particles become more deeply embedded into the geomembrane, resulting in deeper scratches on the surface of the geomembrane. The deeper the scratch on the geomembrane, the rougher the surface of the geomembrane. The clay and the geomembrane are interlocked under the action of the normal stress. The geomembrane acts as a reinforced clay, and its shear stress is significantly increased. This clay and geomembrane plowing phenomenon is consistent with the phenomenon of particle plowing in smooth geomembranes observed when the micro-geomembrane interacts with granular materials, as studied by David Frost [28]. The compaction of the clay and the smooth geomembrane becomes higher and higher under the action of high normal stress. Due to the smooth contact between the clay and the geomembrane, the pore water pressure will decrease with the increase in displacement, and the formation of negative pore water pressure will increase the effective stress. This is one of the phenomena of shear resistance on the contact surface of the clay and the smooth geomembrane. Therefore, as the normal stress increases, the contact surface of the clay and the geomembrane is continuously ploughed and compacted. The resulting shear stress is significantly greater than the shear stress of pure clay.
Figure 7 shows the shear stress–shear displacement response of the different ratios of the photocured geomembranes–sand interface. The peak shear stress varies with the normal stress. It can be seen that Figure 7 and Figure 8 have similar trends. As the normal stress continues to increase, the shear stress also increases. Under the continuous displacement, the shear stress gradually becomes a constant state after reaching the peak. Under normal stress at the sand–geomembrane interface, the sliding of sand particles on the contact surface of the geomembrane is the main shear mechanism of the smooth geomembrane [29]. The peak shear stress at the interface between the sand and the geomembrane is higher than that of pure sand at lower stresses (50 kPa and 100 kPa). This shows that the geomembrane and the sand have a stronger restraint effect, and the geomembrane and the sand particles are correspondingly compressed and compacted, which increases the friction at the interface and leads to a larger shear stress peak. With the increasing normal stress, the plowing effect occurs at the interface between sand particles and geomembrane. Under the action of higher normal stress (200 Pa and 300 kPa), the sand particles make deeper scratching and plowing on the surface of the geomembrane. As the normal stress increases, the related interface structure is rearranged, which leads to the densification of the sand on the interface. After the peak stress is reached, since there is no obvious relative movement, the shear stress of the entire shear test remains constant. The residual interfacial friction increases due to the wear mechanism that produces deep scratches. The increase in normal stress leads to larger scratches, so the sand particles will plow together with the geomembrane during the shearing process.
As can be seen from Figure 8, the geomembrane–sand interface with a 4% photoinitiator shows strain hardening at the curve at a normal stress of 300 kPa. The reason for this is that the geomembrane with a 4% photoinitiator has a large amount of friction with the sand, and the surface of the geomembrane is ploughed and worn due to the large normal stress. The dislocation of the sand–geomembrane interface weakens its bite force and anchoring force to the sand and weakens the frictional resistance of the interface with the sand. The shear stress of the shear surface of pure sand mainly depends on the friction between the sands. In addition to the friction between the soil and the surface of the soil and the reinforcement, the shear force on the reinforced composite’s shear surface is also affected by the bite force between the soil and the reinforcement. This bite force increases with the vertical load.

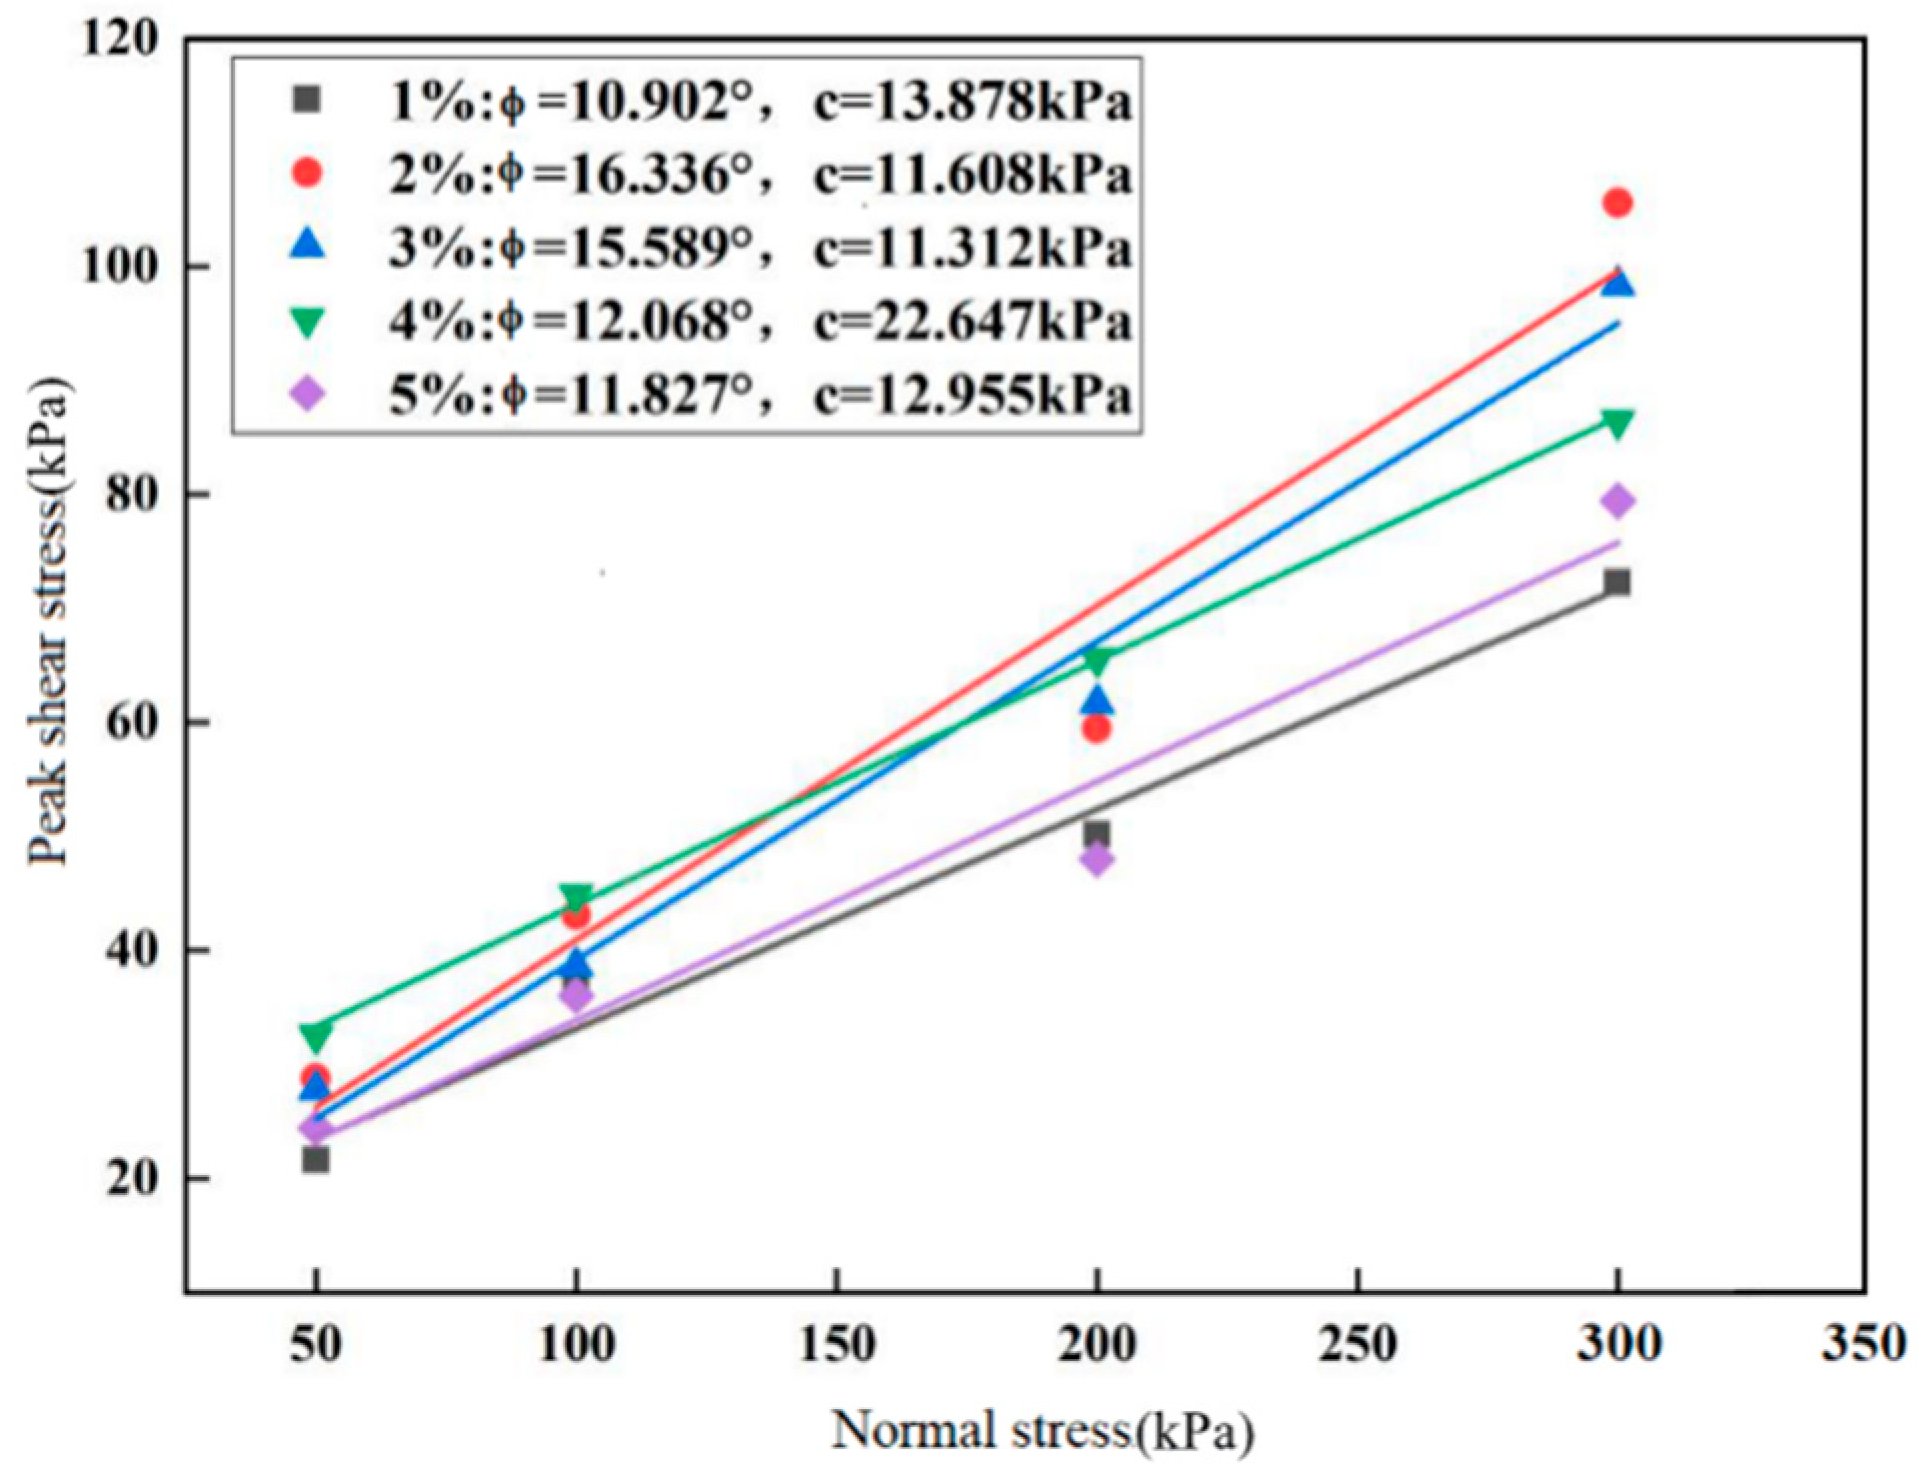
5.2. Interface Shear Stress Peak Analysis

As can be seen from Figure 7 and Figure 8, the shear strength of the photocured geomembranes with different photoinitiator contents in contact with clay and sand is linearly related to the normal stress, in accordance with the Coulomb shear criterion in geotechnics.
Figure 8 shows that when the normal stress gradually increases, the interfacial shear strength of the clay and the 2% photoinitiator content of the photocured geomembrane increases as the normal stress increases. The reason is that under the action of normal stress, the photocured geomembrane with 2% photoinitiator content has a strong restraint and compaction effect with clay particles or soil-like particles. In the shearing process, the surface of the geomembrane is constantly scratched, making the surface rough and causing the friction coefficient to increase. Under the conditions of high normal stress (200 kPa and 300 kPa), the friction between the clay and the geomembrane surface is fully utilized during the shearing process. Under greater normal stress, the interfacial shear strength of the geomembrane with a 2% photoinitiator is higher than that of the other photoinitiator content, and the shear strength and tensile properties of the geomembrane with a 2% photoinitiator are also improved.
The fitting line of the photocured geomembrane–clay interface is shown in Figure 9, in accordance with the Mohr–Coulomb failure envelope. The shear strength parameters of clay and clay/photocured geomembrane samples indicate that the addition of photocured geomembrane will slightly reduce the external friction angle and increase the cohesion of the clay. The overall effect of the photocured geomembrane reinforcement is to increase the shear strength of the clay. The increase in the shear strength shows an increase with the increasing normal stress. In the shear test of the clay and photocured geomembrane, there was no interlocking of particles, and no swelling was observed, subsequently. When the photoinitiator content is 2%, the obtained shear strength parameters are significantly greater than the shear strength parameters of pure clay. When the photoinitiator content is 2% and 3%, the shear strength parameters gradually increase with the increase of normal stress and are significantly greater than the shear strength parameters of other photoinitiator content. In addition, 1% and 5% of the photoinitiator content of the cured geomembrane is basically the same in shear strength parameters, and the interface reinforcement effect is lower than other content of photocured geomembrane.
Figure 9 shows that under the action of lower normal stress (50 kPa and 100 kPa), the friction and shear stress of the photocured geomembrane and the sandy soil interface are very similar with the photoinitiator content of 1 to 5%. Under the action of higher normal stress (200 kPa and 300 kPa), a 4% photoinitiator content photocured geomembrane produced more scratches, in accordance with the Mohr–Coulomb failure envelope. As the sand particles and the geomembrane shear each other to produce scratches and the sand particles plow the surface of the geomembrane, the friction on the surface of the geomembrane is increased, and a greater shear force is required to shear the surface of the geomembrane and cause the sand particles to slide and generate displacement. In the process of increasing normal stress, the interfacial shear strength of sand and 4% photoinitiator content photocured geomembrane is significantly higher than others.
Figure 10 shows the shear strength parameters of the interface between the sand and the photocured geomembrane. The addition of photocured geomembrane caused a significant increase in internal friction angle and cohesion. The shear interface of the photocured geomembrane-reinforced sand obviously increases the shear strength of the sand. The increase in the shear strength of the sand shows an increase with the increase of the normal stress. The results show that adding photocured geomembrane at the interface of sand can significantly improve the shear strength of sand. With the increase of the photoinitiator content in the photocured geomembrane, this reinforcement effect is obviously enhanced. The shear stress increased significantly in the early stages of the test and the samples exhibited hardening behavior. The increase in shear stress then continues to gradually reach a maximum, and the shear displacement is between 2 and 5 mm, depending on the photoinitiator content. At the same time, when the photoinitiator content is 4%, as the normal stress further increases, the photocured geomembrane–sand soil exhibits an obvious maximum shear stress, and their maximum and ultimate shear strengths are consistent, showing plastic behavior.
The shear strength of a geomembrane at the interface with clay/sand is determined by the friction angle and cohesion. In the study, the cohesion at the interface between the geomembrane and clay/sand was influenced by the size of the photoinitiator content. From the above comparison, it is clear that there is a clear relationship between the cohesion at the interface between the clay or sand and the photocured geomembrane depending on the photoinitiator content. A 2% photoinitiator content of the photocured geomembrane–clay interface and a 4% photoinitiator content of the photocured geomembrane–sand contact surface has a higher friction angle, which is the main reason for its higher shear strength compared to the other specimens. As the geomembrane–clay interface is subjected to higher normal stresses (generated by the solid waste and cover system) in practical engineering, it is reasonable to choose a 2% photoinitiator geomembrane as the impermeable layer. In the drainage and impermeable layers of landfills, the geomembrane–sand interface is subject to higher normal stresses (generated by solid waste and the cover system) and it is reasonable to choose a 4% photoinitiator geomembrane; in the capping system, the geomembrane–sand interface is subject to lower normal stresses (generated by vegetation) and it is reasonable to choose a 5% photoinitiator geomembrane.

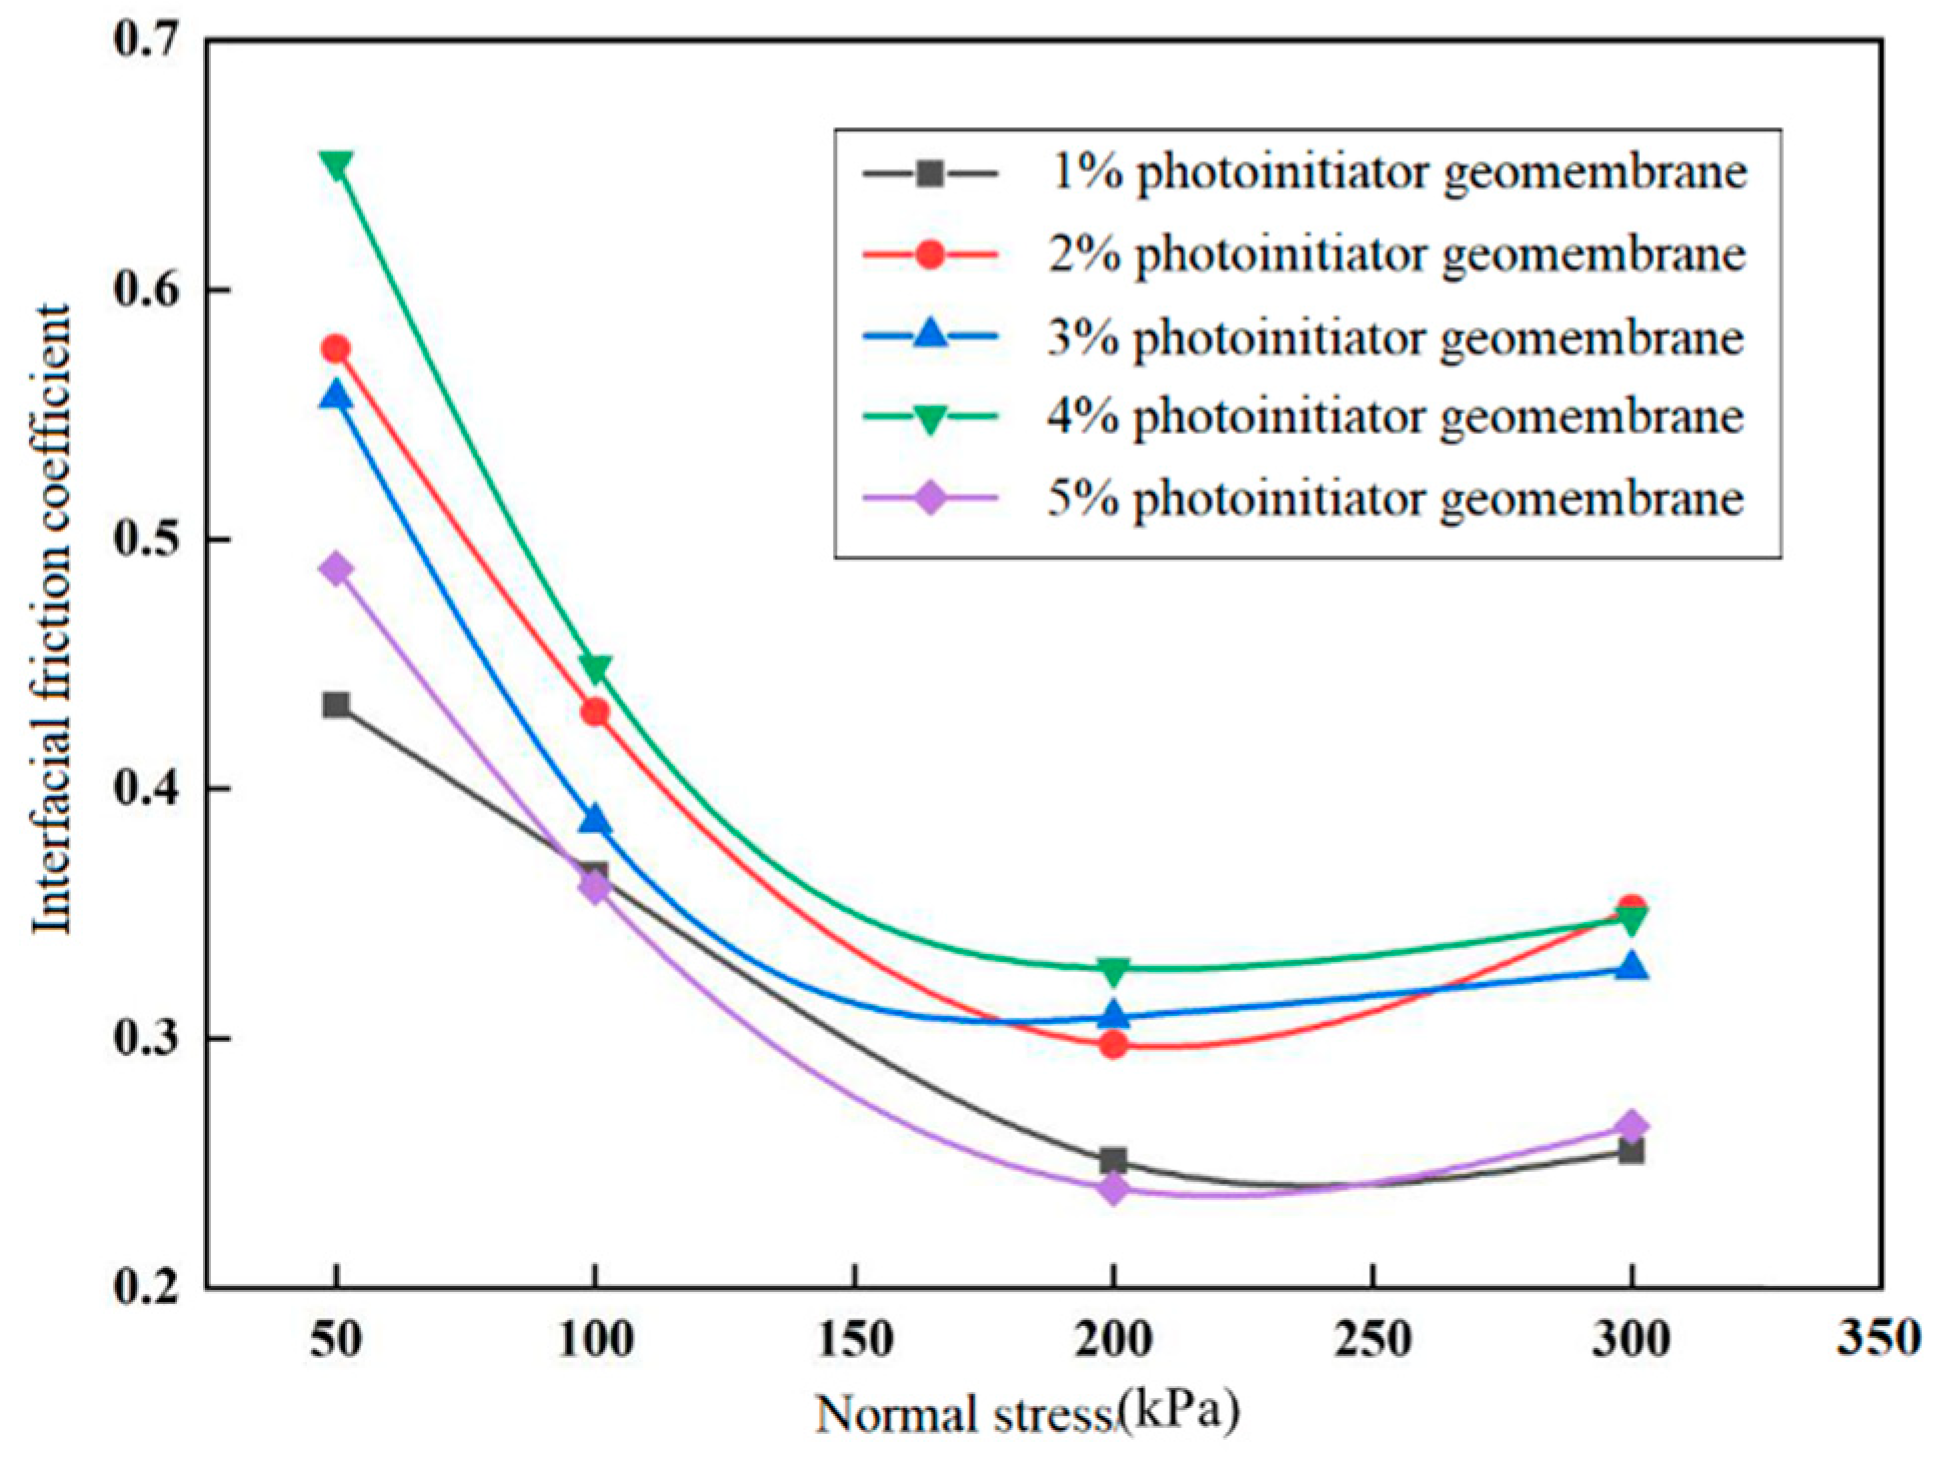
5.3. Interfacial Friction Coefficient

The interfacial shear strength coefficient f of the reinforcement–soil interface is an important parameter for the engineering design of reinforced soil, and its value is generally the ratio of the maximum shear stress τmax under stress in different directions to the corresponding normal stress σn, as shown in formula (1):
f =   τ m a x   σ n
The interfacial shear strength coefficient α is used to quantitatively compare the interfacial shear strength of soil and geosynthetic materials. The interfacial shear strength coefficient α is the ratio of the shear strength of the soil/geomembrane material to the internal shear strength of the soil as follows:
α = ( τ s o i l / g e o m e m b r a n e ) ( τ s o i l )      
where α denotes the interfacial friction strength coefficient, τsoil/geomembrane denotes the shear strength values of different reinforced materials in direct shear tests, τsoil denotes the shear strength values of the internal soil in direct shear test, τ = σtanφ,σ denotes the normal positive stress, and φ denotes the angle of internal friction.
Figure 11 and Figure 12 depict the friction coefficients for different scales of photocured geomembranes at the interface with two different materials. The peak friction coefficient increases with increasing normal stress as can be seen in Figure 11 and Figure 12. When the critical normal stress is reached, the contact stress between the particles reaches the yield pressure of the material. A further increase in normal stress will lead to plowing of the material and provide a higher interface shear resistance, resulting in an increase in the interfacial friction coefficient. As shown in Figure 11, the shear strength coefficient of most clay/photocured geomembranes at different content of photoinitiator geomembrane is less than one. The interfacial friction between the soil and geomembrane is smaller than the friction inside the soil. This means that the shear strength of the interface between the soil and the photocured geomembrane is less than that of the soil. It shows that when the direct shear mode is concerned, the photocured geomembrane–soil contact interface is a potential sliding interface.
Table 4 shows that as the photoinitiator content increases, the shear strength coefficients at the sand–soil specimen interface are all greater than one. The upward trend in the friction coefficient of the critical normal stress represents the major plowing that occurs due to the contact stresses of each particle exceeding the yield pressure of the geomembrane. During the interfacial shearing process, under low normal stress, the position of each sand particle is prone to change, and the dilatancy is obvious. Below the critical normal stress, the shearing mechanism is sliding. After the critical normal stress is exceeded, the shearing mechanism changes to sliding and plowing. The coefficient of friction at the interface between the 2% photoinitiator geomembrane and the sand decreases with increasing normal stress. This is due to the hard surface of the 2% photoinitiator geomembrane. The sand is shallowly embedded in the geomembrane at a normal stress of 300 kPa and does not continuously plough the geomembrane surface, and the high normal stress limits the tumbling and sliding of the sand particles. This weakens the shear expansion of the photocured geomembrane–sand interface. However, the tendency of the interface friction coefficient to decrease slows down with increasing normal stress, and it can be expected that at higher normal stresses (>300 kPa) the interface friction coefficient will increase with increasing normal stress. These results clearly reveal the importance of the critical normal stress to the shear mechanism of the sand–geomembrane interface, the boundary between the dominant sliding and the dominant plowing, and the corresponding friction angle changes. The magnitude of the critical normal stress depends on the relative properties of the particles and the continuum material.

6. Conclusions

In this paper, the direct shear test was implemented to explore the shear characteristics of the photocured geomembrane–clay/sand interface with different proportions. The interface shear force shear displacement curve, the peak value of the interface shear stress, and the friction coefficient of the interface shear strength of the photocured geomembrane-clay/sand with different proportions are analyzed. Some main conclusions can be drawn as follows:
(1).
For the photocured geomembrane –clay interface, the interface shear stress peak of the geomembrane with a 4% photoinitiator is the largest under the normal stress of 50 kPa. Under the normal stress of 300 kPa, the peak value of the interfacial shear stress of the geomembrane with a 2% photoinitiator is the largest. In the anti-seepage system, it is more reasonable to choose a geomembrane with a 2% photoinitiator.
(2).
For the photocured geomembrane–sand soil interface, the interface shear stress peak value of the geomembrane with a 5% photoinitiator is the largest under the normal stress of 50 kPa. Under the normal stress of 300 kPa, the peak value of the interfacial shear stress of the geomembrane with a 4% photoinitiator is the largest. At the boundary between the drainage layer and the anti-seepage layer of the landfill, it is more reasonable to choose a 4% photoinitiator geomembrane. In the capping system, it is preferable to choose a 5% photoinitiator geomembrane.
(3).
For the photocured geomembrane–clay/sand interface, the interface friction coefficient shows a trend of first increasing and then decreasing with the increase of normal stress. When the normal stress reaches the critical normal stress, the interface friction coefficient will increase slowly. For the photocured geomembrane–sand soil interface, the geomembrane interface of 2% photoinitiator shows a trend that the interface friction coefficient decreases with the increase of normal stress. The photot-cured geomembranes of other ratios all show a trend of first increasing and then decreasing with the increase of normal stress.
(4).
The shear strength of the interface between photocured geomembrane and clay/sand is mainly determined by the interface friction angle. The friction angle of photocured geomembrane–sand soil is larger than photocured geomembrane–clay. Therefore, the interface between the photocured geomembrane and sand has better shear resistance and tensile crack resistance.

Supplementary Materials

The following are available online at https://www.mdpi.com/article/10.3390/su13158201/s1.

Author Contributions

Conceptualization, L.L.; methodology, H.Y.; software, H.Y.; validation, formal analysis, investigation, H.Y.; writing—review and editing, H.X.; writing—review and editing, W.L.; writing—review and editing, Z.G. All authors have read and agreed to the published version of the manuscript.

Funding

This research was funded by National Natural Science Foundation of China (No. 51778217), the Hubei Central Special Fund for Local Science and Technology Development (No. 2019ZYYD053), the Science, Technology Planning Project Wuhan (No. 2020020601012278), and the Innovative Group Project of Hubei Province (No. 2020CFA046).

Institutional Review Board Statement

Not applicable.

Informed Consent Statement

Not applicable.

Data Availability Statement

The data presented in this study are available in Supplementary Materials.

Acknowledgments

The authors are thankful for the financial support from that National Natural Science Foundation of China (No. 51778217), the Hubei Central Special Fund for Local Science and Technology Development (No. 2019ZYYD053), the Science, Technology Planning Project Wuhan (No. 2020020601012278), and the Innovative Group Project of Hubei Province (No. 2020CFA046).

Conflicts of Interest

The authors declare no conflict of interest.

References

  1. Zhao, W. Geosynthetics; Machinery Industry Press: Beijing, China, 2005. (In Chinese) [Google Scholar]
  2. Chao, X.; Haofeng, X. Geosynthetics, 1st ed.; Machinery Industry Press: Beijing, China, 2010. (In Chinese) [Google Scholar]
  3. Anonymous. Research and Markets: A Guide to Polymeric Geomembranes: A Practical Approach Offers an Informed Overview of the Developments in the Field. M2 PressWIRE 2009, 158, 260–265. [Google Scholar]
  4. Ingold, T.S. Geosynthetics: Applications, design and construction proceedings of the first European geosynthetics conference-EUROGEO 1. Geotext. Geomembr. 1996, 14, 13–18. [Google Scholar] [CrossRef]
  5. Stansbury, J.W.; Dickens, S.H. Determination of double bond conversion in dental resins by near infrared spectroscopy. Dent. Mater. 2001, 17, 71–79. [Google Scholar] [CrossRef]
  6. Arica, Y.; Hasirci, V.N. Immobilization of glucose oxidase in poly(2–hydroxyethyl methacrylate) membranes. Biomaterials 1987, 8, 489–495. [Google Scholar] [CrossRef]
  7. Arica, M.Y.; Denizli, A.; Salih, B.; Piskin, E.; Hasirc, V. Catalase adsorption onto Cibacron Blue F3GA and Fe(III)-derivatized poly(hydroxyethyl methacrylate) membranes and application to a continuous system. J. Membr. Sci. 1997, 129, 65–76. [Google Scholar] [CrossRef]
  8. Fleming, I.R.; Sharma, J.S.; Jogi, M.B. Shear strength of geomembrane–soil interface under unsaturated conditions-ScienceDirect. Geotext. Geomembr. 2006, 24, 274–284. [Google Scholar] [CrossRef]
  9. Punetha, P.; Mohanty, P.; Samanta, M. Microstructural investigation on mechanical behavior of soil-geosynthetic interface in direct shear test. Geotext. Geomembr. 2017, 45, 197–210. [Google Scholar] [CrossRef]
  10. Feng, S.J.; Liu, X.; Chen, H.X.; Zhao, T. Micro-mechanical analysis of geomembrane-sand interactions using DEM. Comput. Geotech. 2017, 94, 58–71. [Google Scholar] [CrossRef]
  11. Junli, G.; Mengxi, Z.; Wenjie, Z. Interface property between sand and reinforced geomembrane. Rock Soil Mech. 2011, 32, 3225–3230. (In Chinese) [Google Scholar]
  12. Cen, W.J.; Bauer, E.; Wen, L.S.; Wang, H.; Sun, Y.J. Experimental investigations and constitutive modeling of cyclic interface shearing between HDPE geomembrane and sandy gravel. Geotext. Geomembr. 2019, 47, 269–279. [Google Scholar] [CrossRef]
  13. Rowe, R.K.; Yu, Y. Magnitude and significance of tensile strains in geomembrane landfill liners. Geotext. Geomembr. 2019, 47, 439–458. [Google Scholar] [CrossRef]
  14. Izgin, M.; Wasti, Y. Geomembrane-sand interface frictional properties as determined by inclined board and shear box tests. Geotext. Geomembr. 1998, 16, 207–219. [Google Scholar] [CrossRef]
  15. Gao, J.L.; Zhang, M.X.; Zhang, W.J. Interface frictional property between sand and geomembrane. In Advance Environment Geotechnics; Springer: Berlin/Heidelberg, Germany, 2010; pp. 822–827. [Google Scholar] [CrossRef]
  16. Koerner, R. Designing with Geosynthetics; Xlibris Corporation: Bloomington, IN, USA, 2012. [Google Scholar]
  17. Ling, H.I.; Pamuk, A.; Dechasakulsom, M.; Mohri, Y.; Burke, C. Interactions between PVC Geomembranes and Compacted Clays. J. Geotech. Geoenviron. Eng. 2001, 127, 950–954. [Google Scholar] [CrossRef]
  18. Gao, J.L.; Zhang, M.X.; Zhang, W.J. Interface Frictional Property Between Sand and Geomembrane. In Proceedings of the International Symposium on Geoenvironmental Engineering, Shanghai, China, 8–10 September 2009. [Google Scholar]
  19. Abramova, N.; Ipatov, A.; Levichev, S.; Bratov, A. Integrated multi-sensor chip with photocured polymer membranes containing copolymerised plasticizer for direct pH, potassium, sodium and chloride ions determination in blood serum. Talanta 2009, 79, 984–989. [Google Scholar] [CrossRef] [PubMed]
  20. Yuhai, X.; Schilling, C.; Arora, N.; Boydston, A.J.; Rudykh, S. Mechanical characterization and constitutive modeling of visco-hyperelasticity of photocured polymers. Addit. Manuf. 2020, 36, 101511. [Google Scholar] [CrossRef]
  21. Kim, M.; Song, C.; Han, D.K.; Ahn, K.D.; Hwang, S.S.; Ahn, D.J.; Kim, M.H. Allylimidazolium salt based antibacterial polymer coatings produced by thiol–ene photo-curing. React. React. 2015, 87, 53–60. [Google Scholar] [CrossRef]
  22. Mathias, L.J.; Kusefoglu, S.H.; Kress, A.O.; Lee, S.; Geiger, C.C. Multifunctional acrylate monomers, dimers and oligomers: Applications from contact lenses to wood, olymer composites. Macromol. Symp. 1991, 51, 153–167. [Google Scholar] [CrossRef]
  23. Shukla, S.R.; Athalye, A.R. Graft-copolymerization of glycidyl methacrylate onto cotton cellulose. J. Appl. Polym. Sci. 1994, 54, 279–288. [Google Scholar] [CrossRef]
  24. ASTM. Standard Test Method for Index Puncture Resistance of Geomembranes and Related Products; American Society for Testing and Materials: Philadelphia, PA, USA, 2013. [Google Scholar]
  25. ASTM. Standard Test Method for Tearing Strength of Fabrics by Falling-Pendulum (Elmendorf-Type) Apparatus; American Society for Testing and Materials: Philadelphia, PA, USA, 2009. [Google Scholar]
  26. Ministry of Housing and Urban-Rural Development of the People’s Republic of China. GB/T50123–2019 Standard for Geotechnical Test Methods; China Planning Press: Beijing, China, 2019. (In Chinese) [Google Scholar]
  27. Ministry of Housing and Urban-Rural Development of the People’s Republic of China. GB/T50290–2014 Technical Specifications for the Application of Geosynthetic Materials; China Planning Press: Beijing, China, 2014. (In Chinese) [Google Scholar]
  28. Frost, J.D.; Kim, D.; Lee, S.W. Microscale geomembrane-granular material interactions. J. Mater. Civ. Eng. 2011, 16, 79–92. [Google Scholar] [CrossRef]
  29. Frost, J.D.; Dove, J.E. Peak Friction Behavior of Smooth Geomembrane-Particle Interfaces. J. Geotech. Geoenviron. Eng. 1991, 125, 544–555. [Google Scholar] [CrossRef]
Figure 1. The process and use of photocured chain reaction to form photocured geomembrane.
Sustainability 13 08201 g001
Figure 2. The materials used in the test.
Sustainability 13 08201 g002
Figure 3. Photocured geomembrane.
Sustainability 13 08201 g003
Figure 4. Curve of particle distribution.
Sustainability 13 08201 g004
Figure 5. The production flow chart of geomembrane.
Sustainability 13 08201 g005
Figure 6. Direct shear apparatus.
Sustainability 13 08201 g006
Figure 7. Shear stress–shear displacement curves for different ratios of photocured geomembrane–clay interface: (a) Geomembrane with 1% photoinitiator—clay; (b) Geomembrane with 2% photoinitiator—clay; (c) Geomembrane with 3% photoinitiator—clay; (d) Geomembrane with 4% photoinitiator—clay; (e) Geomembrane with 5% photoinitiator—clay; (f) clay-clay.
Sustainability 13 08201 g007
Figure 8. Shear stress–shear displacement curves for different ratios of photocured geomembrane–sand interface: (a) Geomembrane with 1% photoinitiator—sand; (b) Geomembrane with 2% photoinitiator—sand; (c) Geomembrane with 3% photoinitiator—sand; (d) Geomembrane with 4% photoinitiator—sand (e) Geomembrane with 5% photoinitiator—sand; (f) sand–sand.
Sustainability 13 08201 g008
Figure 9. Shear strength–normal stress of photocured geomembrane–clay interface with different proportions.
Sustainability 13 08201 g009
Figure 10. Shear strength-normal stress of photocured geomembrane-sand interface with different proportions.
Sustainability 13 08201 g010
Figure 11. The friction coefficient of the photocured geomembrane–clay interface with different proportions.
Sustainability 13 08201 g011
Figure 12. The friction coefficient of photocured geomembrane–sand soil interface with different proportions.
Sustainability 13 08201 g012
Table 1. Materials used in the test.
Type of Materials Used in the TestSpecific NamePercentage Range
Acrylic monomersAcrylic monomers (CH2CHCOOH)90%
PhotoinitiatorTPO Photoinitiator (C22H21P02)5%
Carbon blackHigh pigment 5000 mesh carbon black3%
Others 2%
Table 2. Clay properties.
Sample NumberCarbon Black Content (%)Photoinitiator Content (%)Acrylic Monomers (%)
12197
22296
32395
42494
52593
Table 3. Physical parameters of the clay.
Characteristic IndexValue
Natural moisture content (%)7.71
Specific gravity2.73
Natural Density (g·cm−3)1.39
Optimum moisture content (%)20.80
Max dry density/(g·cm−3)1.62
Liquid limit (%)34.00
Plastic limit (%)17.80
Table 4. Friction characteristic parameters.
Photoinitiator Content (%)Interfacial Shear Strength Coefficient (Compared with Clay)Interfacials Shear Strength Coefficient (Compared with Sand)
clay/sand11
10.681.90
21.041.70
30.991.95
40.752.10
50.711.80
Publisher’s Note: MDPI stays neutral with regard to jurisdictional claims in published maps and institutional affiliations.

