1. Introduction
Since mid-2020, global restrictions in terms of travelers’ movement have been introduced due to emergence and spread of COVID-19. Specifically, COVID-19 exhibits characteristics of a smear infection with which a small droplet of water mixes with viruses or germs and spreads to another person’s respiratory system when a nearby infected person sneezes or coughs [
1]. Various COVID-19 preventive measures and policies of varying strengths have been implemented throughout the world. They include wearing masks for curbing smear infections from the atmosphere, promoting online meetings, and enacting strategic lockdowns in urban areas for limiting interpersonal contacts.
The Korean federal government has tried to overcome the spread of COVID-19 by implementing basic rules for maintaining a safe distance in daily activities from June 2020 and setting social distancing policies in various stages and banning gatherings of more than five people [
2]. The implementation of these policies has resulted in various social phenomena, such as air pollution mitigation, fewer travelers, and implementation of online classes in high schools. This paper focuses on changes in the behavior of passengers in terms of their transportation usage. Commuting, shopping, and leisure travel occur due to a variety of purposes. Furthermore, these types of travel are conducted via various modes of transportation, such as private auto, metro, and transit buses. In this study, it was determined that COVID-19 affects passengers’ choices on their modes of transportation.
In addition to the typical modes of transportation, such as private auto and public transportation, the utilization rate of public bicycles during COVID-19 outbreak was identified in this paper. Since 2009, interests in sustainable transportation policies for reducing greenhouse gases have been increasing in South Korea. Furthermore, studies related to greenhouse gases and transportation have been conducted [
3]. In this study, we analyzed the Seoul Bike (
https://www.bikeseoul.com, accessed on 25 March 2021) traffic data, a public bicycle project operated by the Seoul Metropolitan Government, in order to identify changes in public bicycle usage rates due to COVID-19. Furthermore, we compared these data with traditional transportation data for passenger cars and public transportation modes.
In this study, we limited our analysis to the Seoul metropolitan area to ensure carrying out an appropriate comparative analysis on choices among different modes of transportation. In order to objectively compare the traffic data, Seoul Open Data Portals and Seoul Transportation Information System (TOPIS) traffic data provided by the municipal government of Seoul were used. By identifying the changes in the traffic usage behavior of passengers during the pandemic of the highly contagious COVID-19, this study also predicts future traffic patterns of passengers in the post-COVID era and presents a strategy to accommodate them.
Due to the worldwide outbreak of COVID-19, many countries have implemented a variety of epidemic prevention measures. Tirachini and Cats [
4] summarize the pandemic response policies adopted by government agencies managing transportation operations during COVID-19. They argue that the COVID-19 outbreak can affect the financial viability of government agencies and individuals in terms of public transportation, economic, and social aspects. The effect of COVID-19 is expected to lower the ridership of public transportation due to its closed environment and crowdedness. It is expected that this in turn will continue to reduce the utilization of public transportation. Furthermore, Hu et al. [
5] suggest that COVID-19 poses a high risk of transmission between passengers in trains. However, the propagation level varied significantly with respect to passenger travel times and seating positions. They argue that in the event of a pandemic, preventive measures are required to reduce the risk of transmission by increasing seating distances between passengers, reducing passenger density, and implementing personal hygiene procedures in public transportation with closed spaces such as trains.
Dzisi and Dei [
6] conducted an experiment in Ghana to ensure that commuters using buses comply with the use of masks. The study reveals that approximately 12.6% of commuter buses had more than three commuters without wearing masks. Hence, it was determined that the spread of COVID-19 in public transportation can intensify if compulsory quarantine measures are not implemented. Wiechowski and Grzeda [
7] confirmed that the compulsory containment policy was effective in reducing the public transportation ridership in order to curb the spread of the COVID-19 epidemic in Poland. Morawska et al. [
8] emphasized the need for effective ventilations in hospitals, shops, offices, and public transportation facilities along with enforced quarantine measures such as fines. It was suggested that appropriate ventilations can be an effective parallel measure along with controls such as isolation and social distancing.
Various studies have also been conducted on the sharing of transportation modes. Yasui and Shiomi [
9] examined the decline of automobile sharing rates in the Keihanshin Metropolitan Area in western Japan. The changes in age, gender, and road environment affected the usage pattern of private auto mode. Furthermore, the changes in socioeconomic indicators or changes in relevant infrastructure facilities are significant variables that affect changes in transportation behavior of users. Similarly, Jaensirisak and Paramet [
10] identified changes in freight car utilization due to the development of transportation infrastructure. The study was conducted based on detailed test scenarios based on a national freight transport model. In the study, the authors argued for the need to expand road infrastructure and freight-related railway networks for more effective transportation of cargo vehicles. Furthermore, the impact of the environment and infrastructure associated with transportation on mode sharing rates was also discussed.
From the perspective of sustainable transportation, Morfoulaki and Papathanasiou [
11] created specific procedures for developing sustainable cities. They present a framework to evaluate and rank sustainable transportation in urban areas. In the paper, they tried to increase the comfort level of public transportation in the city resulting in encouraging passengers to choose highly sustainable modes of transportation including the public transit. In the paper, they tried to induce passengers towards sustainable modes of transportation. Przybylowski et al. [
12] investigated the effects of the COVD-19 on public transportation users’ behaviors. COVID-19 has been observed to reduce the public transportation utilization. It was argued that the sustainable nature of public transportation should be maintained by ensuring the safety of public transportation against infectious diseases. Feilhauer et al. [
13] developed an application that encourages users to record their own travel behaviors and choose appropriate transportation modes that better suit their preferences. Traffic records released by the users can be anonymized for privacy and analyzed by public institutions.
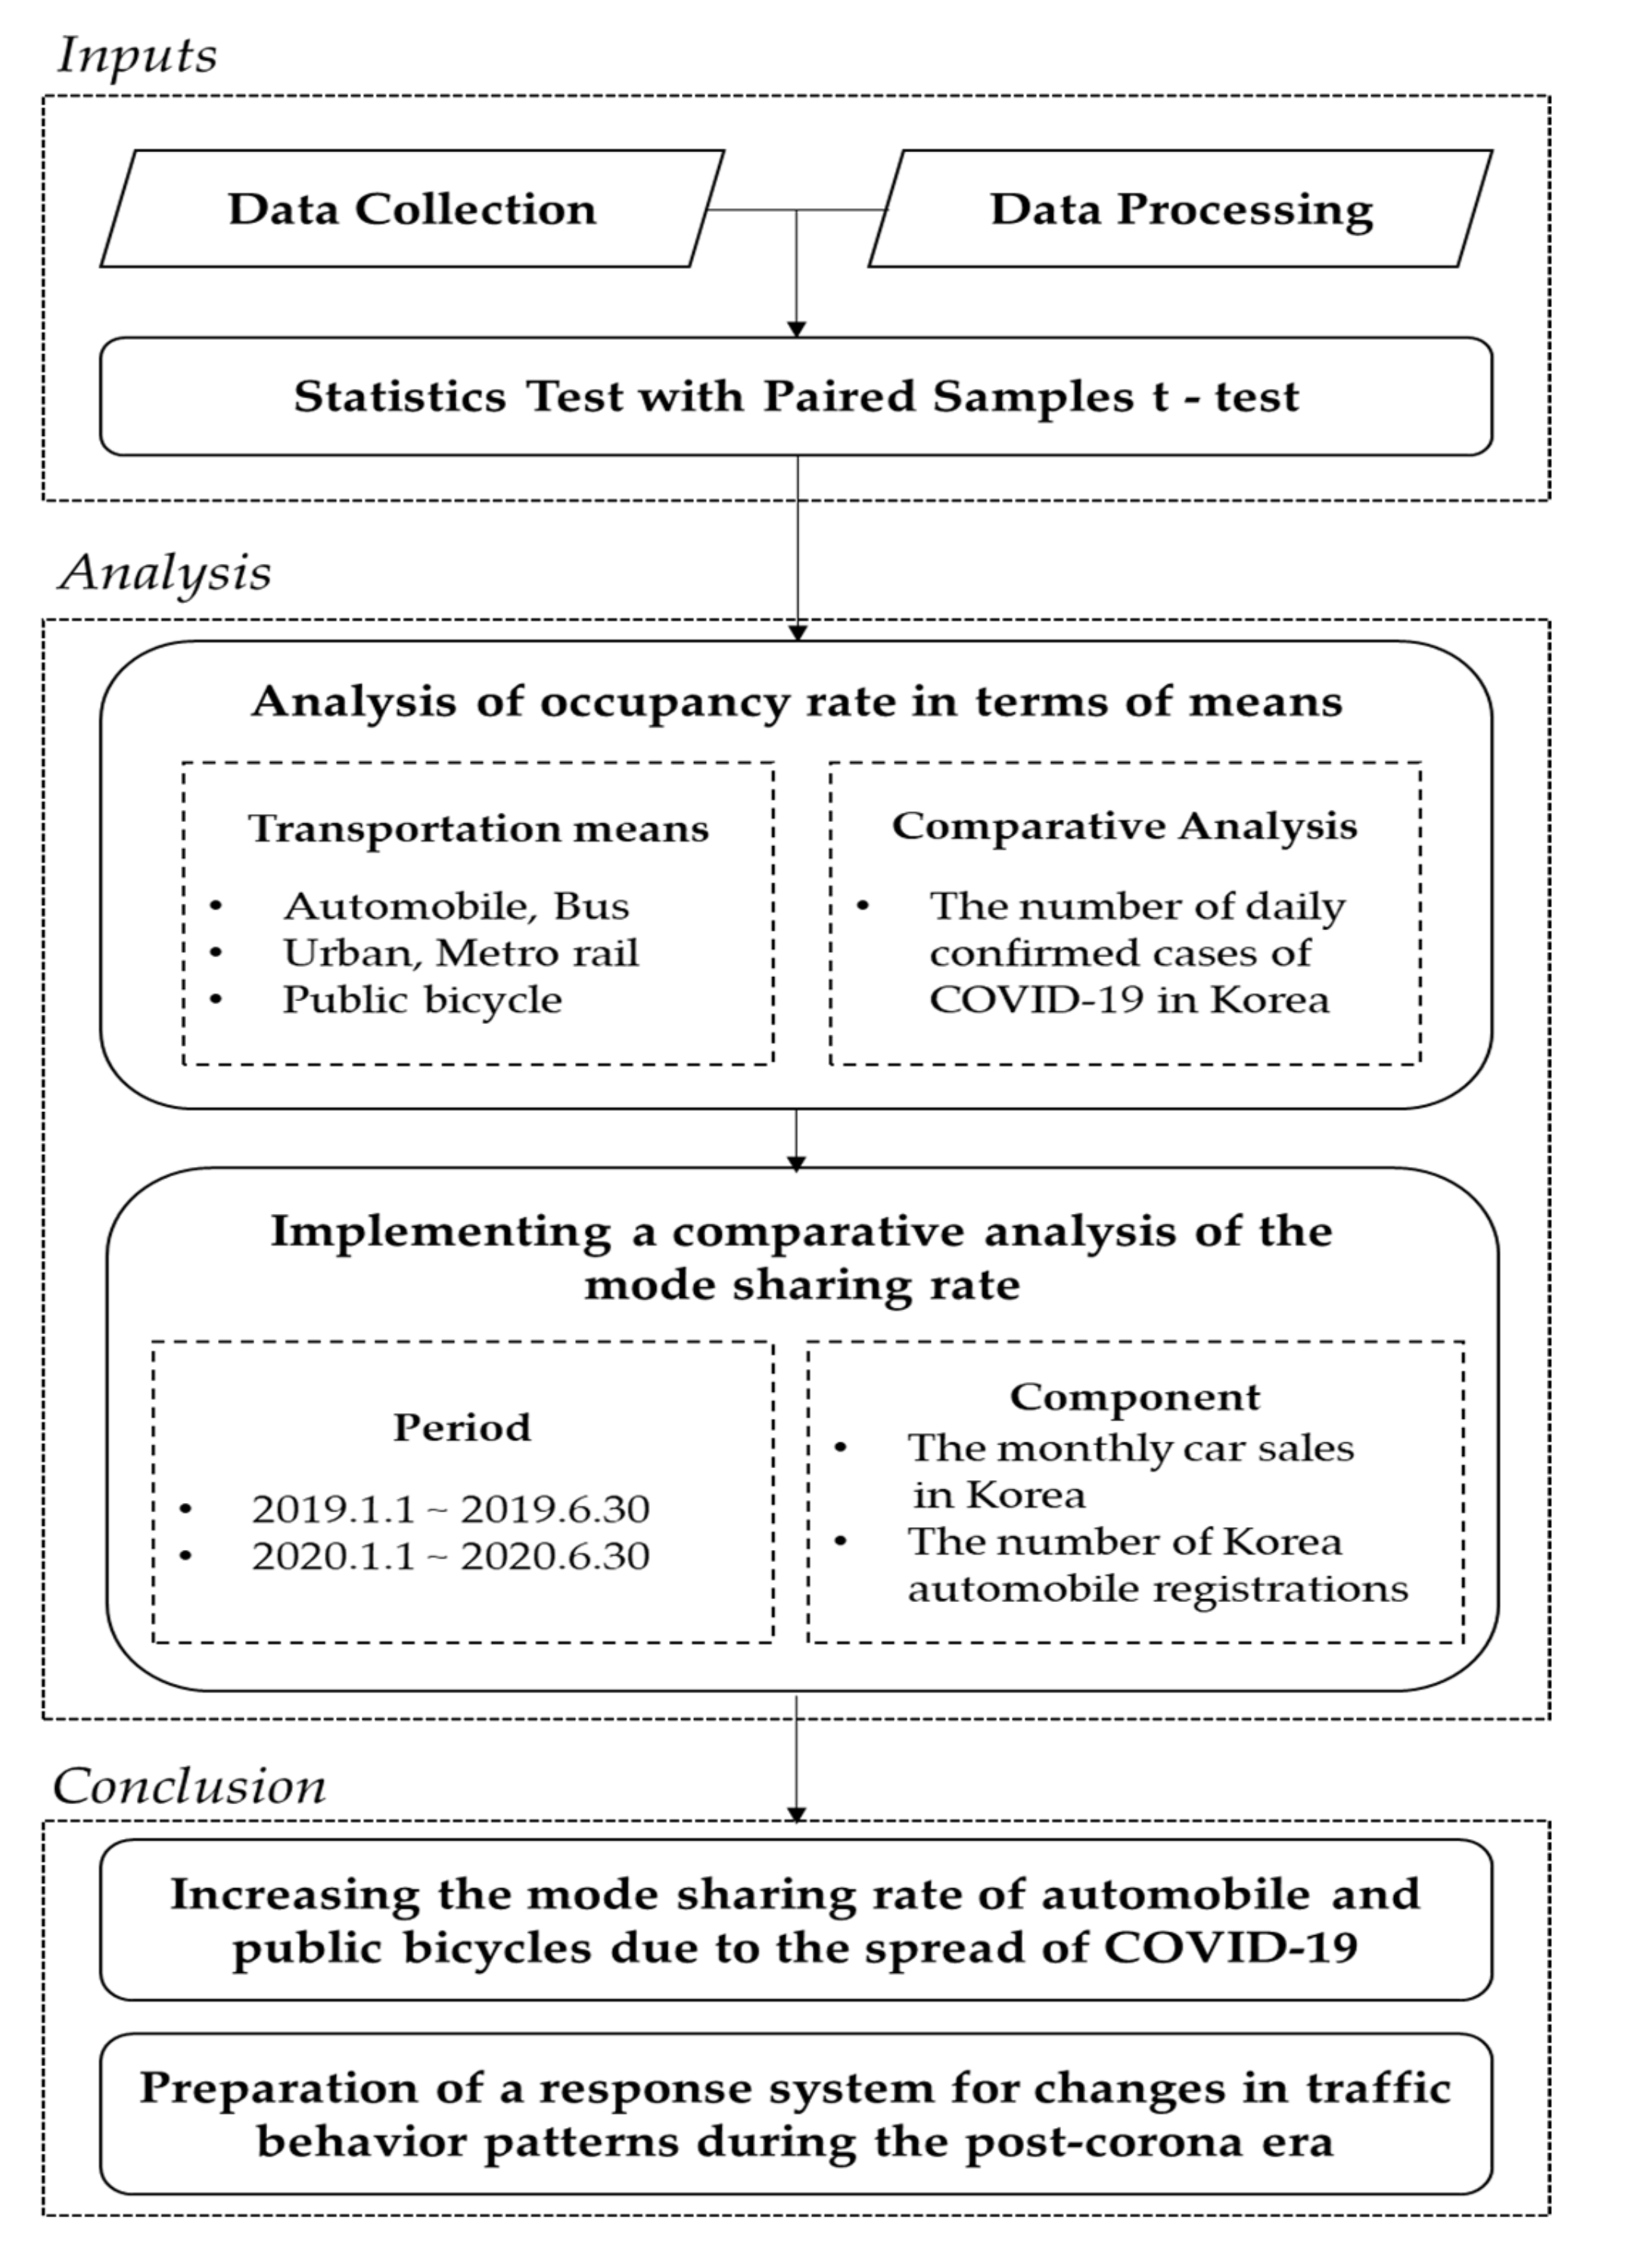
There are three main contributions of this paper that are unique compared to the existing literature. First, the paired sample t-test carried out in this paper considers whether the change in utilization of each mode of transportation due to COVID-19 is of statistical significance. A review on previous research works suggests that studies focusing on changes in utilization rates for private auto and public transportation have been conducted. However, in this paper, passenger cars, buses, public bicycles, and urban railways as well as metropolitan railway data (linking regions) are included.
Second, in this study, we analyzed transportation mode shares and recovery rates together within the COVID-19-impacted period. In addition to quantitatively comparing entry and exit counts of vehicles for transportation modes within the 2020 COVID-19 period to that in 2019 prior to the pandemic, the mode share rates for the two periods were compared and analyzed.
Third, the Seoul Metropolitan Government’s public bicycle service, the Seoul Bike (also known as “Ttareungyi” meaning a bike-bell ringer in Korean), based on the bike ride volume, claims that its service serves an important role of providing an alternative mode of sustainable transportation. In this study, we expect that by focusing on changes in the demand for public bicycles in terms of ridership during the pandemic, public bicycles may indeed be a practical alternative mode of transportation in the post-COVID-19 era.
3. Results
3.1. Changes in the Number of Travelers by Mode of Transportation
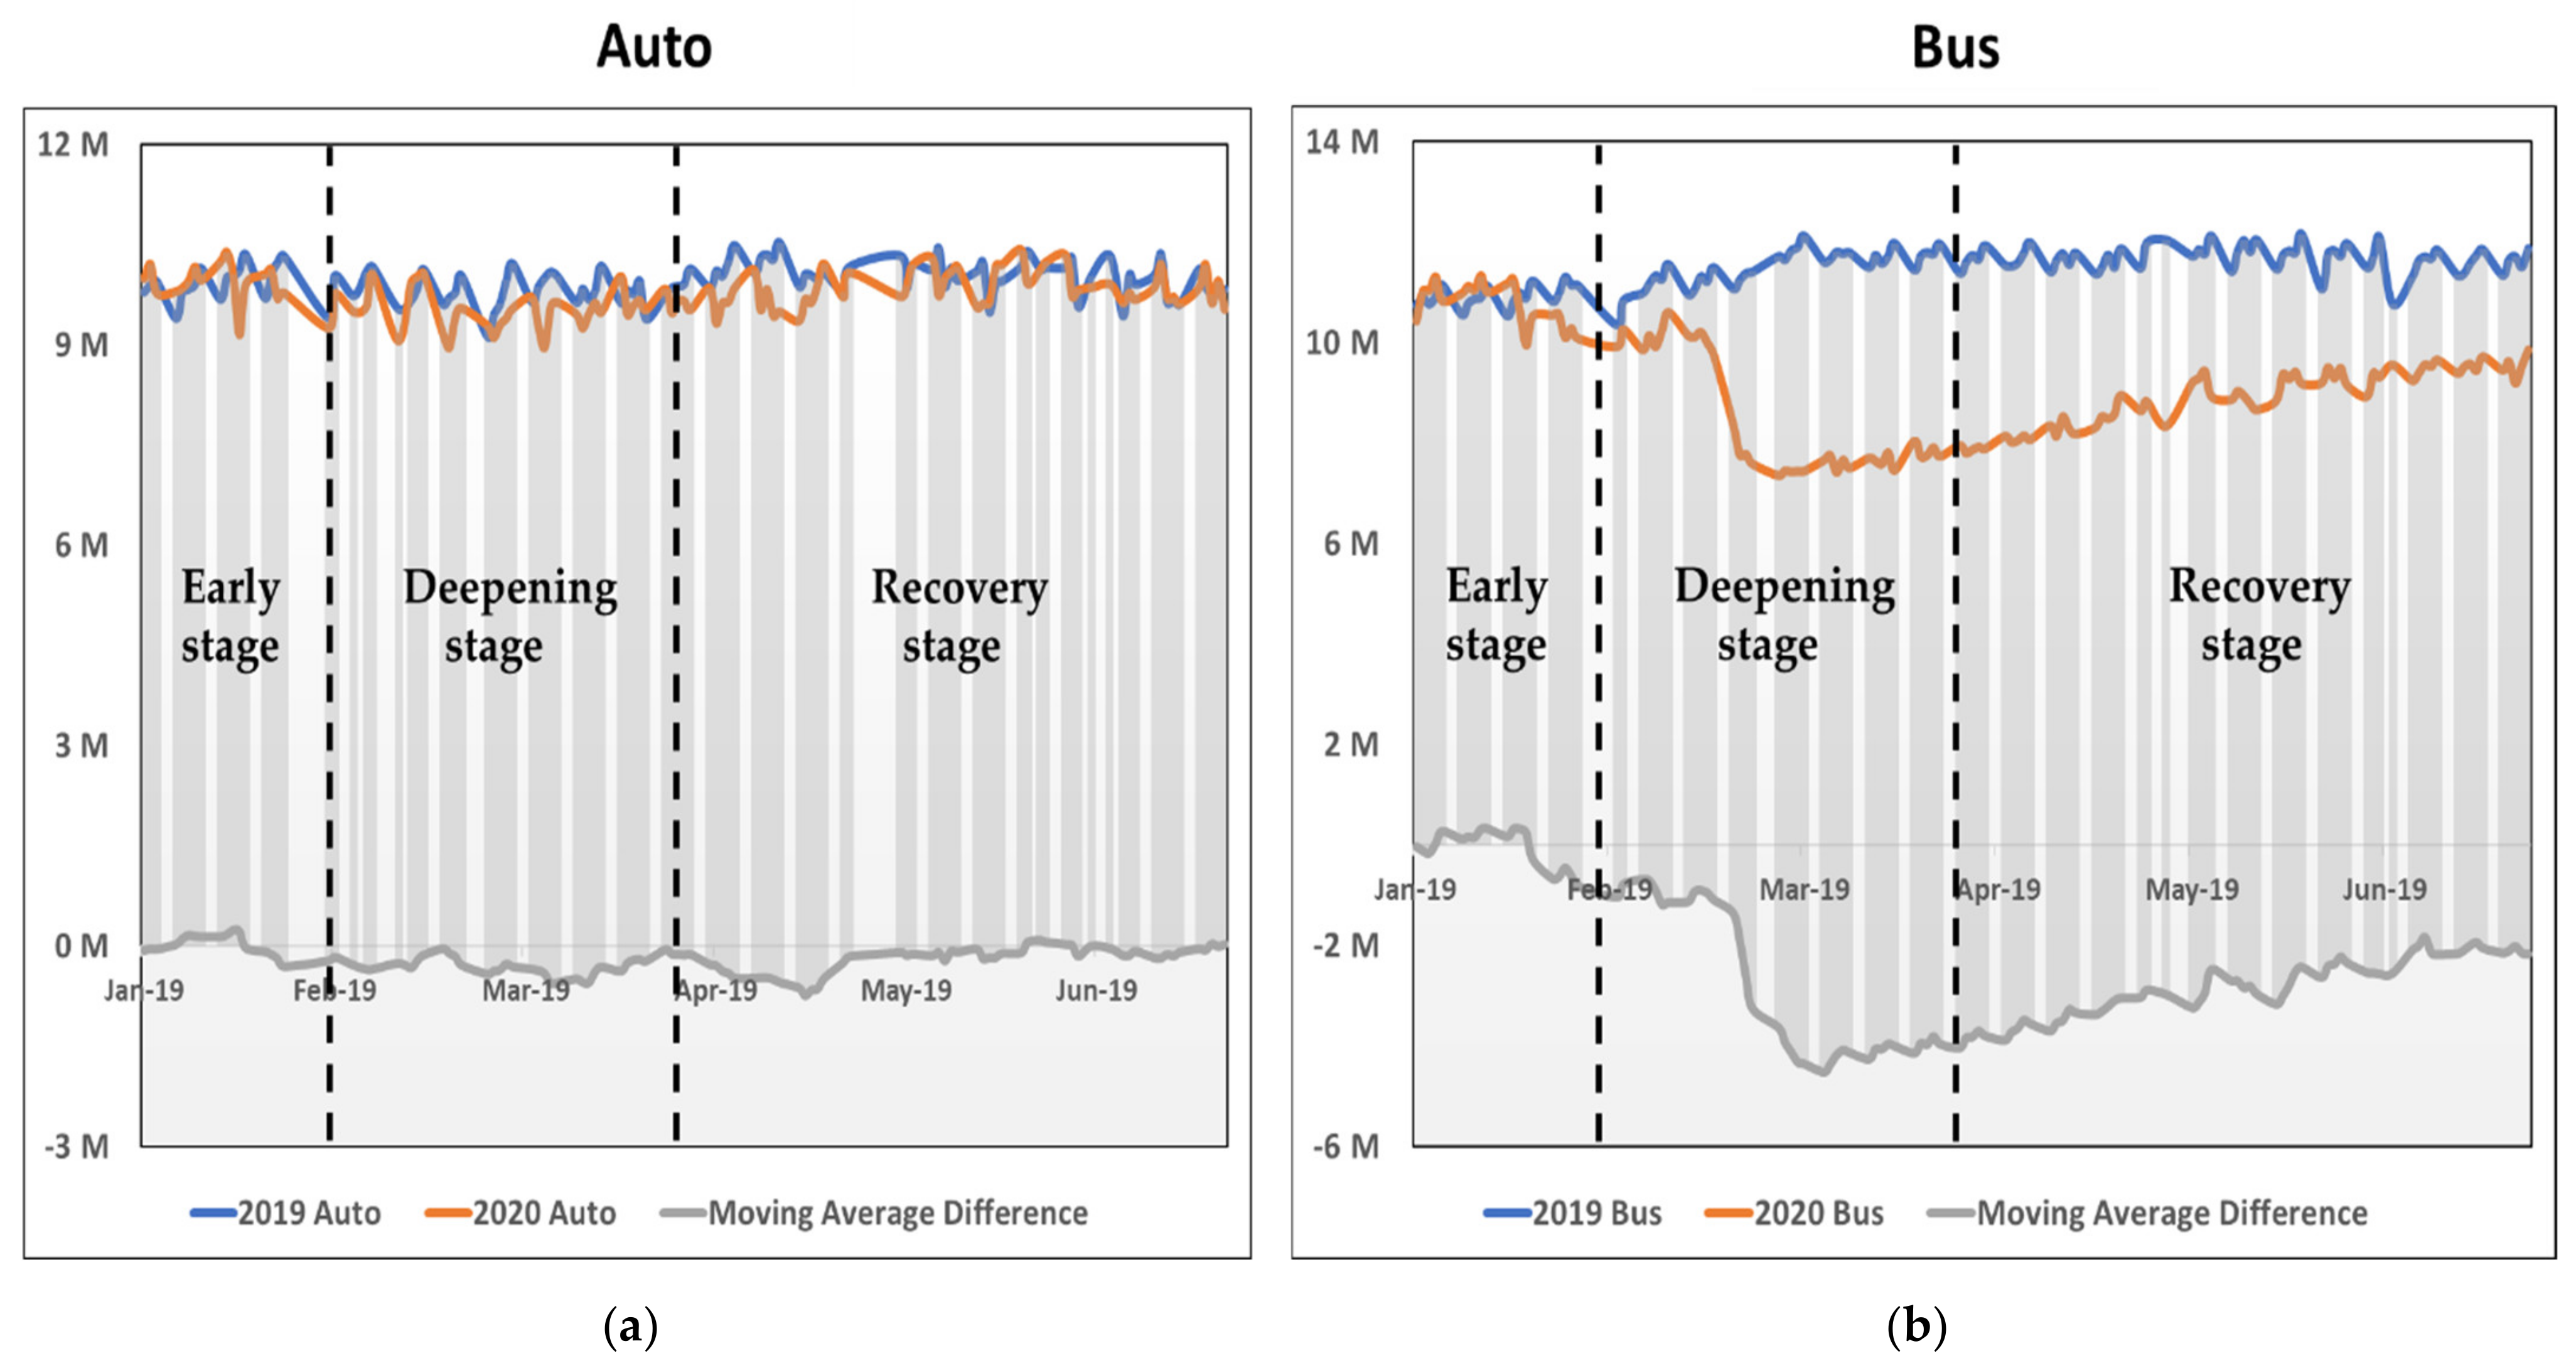
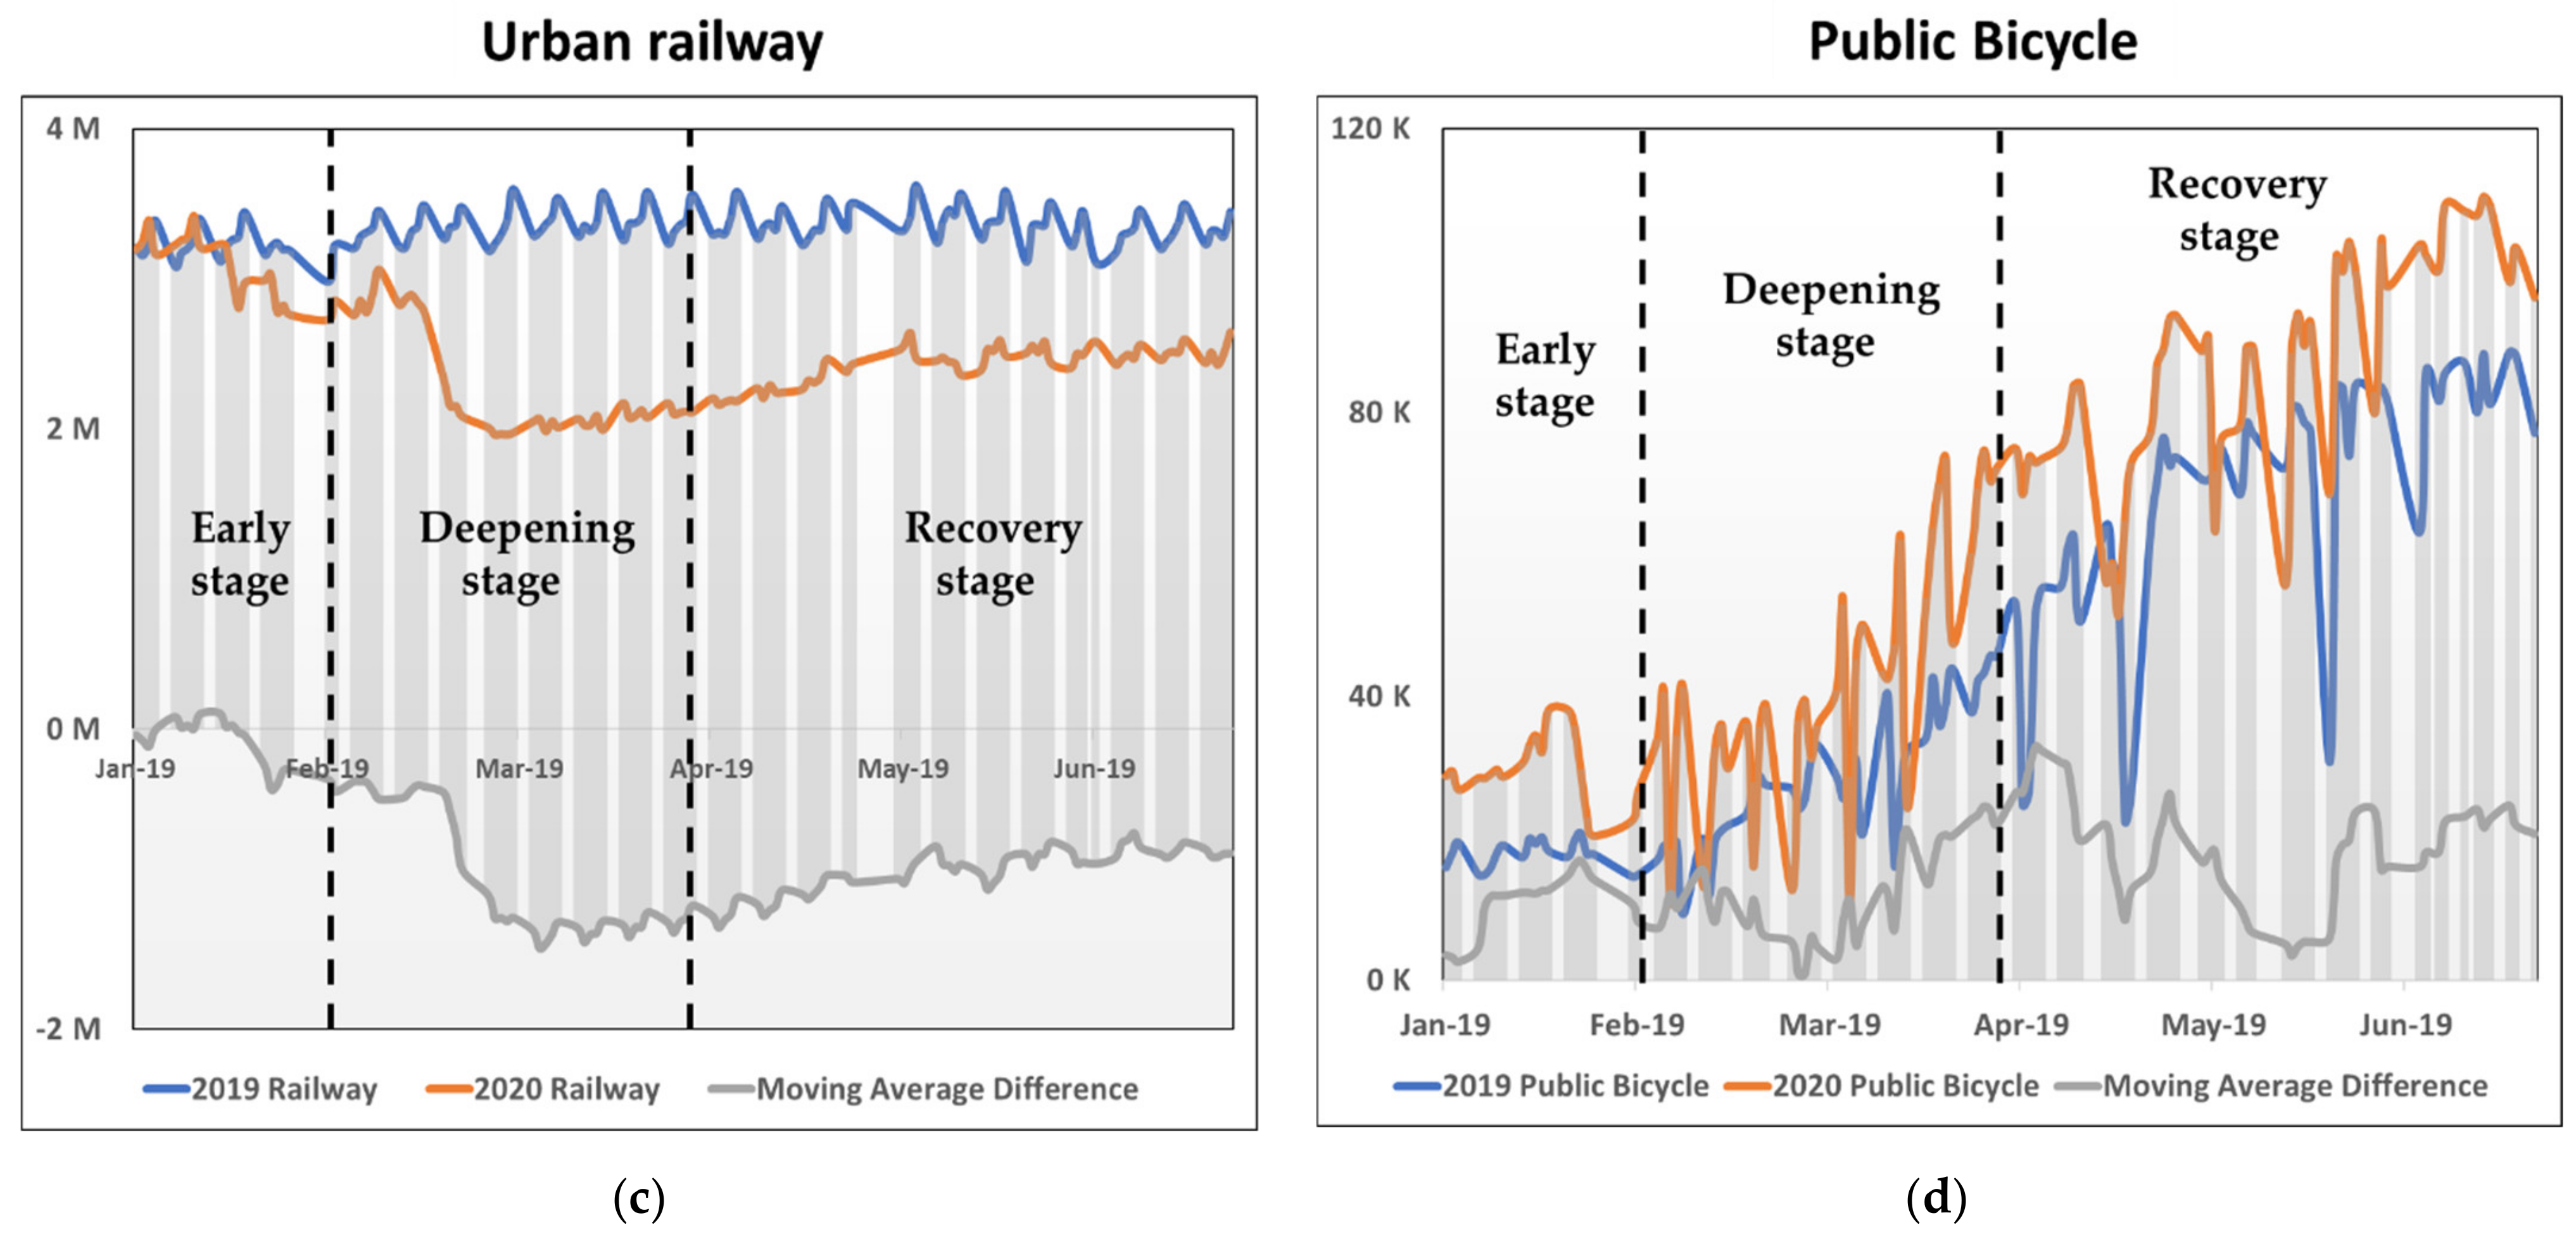
Changes in the number of travelers in auto, bus, subway, and public bicycle were identified to determine the trends of their mode choices in Seoul. The period was divided into three stages: Early stage, Deepening stage, and Recovery stage. The criteria for the period classification were set as the Shincheonji Incident in Daegu, the first major COVID-19 outbreak in South Korea at a cult religious gathering, on 18 February 2020 and the implementation of second enhanced social distancing policy on 6 April 2020. We wanted to see the difference in the number of passenger-use means between the previous year, and 2020, the year COVID-19 occurred. The difference between the number of daily users in 2020 and 2019 is presented using the simple moving average method. MSE techniques are used for monitoring accuracies.
As seen in
Figure 2, the difference in usage for auto (
Figure 2a) in 2019 and 2020 was not significant [
16], while the difference in public transportation for buses (
Figure 2b) and subways (
Figure 2c) was relatively large [
17]. The difference in passenger usage during the Deepening stage intensified, and the gap eased upon entering the Recovery stage. In the case of public bicycle (
Figure 2d), overall, the usage volume increased in 2020 compared to 2019, but the usage pattern was not as stable as other modes [
17]. For the mode, it seems that there are other restrictive factors on bicycle use, such as weather and atmospheric conditions.
Table 4 represents the average amount of passenger use by modes of transportation by stage type. For auto, bus, and subway, the number of passengers in 2020 decreased compared to 2019 [
16,
17]. In the case of auto, bus, and subway, the number of passengers in 2020 decreased compared to the number of passengers in 2019 in all stages. In the case of the public bicycle, the usage in 2020 increased compared to the previous year [
17]. The number of auto users for 2020 in the Deepening stage decreased by 3% compared to the previous year. However, public transportation, bus, and subway, decreased by more than 30%, with 31% and 36%, respectively. During the Recovery stage, auto and public bicycle recovered or exceeded the Early-stage usage, but bus and subway were found to fall short compared to the Early stage.
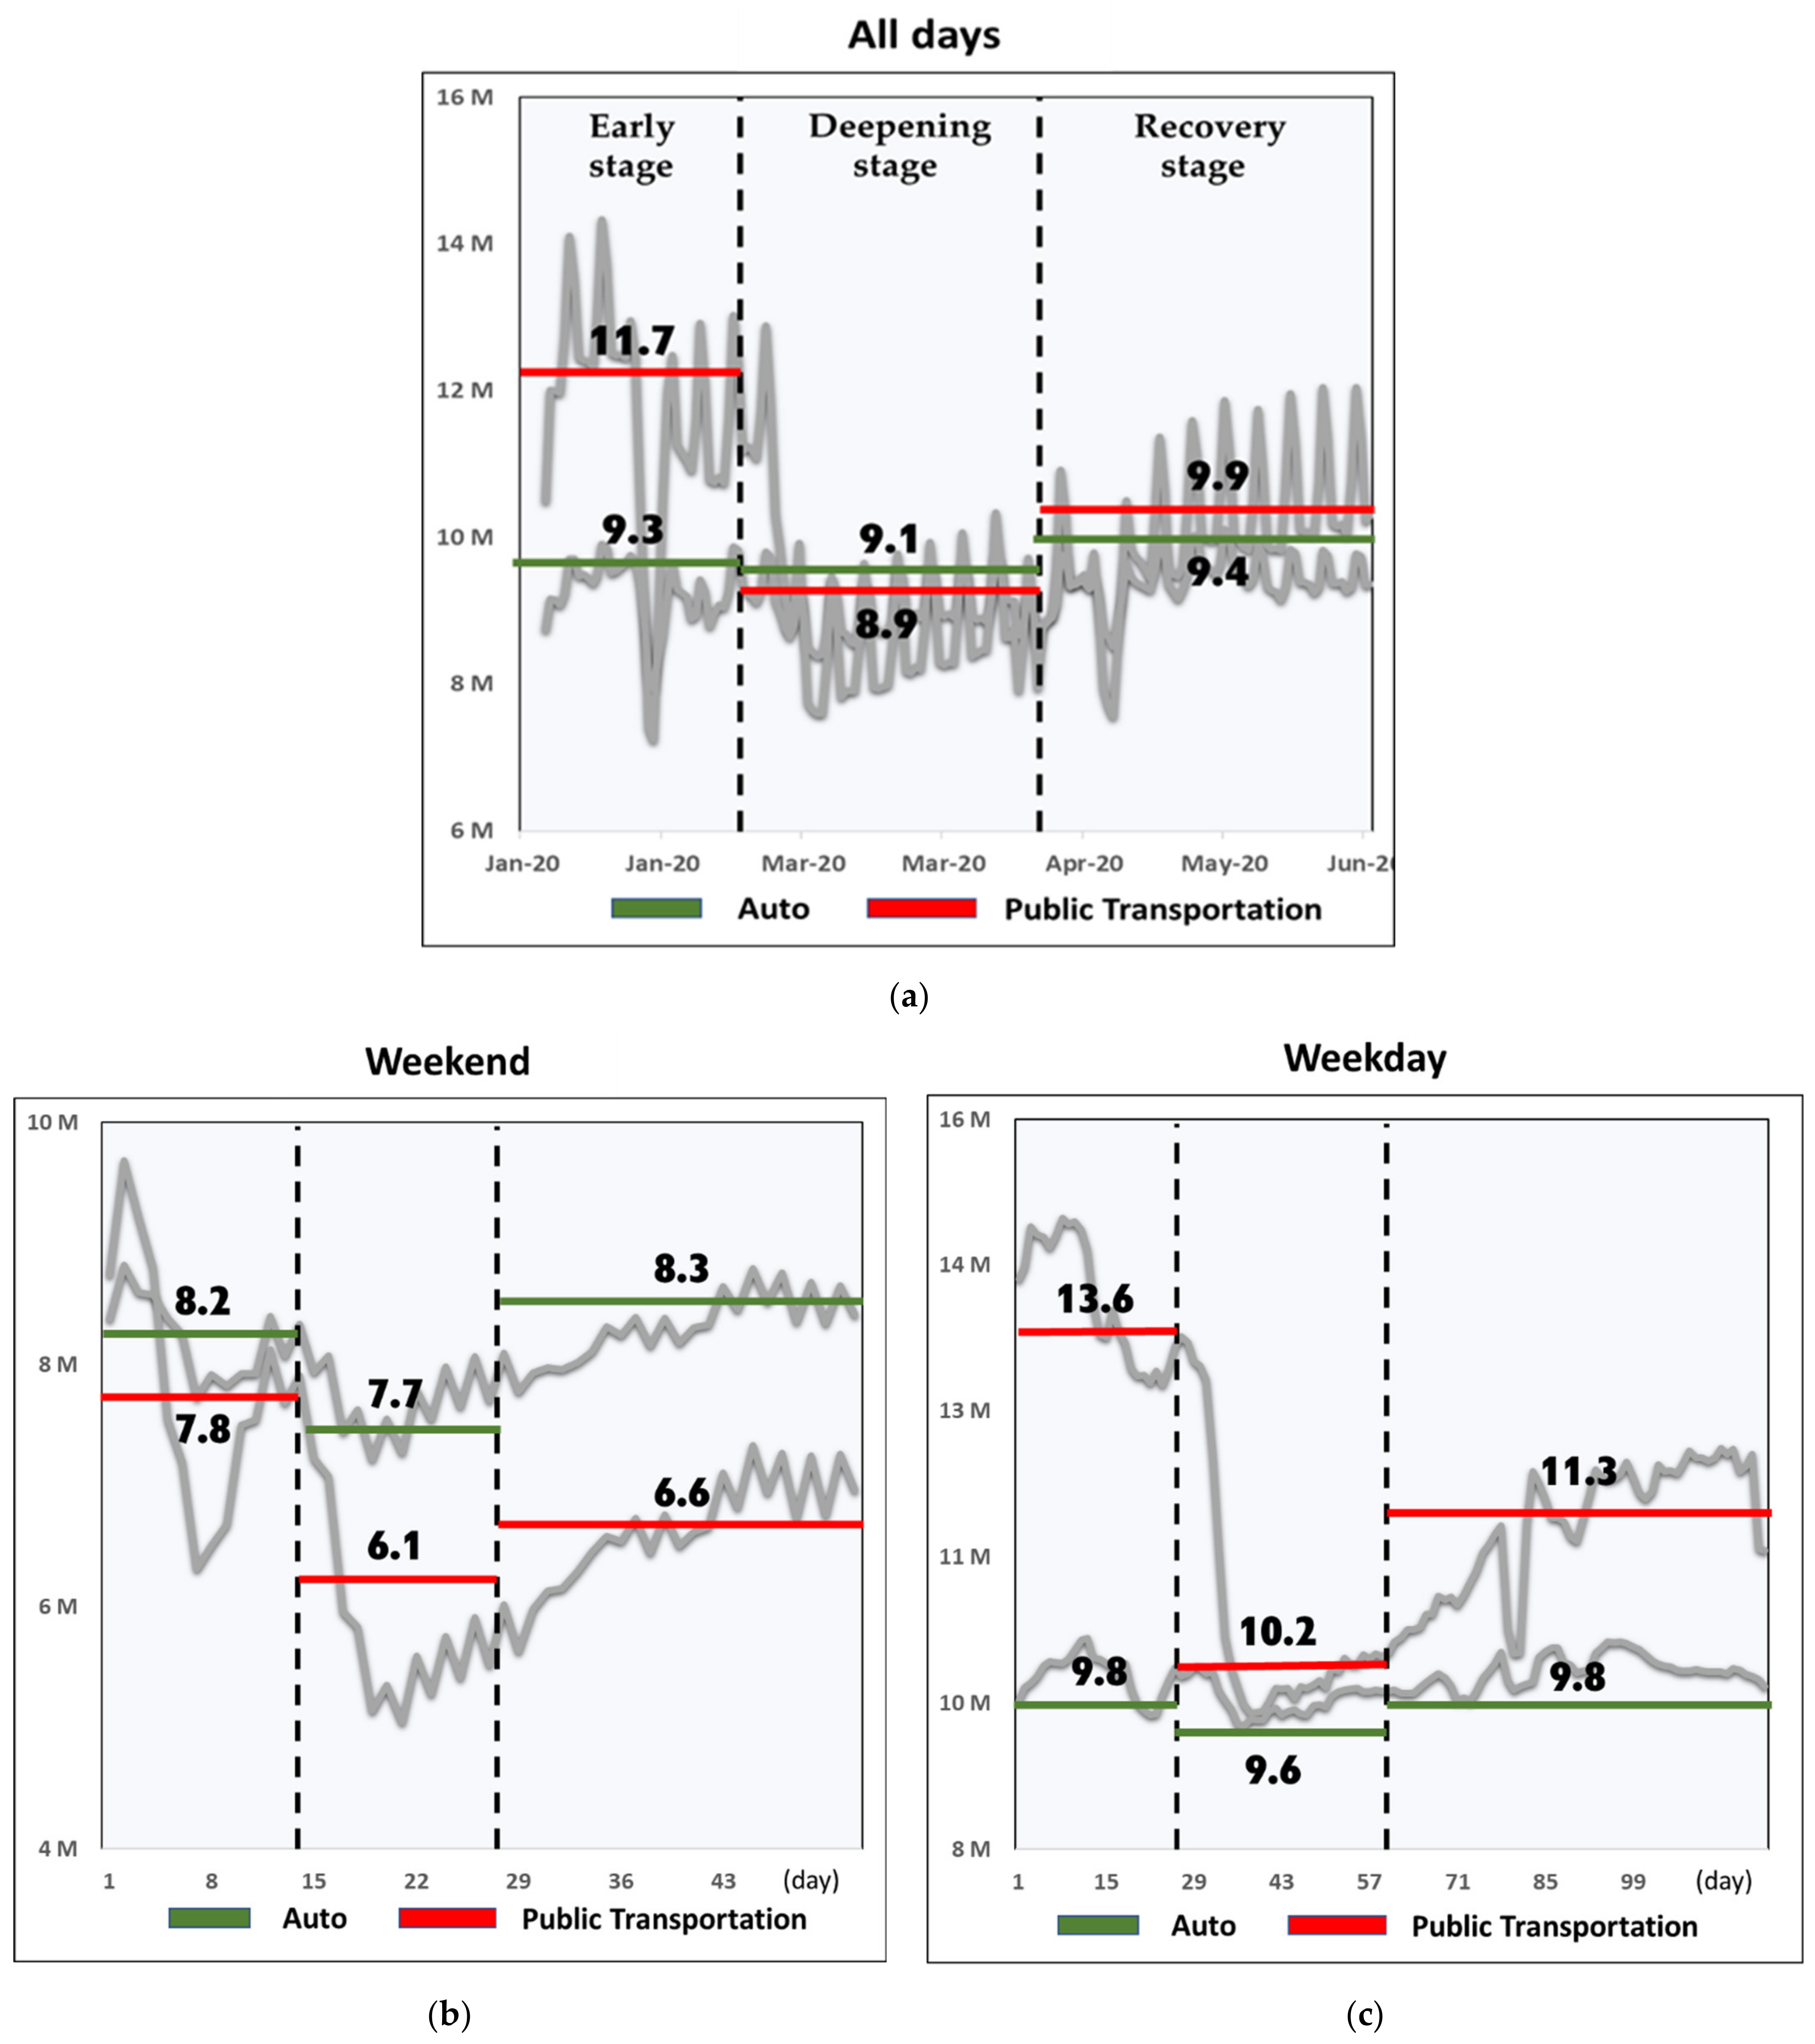
In the case of mode choice behaviors between public and private auto modes, the characteristics of the user’s travel behavior change depending on the characteristics of the day of the week. The user volume was identified by dividing the days of the week into All days, Weekdays, and Weekends. Bus and subway traffic were combined as Public Transportation, and comparisons between passenger cars and public transportation were implemented. Time-series changes were shown in terms of moving average values by modes of transportation, and periods were divided into three stages, similar to
Figure 2.
In
Figure 3, the number of passengers on auto outnumbered public transportation only in the Deepening stage of All days (
Figure 3a). In the case of Weekday (
Figure 3c) and Weekend (
Figure 3b), the number of users of Public Transportation prevailed, but in the case of Weekend, the number of users of auto was high in all periods. This indicates that the characteristics of the use of transportation by users vary depending on the day of the week and the nature of trips, whether they are for work or leisure.
3.2. Statistical Analysis with Paired Sample T-Test
A paired sample
t-test was conducted to determine whether the passenger volume of each mode of transportation had significant changes with respect to the occurrence of COVID-19.
Table 5 presents the results of a comparative analysis of passenger volume data for each mode of transportation before and after the COVID-19 outbreak. The analysis was conducted using 26 observations, which were converted to weekly traffic for each mode. The null hypothesis was that there were no changes before and after the outbreak. The alternative hypothesis was that there were differences between before and after the COVID-19 outbreak. This approach was applied for each of transportation.
With the null hypothesis, autos, buses, urban railways, metropolitan railways, and public bicycles exhibited a p-value that was lower than the significance level of 0.05. Therefore, the alternative hypothesis that the occurrence of COVID-19 affected passenger volume for each mode of transportation was adopted, and the null hypothesis was rejected. It was found that the occurrence of COVID-19 affects the passenger volume of all modes of transportation in Seoul.
3.3. Analysis of Passenger Occupancy Rate in Terms of Modes of Transportation
As shown in
Table 5, the paired sample
t-test statistically proves that the COVID-19 outbreak significantly affects passenger volumes of all modes of transportation in Seoul. Based on this, we analyzed monthly changes in passenger volume for all modes of transportation in 2020 and compared to those of 2019. According to the analysis, as of June 2020, transportation modes, other than auto and public bicycles, did not recover their boarding rates when compared to those in the same period in the previous year (2019). Specifically, in the case of metropolitan railways, the recovery rate was approximately 60% when compared to that in the previous year, thereby indicating that the metropolitan railways did not play a significant role in accommodating regional transportation demands. Conversely, in the case of auto mode, despite the COVID-19 outbreak, the utilization rate of passenger cars decreased only slightly in total volume throughout the period when compared to that in the previous year.
In June 2020, passenger cars exhibited a recovery rate of 100%, which was the fastest recovery among traditional transportation methods. In the case of the public bicycles (the Seoul Bike), the boarding rate was confirmed as higher than that in the previous year throughout the analysis periods after the COVID-19 outbreak. In the first three months of the COVID-19 outbreak, the utilization rate exceeded 160% when compared to that in the previous year. Since April 2020, the utilization rate of the Seoul Bike has been decreasing when compared to that in the previous month. This is expected to be due to the impact of online remote working policies introduced by private companies for mitigating the spread of COVID-19 in Seoul. Analysis of passenger utilization by each mode of transportation for 2019 and 2020 can be found at
Table 6.
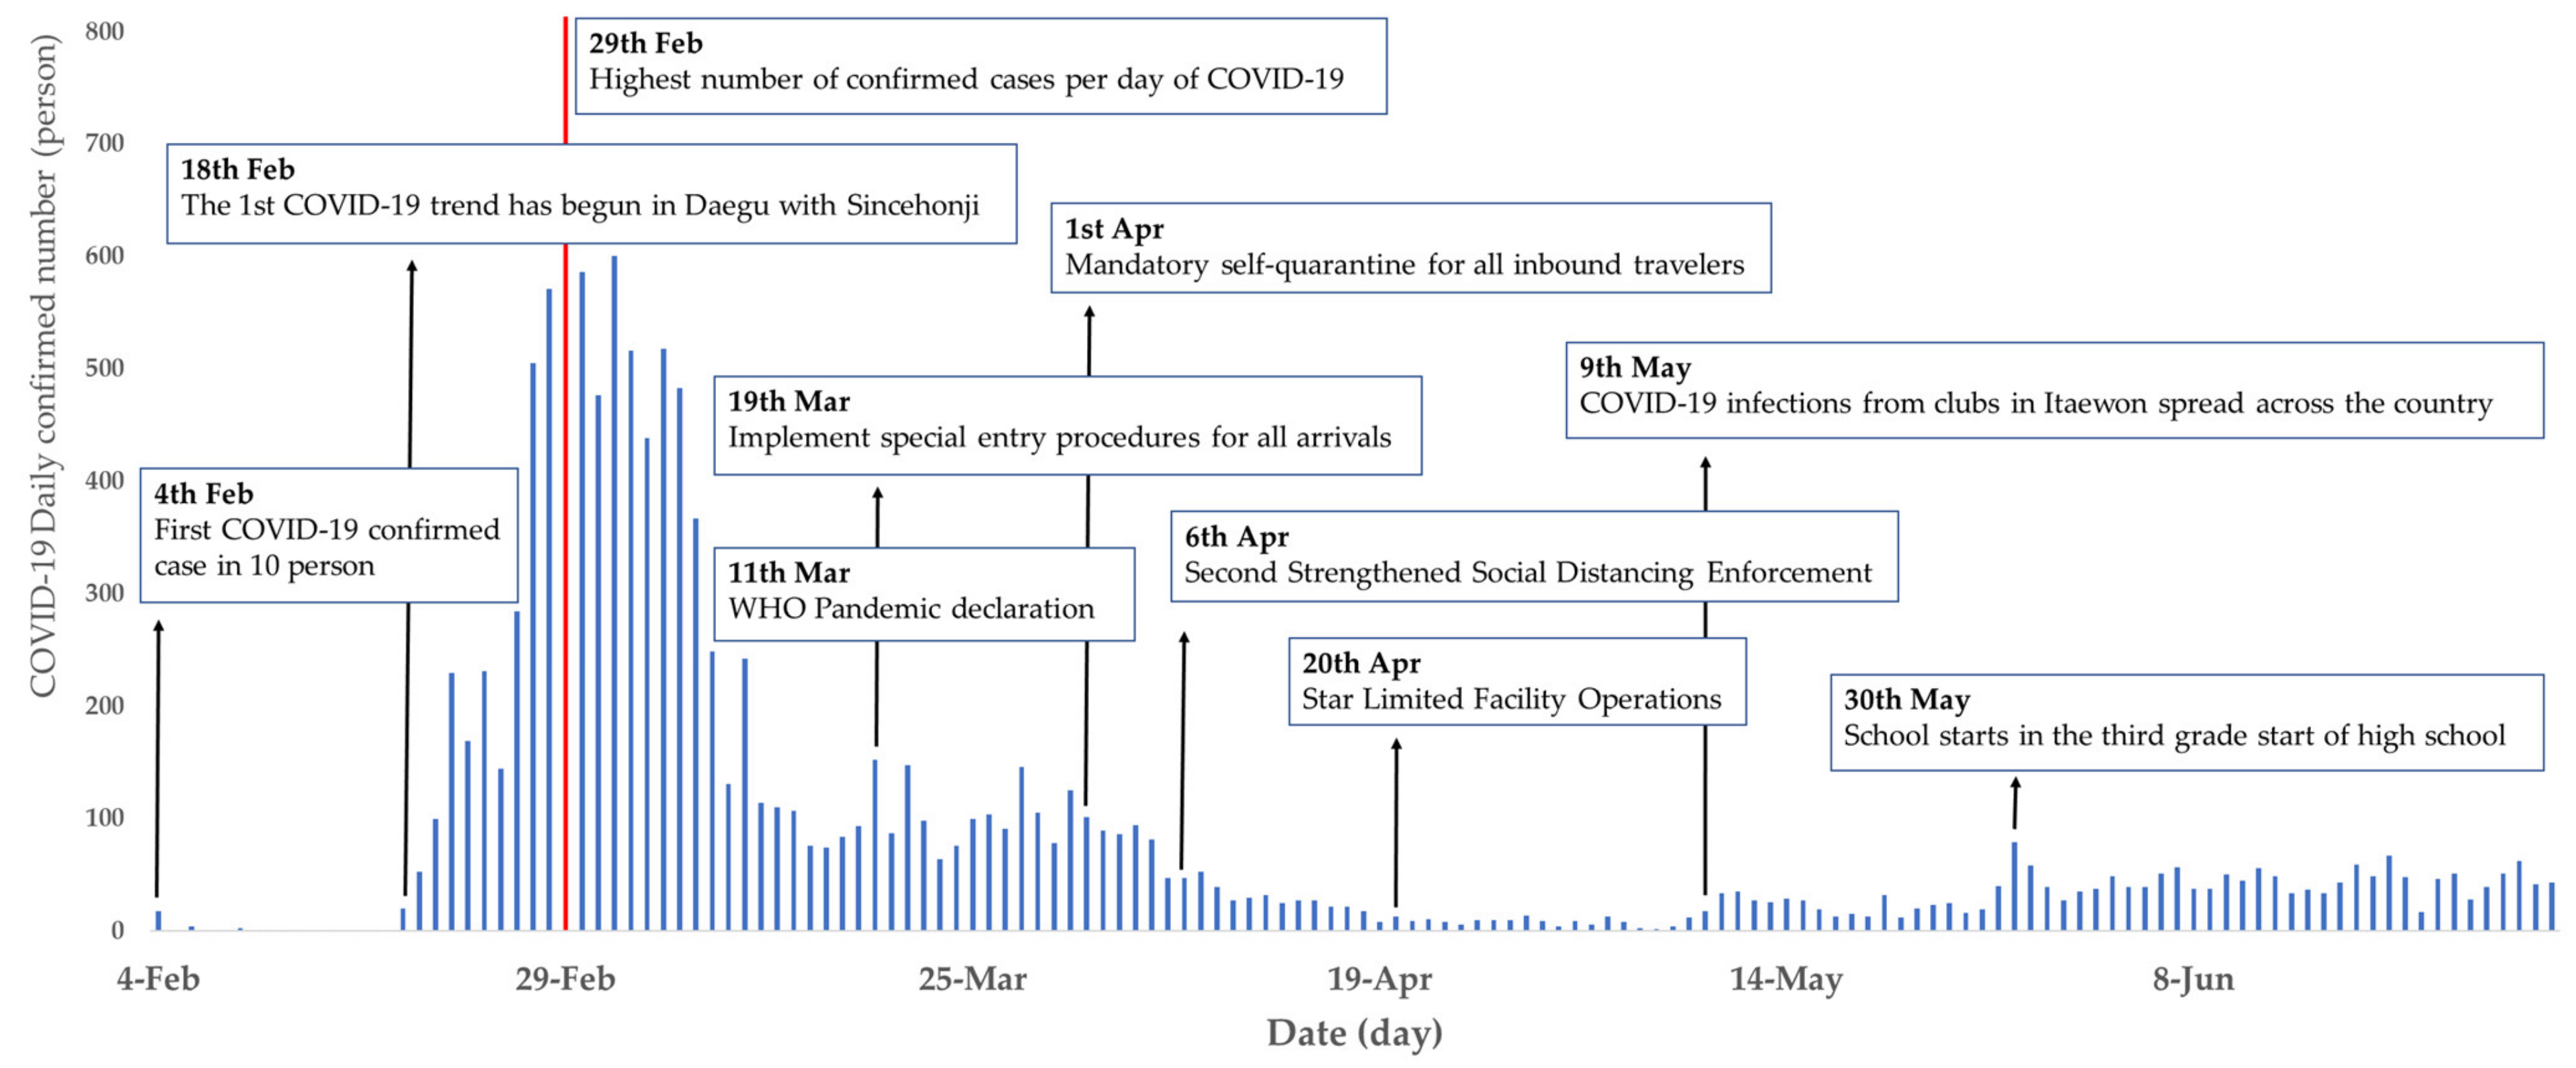
To analyze the rate of entry and exit counts at the boundary of Seoul, for each mode of transportation due to the spread of COVID-19, the number of daily confirmed COVID-19 cases in Korea from 1 February to 30 June 2020 is organized in
Figure 4 [
14]. As a major factor within the period, in 2020, the number of daily confirmed cases of 10 people was first observed on 4 February. On 18 February, the first major COVID-19 trend began in Daegu, with Sincheonji (a religious cult) at the center of the outbreak. On 29 February, the highest national daily confirmed cases of 800 were reported. On 11 March, the WHO declared COVID-19 as a global pandemic [
1], and on 19 March, special entry procedures were implemented for all international inbound travelers to Korea. On 1 April, all arriving passengers were asked to self-quarantine for two weeks, and on 6 April, a second round of strengthened social distancing rules was implemented. On 20 April, limited operations of facilities were allowed in Korea, and infections from Itaewon clubs in Seoul started to spread throughout Korea on 9 May. On 30 May, high school senior students resumed attending public schools.
At the beginning of the first major COVID-19 trend around Shincheonji on 18 February, KTX and Saemaeul and Mugunghwa metro-rail confirmed reduced occupancy rates by 43% and 38%, respectively, when compared to those in February 2019. As the first COVID-19 trend intensified, the utilization of all public transportation modes, including buses, urban railways, and metropolitan railways, began to decline. When compared to March 2019, reductions of 35%, 42%, 71%, and 66% were reported for buses, urban railways, KTX, Saemaul, and Mugunghwa trains, respectively. The result was only 5% decrement in the occupancy rate in contrast to the auto mode during the same period.
Therefore, it can be inferred that some public transportation passengers have switched to the auto mode. Between January and March in 2020, when the number of daily confirmed COVID-19 cases was perceived to be high by the public, the boarding rate of public bicycles reached its peak when compared to that in the previous year. In April, when the daily increase in the number of confirmed COVID-19 cases decreased, the boarding rate of public bicycles increased to 147% with respect to the previous year. From May 30, the daily number of confirmed cases started to increase again, and the utilization rate of the public bicycle service started increasing when compared to that in May 2019 during the same period. Thus, this leads to an implication that there is a proportional relationship between the daily number of confirmed COVID-19 cases and the utilization rate of the public bicycle service.
3.4. Comparative Analysis of Transportation Mode Sharing Rate
In the earlier sections, passenger occupancy rates were analyzed for each mode of transportation in 2020 when compared to those in 2019. In this section, mode sharing ratios among different transportation modes in 2020 are compared to those in 2019. Furthermore, using the ratios, the mode choices of transportation users within the COVID-19 period are analyzed.
Table 7 lists the mode sharing rates of different major transportation modes in Seoul. The metropolitan railway includes the combined ratios of KTX, Saemaeul, and Mugunghwa trains.
In 2019, the mode sharing rates of different modes are ranked from the highest to the lowest in the order of bus, auto, subway, and metropolitan railways. Meanwhile, the mode sharing rates in 2020, after COVID-19 occurred, are ranked in the order of auto, buses, subways, and metropolitan railways. Due to the highly contagious COVID-19, it is believed that passengers who usually use the public transportation modes have switched to the auto mode, which is generally perceived to have less exposures from others. As of June 2020, the utilization rate of buses decreased from 44.3% to 41.5% and that of urban railways decreased from 12.7% to 10.8%. Conversely, the utilization rate of auto has increased from 41.4% to 46.3%. Thus, it can be inferred that some passengers of buses and urban railways have switched to the auto mode.
As of June 2020, the public bicycle service exhibited a rise in the mode share rate from 0.3% to 0.5%. It is believed that the general public perceives that the Seoul Bike offers a lower probability of contacting others due to its open-environment and significantly less operational and passenger density. The rise in the mode shares of auto and public bicycle is a statistical indicator that passengers prefer modes with a relatively lower probability of contacting others during the COVID-19 period.
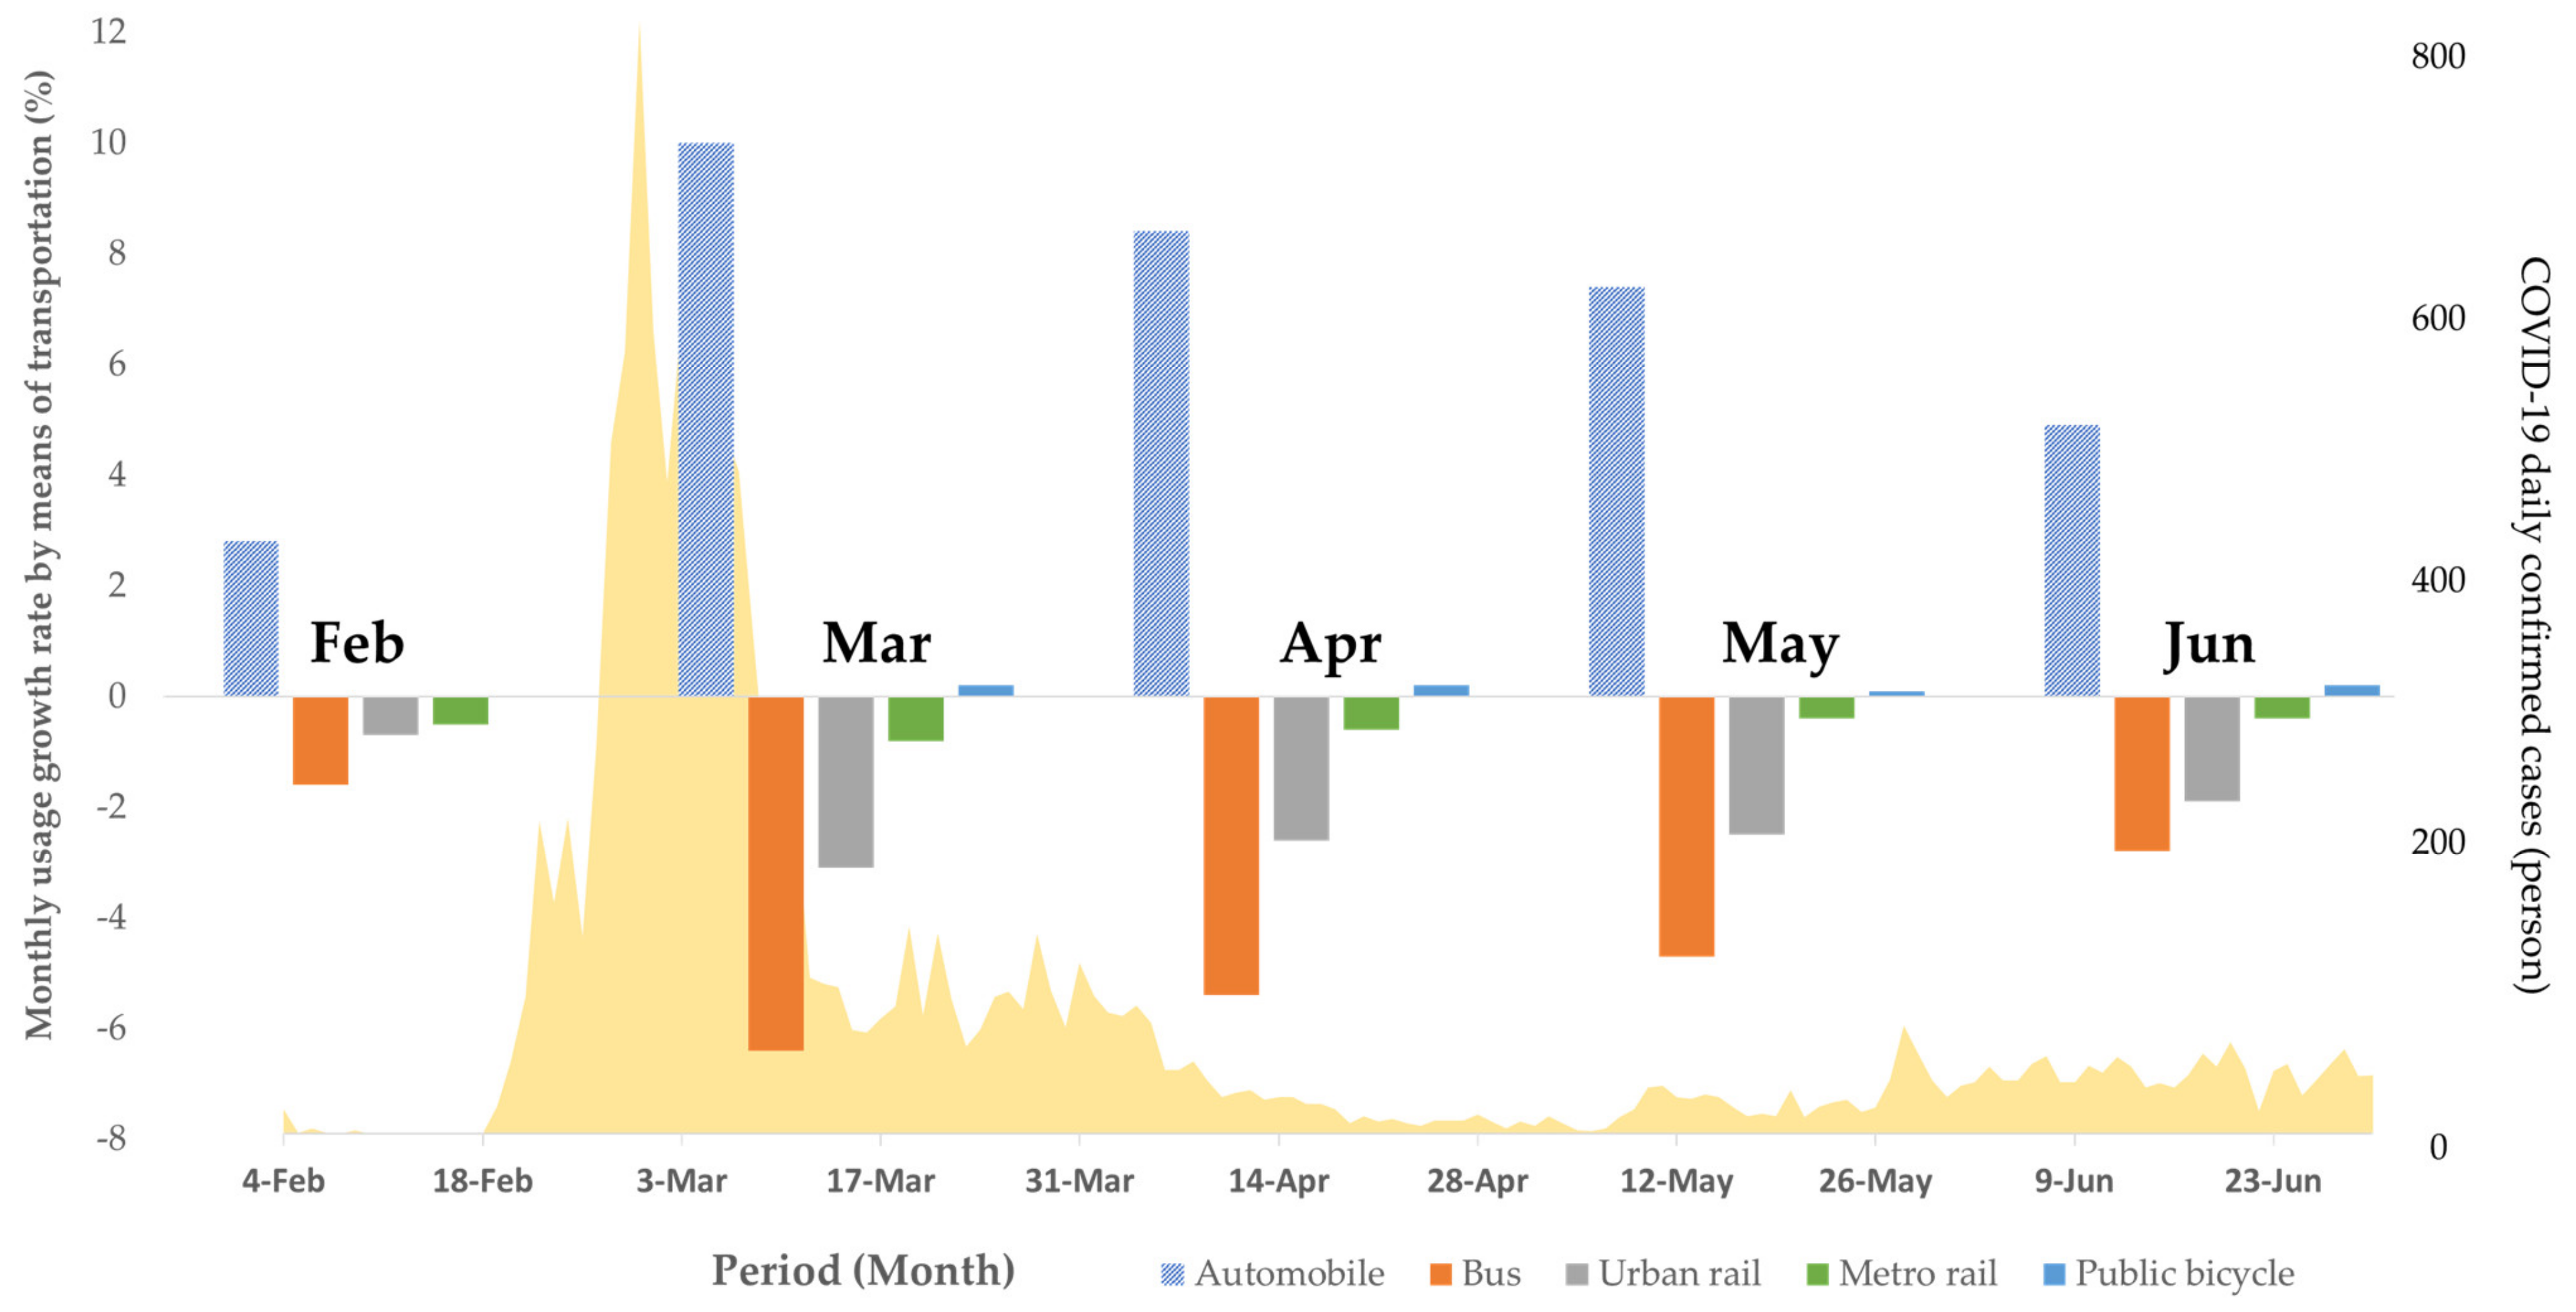
Figure 5 shows monthly usage fluctuations for each mode of transportation. The yellow-colored territorial graph represents the number of confirmed COVID-19 cases per day in Korea in 2020 [
14]. It can be seen that the auto mode rate in March 2020 increased by 10% compared to March 2019 due to the first major COVID-19 outbreak in the previous month of February 2020. On the other hand, the utilization rate of public transportation buses, urban railways, and metropolitan railways all decreased compared to 2019 [
15,
17]. As the pandemic slows down over following months, it is observed that the magnitudes of changes with respect to the previous year (prior to the pandemic) in public transportation modes are getting smaller. In other words, the public phenomenon of avoiding physical contact with others has increased the utilization of automobiles and reduced the utilization of public transportation [
16].
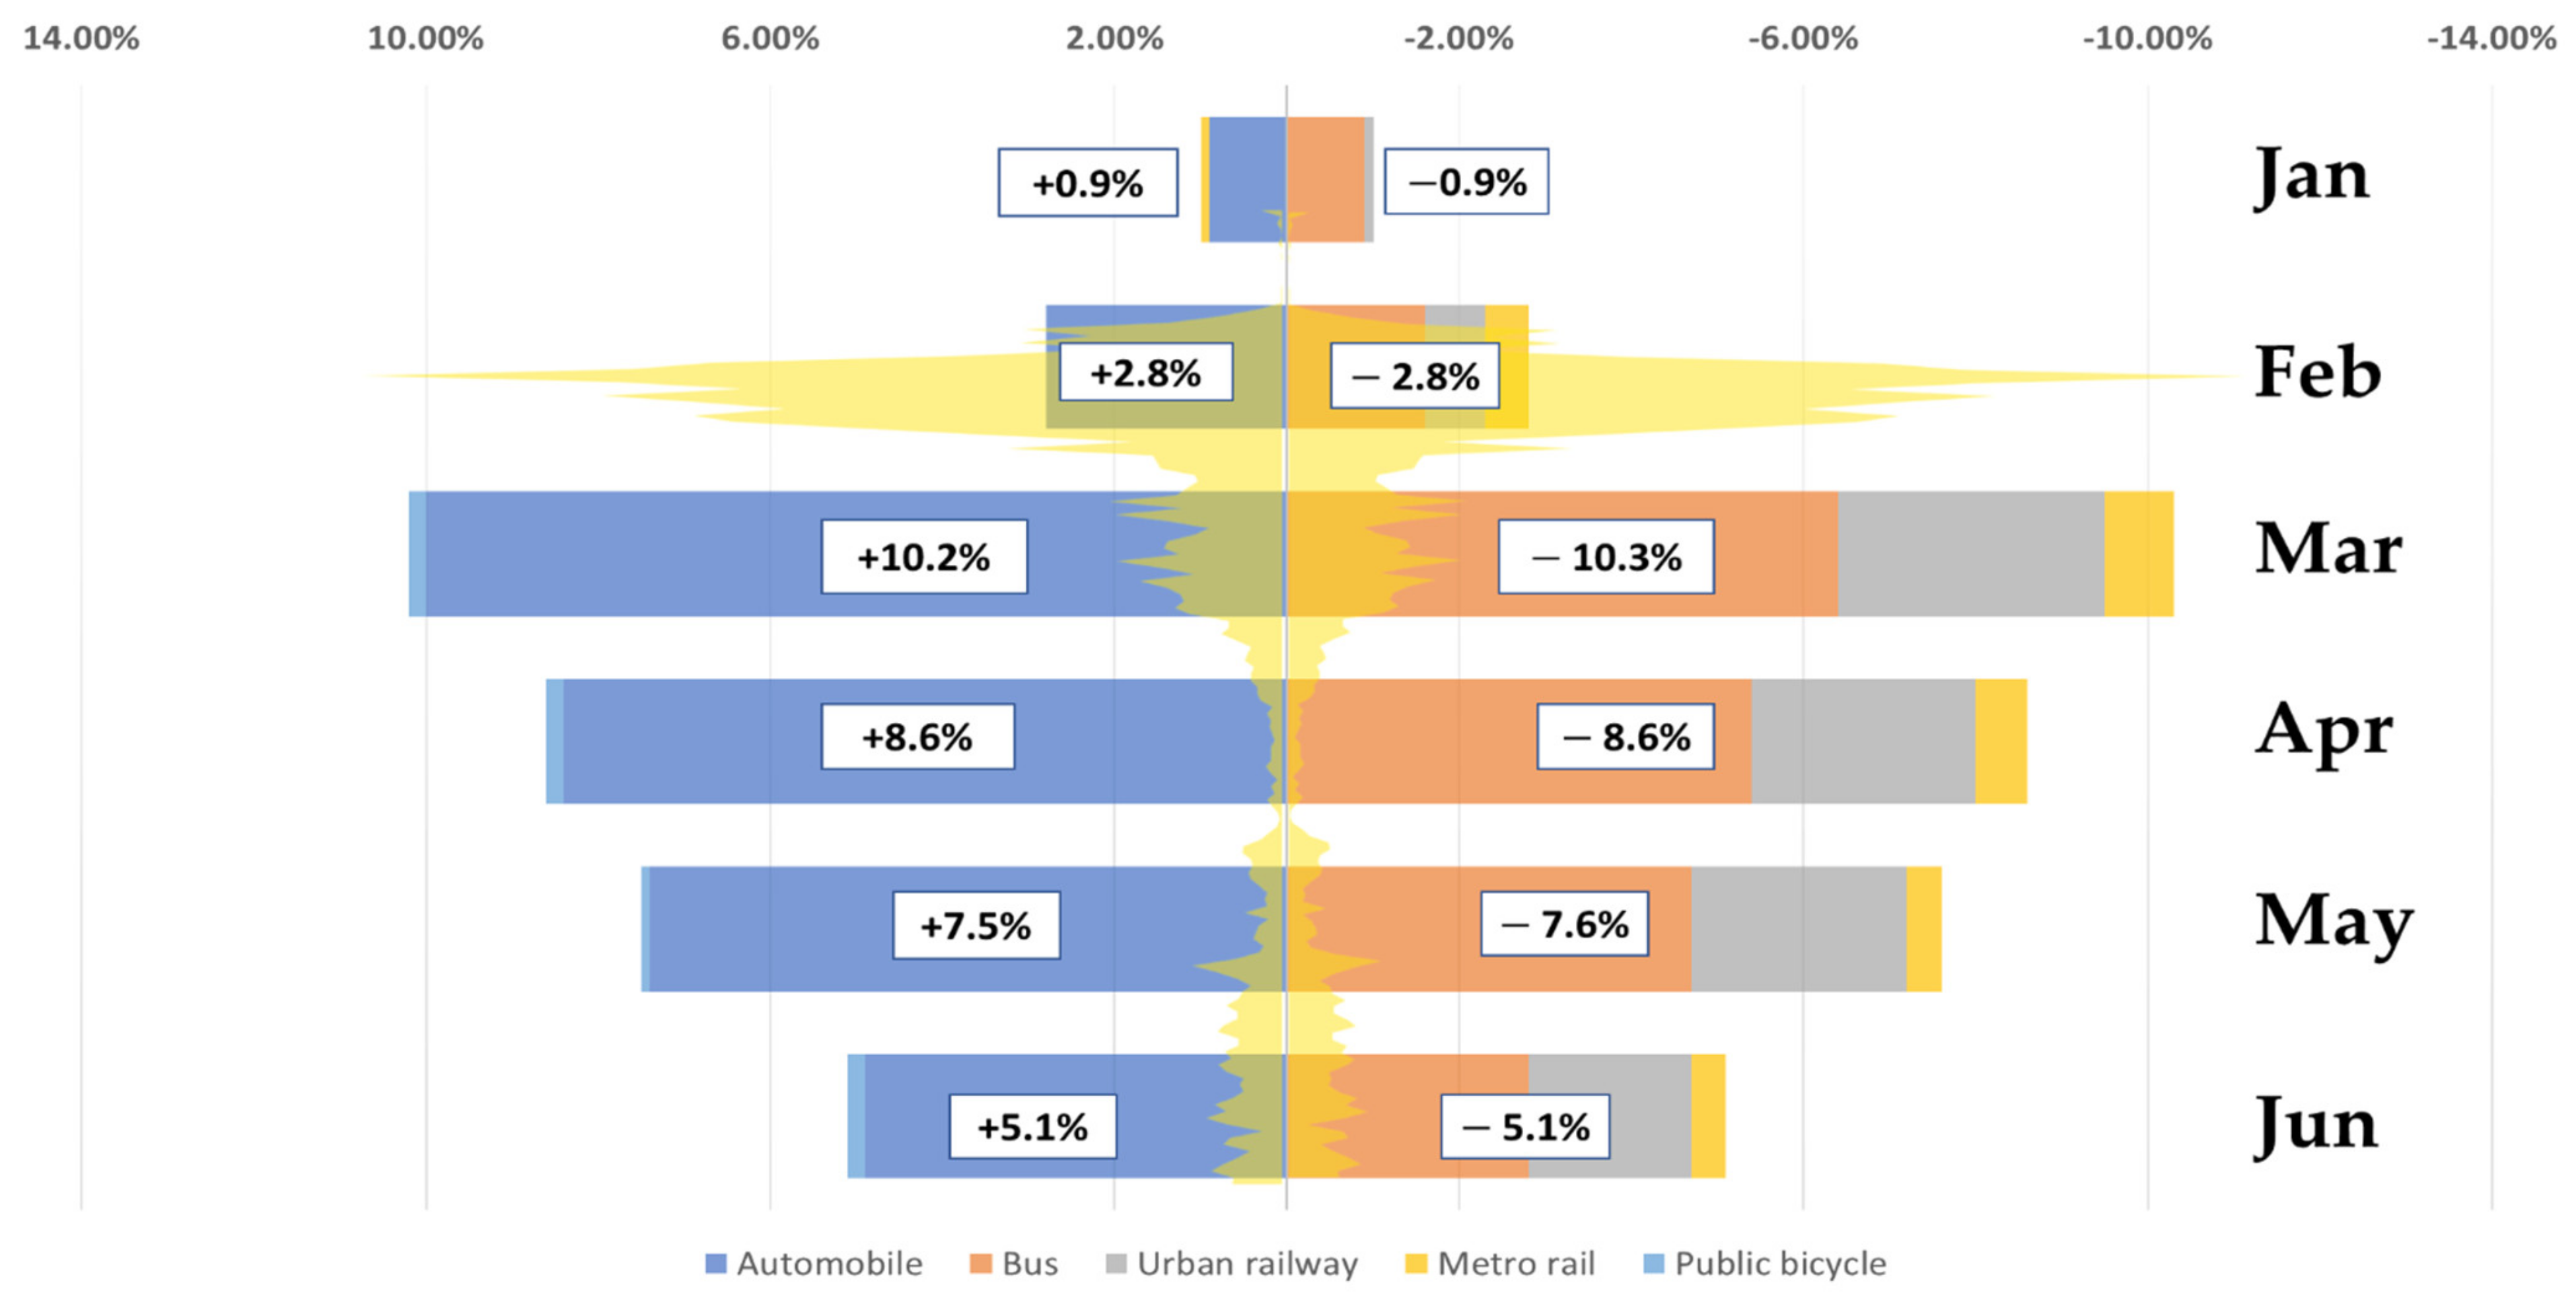
Figure 6 is a graph of the changes in the users’ monthly mode choices made through
Figure 5. The left-hand horizontal bar graph is the sum of auto and public bicycle increments, while the right-hand horizontal bar graph is the sum of bus, urban railway, and metro rail reductions. The utilization rate of mode choice changes increased approximately three times over the previous month as the number of confirmed COVID-19 people increases at the March 2020. It can be seen that the daily number of confirmed people has decreased since March 2020, and the utilization rate by modes of transportation has decreased in proportion as well. Through this, it can be confirmed that public transportation users switched to auto or public bicycle modes with relatively little contact among passengers.
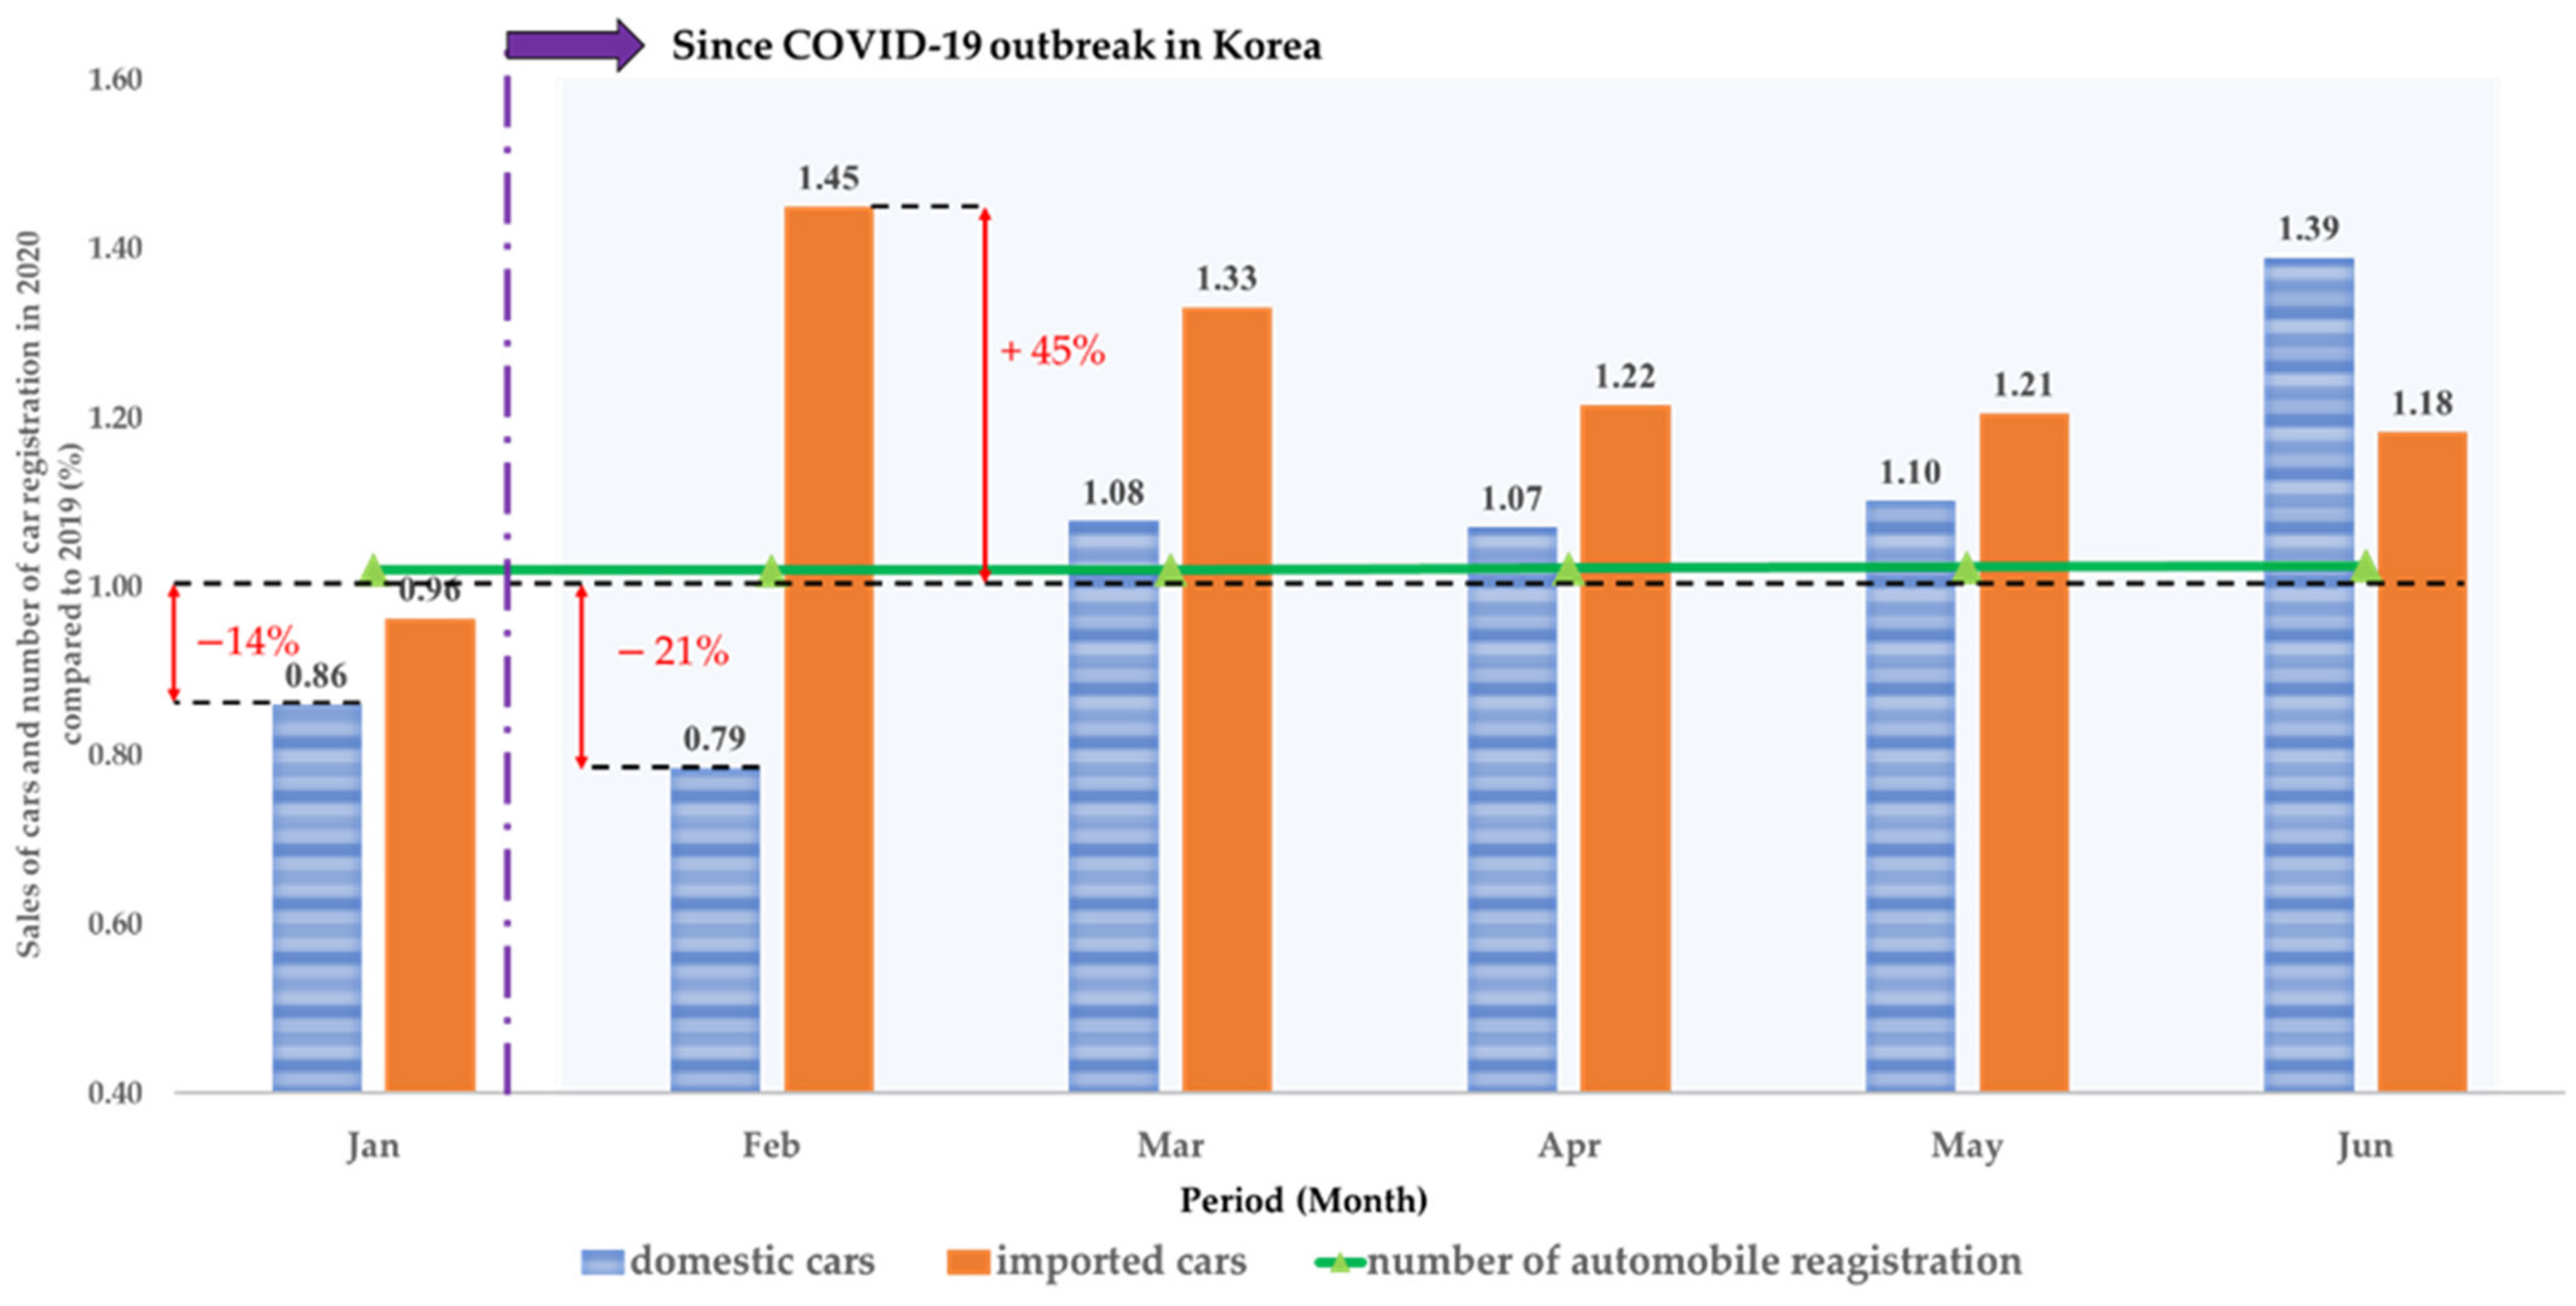
In the earlier sections, it was confirmed that the occupancy rate of passenger cars has recovered quickly when compared to other modes of transportation. Furthermore, the mode sharing rate of passenger cars in 2020 increased by approximately 5% when compared to that of 2019. In this study, the monthly sales performance of domestic cars and imported cars in Korea in 2019 and 2020 and the current status of the number of automobile registrations were analyzed.
Figure 7 shows the percentage of sales of cars and car registrations in Korea.
Since February 2020, when the first COVID-19 trend emerged, the number of domestic car sales in Korea increased every month when compared to that in the previous year. The monthly car sales of imported cars in Korea rose year-on-year in all analysis periods with the exception of January 2020. As of June 2020, sales of domestic cars in Korea rose 39% from 103,392 to 143,705 units when compared to that in 2019. During the same period, sales of imported cars in Korea increased by 18% from 9924 to 11,741 units. The number of automobile registrations in Korea increased in all months in 2020 when compared to that in the previous year. The analysis results of the contents can be found in
Table 8.
In 2020, when the COVID-19 outbreak occurred, the economic recession continued due to the global pandemic. Under these circumstances, the increase in car sales and registration numbers in Korea in 2020 confirms the increasing demand for passenger cars.
4. Discussion and Conclusions
In this study, we analyzed the changes in the travel behavior of travelers due to an infectious disease, namely the highly contagious COVID-19, in Seoul. Based on public data provided by the government, a paired sample t-test was employed to analyze and determine whether COVID-19 has affected the transportation mode choices of passengers. Using moving average techniques, it was easy to understand the overall changes in passenger usage by modes of transportation. The passenger occupancy rate for each means of transportation in 2020 when compared to that in 2019 was analyzed, and the current status of occupancy rate for each mode of transportation was determined on a monthly basis when compared to that in the previous year. Additionally, the monthly mode sharing rates were analyzed within the corresponding periods of the two years to determine whether the users’ choices of transportation modes have changed due to the COVID-19 outbreak.
The results of the paired sample t-test indicated that the usage of transportation changed due to the occurrence of COVID-19. Road traffic, railway traffic, and public bicycle ride patterns have changed as shown by the statistical significance measures. The increase in the number of public bicycle rides was the highest when compared to that in the previous year among all transportation modes, and it was proportional to the number of daily confirmed COVID-19 cases in Korea. Thus, it is concluded that public bicycles in Seoul serve as a significant mode of transportation in the event of the pandemic.
The analysis of the sharing rate of transportation indicated that the sharing rate of buses, urban railways, and metropolitan railways, which are traditional public transportation modes, decreased when compared to the mode sharing rates in the previous year due to the COVID-19 outbreak. Furthermore, an increase in the automobile sharing rate was identified, and it corresponded to the reduction in the public transportation sharing rate. Thus, it was concluded that passengers tried to avoid public transportation modes because they are associated with a high probability of having contact with others. However, travelers are found to prefer the private auto mode as they tend to offer a lower probability of contacting others. As supporting data, the monthly sales of automobiles in Korea and number of automobile registrations were presented and analyzed. Sales of both domestic and imported cars in Korea increased by a year-on-year basis since February 2020, when the COVID-19 outbreak started. It can be concluded that the switch of transportation mode from public transportation to passenger cars can be linked to the increase in sales of passenger cars.
According to the analysis of mode sharing and recovery rates during the COVID-19 outbreak, the auto mode sharing and recovery rate of passenger autos were the highest. The utilization and usage of public bicycle service, Ttareungyi, also increased. Thus, the congestion on the road is expected to be more severe than that of before the COVID-19 outbreak as the use of passenger cars have increased. Hence, there is a probability of increase in air pollution indices in urban areas. To mitigate this, the function and role of public bicycles as an alternative mode of transportation should be encouraged. The bias of passenger cars can be mitigated by increasing the use of public bicycles in the city. Expanding bicycle lanes in driveways and strengthening laws to enhance the safety of bicycle users, can be adopted to encourage the use of the alternative mode.
In the post-COVID-19 era, the traffic demand will recover to a certain degree. However, we predict that the demand will not recover fully with respect to the period prior to COVID-19. Significant percentages of population are now familiar with working from home or taking online classes, and many of them positively consider the new trend to be convenient. The pandemic has changed the travel behaviors radically in a relatively short period of time. The results from our paper can shed light on the new trend as an early evidence of such observations. The COVID-19 pandemic also have increased the movement in low-density areas. Prior to the pandemic, it was traditionally natural to expect high movements in high-density areas only. Through this, life patterns in high-density areas, where the number of businesses and workers are concentrated, are found to be replaced by non-face-to-face work, video conferences, and online classes, indicating significant travel behavioral changes. In this study, we were not able to analyze the entire data for 2020 due to the limitations associated with availability of public data. Furthermore, we were not able to obtain data related to telecommuting for businesses. Hence, it was not possible to analyze the changes in transportation behavior of passengers due to the introduction of telecommuting in businesses during the epidemic. COVID-19 has significantly impacted economy, culture, and art industries as a whole. Given that mode sharing rates of private autos and public bicycles are expected to increase, measures to ease traffic congestions and to increase the use of public bicycles should be performed to ensure smooth mode sharing transitions after the COVID-19 pandemic is over.


