Article

Spatial Distribution and Geographical Mechanism of Natural Resources in China under the Orientation of the New Economic Demands

1
Key Laboratory for Geographical Process Analysis and Simulation of Hubei Province, Central China Normal University, Wuhan 430079, China
2
School of Geographic Science, Xinyang Normal University, Xinyang 464000, China
3
School of Marxism, East China Normal University, Shanghai 200240, China
4
Research Institute for Smart Cities and Shenzhen Key Laboratory of Spatial Information Smart Sensing and Services, School of Architecture and Urban Planning, Shenzhen University, Shenzhen 518000, China
*
Authors to whom correspondence should be addressed.
Sustainability 2021, 13(14), 7956; https://doi.org/10.3390/su13147956
Submission received: 21 June 2021 / Revised: 8 July 2021 / Accepted: 8 July 2021 / Published: 16 July 2021
(This article belongs to the Section Sustainability in Geographic Science)

Abstract

:
The demand structure of resources for new economy is different from the traditional one in that its development may significantly change China’s economic location map and spatial pattern. Based on 343 administrative units of prefecture-level cities in China, this research constructs the measurement index system of terrestrial surface natural resources under the orientation of the new economic demands; this research mainly analyses the spatial distribution characteristics and geographical mechanism of natural resources by means of the spatial autocorrelation and spatial similarity calculation methods. The results show that: (1) The structure and endowment of natural resources under the orientation of the new economic demands need to be reexamined. The significance of a good environment and ecological resources has been highlighted. The coupling of resource elements better reveals the availability of natural resources. (2) The natural resources decrease from southeast to northwest, showing a pattern of “abundant in the south and east and scarce in the north and west”. Natural resources have a significant positive correlation in spatial distribution with two types of agglomeration: high-high agglomeration and low-low agglomeration, showing the local agglomeration feature of “high in the south and low in the north”. (3) Natural factors such as temperature, precipitation and altitude affect the spatial distribution of natural resources, with the temperature being the most significant. This indicates that the original natural environment and its role are the geographical mechanism for the formation and distribution of natural resources. The results could provide a reference for the development and the optimization of China’s new economy.

1. Introduction

The earth has entered the Anthropocene [1], and both the “Future Earth” plan (2014–2023) and “Change Our World: Sustainable development agenda: 2030” intend to address global environmental changes and promote global sustainable development [2,3,4]. A key challenge for human beings is the balance between development and sustainable use of natural resources [5]. The study on the relationship between the earth and human beings requires multidisciplinary cooperation to develop a coupling model of human-Earth systems. The results can provide suggestions for scientific and effective policies and measures to benefit present and future generations [6]. From the perspective of the social-ecological system [7], foreign scholars mainly focus on sustainable development research under the influence of human activities. These studies include the theoretical basis of sustainable development [8], research means and methodology research [9], research field transformation [10] and other basic research, which focus on the coupling of natural resource elements [11,12], the relationship between natural resources and sustainable development [13] and the relationship between environment, energy and sustainable development, etc. [14,15].
Thanks to the comprehensive survey of natural resources to serve the country’s strategic needs, China has been establishing a relatively systematic theoretical basis and research method system of resource science. The research consists of geography, ecology, resource science, environmental science and other disciplines, which focus on: ① Research on single elements of natural resources, such as resource carrying capacity [16], resource evaluation [17,18], human-water relationship, etc. [19,20]. ② Research on the coupling of resource elements, such as the effects from the exploitation of water and land resources on agricultural carbon emissions [21] and the spatial variation of water-energy nexus [22]. ③ The sustainable utilization of natural resources [23], the relationship between natural resources and economic growth [24], natural resource accounting and management [25,26], natural resource administration, etc. [27]. China has entered a new stage of high-quality development [28,29], and the new economy has become a new driving force for high-quality development [30]. The development and utilization of natural resources is an important source of economic development [31]. The new economy supported by information technology has a resource demand structure different from the traditional economy [32,33]. Regional external connection is an important channel to obtain external elements, which can weaken the restriction of local elements on regional development and promote the introduction of new products, new technologies and new industries irrelevant to the existing industrial base [34]. Relevant international academic research has noticed the changes in the resource demand structure caused by the development of the new economy [35,36]. The new economy originated from the analysis of changes in the US economic structure, and information technology is considered to be a key element to promote economic growth [37,38]. Economists believe that “information technology, the internet, ultra-high-tech companies and globalization had created a completely new type of economy” [39]. However, so far, there is no clear definition of the new economy [40,41].
To sum up, there are abundant researches on natural resources in China, but the demand-oriented natural resource structure and its spatial analysis based on the new economic development need to be deepened. Chinese mainland is vast in territory with high surface heterogeneity. The new economic development will probably lead to significant changes in China’s economic location map. The research scheme was constructed from three parts: ① This study selects available land resources, available water resources, available environmental resources, and available ecological resources to construct a comprehensive measurement index system of natural resources in the Chinese terrestrial surface from the perspective of the new economy. ② Through the coupling of resource elements to interpret the natural resource endowment. ③ According to the quantitative and spatial relationship between the endowment of natural resources and the natural environment, analyze the geographical mechanism of the spatial distribution of natural resources.
The innovation of this study has two aspects. Firstly, in the new economic form, the comprehensive measurement of resource endowment needs to be reexamined. The study will measure the comprehensive integration of natural resource endowment through the nonlinear coupling of natural resource elements. This is an attempt and exploration on the theory and method of the comprehensive integration of natural resources. Secondly, as for the research methods of geographic mechanism, the common methods are the econometric model and geographic detector.
The study attempts to innovate the research methods of geographical mechanism. According to the spatial similarity model, the spatial double-line similarity model is constructed. This method is used to reveal the spatial relationship between natural resources and natural environment, so as to analyze the geographical mechanism of the spatial distribution of natural resources. The results provide decision-making basis for optimizing the layout of new economic development and promoting high-quality development.

2. Research Ideas and Methods

2.1. Research Ideas

In the study, a comprehensive index system of natural resources is established to analyze the structure of natural resources and interpret the endowment of natural resources with the coupling of resource elements. Based on these, the study further analyzes the spatial distribution characteristics and geographical mechanism of natural resources in the Chinese terrestrial surface. Furthermore, this study reveals the geographical mechanism of the spatial distribution of natural resources in the Chinese terrestrial surface, from the quantitative and spatial relationship between natural resources endowment and the natural environment.
(1) The structure of natural resources is analyzed using the comprehensive index system. Natural resources play an essential role in economic development, and it affects the spatial distribution of economic development through the regional differences of resource structure [42]. Natural resources mainly affect the layout of economic development through location conditions. Different economic forms have different demands for the location conditions of natural resources, which shows the change in relative importance of different elements of natural resources. Due to human economic activities on the earth, water and land resources determine the layout of economic development. With the rapid development of transportation and communication technology and the echelon evolution of industrial economic form, the importance of energy and mineral resources to industrial layout tends to decline. However, due to the innovative characteristics of the new economy and the preference of high-tech talents for living environment, the importance of environment resources and ecological resources to industrial layout tends to rise. Based on the selected available land resources, available water resources, available environmental resources, and available ecological resources, we established a comprehensive measurement index system of natural resources in the Chinese terrestrial surface from the perspective of the new economy. The connotation and characterization methods of relevant indexes are listed in Table 1.
Based on the comprehensive index system of natural resources in the Chinese terrestrial surface of the demand orientation of the new economy, this study develops a method for calculating the endowment degree of natural resources: ① Available land resources in this study refer to agricultural land and construction land. By calculating the relationship between the proportion of available land resources in a region and the proportion of available land resources, the endowment degree of available land resources in a certain area can be measured. ② Available water resources refer to the amount of water available in a certain area under given natural conditions. The total amount of water resources is selected to represent the available water resources, and the endowment degree of available water resources in a certain area is measured by calculating the proportional relationship between the regional average water resources and the national average water resources. ③ Considering the typicality of indexes and the availability of data, atmospheric environmental resources are used to characterize the available environmental resources. This is measured by AQI (Air Quality Index). The larger the value, the higher the degree of air pollution. Based on AQI, the calculation formula of the endowment degree of available environmental resources is constructed: X21 = (Upper limit value of good air quality grade—The actual AQI value of the region)/Upper limit value of good air quality grade = (100—The actual AQI value of the region)/100. ④ Ecological land has an important ecosystem service function, which is the source of ecological value. Based on the classification method of ecological land from Long et al. [43], the classification of ecological land is determined, which is used to characterize the available ecological resources. By calculating the relationship between the proportion of regional ecological land and the proportion of national ecological land, we can measure the endowment degree of available ecological resources in certain areas.
(2) The endowment of natural resources is interpreted by the coupling of resource elements. Resource endowment is the basic way for natural resources to influence economic distribution [42,44]. However, due to the different characteristics of natural resource elements, the comprehensive measurement of resource endowment needs to be reexamined. In the traditional economic form, most of the elements of natural resources, which are part of the location conditions, are not completely alternative. The comprehensive integration of resource endowment can be measured by the weighted sum of the elements of natural resources. In the new economic form, most of the elements of natural resources are completely non-alternative, and it has a “short board effect” on economic development and industrial layout [45]. It is necessary to measure the comprehensive integration of natural resource endowment through the nonlinear coupling of natural resource elements. The geographical system is a complex nonlinear system, and the natural resource elements constructed as a geographical environment should have a nonlinear correlation [46]. Therefore, the abundance of natural resources is used to represent the endowment of natural resources:
X 1 = x 11 × x 12
X 2 = x 21 × x 22
X = X 1 X 2 =   x 11 × x 12 × x 21 × x 22
where: X1 is water and land resources, which stands for the endowment degree of water and land resources in a certain region, and is measured through the nonlinear coupling of available land resources and available water resources. X2 is ecological environment resources, which stands for the endowment degree of ecological environment resources in a certain region, and is measured through the nonlinear coupling of available environmental resources and available ecological resources. X is natural resources, which stands for the endowment degree of natural resources in a certain region, and is measured through the nonlinear coupling of water and land resources and ecological environment resources (Table 1). Based on this, spatial autocorrelation and spatial similarity calculation model are used to analyze the spatial distribution characteristics and geographical mechanism of natural resources in the Chinese terrestrial surface.

2.2. Research Method

2.2.1. The Spatial Autocorrelation Model

The spatial autocorrelation model is used to analyze the spatial distribution characteristics of natural resources in the Chinese terrestrial surface. Taking prefecture-level cities as the smallest spatial unit, China is divided into 343 administrative units (excluding Hong Kong, Macao and Taiwan) [47]. The global spatial autocorrelation method is used to test whether there is a spatial autocorrelation of natural resources in the Chinese terrestrial surface. The local spatial autocorrelation method is used to test the local spatial agglomeration degree of natural resources in the Chinese terrestrial surface. The global spatial autocorrelation is measured by the Moran index or Geary coefficient. Moran’s I is chosen in this study, and can be calculated from:
I = i = 1 n j = 1 n w i j x i x ¯ x j x ¯ s 2 i = 1 n j = 1 n w i j
where: Moran’s I is in the range of [–1, 1]; xi and xj are the endowment degree of natural resources of area i and j, respectively; x ¯ means the average abundance of natural resources; n is the 343 units; wij is the spatial weight; S2 is the variance of the attribute value. For Moran’s I, it’s necessary to test whether there is spatial autocorrelation of natural resources in the Chinese terrestrial surface through standardized statistic Z.
Local Moran’s I is used to explore the local spatial correlation of natural resources. The local Moran’s I is calculated:
I i = x i x ¯ s 2 j = 1 w i j x j x ¯
where: Ii represents the local Moran index. When local Moran’s I > 0 and pass the significance test, it indicates that there are high-high concentration and low-low concentration. When local Moran’s I < 0 and pass the significance test, it indicates that there are high-low concentration and low-high concentration.

2.2.2. The Line Group Similarity Model

The line group similarity model is used to analyze the spatial differentiation mechanism of natural resources in the Chinese terrestrial surface. Referring to the related research results, the spatial double- line similarity can be calculated from two aspects: the double-line spatial relation and the double-line geometry [48]. The spatial relation can be calculated based on the direction relation similarity. The formula is as follows:
S I M ¯ d i r = cos θ 1 θ 2
where: θ1 and θ2 are the average direction angle of the two lines, respectively, which can be calculated with the angle from the starting-point and the ending-point of the line. If the angle of the two straight lines is 90 degrees, the direction relation similarity of them is 0; and if it is 0 degrees or 180 degrees, the direction relation similarity is 1. The calculation formula of geometric similarity is as follows:
S I M ¯ n u o = 1 n u o 1 n u o 2 / max n u o 1 , n u o 2
where: nuo1 and nuo2 are the tortuosities of the two lines, respectively. The calculation formula of tortuosity is nuo = L/S. L is the actual length of the line, and S is the length of the straight line. When calculating the spatial similarity, the weights of the spatial relationship and geometric shape of the two lines are both 0.5. The spatial double-line similarity model is constructed:
S I M = 0.5 × S I M ¯ d i r + 0.5 × S I M ¯ n u o
where: SIM is the spatial similarity, in the range of 0 to 1. Large SIM means high similarity.
The essence of natural resources is the function spillover of the physical geographic system. In the physical geography system, geology, geomorphology, meteorology and climate are considered as the primary geography elements, which are more decisive to the system structure and function [49,50]. Based on this, the isolines with eigenvalues and the optimal analog isolines such as X1, X2 and X are selected for similarity analysis. The isolines with eigenvalues include average altitude (representing geological landform), annual precipitation and the average temperature in January (representing meteorological climate). The higher the similarity, the more significant the effect of the former on the latter will be.

3. Data Sources

Data include attribute data and spatial data. (1) Attribute data. The data of available land resources and ecological land usage in 2016 come from the second national land survey and the annual national land change survey data on the land survey results-sharing application service platform of the Ministry of Natural Resources of the People’ Republic of China (http://tddc.mnr.gov.cn/ to Login, accessed on 16 September 2019). The total amount of water resources in 2016 is from the provincial Statistical Yearbook in 2017 and the water resources bulletin in 2016. AQI of 2016 is from Ministry of Ecology and Environment of the People’ Republic of China (http://www.mee.gov.cn/, accessed on 5 May 2019). Part of the missing data is from the official website of the local environmental protection department. The annual precipitation and January average temperature data of 2016 are from the China Meteorological Data Service Centre (http://data.cma.cn/, accessed on 23 September 2019). (2) Spatial data. The administrative map and boundary of the research area are taken from the National Geomatics Center of China with the scale of 1:4,000,000; and the DEM (digital elevation model) is downloaded for free from the websites: “Geospatial Data Cloud” (http://www.gscloud.cn/, accessed on 4 April 2018), its spatial resolution is 30 × 30 m.

4. Results

4.1. Spatial Pattern of Terrestrial Surface Natural Resources in China

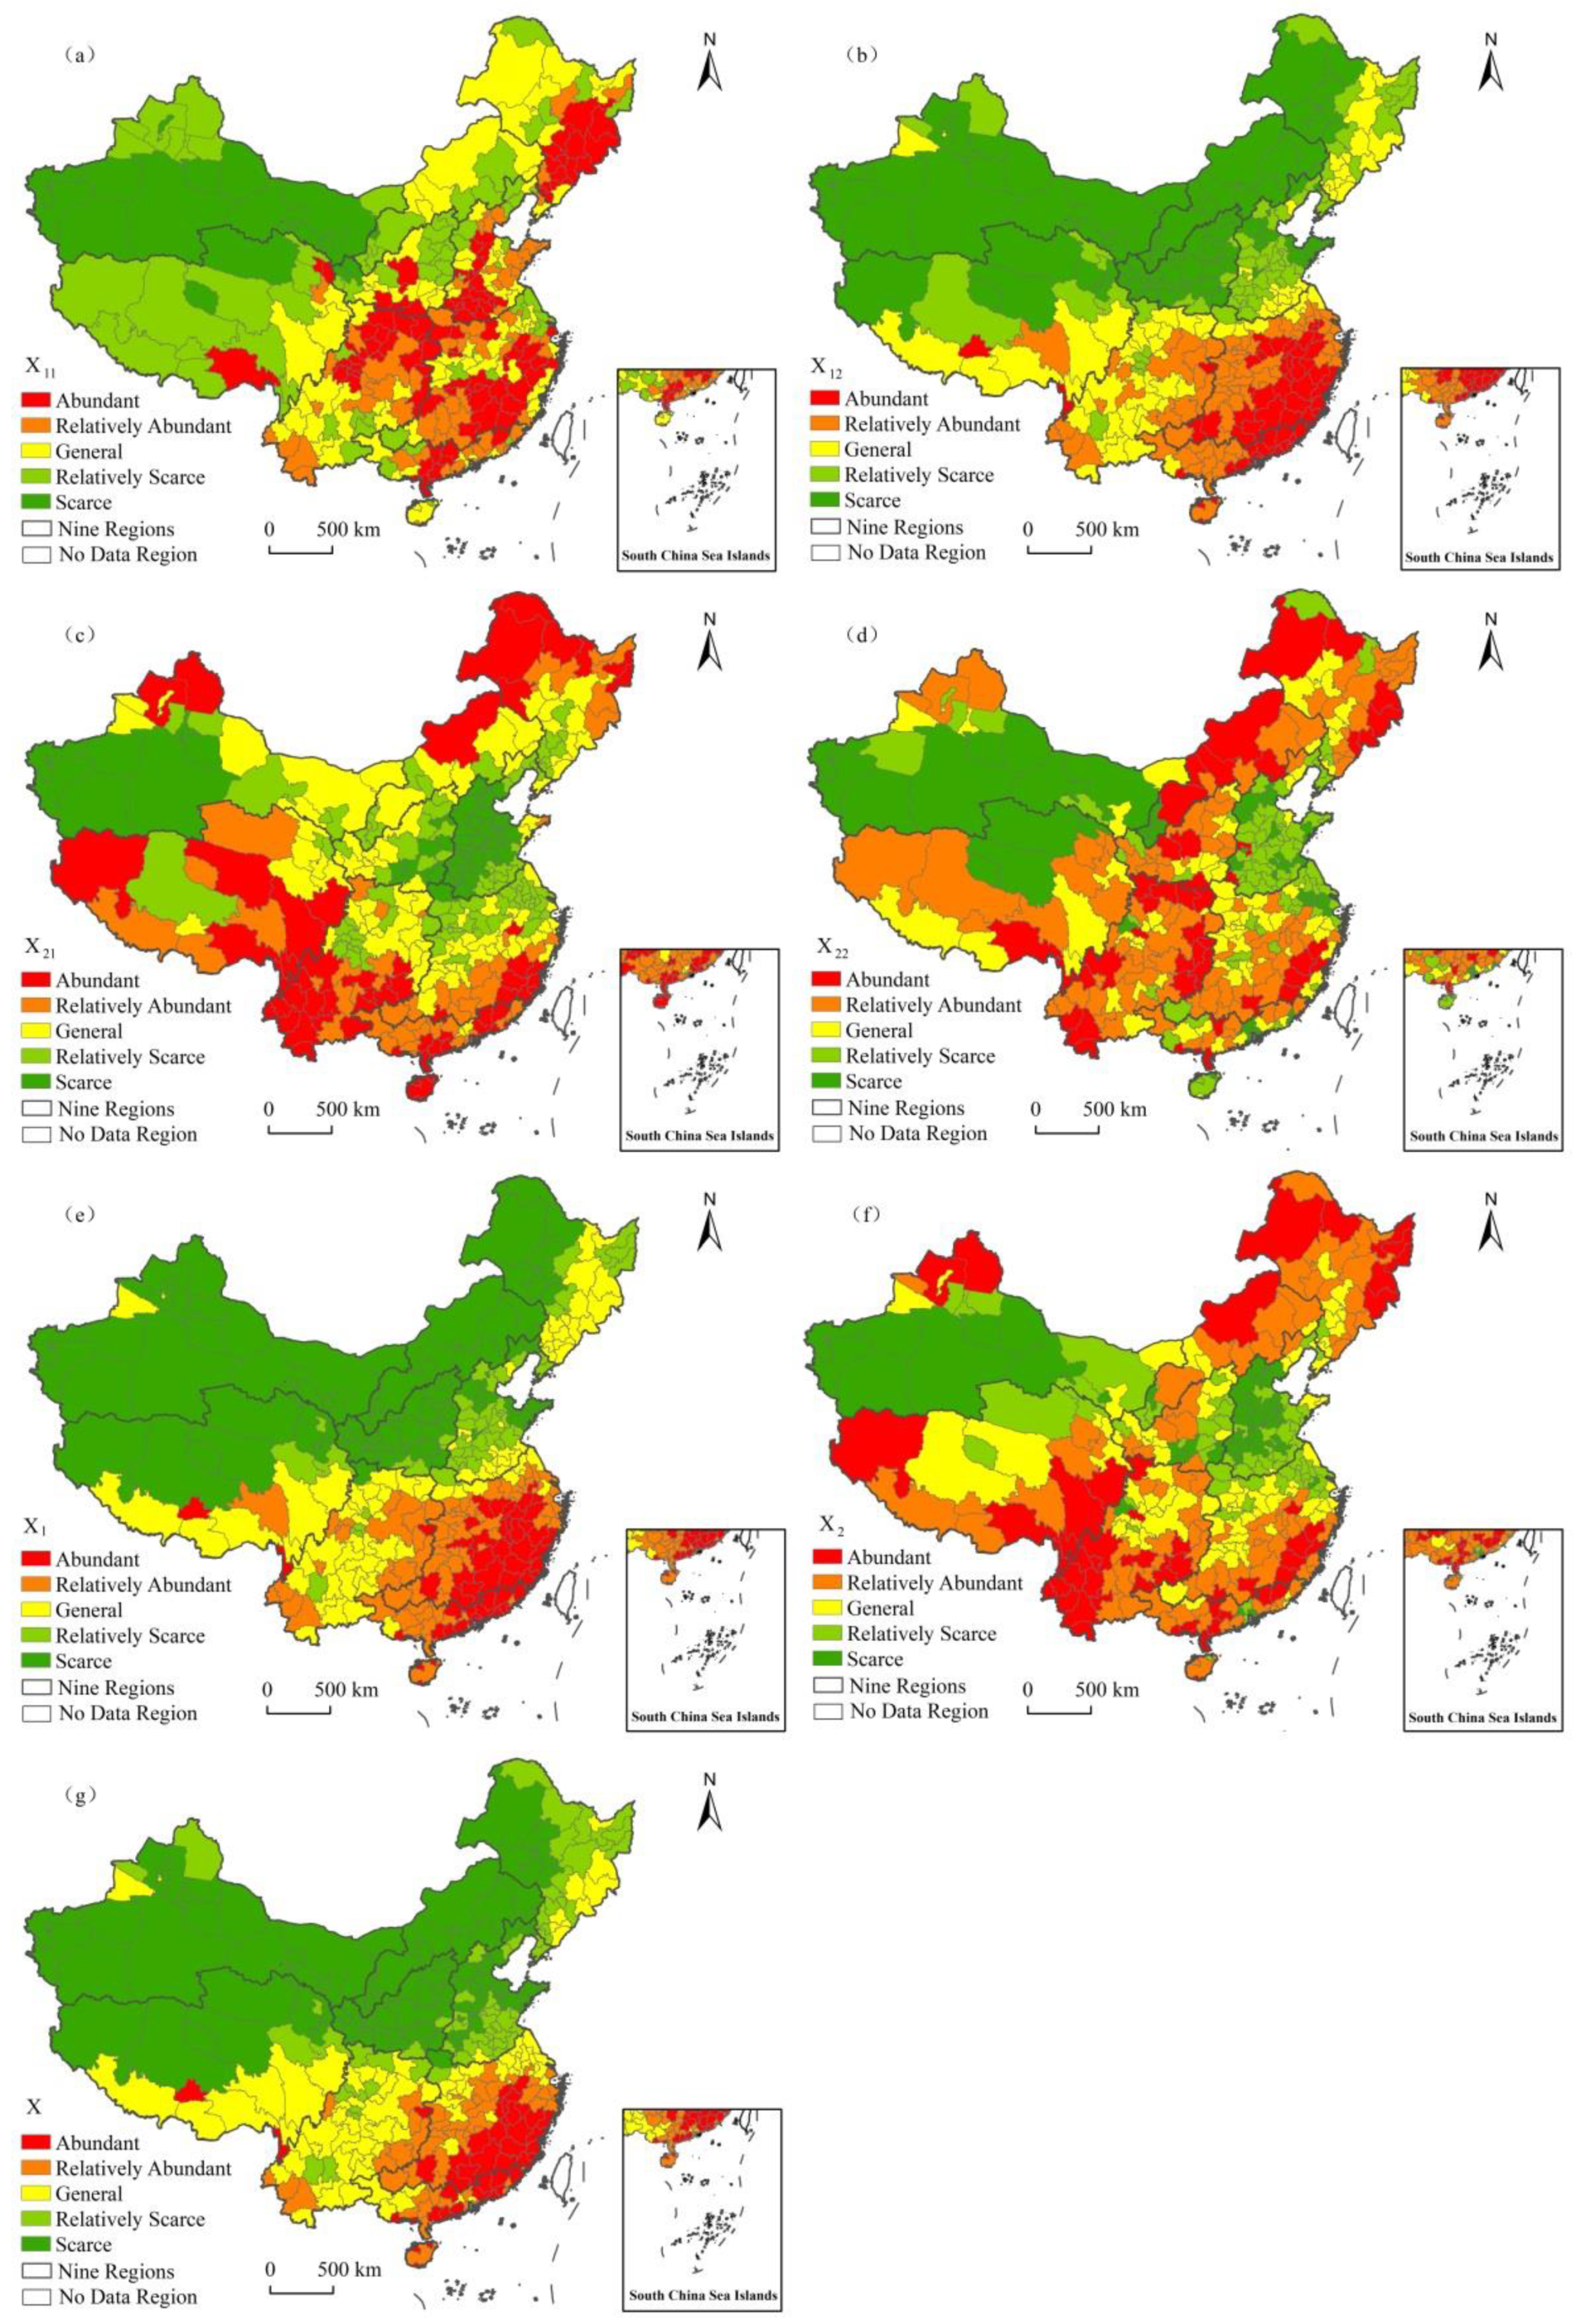
4.1.1. Geographical Distribution Characteristics of Natural Resources

Based on the ArcGIS 10.2, the natural breakpoint method is used to visualize the seven indexes, and the endowment degree of various natural resources is divided into five levels: higher value, high value, middle value, low value and lower value. It represents abundant, relatively abundant, general, relatively scarce and scarce, respectively (Figure 1). In this study, the spatial distribution characteristics of the seven indexes will be described from nine regions of terrestrial surface, namely Northeast China, North China, Southeast China, South China, the Inner Mongolia region, the LongShanJin region (Gansu, Shaanxi and Shanxi), Southwest China, Northwest China and the Qinghai-Tibet region [51].
(1) The spatial distribution of the available land resources in China is unbalanced, showing the geographical distribution pattern of “more in the east and less in the west” (Figure 1a). Among them, the most abundant land resources are mainly distributed in the east of Northeast China, the southern and central part of North China, the eastern and southern part of Southeast China, the central part of South China, the southern and central part of the LongShanJin region, and the northern periphery of Southwest China, Linzhi City of Tibet Autonomous Region, Xining City and Haidong City of Qinghai Province. Northwest China is the scarcest.
(2) The available water resources decrease from south to north, showing a feature of “more in the south and east, less in the north and west” (Figure 1b). The higher-value areas of available water resources are concentrated in the east and southwest of Southeast China and the east of South China. The sporadic distribution areas mainly include Fangchenggang City of Guangxi Zhuang Autonomous Region, Haikou City, Danzhou City and Sanya City of Hainan Province, Zhangjiajie City of Hunan Province, Lhasa City of Tibet Autonomous Region and Nujiang of the Lisu Autonomous Prefecture of Yunnan Province, indicating that these areas are the most abundant in available water resources. The regions with scarcest available water resources are distributed in the Inner Mongolia region, the LongShanJin region, Northwest China, the west of Northeast China, the north of the Qinghai-Tibet region and a small part of North China.
(3) The available environmental resources show a pattern of “more in the north and south, but less in the middle region” (Figure 1c). Regions having the most abundant available environmental resources are located in northern and southern China. The north includes the west of Northeast China, the north of the Inner Mongolia region, Altay Prefecture and Tacheng Prefecture of Xinjiang Uygur Autonomous Region, and the south includes the southeast of Southeast China, the east, central, and south of South China, the south of Southwest China, the southeast of the Qinghai-Tibet region, Yushu Tibetan Autonomous Prefecture of Qinghai Province and the Ngari Prefecture of Tibet Autonomous Region. The areas with the least available environmental resources are distributed in North China (except for parts of southeast and parts of the Bohai Rim), the southwest of Northwest China and the southeast of the LongShanJin region.
(4) The regions with higher-value, high-value and medium-value of available ecological resources are distributed in an inverted “T” shape, and regions with the low-value and lower-value are mainly distributed on the east and west sides of the inverted “T” shape (Figure 1d). Among them, the areas with the most abundant ecological resources are mainly distributed in the east and west of Northeast China, the north and middle of the Inner Mongolia region, the southeast of Southeast China and the peripheral areas of Southwest China, as well as Anyang City and Pingdingshan City of Henan Province, Yan’an City and Shangluo City of Shaanxi Province, Qingyang City of Gansu Province, Linzhi City of the Tibet Autonomous Region, Nujiang of the Lisu Autonomous Prefecture of Yunnan Province, Zhanjiang City of Guangdong Province, Wuzhou City, Qinzhou City and Beihai City of Guangxi Zhuang Autonomous Region. The regions with the least available ecological resources are distributed in Northwest China (except the northwest), the north of the Qinghai-Tibet region, a small part of the southwest of the Inner Mongolia region and a small part of North China, Southeast China and South China. It is worth noting that Chengdu City of Sichuan Province is the only region with the least available ecological resources in Southwest China.
(5) Water and land resources show a distribution pattern of “more in the south and less in the north, more in the east and less in the west” (Figure 1e). The north of China mainly includes regions with lower-value, low-value and medium-value. The resource endowment degree of most regions is lower-value, indicating that the water and land resources in the north are scarcest. The south of China mainly includes higher-value, high-value and medium-value regions, indicating that the water and land resources in the south are better than those in the north, and the southeast coastal areas are especially abundant in water and land resources.
(6) The distribution pattern of ecological environment resources is consistent with the available ecological resources. Regions with higher-value, high-value and medium-value are distributed in an inverted “T” shape, and low-value and lower-value areas are mainly distributed on the east and west sides of the inverted “T” shape. There are differences in the distribution range of different regions (Figure 1f). It is also worth noting that Chengdu City of Sichuan Province is the only region with the scarcest ecological environment resources in Southwest China.
(7) Natural resources decrease from south to north, showing the distribution characteristics of “more in the south and east and less in the north and west” (Figure 1g). The north of China mainly includes three types of areas: lower-value, low-value and medium-value areas. Most areas are lower-value areas, indicating that most areas in northern China lack natural resources. The south of China mainly includes three types of higher-value, high-value and medium-value areas, indicating that southern China has more natural resource than northern China, and the southeast coastal region has the most abundant natural resources. The comparison indicates that the distribution of available water resources, water and land resources and natural resources are consistent. According to the “short board effect” theory, it can be known that the available water resources have a “short board effect” on the endowment of water and land resources and the endowment of natural resources. In the new economic form, most of the natural resource elements are “completely non- alternative.” It can be seen that the effect of available water resources on economic development and industrial layout has a “short-board effect”. Under the orientation of the new economic demands, we must fully consider the impact of the endowment of available water resources on the development of the new economy and the optimization of its layout, especially in the process of economic development to strengthen the sustainable use and comprehensive management of available water resources.

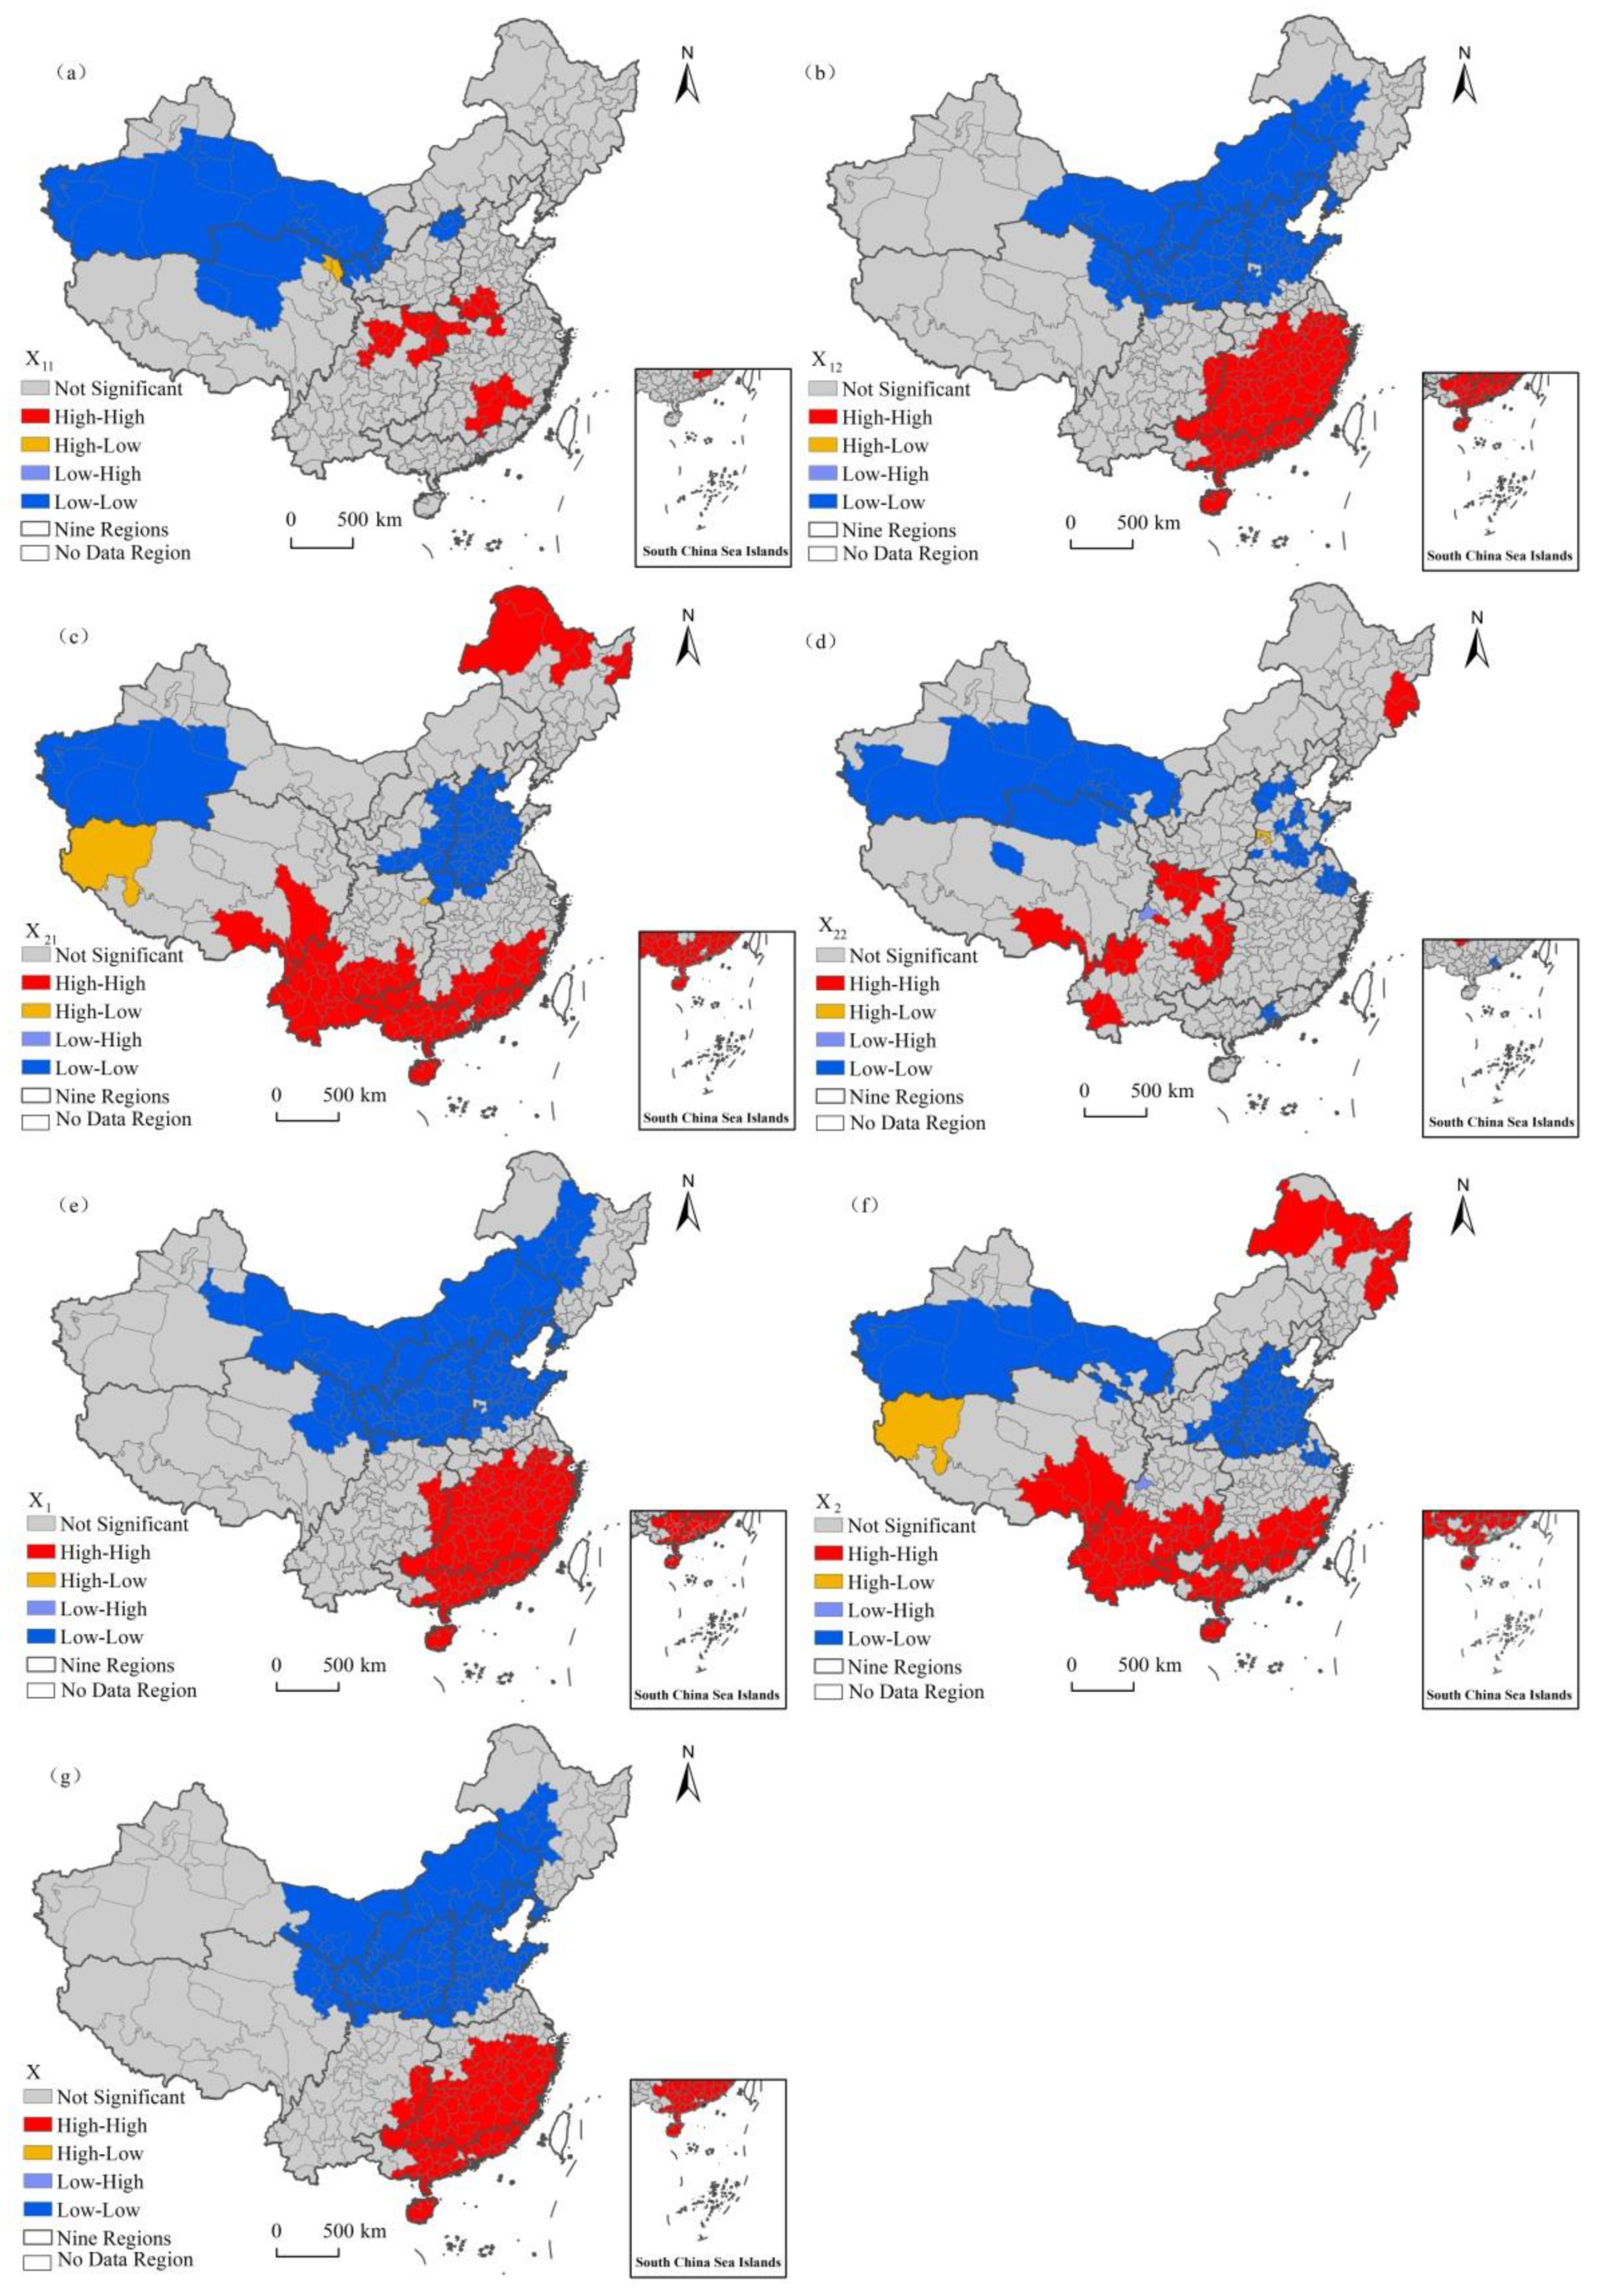
4.1.2. Spatial Agglomeration Characteristics of Natural Resources

To further analyze the spatial relevance of various natural resources, ArcGIS 10.2 was used for global autocorrelation analysis. The results show that Moran’s I values are greater than zero and pass the significance test (p = 0.01), which indicates that there is a significant positive correlation between natural resources in the Chinese terrestrial surface. Furthermore, the local spatial autocorrelation method is used to reveal the local agglomeration characteristics of the seven indexes of natural resources in the Chinese terrestrial surface (Figure 2).
(1) The available land resources are “high in the southeast and low in the northwest” (Figure 2a). Areas of the high-high agglomeration are in the southwest of North China, the north of Southwest China, the southeast and northwest of Southeast China, indicating that these areas and the surrounding areas have a high abundance of available land resources. Areas of low-low agglomeration are in Northwest China (except Altay Prefecture, Karamay City, Tacheng Prefecture, Bortala Mongol Autonomous Prefecture, Ili Kazak Autonomous Prefecture, Bayan nur), the north of the Qinghai-Tibet region, the southwest of the Inner-Mongolia region and the northwest and northeast of the LongShanJin region, which indicates low abundance of available land resources in these regions and surrounding areas. It is worth noting that Xining City and Haidong City are in high-low agglomeration areas, indicating that the two areas have a high abundance of available land resources, while the surrounding areas have a low abundance. It is found that areas of high-high agglomeration are relatively scattered, and the distribution range is small, which forms a number of areas with high-value. The areas of low-low agglomeration are distributed in a large range, forming low-value areas with Northwest China as the core.
(2) The available water resources are “high in the South and low in the north” (Figure 2b). Areas of high-high agglomeration are in Southeast China (except northwest and northeast), South China (except Nanning City, Chongzuo City and Baise City), Zhangjiajie City, Huaihua City and Xiangxi Tujia and Miao Autonomous Prefecture. Areas of low-low agglomeration are in the Inner Mongolia region, the LongShanJin region, North China (except the South and Anyang City of Henan Province), central and south of Northeast China, the east of Northwest China, the northeast of the Qinghai-Tibet region and Longnan City of Gansu Province. It is found that the distribution range of areas of high-high agglomeration is smaller than that of the areas of low-low agglomeration. The high-high agglomeration areas form high-value areas with “southeast -South China” as the core, and the low-low agglomeration areas form low-value areas with “Inner Mongolia–LongShanJin region” as the core.
(3) The available environmental resources are characterized by “high in the north and south, low in the middle region” (Figure 2c). Areas of high-high agglomeration are in the south of Southeast China, South China (except Guangzhou City and Foshan City), the south of Southwest China, southeast of the Qinghai-Tibet region, west and north of Northeast China. Areas of low-low agglomeration are in most parts of North China, eastern and southern parts of the LongShanJin region, Xinyang City and Nanyang City of Henan Province, Xiangyang City of Hubei Province and the southwest of Northwest China. It is found that areas of high-high agglomeration form two high-value areas in the north and south, and areas of low-low agglomeration form two low-value areas in the east and west of China. At the same time, it is worth noting that the Ngari Area and Shennongjia Forestry Distric are in the high-low agglomeration areas, which indicates that the two areas have a high abundance of available environmental resources, while the surrounding areas have a low abundance.
(4) The available ecological resources show the local agglomeration characteristics of “high in the north and south, and low in middle region” (Figure 2d). Areas of high-high agglomeration are scattered with an obvious north-south difference. Most of them are located in Southwest China and are distributed in the peripheral areas of Southwest China. In addition, Linzhi City of Tibet Autonomous Region, adjacent to Southwest China, is also a high-high agglomeration area. In the east of Northeast China, a small area of high-high agglomeration areas has been formed, including Yanbian Korean Autonomous Prefecture of Jilin Province and Mudanjiang City of Heilongjiang Province. Areas of low-low agglomeration vary from the east to the west, and the west is concentrated and distributed in a large range, mainly including most of Northwest China (except the northwest, the east and Wuwei City), Haixi Mongolian and Tibetan Autonomous Prefecture, Haibei Tibetan Autonomous Prefecture, Yinchuan City and Shizuishan City of Ningxia Hui Autonomous Region. The east of China is relatively scattered, most of which are located in North China. The other two low-low agglomeration areas are in the northeast of Southeast China and Central of South China. It is worth noting that Anyang City is a high-low agglomeration area, indicating that the available ecological resources are abundant in Anyang City, while the abundance of surrounding areas is low. Chengdu City of Sichuan Province is a low-high area, indicating that the available ecological resources abundance of Chengdu is low, while the surrounding areas are high.
(5) The spatial distribution of water and land resources is characterized by “high in the South and low in the north” (Figure 2e). Areas of high-high agglomeration are in Southeast China (except the northern marginal areas), South China (except Nanning City, Chongzuo City and Baise City of Guangxi Zhuang Autonomous Region), Enshi Tujia and Miao Autonomous Prefecture of Hubei Province, Zhangjiajie City, Huaihua City and Xiangxi Tujia and Miao Autonomous Prefecture of Hunan Province. Areas of low-low agglomeration are distributed in the Inner-Mongolia region, the LongShanJin region, North China (except southeast and Anyang City of Henan), the east and middle of Northwest China, middle of Northeast, northeast of the Qinghai-Tibet region and Longnan City of Gansu Province. By comparison, the distribution range of areas of high-high agglomeration is smaller than that of areas of low-low agglomeration. The areas of high-high agglomeration form high-value areas with “Southeast China-South China” as the core. The areas of low-low agglomeration form low-value areas with the core of “Inner Mongolia-LongShanJin region”. It is worth noting that the local agglomeration of water and land resources is consistent with that of available water resources.
(6) The spatial distribution of ecological environment resources is characterized by “high in the north and south, low in the middle region” (Figure 2f). There are two high-value areas within the areas of high-high agglomeration. The south of China includes the south of Southeast China, the west and south of South China, the south of Southwest China and the southeast of the Qinghai-Tibet region. The north is mainly the north of Northeast China. Areas of low-low agglomeration include two low-value areas in the east and west of China. The east of China includes North China (except northeast, Yantai City and Weihai City of Shandong Province, Huainan City of Anhui Province), Southeast of the LongShanJin region, northeast of Southeast China and Nanyang City of Henan Province. The west of China includes Northwest China (except northwest and southeast), Yinchuan City and Shizuishan City of Ningxia Hui Autonomous Region, and Haibei Tibetan Autonomous Prefecture of Qinghai Province. It is worth noting that Ali Prefecture of Tibet Autonomous Region is a high-low agglomeration area, which indicates that the abundance of eco-environmental resources in this region is high, while that in the surrounding areas is low. Chengdu City is a low-high agglomeration area, which indicates that the abundance of ecological environment resources in this area is low, while the surrounding areas is high.
(7) The spatial agglomeration characteristics of natural resources are “high in the south and low in the north” (Figure 2g). Areas of high-high agglomeration are distributed in Southeast China (except the northern marginal areas), South China (except Dongguan City and Foshan City of Guangdong Province, Nanning City, Chongzuo City and Baise City of Guangxi Zhuang Autonomous Region), Qiandongnan Miao and Dong Autonomous Prefecture of Guizhou Province, Zhangjiajie City, Xiangxi Tujia and Miao Autonomous Prefecture and Huaihua City of Hunan Province. Areas of low-low agglomeration are distributed in the Inner-Mongolia region, the LongShanJin region, North China (except the southeast), the east of Northwest China, the central and south of Northeast China, the northeast of the Qinghai-Tibet region, Longnan City of Gansu Province and Nanyang City of Henan Province. It is found that the distribution range for areas of high-high agglomeration is smaller than that for areas of low-low agglomeration. The areas of high-high agglomeration form high-value areas with “Southeast China-South China” as the core. The areas of low-low agglomeration form low-value areas with “Inner Mongolia-LongShanJin region” as the core.

4.2. Geographical Mechanism of the Spatial Distribution of Natural Resources

4.2.1. Quantitative Relationship between the Endowment of Natural Resources and the Natural Environment

Taking X1 (endowment degree of water and land resources), X2 (endowment degree of ecological environment resources) and X (endowment degree of natural resources) as dependent variables, and taking the average temperature in January, annual precipitation and average altitude as independent variables, to conduct the regression analysis (The results all pass the 0.01 significance test), and then explain the extent of the effect of natural environment elements on X1, X2, and X. The results are as follows: ① Among the natural environment elements such as temperature, precipitation, and altitude, the correlation coefficients between annual precipitation and the endowment of water and land resources, the endowment of ecological environment resources and the endowment of natural resources, are the largest, which are 0.911, 0.325 and 0.875, respectively. It shows that precipitation has the most significant effect on the endowment of water and land resources, the endowment of ecological environment resources, and the endowment of natural resources. At the same time, among X1, X2 and X, the endowment of water and land resources, natural resource endowment, and the endowment of ecological environment resource in descending order were affected by precipitation. ② The correlation coefficient shows that the annual precipitation has the greatest impact on the endowment of water and land resources, ecological environment resources and natural resources, followed by the average temperature, and the average altitude is the last. ③ The correlation coefficients of natural resource endowment with annual precipitation, average temperature in January and average altitude are 0.875, 0.683 and 0.220, respectively, indicating that the endowment of natural resources is most significantly affected by precipitation, followed by temperature, and altitude has the least effect.

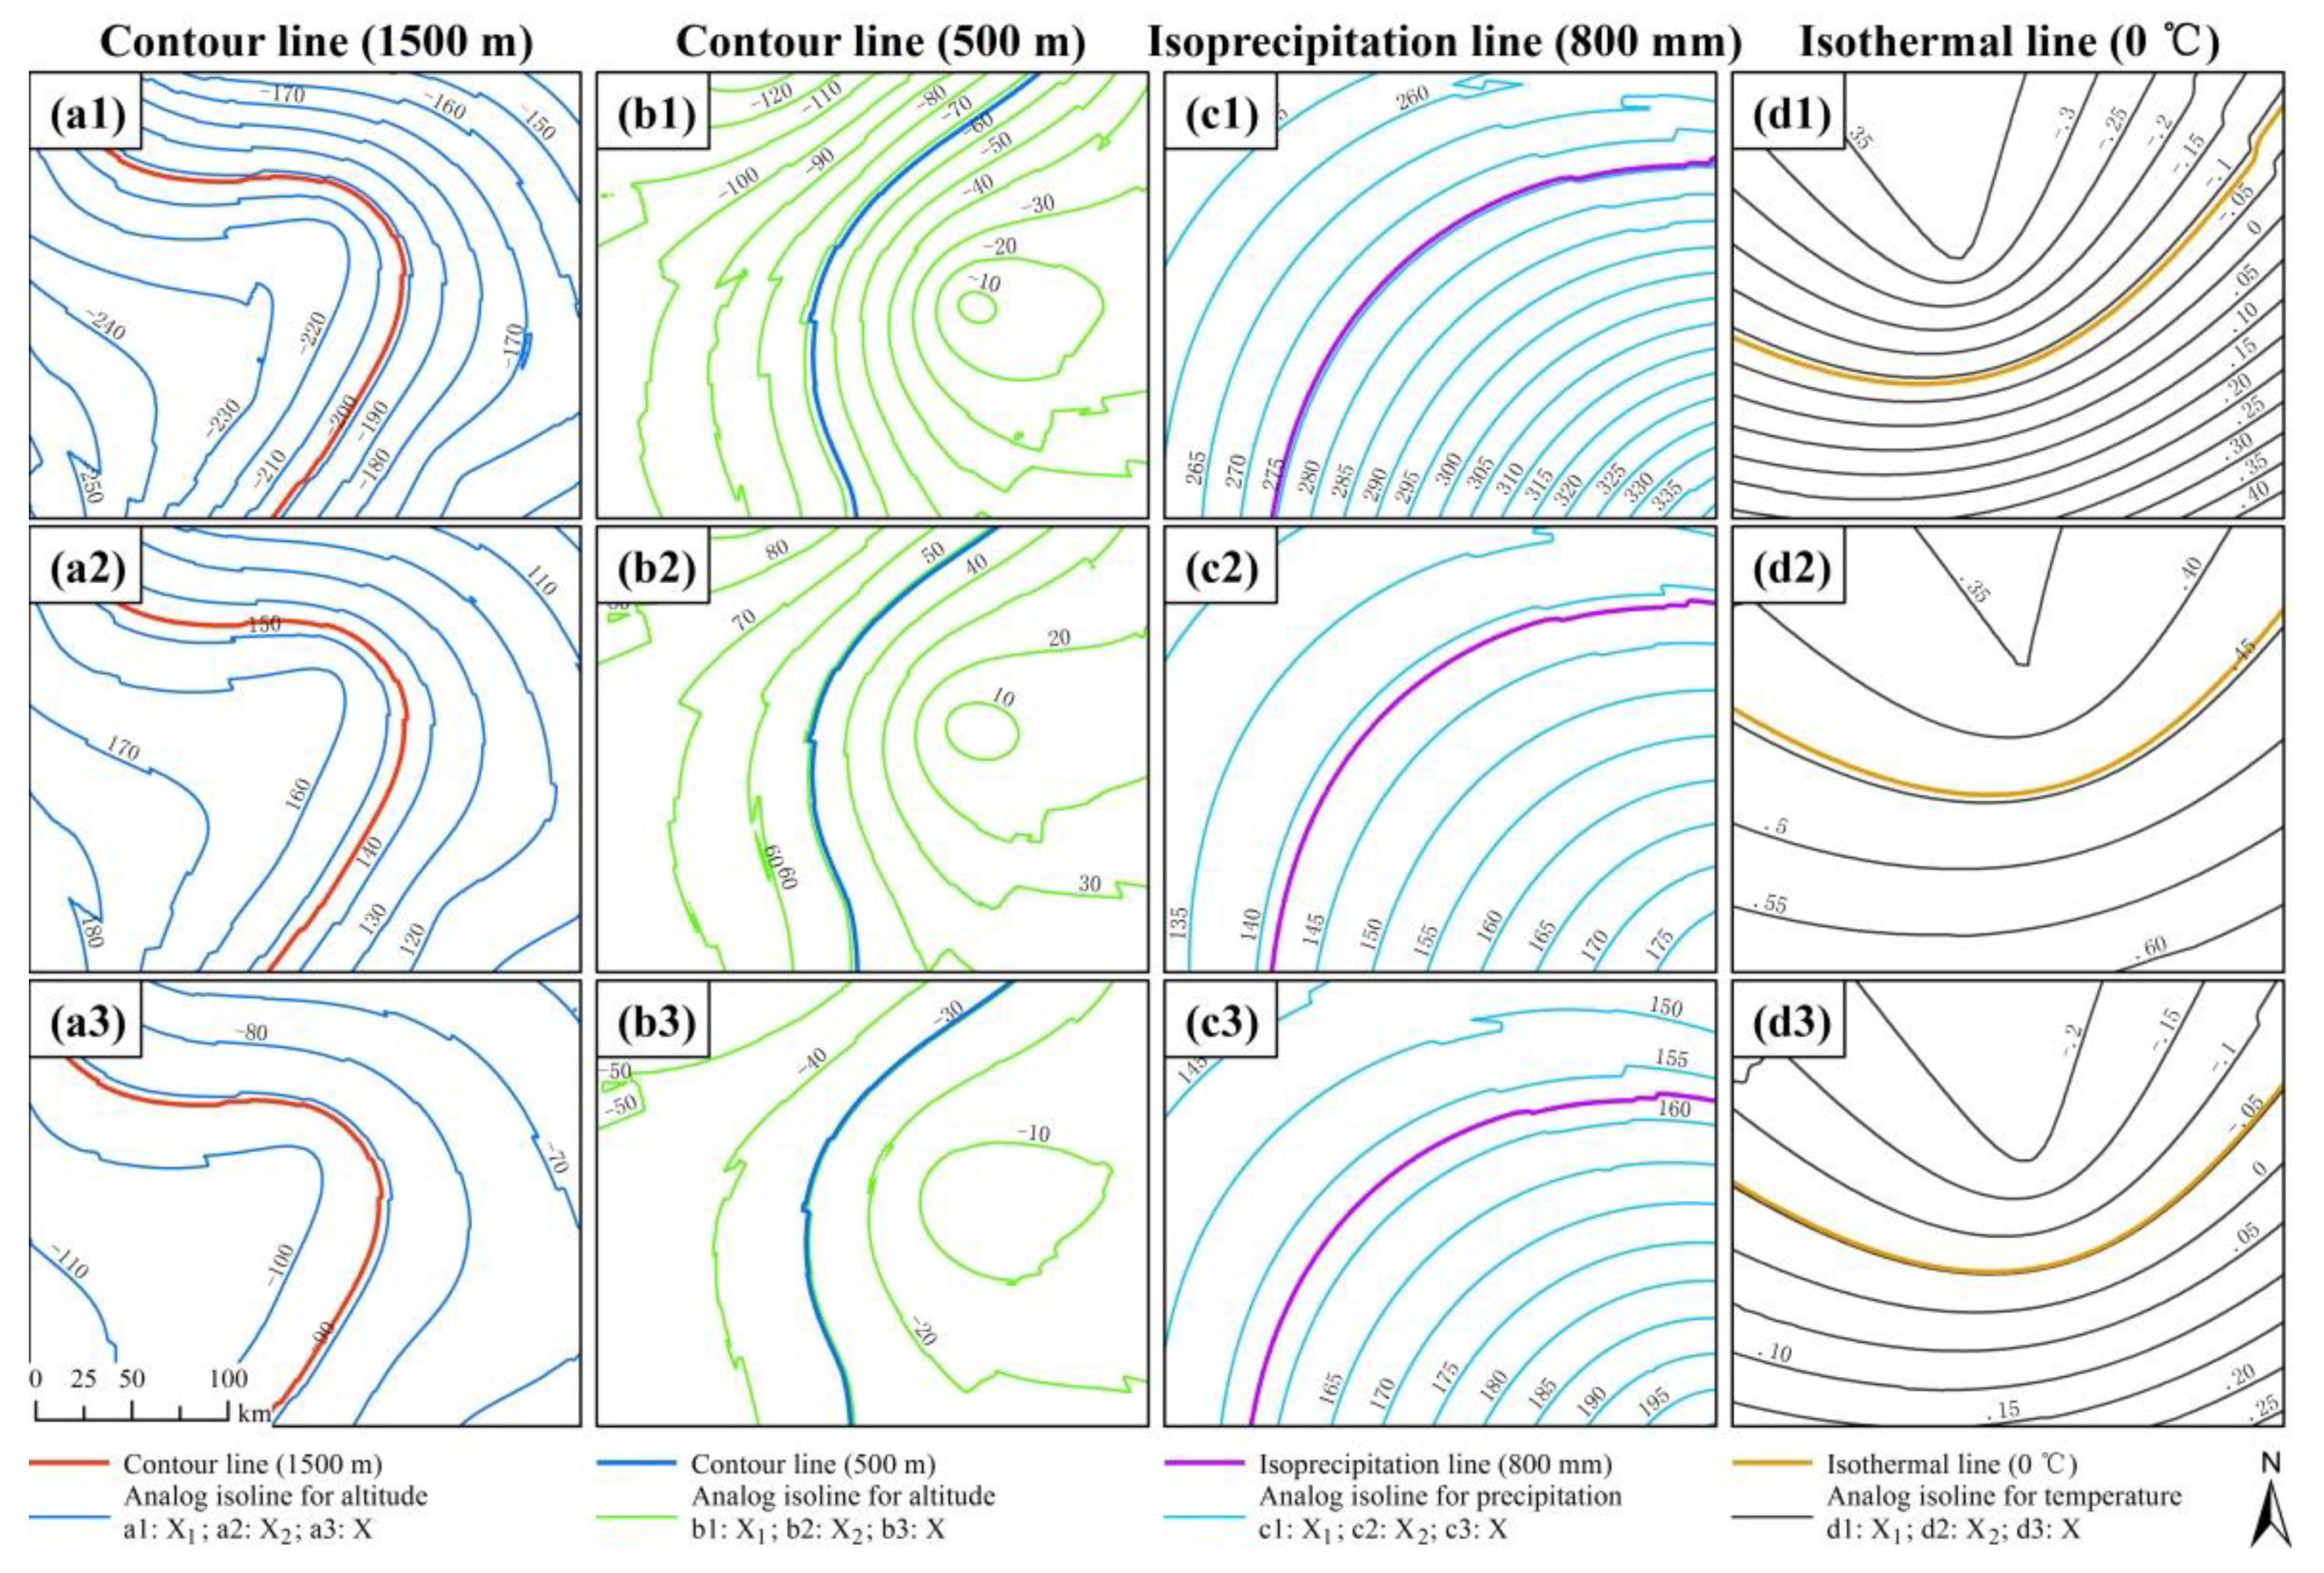
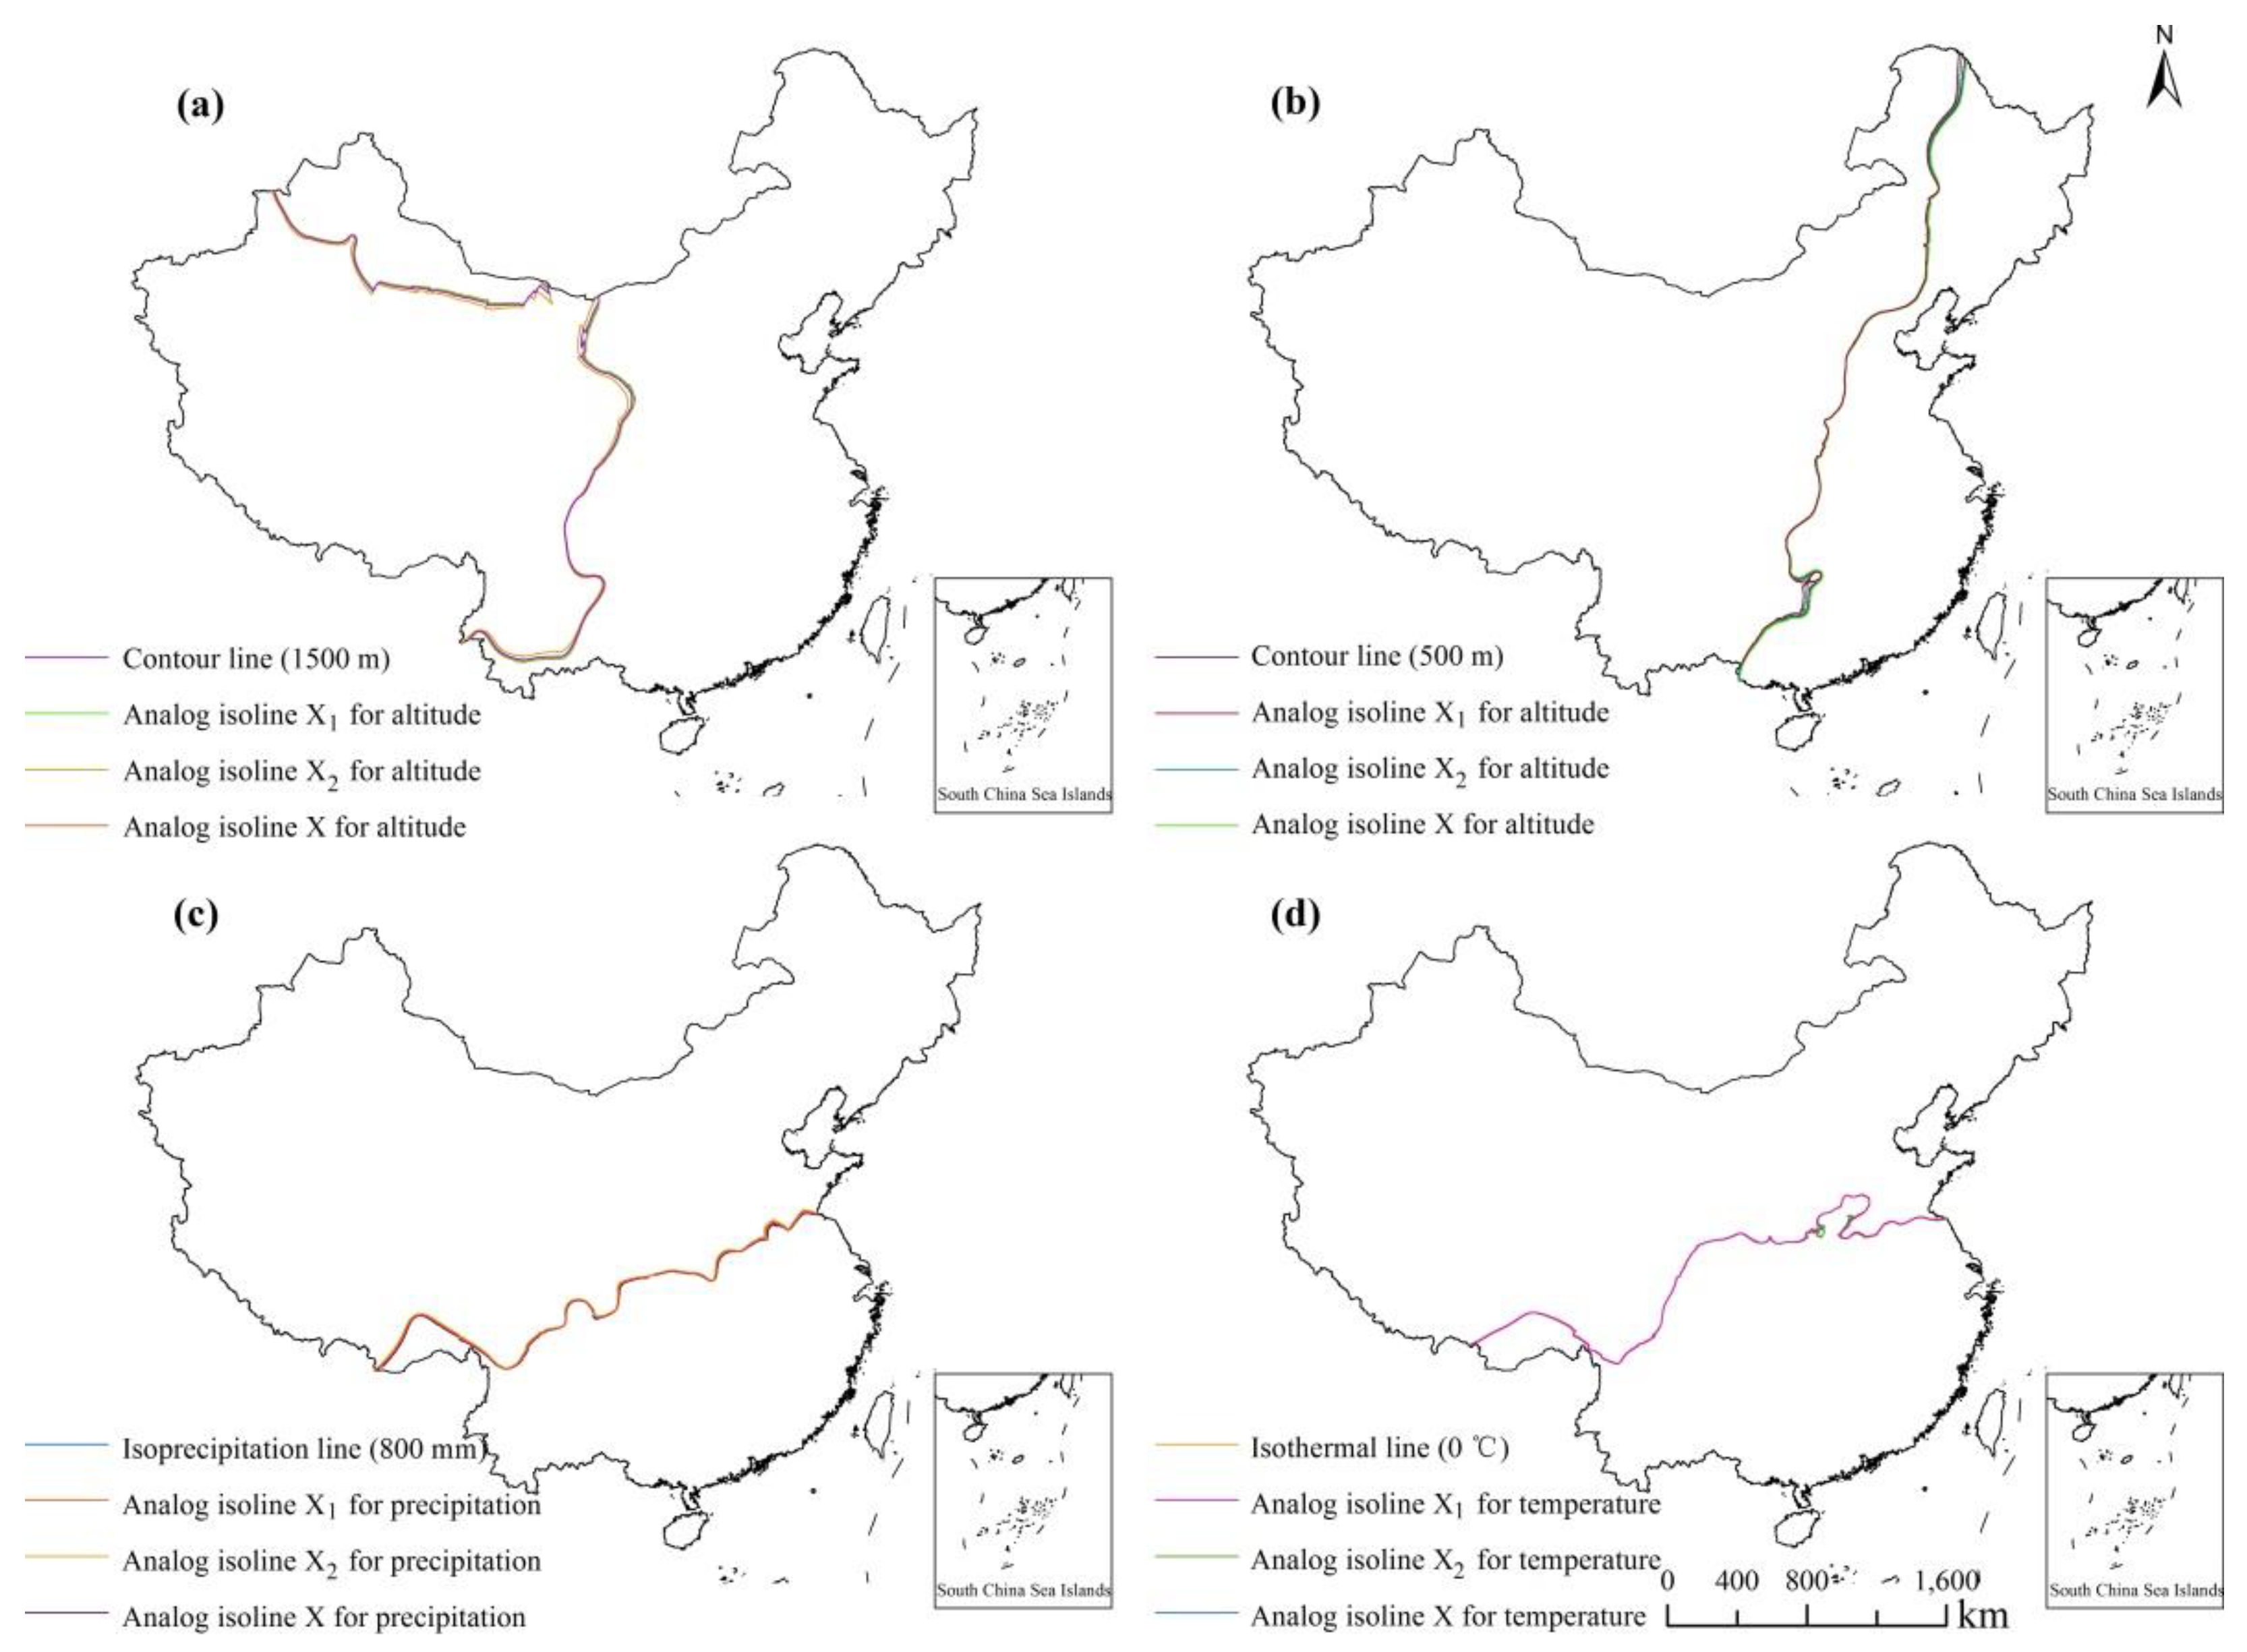
4.2.2. The Spatial Relationship between Natural Resource Endowment and Natural Environment

Based on the spatial double-line similarity calculation model, the spatial similarity between the isolines of average altitude, annual precipitation and average temperature in January and the optimal analog isolines of X1 (endowment degree of water and land resources), X2 (endowment degree of ecological environment resources) and X (endowment degree of natural resources) can be calculated. The spatial similarity indicates the spatial relationship between natural resource endowment and natural environment elements.
(1) The eigenvalue isolines of natural environment elements and the optimal analog isolines of X1, X2 and X are extracted. The Kriging interpolation method is used to present the spatial distribution of elevation, annual precipitation and average temperature in January in the Chinese terrestrial surface. Based on this, the contour lines of 1500 m and 500 m, 800 mm isoprecipitation line, and the January 0 °C isotherm are extracted. According to the regression analysis results of natural environment elements and X1, X2 and X, we can calculate the dependent variables using the datas of average altitude, annual precipitation, and January average temperature. Analog isolines are extracted at fixed intervals respectively. The interval between the 1500 m and 500 m contour lines is 10, the interval of the 800 mm isoprecipitation lines is 5, and the interval of the 0 °C isotherms in January is 0.05 (Figure 3).
We can see from Figure 3 that the corresponding choices of the optimal analog isolines of X1, X2 and X are: (1) The 1500 m contours lines are, respectively, −200, 150 and 90 (Figure 3a1–a3); (2) The 500 m contour lines are, respectively, 70, 50 and −30 (Figure 3b1–b3); (3) The 800 mm isoprecipitation lines are, respectively, 275, 140 and 160 (Figure 3c1–c3); (4) January 0 °C isotherms are −0.1, 0.45, and −0.05 (Figure 3d1–d3).
(2) The spatial similarity analysis between the eigenvalue isolines of natural environment elements and the optimal analog isolines of X1, X2 and X. Based on Figure 3, the eigenvalue isolines of natural environment elements and the optimal analog isolines of X1, X2 and X are extracted (Figure 4). According to Figure 4, the spatial similarity of 1500 m contour line, 500 m contour line, 800 mm isoprecipitation line and January 0 °C isotherm with the optimal analog isolines of X1, X2 and X is calculated by using the spatial double-line similarity model, from which the spatial relationship between the natural resource endowment and natural environment is analyzed.
The analysis of spatial similarity between the eigenvalue isolines of natural environment elements and the optimal analog isolines of X1, X2 and X (Table 2), indicates that: ① Natural environment elements such as temperature, precipitation and altitude have significant effects on the spatial distribution of the endowment of water and land resources, the endowment of ecological environment resources, and the endowment of natural resources. Among them, precipitation has the most significant effect on the endowment of water and land resources, with a spatial similarity of 0.9992, followed by the endowment of ecological environment resources and natural resources. The effect of precipitation on the spatial distribution of the endowment of water and land resources and endowment of ecological environment resources is higher than that of temperature and altitude. ② Comparing X1, X2 and X, it is found that the optimal analog isolines of X1 has the highest spatial similarity with the 1500 m contour line, the 800 mm isoprecipitation line and the January 0 °C isotherm, which are 0.9799, 0.9992 and 0.9964, respectively. In general, natural environment elements such as temperature, precipitation, and altitude have the most significant effects on the spatial distribution of water and land resource endowment. The influence of temperature and altitude on the spatial distribution of natural resource endowment is stronger than that of the ecological environment resource endowment. However, the effect of precipitation on the endowment of ecological environment resources is significantly higher than that of natural resource endowment. Significant difference is found among that the influence of natural environment elements such as temperature, precipitation and altitude on the spatial distribution of the water and land resources, the ecological environment resources and the natural resources. ③ The spatial similarities between the optimal analog isolines of the natural resource endowment degree and the 1500 m contour line, 500 m contour line, 800 mm isoprecipitation line and January 0 °C isotherm are 0.9753, 0.9878, 0.9922 and 0.9951, respectively, indicating a higher effect from temperature on the spatial distribution of natural resource endowment, followed by precipitation and altitude.
A comprehensive analysis of the quantitative and spatial relationship between the endowment of natural resources and the natural environment, shows that natural environment elements such as temperature, precipitation, and altitude have an important impact on the spatial distribution of natural resources, with temperature the most significant, indicating that the primary natural environment and its function drive the formation and distribution of natural resources.

5. Conclusions and Discussion

5.1. Conclusions

This study comprehensively analyzes the spatial distribution features and geographic mechanisms of natural resources on the terrestrial surface of China. From this information, the structure and endowment of natural resources under the orientation of the new economic demands need to be re-examined. The importance of resources such as environment and ecology is highlighted. The coupling of resource elements can reveal the availability of natural resources. The main conclusions are as follows:
(1) Natural resources show significantly spatial variation in the Chinese terrestrial surface. ① The available land resources show a distribution pattern of “more in the east and less in the west”. The available water resources decrease from south to north, showing a distribution pattern of “more in the south and east, but less in the north and west”. The distribution feature of available environment resources is “more in the north and south, less in the middle region”. The higher-value, high-value and medium-value areas of the available ecological resources are distributed in an inverted “T” shape, and the lower-value and low-value areas are mainly distributed on the east and west sides of the inverted “T” shape. ② The water and land resources decrease from south to north, showing the distribution feature of “more in the south and east, but less in the north and west”. The distribution of ecological environment resources is consistent with the distribution of available ecological resources, the higher value, high value and median value areas are distributed in an inverted “T” shape, and the lower value and low value areas are mainly distributed on the east and west sides of the inverted “T” shape. ③ Natural resources decrease from south to north, showing the distribution pattern of “more in the south and east, but less in the north and west”. The comparison indicates that the distribution of available water resources, water and land resources and natural resources are consistent. According to the “short board effect” theory, it can be known that the available water resources have a “short board effect” on the endowment of water and land resources and the endowment of natural resources.
(2) The spatial agglomeration characteristics of natural resources in the Chinese terrestrial surface are obvious. The spatial agglomeration characteristics of available land resources are “high in the southeast and low in the northwest”. The spatial agglomeration characteristics of available water resources are “high in the south and low in the north”. The spatial agglomeration characteristics of available environment resources are “high in the north and south, low in the middle region”. The spatial agglomeration characteristics of available ecological resources are “high in the north and south, low in the middle region”. The spatial agglomeration characteristics of water and land resources are “high in the South and low in the north”. The spatial agglomeration characteristics of ecological environment resources are “high in the north and south, low in the middle region”. There are two agglomeration types of natural resources in the Chinese terrestrial surface: the high-high agglomeration and the low-low agglomeration, showing the agglomeration features of “high in the south and low in the north”. It is worth noting that available water resources, water and land resources and natural resources show consistent local agglomeration.
(3) Natural environment elements such as temperature, precipitation, and altitude have an important impact on the spatial distribution of natural resources, indicating that the primary natural environment and its function drive the formation and distribution of natural resources. ① From the perspective of the quantitative relationship between natural resource endowment and natural environment, the correlation coefficients of the natural resource endowment degree with annual precipitation, average temperature in January and average altitude are 0.875, 0.683 and 0.220, respectively. This indicates that the endowment degree of natural resources is most significantly affected by precipitation, followed by temperature, and altitude has the least effect on it. ② From the perspective of the spatial relationship between natural resource endowment and natural environment, the spatial similarity between the optimal analog isolines of the natural resource endowment degree and the 1500 m contour line, 500 m contour line, 800 mm isoprecipitation line, and January 0 °C isotherm are 0.9753, 0.9878, 0.9922 and 0.9951, respectively. It shows that temperature has the most significant impact on the spatial distribution of natural resource endowment, followed by precipitation and altitude.
Based on the research results, some policy suggestions for the high-quality development of China’s new economy and the rational protection and utilization of natural resources are put forward. The available water resources are the decisive factor of natural resource endowment and the most rigid constraint factor of economic and social development. With the continuous improvement of China’s urbanization level, the problem of urban water pollution and shortage is growing intensely. Regional sustainable development and the layout of new economic development will certainly be affected by this trend. For example, in measures of response, creating water-saving cities is a new decision and measure to solve the systematic problems of water security, water environment and water ecology. This measure is also an important way to realize water resources protection, water security, water environment optimization and water ecology improvement. China should insist on the principle of determining the development of cities, land use, population and industry based on water resources and take the road of green and sustainable high-quality development. Reasonable protection and utilization of natural resources is an important guarantee for the high-quality development of the new economy. It is the guarantee for the high-quality development of the new economy and the sustainable utilization of natural resources to realize the harmonious relationship between the new economy and the natural resources. A scientific understanding of the spatial variation of natural resources from the perspective of the new economy is significant for optimizing the spatial development pattern of land and promoting the high-quality of economic development.

5.2. Discussion

(1) Natural resources are still an important factor in the development of the new economy. With the evolution of the industrial structure and the development of transportation and communication technologies, although dependence of the new economy on natural resources is constantly weakening, water and land resources, as the basis for carrying human activities, still play a key role in contemporary development. In the economic development and layout guided by the new economic demands, ecological environment resources have become an important factor for high-quality economic development and ecological civilization construction. The endowment degree of regional resource is directly related to economic, social and ecological benefits, especially the well-being of the people. This study shows that available natural resources are the foundation of the layout of economic development. Water and land resources, ecological environment resources and natural resources are coupled through natural resource elements, and the natural resource endowment is distributed unevenly in space and have significant local spatial agglomeration features. The new economic form will inevitably change the country’s demand structure for natural resources, thereby renewing the local economic location, which may reconstruct the country’s location map. The results of this study are intended to provide a data basis for drawing a geographical map suitable for the development of the new economy.
(2) The primary natural environment and its function drive the formation and distribution of natural resources. This study selects available land resources, available water resources, available environmental resources and available ecological resources to construct a comprehensive measurement index system, aiming to analyze the resource structure, and interpret the natural resource endowment with the coupling of resource elements, and reveal the spatial distribution features of natural resources accordingly. The average altitude (characterizing geology and landforms), annual precipitation, and January average temperature (characterizing meteorological climate) and X1, X2, X are selected to analyze the quantitative and spatial relationships, also revealing the geographical mechanism of the formation and distribution of natural resources. In terms of spatial relationships, constructing a spatial double-line similarity model based on the spatial line group target similarity model to calculate the spatial similarity between the eigenvalue isolines of natural environment elements and the optimal analog isolines of X1, X2 and X. Higher similarity means that the former has a more significant effect on the latter, and vice versa. Based on the results of quantitative and spatial relationship analysis, this study shows that the primary natural environment and its function are the geographic mechanisms of the formation and distribution of natural resources. The measurement method of resource endowment and the theoretical conception of geographic mechanism in this study, can provide a useful reference for the deepening study of natural resources, and the study of the geographic mechanism of other geographic elements.
(3) The impact of humanistic resources on the development layout of the new economy cannot be ignored. Theoretically, the resource elements that affect the development of the new economy include natural resources and humanistic resources. Although the dependence of the new economic development layout on natural resources has been gradually weakening, natural resources, as the basic condition of human economic activities, are still the key elements of the new economic development layout and its optimization. Humanistic resources include labor, capital, information, technology and tourism. These humanistic resources are important production and living elements in the development of the new economy, and can promote the transformation and upgrading of traditional industries and the spatial layout and optimization of emerging industries. At present, the academic circles have abundant research results on natural resources, but researches on the structure of humanistic resources based on the demand of the new economy, endowment measurement and spatial analysis are seldom involved. This study only discusses the possible impact of natural resources on the development of the new economy in China. In the follow-up study, based on the development of the new economy, we will try to build a comprehensive index system and measurement model for humanistic resources, analyze the structure and endowment of humanistic resources, and provide further decision-making references for the development of the new economy and its layout optimization.

Author Contributions

Conceptualization, X.Z. and B.Y.; methodology, X.Z. and S.L.; formal analysis, H.Y.; data curation, Z.L.; writing—original draft preparation, X.Z.; writing—review and editing, X.Z., B.Y. and H.Y.; visualization, J.S. and H.Y.; funding acquisition, B.Y. and Y.F. All authors have read and agreed to the published version of the manuscript.

Funding

This research was funded by the National Natural Science Foundation of China (41671179, 41701187), Open Project of the Key Laboratory of Urban Land and Resources Monitoring and Simulation, Ministry of Natural Resources (KF-2020-05-035), Humanities and Social Science Research Project of Henan Provincial Department of Education (2019-ZZJH-178).

Institutional Review Board Statement

Not applicable.

Informed Consent Statement

Not applicable.

Data Availability Statement

The data source used in the research has been shown in Section 3.

Acknowledgments

The authors thank Taryn Murugan for improving the English language and to express our thanks to the anonymous reviewers and the editors for their useful ideas for improvement.

Conflicts of Interest

The authors declare no conflict of interest.

References

  1. Zalasiewicz, J.; Williams, M.; Steffen, W.; Crutzen, P. The new world of the Anthropocene. Environ. Sci. Technol. 2010, 44, 2228–2231. [Google Scholar] [CrossRef]
  2. Fan, J.; Jiang, Z.L. Trend of human-economic geography in relation to the Future Earth initiative for systemic solutions of regional sustainable development. Prog. Geogr. 2015, 34, 1–9. [Google Scholar]
  3. Colglazier, W. Sustainable development agenda: 2030. Science 2015, 349, 1048–1050. [Google Scholar] [CrossRef] [PubMed]
  4. Gjorgievski, V.Z.; Markovska, N.; Pukšec, T.; Duić, N.; Foley, A. Supporting the 2030 agenda for sustainable development: Special issue dedicated to the conference on sustainable development of energy, water and environment systems 2019. Renew. Sustain. Energy Rev. 2021, 143, 110920. [Google Scholar] [CrossRef]
  5. Emily, G. Preservation and Use of Natural Resources in the Developing World: A Case Study of the Can Gio Biosphere Reserve, Ho Chi Minh City, Vietnam. Occam’s Razor 2011, 1, 17–37. [Google Scholar]
  6. Motesharrei, S.; Rivas, J.; Kalnay, E.; Asrar, G.R.; Busalacchi, A.J.; Cahalan, R.F.; Cane, M.A.; Colwell, R.R.; Feng, K.S.; Franklin, R.S.; et al. Modeling Sustainability: Population, Inequality, Consumption, and Bidirectional Coupling of the Earth and Human Systems. Natl. Sci. Rev. 2016, 3, 470–494. [Google Scholar] [CrossRef] [Green Version]
  7. Cumming, G.S. The relevance and resilience of protected areas in the Anthropocene. Anthropocene 2016, 13, 46–56. [Google Scholar] [CrossRef]
  8. Moore, J.E.; Mascarenhas, A.; Bain, J.; Straus, S.E. Developing a comprehensive definition of sustainability. Implement. Sci. 2017, 12, 1–8. [Google Scholar] [CrossRef]
  9. Galaz, V.; Biermann, F.; Crona, B.; Loorbach, D.; Folke, C.; Olsson, P.; Nilsson, M.; Allouche, J.; Persson, A.; Reischl, G. Planetary boundaries: Exploring the challenges for global environmental governance. Curr. Opin. Environ. Sustain. 2012, 4, 80–87. [Google Scholar] [CrossRef]
  10. Griggs, D.; Stafford-Smith, M.; Gaffney, O.; Rockström, J.; Öhman, M.C.; Shyamsundar, P.; Steffen, W.; Glaser, G.; Kanie, N.; Noble, I. Sustainable development goals for people and planet. Nature 2013, 495, 305–307. [Google Scholar] [CrossRef]
  11. Ringler, C.; Bhaduri, A.; Lawford, R. The nexus across water, energy, land and food (WELF): Potential for improved resource use efficiency? Curr. Opin. Environ. Sustain. 2013, 5, 617–624. [Google Scholar] [CrossRef]
  12. Daher, B.T.; Mohtar, R.H. Water-energy-food (WEF) Nexus Tool 2.0: Guiding integrative resource planning and decision-making. Water Int. 2015, 40, 748–771. [Google Scholar] [CrossRef]
  13. Kummu, M.; Guillaume, J.; de Moel, H.; Eisner, S.; Flörke, M.; Porkka, M.; Siebert, S.; Veldkamp, T.I.; Ward, P.J. The world’s road to water scarcity: Shortage and stress in the 20th century and pathways towards sustainability. Sci. Rep. 2016, 6, 1–6. [Google Scholar] [CrossRef] [Green Version]
  14. Hammond, G.P. Energy, Environment and Sustainable Development: A UK Perspective. Process Saf. Environ. Prot. 2000, 78, 304–323. [Google Scholar] [CrossRef] [Green Version]
  15. Dincer, I.; Rosen, M.A. A worldwide perspective on energy, environment and sustainable development. Int. J. Energy Res. 2015, 22, 1305–1321. [Google Scholar] [CrossRef]
  16. Wang, Y.Q.; Huang, X.R.; Gao, L.Y.; Guo, B.Y. Preliminary research on quantitative methods of water resources carrying capacity based on water resources balance sheet. Proc. Int. Assoc. Hydrol. Sci. 2018, 379, 269–277. [Google Scholar] [CrossRef] [Green Version]
  17. Gao, X.X.; Zuo, D.P.; Xu, Z.X.; Cai, S.Y.; Han, X.M. Evaluation of blue and green water resources in the upper Yellow River basin of China. Proc. Int. Assoc. Hydrol. Sci. 2018, 379, 159–167. [Google Scholar] [CrossRef] [Green Version]
  18. Zang, S.Y.; Huang, X.; Na, X.D.; Sun, L. An Assess approach of land-use to resource-based cities: A case study on land-use process of Daqing region. Int. J. Environ. Sci. Technol. 2015, 12, 3827–3836. [Google Scholar] [CrossRef] [Green Version]
  19. Wang, S.C. Living with nature in harmony: Water resources problem and countermeasures in China. J. Beijing Norm. Univ. Nat. Sci. 2009, 45, 441–445. [Google Scholar]
  20. Li, C.G.; Chi, K.G.; Pang, B.; Tang, H.B. Reservoirs operation and water resources utilization coordination in Hongshuihe basin. Proc. Int. Assoc. Hydrol. Sci. 2018, 379, 125–129. [Google Scholar] [CrossRef] [Green Version]
  21. Zhao, R.Q.; Liu, Y.; Tian, M.M.; Ding, M.L.; Cao, L.H.; Zhang, Z.P.; Chuai, X.W.; Xiao, L.G.; Yao, L.G. Impacts of water and land resources exploitation on agricultural carbon emissions: The water-land-energy-carbon nexus. Land Use Policy 2018, 72, 480–492. [Google Scholar] [CrossRef]
  22. Chu, C.; Ritter, W.; Sun, X.H. Spatial variances of water-energy nexus in China and its implications for provincial resource interdependence. Energy Policy 2019, 125, 487–502. [Google Scholar] [CrossRef]
  23. Miao, C.L.; Fang, D.B.; Sun, L.Y.; Luo, Q.L. Natural resources utilization efficiency under the influence of green technological innovation. Resour. Conserv. Recycl. 2017, 126, 153–161. [Google Scholar] [CrossRef]
  24. Wu, S.M.; Li, L.; Li, S.T. Natural resource abundance, natural resource-oriented industry dependence, and economic growth: Evidence from the provincial level in China. Resour. Conserv. Recycl. 2018, 139, 163–171. [Google Scholar] [CrossRef]
  25. Wang, S.Y.; Tang, X.; Zhang, B.S.; Wang, W.H. Accounting and management of natural resource consumption based on input-output method: A global bibliometric analysis. Front. Energy Res. 2021, 9, 94. [Google Scholar]
  26. Xu, Z.G.; Zhuo, Y.F.; Liao, R.; Wu, C.F.; Wu, Y.Z.; Li, G. LADM-Based model for natural resource administration in China. ISPRS Int. J. Geo Inf. 2019, 8, 456. [Google Scholar] [CrossRef] [Green Version]
  27. Li, G.J.; Wang, Y.S.; Li, Y.L. Synergies within the Water-Energy-Food Nexus to Support the Integrated Urban Resources Governance. Water 2019, 11, 2365. [Google Scholar] [CrossRef] [Green Version]
  28. Li, D.; Hu, S.M. How does technological innovation mediate the relationship between environmental regulation and high-quality economic development? Empirical evidence from China. Sustainability 2021, 13, 2231. [Google Scholar] [CrossRef]
  29. Huang, X.H.; Cai, B.Q.; Li, Y.L. Evaluation index system and measurement of high-quality development in China. Rev. Cercet. Interv. Soc. 2020, 68, 163–178. [Google Scholar] [CrossRef]
  30. Deng, Z.Q.; Zhang, Y.; Yu, A.O. The new economy in China: An intercity comparison. Sage Open 2020, 10, 2158244020977870. [Google Scholar] [CrossRef]
  31. Xie, X.; Li, K.; Liu, Z.Q.; Ai, H.S. Curse or blessing: How does natural resource dependence affect city-level economic development in China? Aust. J. Agric. Resour. Econ. 2021, 65, 413–448. [Google Scholar] [CrossRef]
  32. Dong, S.; Zhang, K.; Li, P.F.; Tang, C.J.; Zhu, Y.Y. Economic restructuring and spatial response of traditional industrial cities in the new economy: A case study of Xiangtan. Urban Plan. Forum 2017, 8, 33–37. [Google Scholar]
  33. Pratt, A.C. New media, the new economy and new spaces. Geoforum 2000, 31, 425–436. [Google Scholar] [CrossRef] [Green Version]
  34. Bathelt, H.; Cohendet, P. The creation of knowledge: Local building, global accessing and economic development-toward an agenda. J. Econ. Geogr. 2014, 14, 1–14. [Google Scholar] [CrossRef] [Green Version]
  35. David, T.J. Capturing value from knowledge assets: The new economy, markets for know-how, and intangible assets. Calif. Manag. Rev. 1998, 40, 55–79. [Google Scholar]
  36. Tolentino, P.E. Technological innovation and emerging economy multinationals: The product cycle model revisited. Int. J. Technol. Manag. 2017, 74, 122–129. [Google Scholar] [CrossRef] [Green Version]
  37. Beyers, W. On the geography of the new economy: Perspectives from the United States. Serv. Ind. J. 2003, 23, 4–26. [Google Scholar] [CrossRef]
  38. Fernald, J.G.; Jones, C.I. The future of U.S. economic growth. Am. Econ. Rev. 2014, 104, 44–49. [Google Scholar] [CrossRef] [Green Version]
  39. Hall, J.L. Informing state economic development policy in the new economy: A theoretical foundation and empirical examination of state innovation in the United States. Public Adm. Rev. 2007, 67, 630–645. [Google Scholar] [CrossRef]
  40. Hansen, W.; Price, J.; Carnevale, A. America and the new economy: How new competitive standards are radically changing American workplaces. ILR Rev. 1993, 1, 421–422. [Google Scholar] [CrossRef]
  41. Avgandoña, A. The new economy: Ethical issues. J. Bus. Ethics 2003, 1, 3–22. [Google Scholar] [CrossRef]
  42. Li, X.J.; Li, G.P.; Zeng, G.; Qin, C.L.; Lin, B.Y.; Zhang, W.Z. Economic Geography, 3rd ed.; Higher Education Press: Beijing, China, 2018; pp. 33–57. [Google Scholar]
  43. Long, H.L.; Liu, Y.Q.; Li, T.T.; Wang, J.; Liu, A.X. A primary study on ecological land use classification. Ecol. Environ. Sci. 2015, 24, 1–7. [Google Scholar]
  44. Chen, X.S.; Zhang, K.Y. Regional Economics Theory; The Commercial Press: Beijing, China, 2003; pp. 268–381. [Google Scholar]
  45. Fan, J.; Zhou, K.; Wang, Y.F. Basic points and progress in technical methods of early-warning of the national resource and environmental carrying capacity (V 2016). Prog. Geogr. 2017, 36, 266–276. [Google Scholar]
  46. Song, C.Q.; Cheng, C.X.; Shi, P.J. Geography complexity: New connotations of geography in the new era. Acta Geogr. Sin. 2018, 73, 1204–1213. [Google Scholar]
  47. Zhang, X.M.; Luo, S.; Li, X.M.; Li, Z.F.; Fan, Y.; Sun, J.W. Spatio-temporal variation features of air quality in China. Sci. Geogr. Sin. 2020, 40, 190–199. [Google Scholar]
  48. Liu, T.; Du, Q.Y.; Mao, H.C. Spatial similarity assessment model and its application in line groups. Geomat. Inf. Sci. Wuhan Univ. 2012, 37, 992–995. [Google Scholar]
  49. Xu, X.G. Study on evaluation and pre–warning of ecological environment in the Yellow River Delta. Acta Ecol. Sin. 1996, 16, 460–468. [Google Scholar]
  50. Wang, Z. Theoretical Geography, 3rd ed.; Science Press: Beijing, China, 2019; pp. 149–195. [Google Scholar]
  51. Ge, Q.S.; Zhao, M.C.; Zheng, J.Y.; Fang, X.Q. Study on division of the terrestrial system in China. Acta Geogr. Sin. 2002, 57, 515–522. [Google Scholar]
Figure 1. Geographical distribution of the seven indexes of natural resources in the Chinese terrestrial surface: (a) Available land resources, (b) Available water resources, (c) Available environmental resources, (d) Available ecological resources, (e) Water and land resources, (f) Ecological environment resources, (g) Natural resources.
Sustainability 13 07956 g001
Figure 2. Local agglomeration features of the seven indexes of natural resources in the Chinese terrestrial surface: (a) Available land resources, (b) Available water resources, (c) Available environmental resources, (d) Available ecological resources, (e) Water and land resources, (f) Ecological environment resources, (g) Natural resources.
Sustainability 13 07956 g002
Figure 3. The isoline maps of characteristic value and analog value of natural environment elements: (a1a3) are the analog isoline for altitude of water and land resources, ecological environment resources and to natural resources; (b1b3) are the analog isoline for altitude of water and land resources, ecological environment resources and natural resources; (c1c3) are the analog isoline for precipitation of water and land resources, ecological environment resources and natural resources; (d1d3) are the analog isoline for temperature of water and land resources, ecological environment resources and natural resources; 1500 m contour line, 500 m contour line, 800 mm isoprecipitation line and 0 °C isothermal line are shown in (a1a3), (b1b3), (c1c3) and (d1d3) respectively).
Sustainability 13 07956 g003
Figure 4. Spatial distribution of optimal analog isoline and characteristic value isoline of natural environment elements. (a): 1500 m contour line and its optimal analog isolines, (b): 500 m contour line and its optimal analog isolines, (c): 800 mm isoprecipitation line and its optimal analog isolines, (d): 0 °C isothermal line and its optimal analog isolines. The optimal analog isoline also include three types: X1 (water and land resources), X2 (ecological environment resources) and X (natural resource).
Sustainability 13 07956 g004
Table 1. The comprehensive index system of terrestrial surface natural resources in China under the orientation of the new economic demands.
The IndexIndex NameIndex Meaning
XX1X11Available land resourcesThe endowment degree of available land resources in a certain region
X12Available water resourcesThe endowment degree of available water resources in a certain region
X2X21Available environmental resourcesThe endowment degree of available environmental resources in a certain region
X22Available ecological resourcesThe endowment degree of available ecological resources in a certain region
Annotations: X1 is water and land resources, which stands for the endowment degree of water and land resources in a certain region. X2 is ecological environment resources, which stands for the endowment degree of ecological environment resources in a certain region. X is natural resources, which stands for the endowment degree of natural resources in a certain region.
Table 2. Spatial similarity of optimal analog isoline and characteristic value isoline of elements of natural environment.
Indexes1500 m Contour LineSimilarity500 m Contour LineSimilarity800 m Isoprecipitation LineSimilarityJanuary 0 °C IsothermSimilarity
X1−2000.9799700.94342750.9992−0.10.9964
X21500.9045500.98221400.99750.450.9780
X900.9753−300.98781600.9922−0.050.9951
Publisher’s Note: MDPI stays neutral with regard to jurisdictional claims in published maps and institutional affiliations.

