
Exploring Patterns of Evolution for Successful Global Brands: A Data-Mining Approach


Abstract
:1. Introduction
2. Literature Review
2.1. Global Branding
2.2. Best Global Brands Ranking
2.3. Data Analysis
3. Materials and Methods
3.1. Data Source
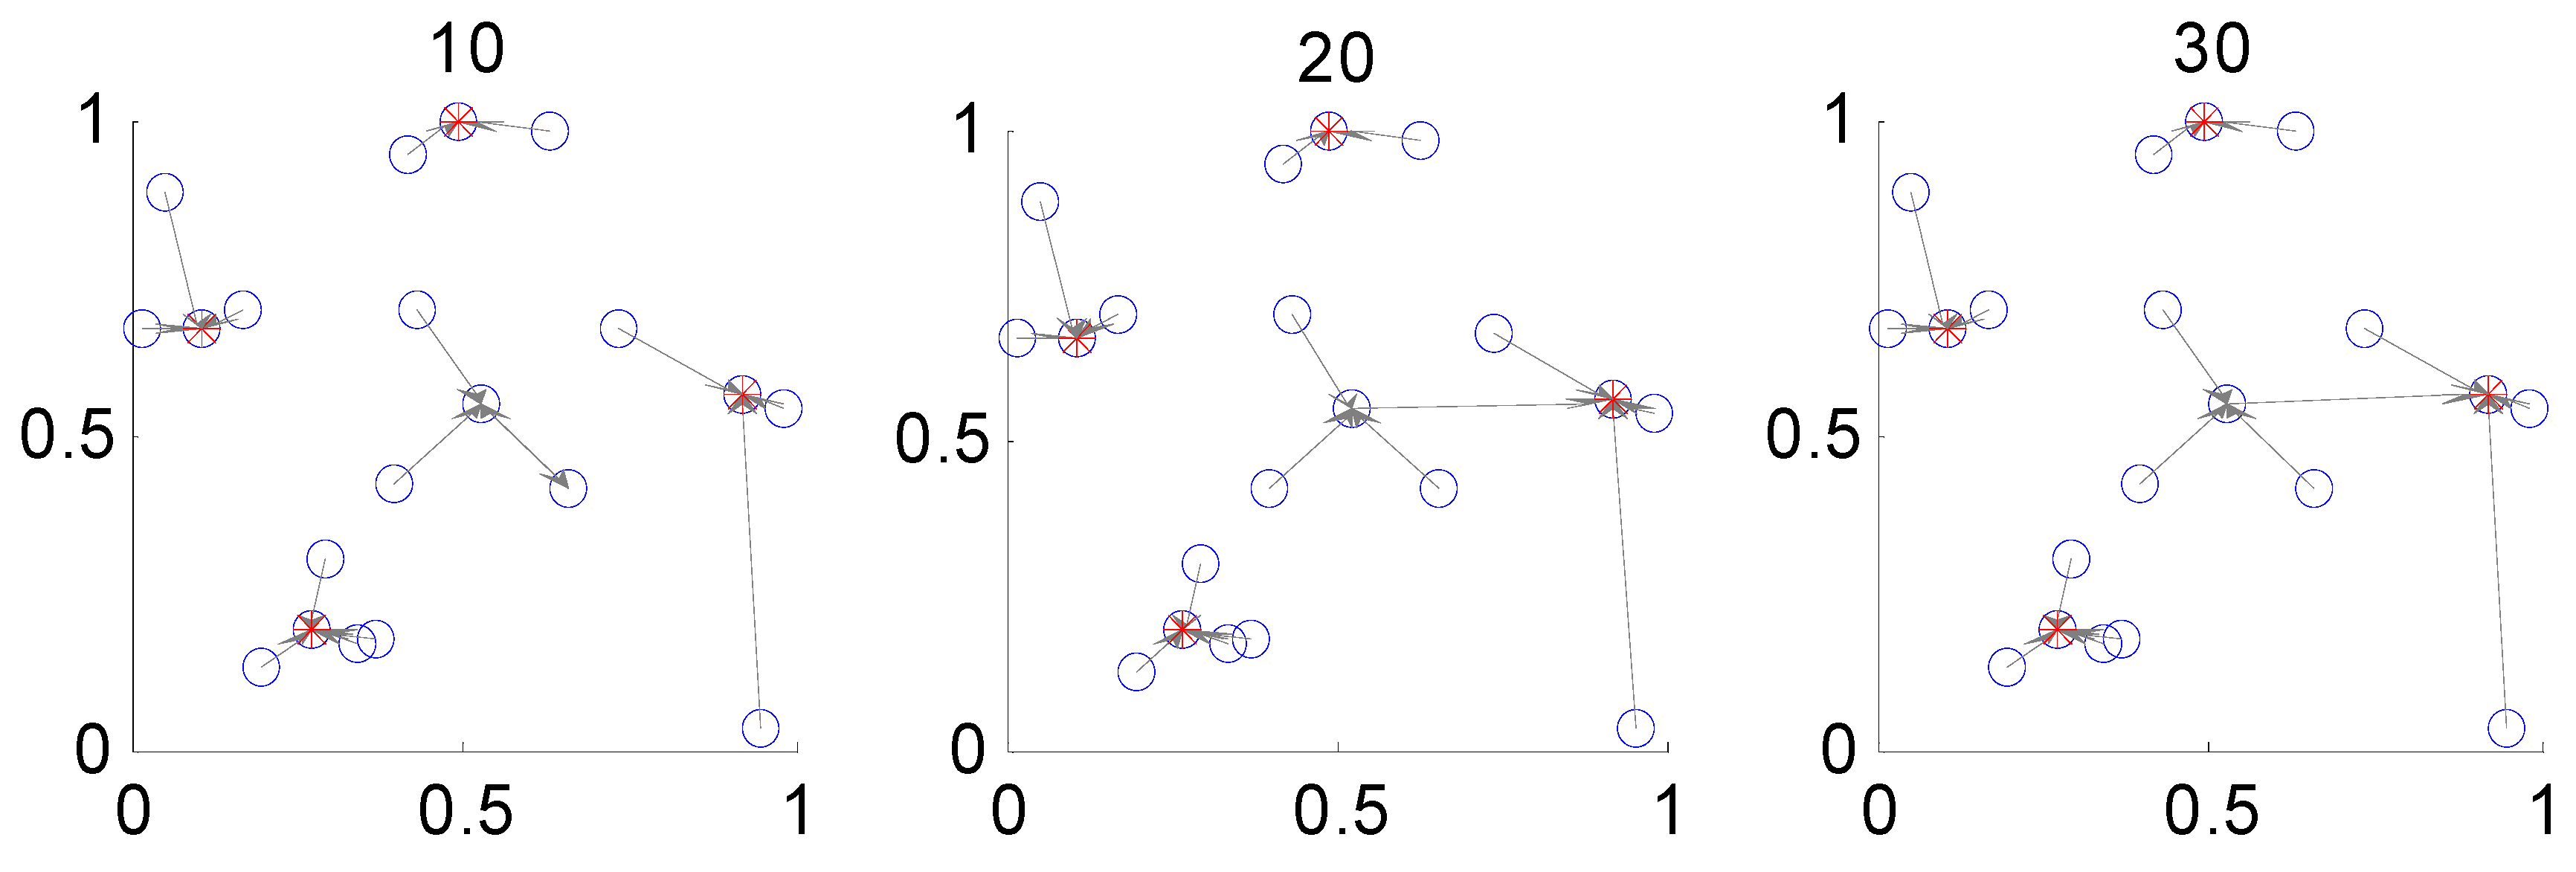
3.2. Affinity Propagation Clustering Algorithm
3.3. Process
- (1)
- Set the brand’s value based on its ranking; that is,i.e., rank 1 = 100, rank 100 = 1; a rank below the top 100 = 0.
- (2)
- Compute the distance based on DTW for each pair of brand time series, and create a distance matrix D, .
- (3)
- Transform the distance matrix to the similarity matrix used in AP clustering; that is, S = D × (−1)
- (4)
- Preference is the median of the similarity matrix; that is, P = median(S).
- (5)
- Use to record the index of the representative exemplar for every time series after executing the AP clustering method, that is, , where records the index of the ith brand’s representative exemplar.
- (6)
- Objects with the same representative exemplar are in the same group and a cluster. is a vector recording the indices of the different representative exemplars. Let be null initially, such that if is equal to .
4. Results
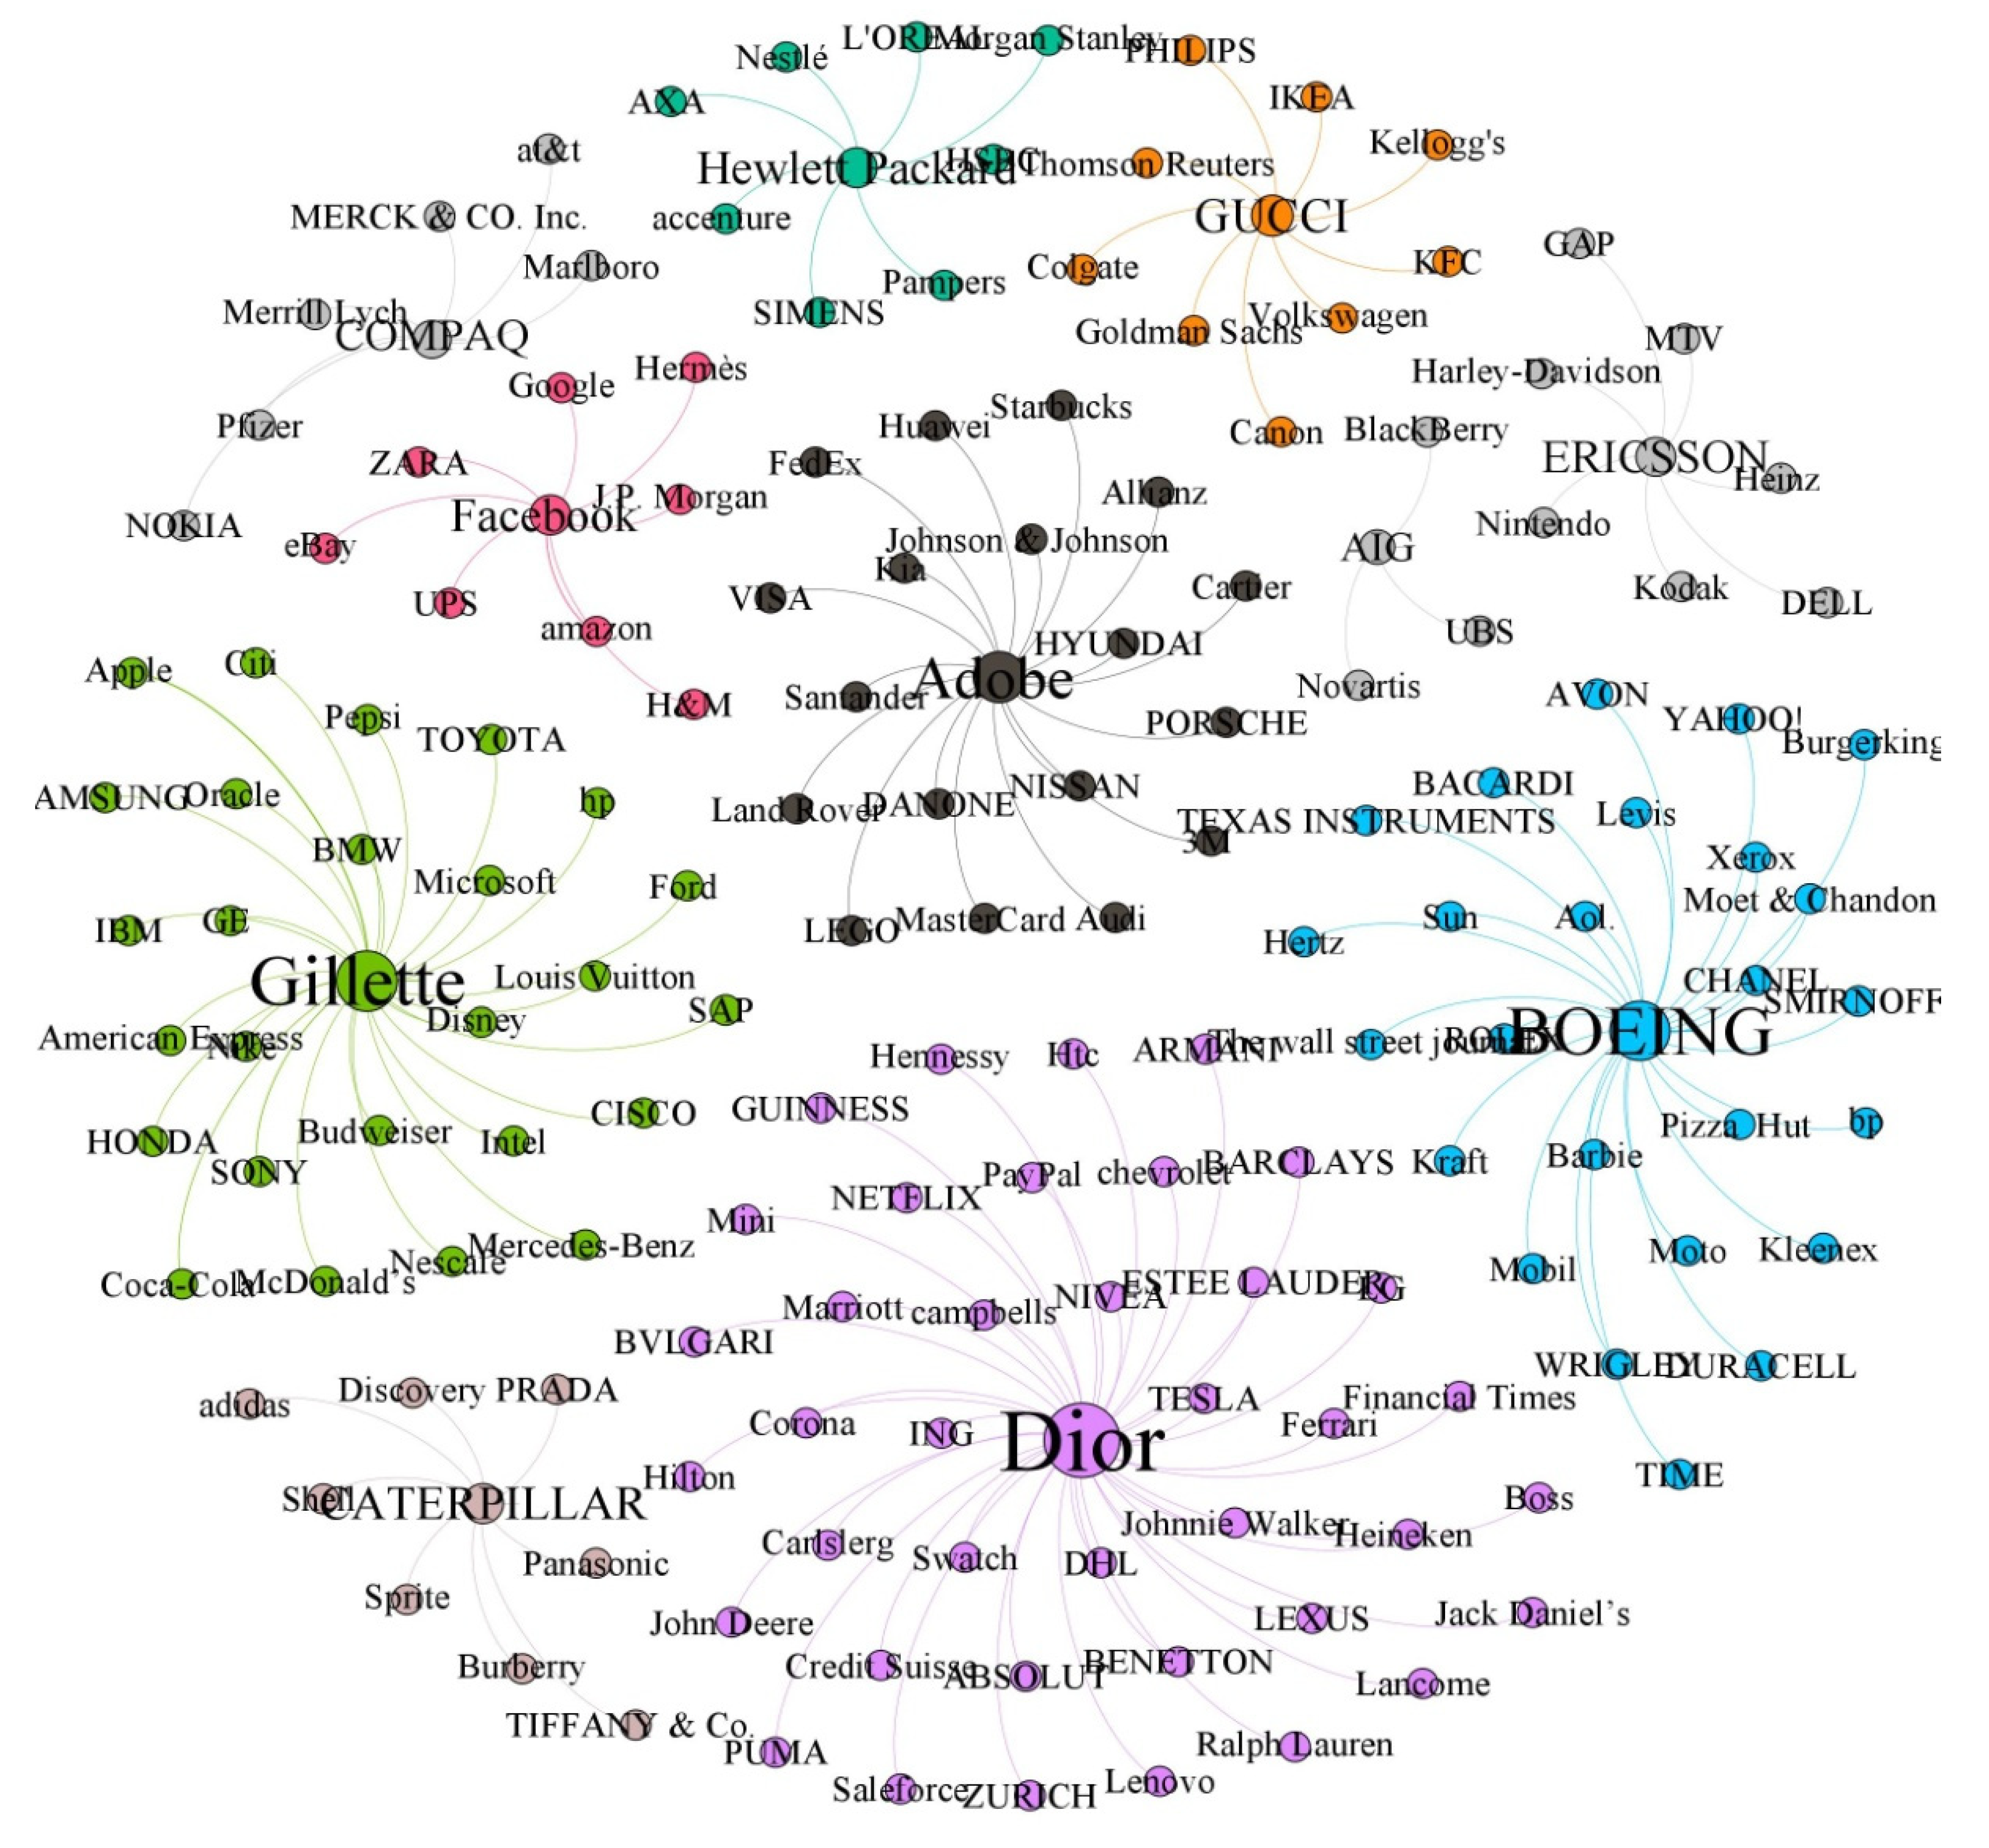
4.1. Study 1 Results: Profile of the Best Global Brands
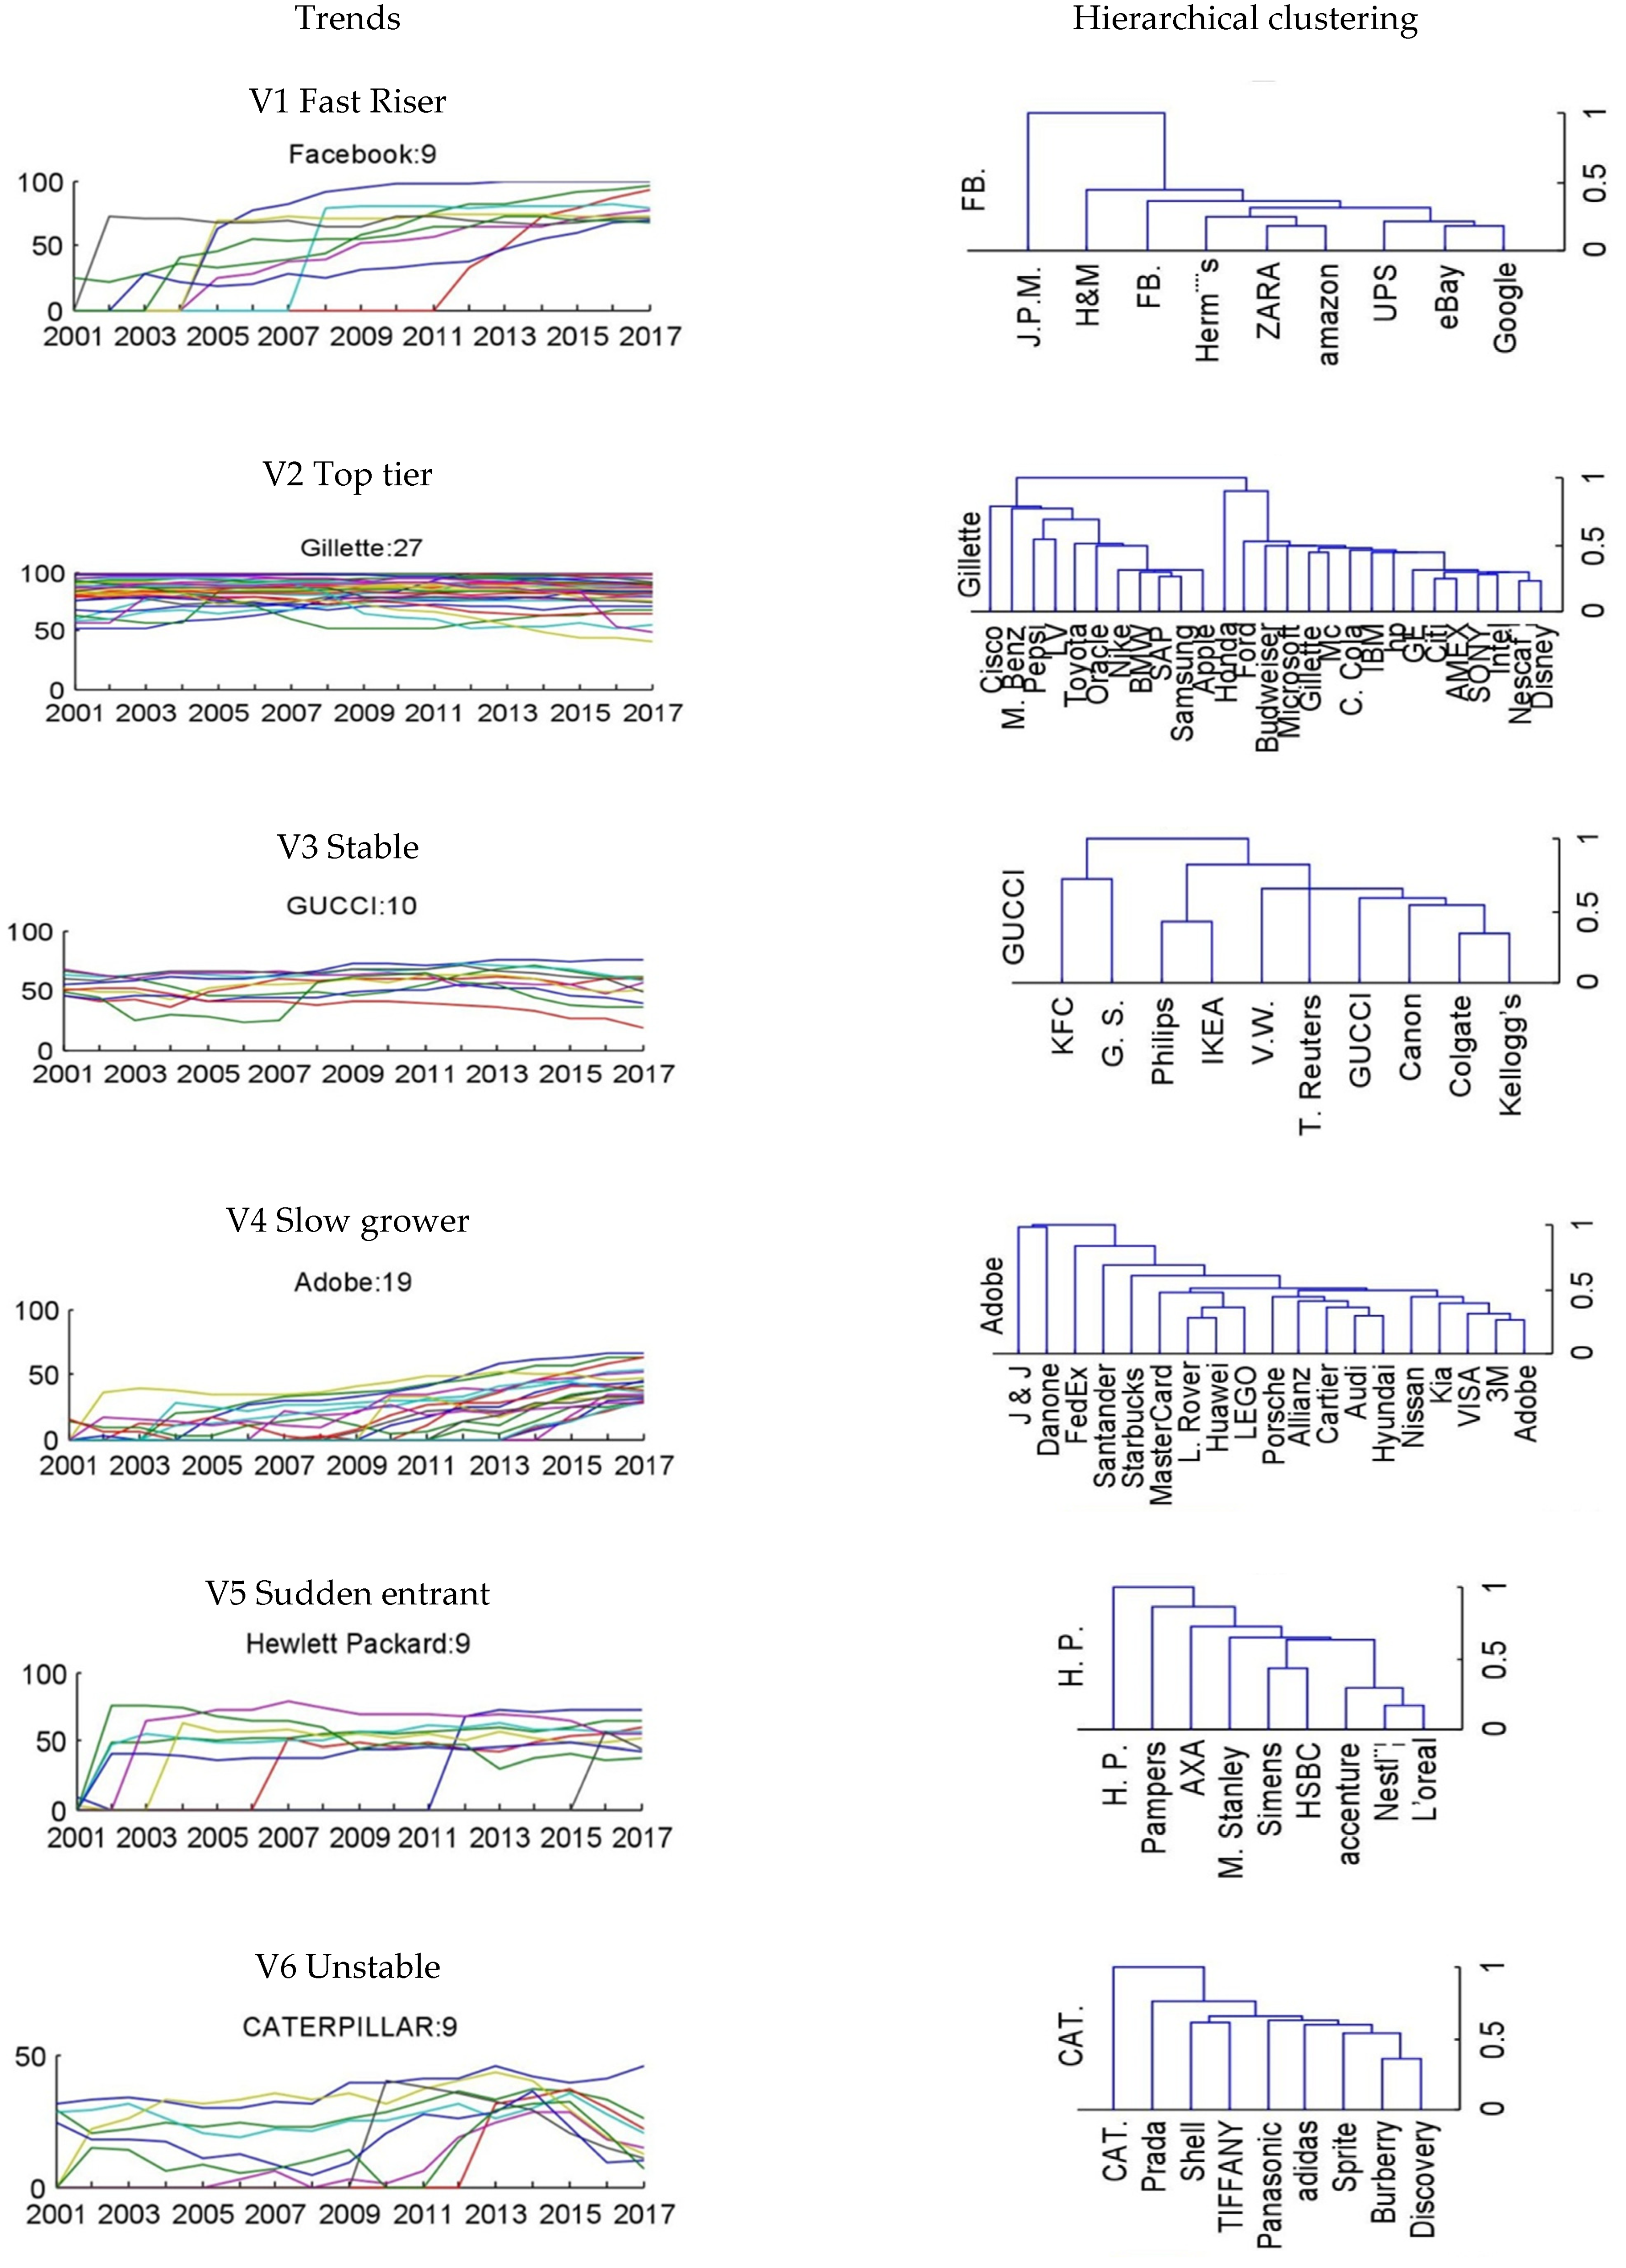
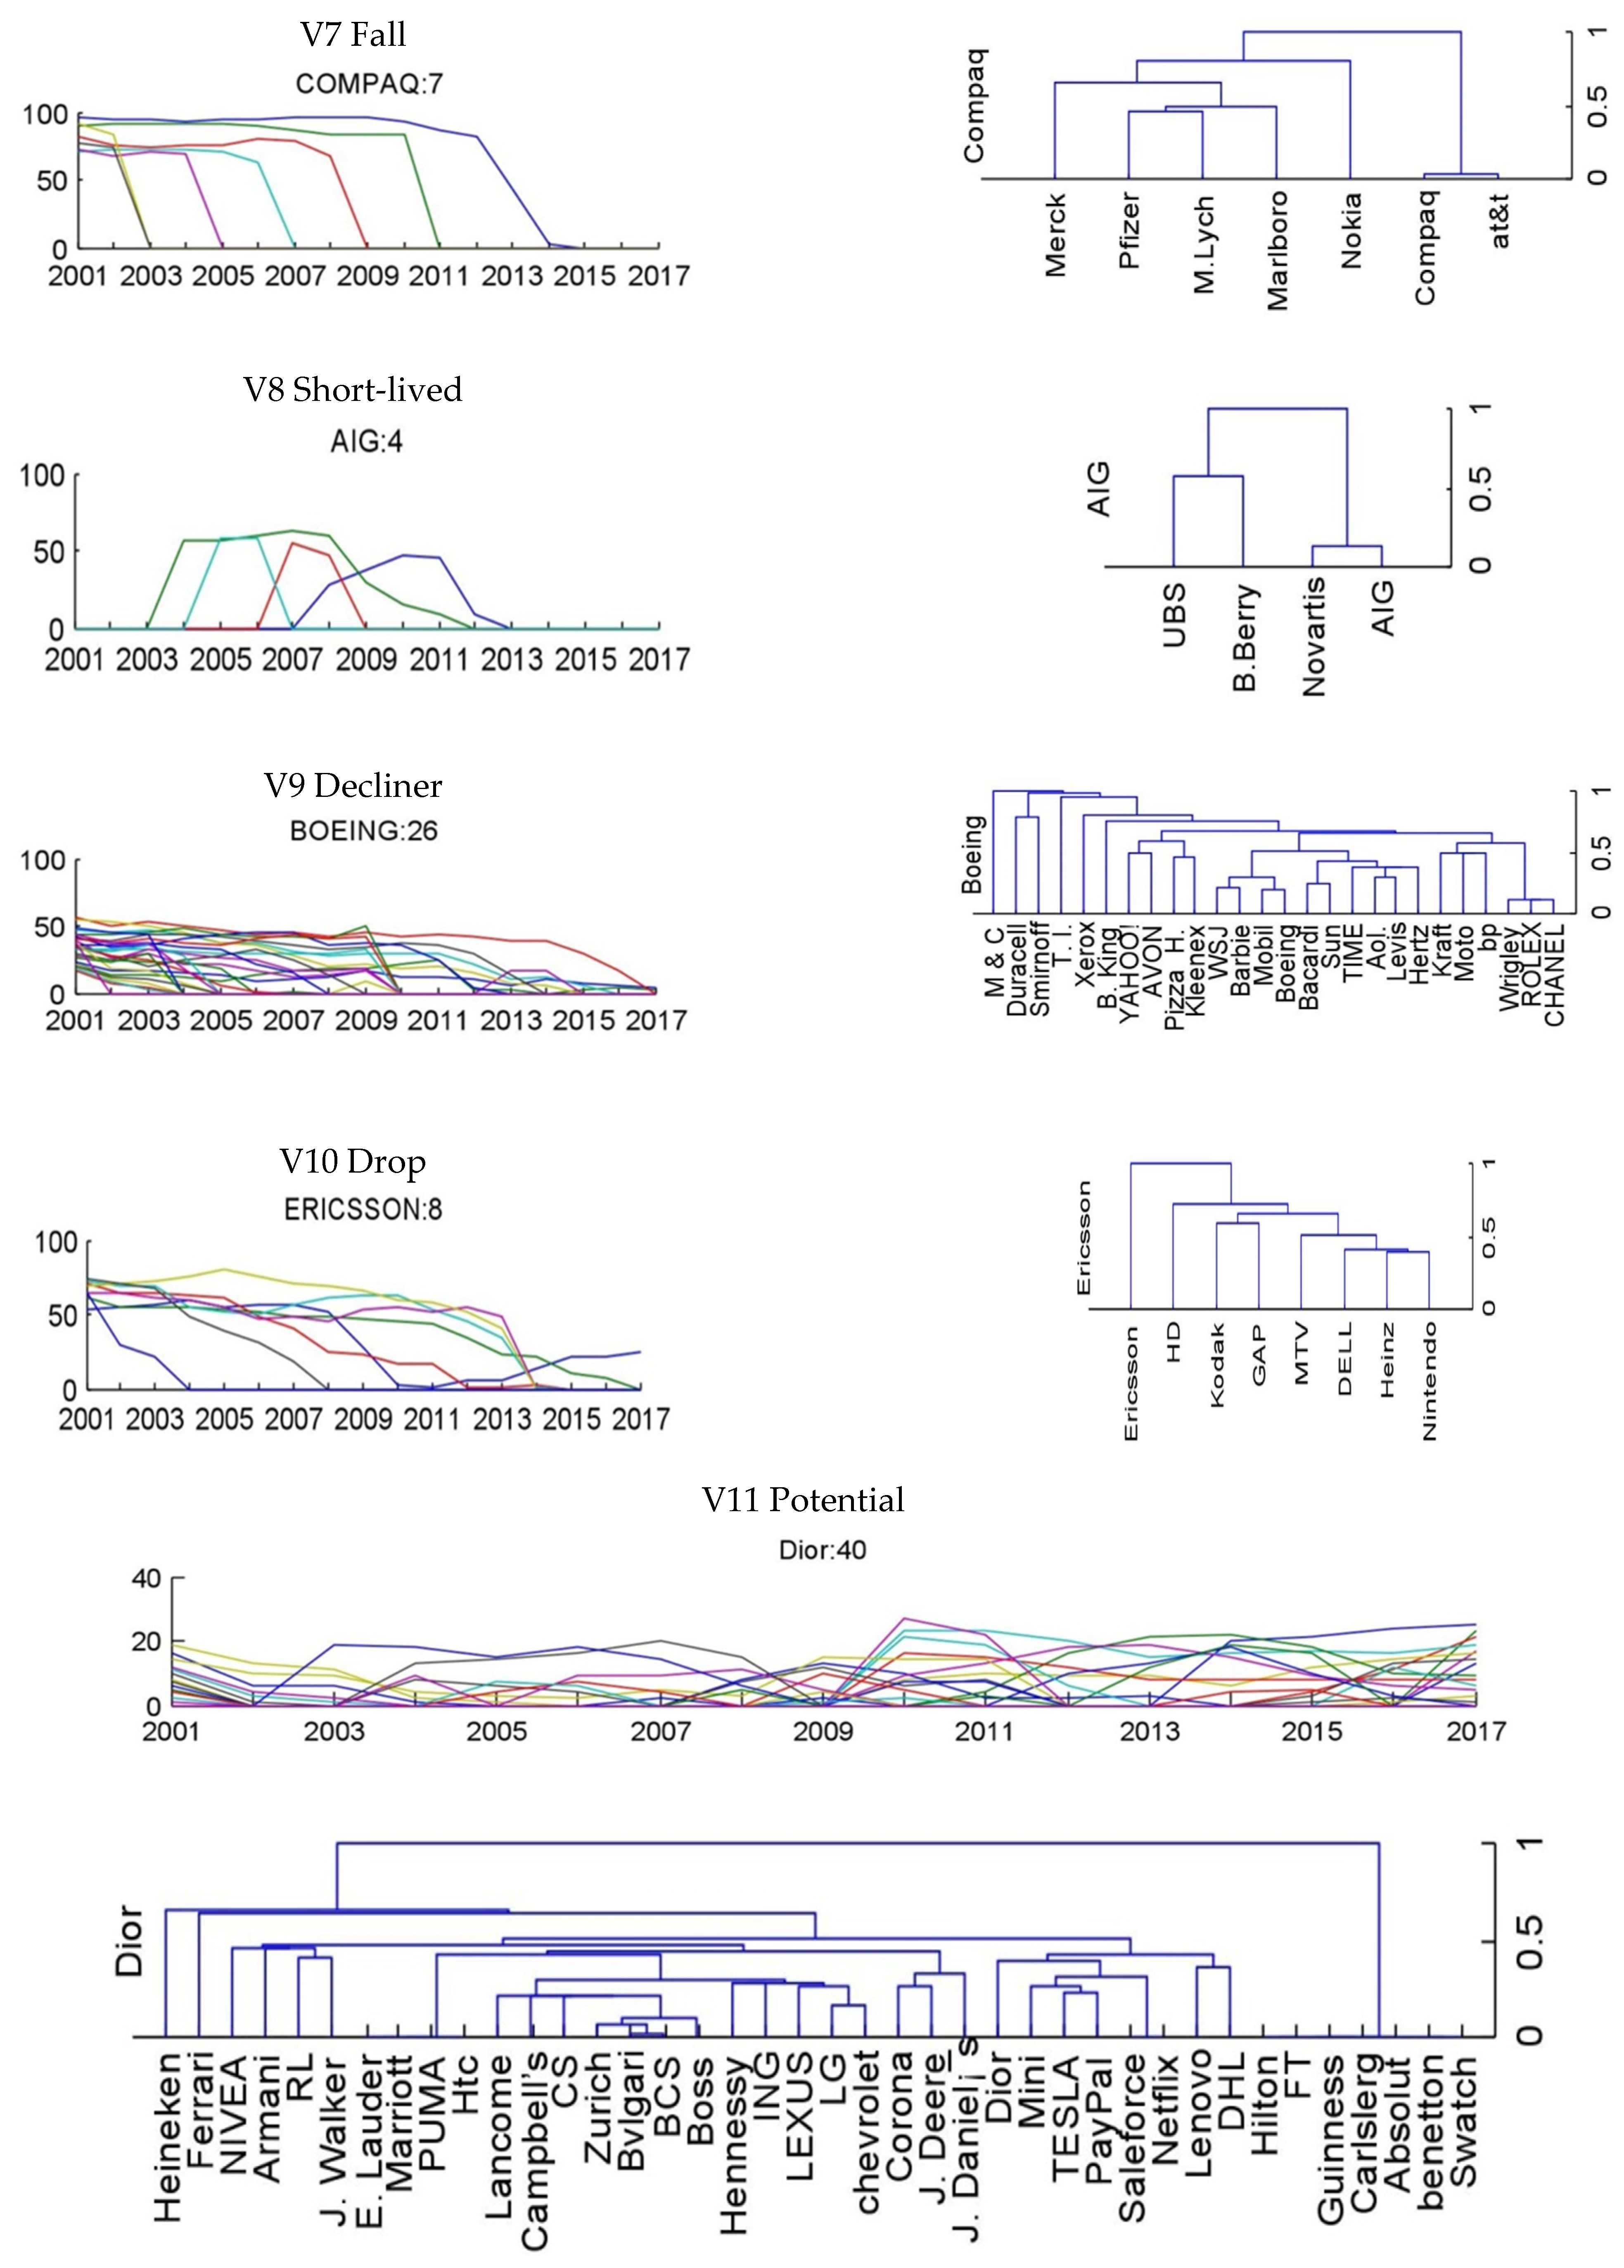
4.2. Study 2 Results: Trends of Evolution Based on the Value of the Ranking Lists
4.3. Study 3 Results: Mapping the Evolution Trend of Interbrand’s Rankings from 2018 to 2020
5. Discussion
5.1. Academic Contribution
5.2. Practical Contribution
5.3. Limitation and Future Research
Supplementary Materials
Author Contributions
Funding
Institutional Review Board Statement
Informed Consent Statement
Acknowledgments
Conflicts of Interest
References
- Keller, K.L. Reflections on Customer-based Brand Equity: Perspectives, Progress, and Priorities. AMS Rev. 2016, 6, 1–16. [Google Scholar] [CrossRef]
- Keller, K.L.; Swaminathan, V. Strategic Brand Management: Building, Measuring, and Managing Brand Equity, 5th ed.; Pearson Education Limited: Essex, UK, 2020. [Google Scholar]
- Swaminathan, V. Branding in the Digital Era: New Directions for Research on Customer-based Brand Equity. AMS Rev. 2016, 6, 33–38. [Google Scholar] [CrossRef]
- Dorfleitner, G.; R€oßle, F.; Lesser, K. The financial performance of the most valuable brands: A global empirical investigation. Heliyon 2019, 5, e01433. [Google Scholar] [CrossRef] [PubMed] [Green Version]
- Suder, G.; Chailan, C.; Suder, D. Strategic megabrand management: Does global uncertainty affect brands? A post-9/11 US/non-US comparison of the 100 biggest brands. J. Prod. Brand Manag. 2008, 17, 436–451. [Google Scholar] [CrossRef]
- Aaker, D.A. Managing Brand Equity; The Free Press: New York, NY, USA, 1991. [Google Scholar]
- Aaker, D.A. Building Strong Brands; The Free Press: New York, NY, USA, 1996. [Google Scholar]
- Raggio, R.D.; Leone, R.P. The theoretical separation of brand equity and brand value: Managerial implications for strategic planning. J. Brand Manag. 2007, 14, 380–395. [Google Scholar] [CrossRef] [Green Version]
- Chu, S.; Keh, H.T. Brand value creation: Analysis of the Interbrand–Business Week brand value rankings. Mark. Lett. 2006, 17, 323–331. [Google Scholar] [CrossRef]
- Bagna, E.; Dicuonzo, G.; Perrone, A.; Dell’Atti, V. The value relevance of brand valuation. Appl. Econ. 2017, 49, 5865–5876. [Google Scholar] [CrossRef]
- Harjoto, M.A.; Salas, J. Strategic and Institutional Sustainability: Corporate Social Responsibility, Brand Value, and Interbrand Listing. J. Prod. Brand Manag. 2017, 26, 545–558. [Google Scholar] [CrossRef]
- Thorisdottir, T.S.; Johannsdottir, L. Corporate Social Responsibility Influencing Sustainability within the Fashion Industry. A Systematic Review. Sustainability 2020, 12, 9167. [Google Scholar] [CrossRef]
- Cowan, K.; Guzman, F. How CSR reputation, sustainability signals, and country-of-origin sustainability reputation contribute to corporate brand performance: An exploratory study. J. Bus. Res. 2020, 117, 683–693. [Google Scholar] [CrossRef]
- Dutordoir, M.; Verbeeten, F.H.M.; Beijer, D.D. Stock price reactions to brand value announcements: Magnitude and moderators. Int. J. Res. Mark. 2015, 32, 34–47. [Google Scholar] [CrossRef]
- Interbrand’s Best Global Brand. Available online: https://interbrand.com/best-brands/ (accessed on 1 December 2020).
- Johansson, J.K.; Dimofte, C.V.; Mazvancheryl, S.K. The performance of global brands in the 2008 financial crisis: A test of two brand value measures. Int. J. Res. Mark. 2012, 29, 235–245. [Google Scholar] [CrossRef]
- Eisenmenger, N.; Pichler, M.; Nora, K.; Dominik, N.; Plank, B.; Ekaterina, S.; Marie-Theres, W.; Gingrich, S. The Sustainable Development Goals Prioritize Economic Growth Over Sustainable Resource use: A Critical Reflection on the SDGs from a Socio-Ecological Perspective. Sustain. Sci. 2020, 15, 1101–1110. [Google Scholar] [CrossRef]
- Lopez, B. Connecting business and sustainable development goals in Spain. Mark. Intell. Plan. 2020, 38, 573–585. [Google Scholar] [CrossRef]
- ElAlfy, A.; Palaschuk, N.; El-Bassiouny, D.; Wilson, J.; Weber, O. Scoping the Evolution of Corporate Social Responsibility (CSR) Research in the Sustainable Development Goals (SDGs) Era. Sustainability 2020, 12, 5544. [Google Scholar] [CrossRef]
- Olofsson, L.; Mark-Herbert, C. Creating Shared Values by Integrating UN Sustainable Development Goals in Corporate Communication—The Case of Apparel Retail. Sustainability 2020, 12, 8806. [Google Scholar] [CrossRef]
- Frey, B.J.; Dueck, D. Clustering by passing messages between data points. Science 2007, 315, 972–976. [Google Scholar] [CrossRef] [Green Version]
- Kelz, A.; Block, B. Global branding: Why and how? Ind. Manag. Data Syst. 1993, 93, 11. [Google Scholar] [CrossRef]
- Chabowski, B.; Samiee, S.; Hult, G. A bibliometric analysis of the global branding literature and a research agenda. J. Int. Bus. Stud. 2013, 44, 622–634. [Google Scholar] [CrossRef]
- Gürhan-Canli, Z.; Sarial-Abi, G.; Hayran, C. Consumers and Brands across the Globe: Research Synthesis and New Directions. J. Int. Mark. 2018, 26, 96–117. [Google Scholar] [CrossRef] [Green Version]
- Keller, K.L. Building Customer-Based Brand Equity: A Blueprint for Creating Strong Brands; Report No. 01-107; Marketing Science Institute: Cambridge, MA, USA, 2001; Available online: https://www.msi.org/wp-content/uploads/2020/06/MSI_Report_01-107.pdf (accessed on 1 December 2020).
- Mortanges, C.P.; Riel, A. Brand equity and shareholder value. Eur. Manag. J. 2003, 21, 521–527. [Google Scholar] [CrossRef]
- Madden, T.J.; Fehle, F.; Fournier, S. Brands matter: An empirical demonstration of the creation of shareholder value through branding. J. Acad. Mark. Sci. 2006, 34, 224–235. [Google Scholar] [CrossRef]
- Suder, G.; Czinkota, M.R. Towards An Understanding of Terrorism Risk in the MNE. Multinatl. Bus. Rev. 2005, 13, 3–23. [Google Scholar] [CrossRef]
- Suder, G.; Suder, D. The effect of macroeconomic threats on brand value and ranking: Insights from 10 years of fluctuations. J. Brand Manag. 2013, 20, 309–324. [Google Scholar] [CrossRef]
- Dauvergne, P.; Lister, J. Big brand sustainability: Governance prospects and environmental limits. Glob. Environ. Chang. 2012, 22, 36–45. [Google Scholar] [CrossRef]
- Gupta, S.; Kumar, V. Sustainability as corporate culture of a brand for superior performance. J. World Bus. 2013, 48, 311–320. [Google Scholar] [CrossRef] [Green Version]
- Gupta, S.; Czinkota, M.; Melewar, T.C. Embedding knowledge and value of a brand into sustainability for differentiation. J. World Bus. 2013, 48, 287–296. [Google Scholar] [CrossRef]
- Schultz, D.; Block, M.P. Beyond brand loyalty: Brand sustainability. J. Mark. Commun. 2015, 21, 340–355. [Google Scholar] [CrossRef]
- Grubor, A.; Milovanov, O. Brand Strategies in the Era of Sustainability. Interdiscip. Descr. Complex Syst. 2017, 15, 78–88. [Google Scholar] [CrossRef]
- Paetz, F. Recommendations for Sustainable Brand Personalities: An Empirical Study. Sustainability 2021, 13, 4747. [Google Scholar] [CrossRef]
- Loučanová, E.; Šupín, M.; Čorejová, T.; Repková-Štofková, K.; Šupínová, M.; Štofková, Z.; Olšiaková, M. Sustainability and Branding: An Integrated Perspective of Eco-innovation and Brand. Sustainability 2021, 13, 732. [Google Scholar] [CrossRef]
- Huang, Y.; Yang, S.; Zhu, Q. Brand equity and the Covid-19 stock market crash: Evidence from U.S. listed firms. Financ. Res. Lett. 2021, 101941. [Google Scholar] [CrossRef]
- Keller, K.L. Conceptualizing, measuring, and managing customer-based brand equity. J. Mark. 1993, 57, 1–22. [Google Scholar] [CrossRef]
- Christodoulides, G.; Chernatony, L. Consumer-based brand equity conceptualization and measurement: A literature review. Int. J. Market Res. 2010, 52, 43–66. [Google Scholar] [CrossRef] [Green Version]
- Christodoulides, G.; Cadogan, J.; Veloutsou, C. Consumer-based brand equity measurement: Lessons learned from an international study. Int. Mark. Rev. 2015, 32, 307–328. [Google Scholar] [CrossRef]
- Datta, H.; Ailawadi, K.L.; Heerde, V.H.J. How well does consumer-based brand equity align with sales based brand equity and marketing-mix response? J. Mark. 2017, 81, 1–20. [Google Scholar] [CrossRef] [Green Version]
- BrandZ’s Top 100 Most Valuable Global Brands 2020. Available online: https://www.kantar.com/campaigns/brandz/global (accessed on 1 December 2020).
- Forbes’ The World’s Most Valuable Brands. Available online: https://www.forbes.com/the-worlds-most-valuable-brands/#5e17a13b119c (accessed on 1 December 2020).
- Brand Finance Global 500. Available online: https://brandirectory.com/rankings/global/table (accessed on 1 December 2020).
- Ratnatunga, J.; Ewing, M.T. An ex-ante approach to brand capability valuation. J. Bus. 2009, 62, 323–331. [Google Scholar] [CrossRef]
- Fayyad, U.; Piatetsky-Shapiro, G.; Smyth, P. From Data Mining to Knowledge Discovery in Databases. AI Mag. 1996, 17, 37. [Google Scholar] [CrossRef]
- Wamba, S.F.; Gunasekaran, A.; Akter, S.; Ren, S.J.; Dubey, R.; Childe, S.J. Big data analytics and firm performance: Effects of dynamic capabilities. J. Bus. Res. 2017, 70, 356–365. [Google Scholar] [CrossRef] [Green Version]
- Mizik, N. Assessing the total financial performance impact of brand equity with limited time-series data. J. Mark. Res. 2014, 51, 691–706. [Google Scholar] [CrossRef]
- Sivarajah, U.; Kamal, M.M.; Irani, Z.; Weerakkody, V. Critical analysis of big data challenges and analytical methods. J. Bus. Res. 2017, 70, 263–286. [Google Scholar] [CrossRef] [Green Version]
- Liu, X.; Burns, A.C.; Hou, Y. An investigation of brand related user generated content on Twitter. J. Advert. 2017, 46, 236–247. [Google Scholar] [CrossRef]
- France, S.L.; Shi, Y.; Kazandjian, B. Web Trends: A valuable tool for business research. J. Bus. Res. 2021, 132, 666–679. [Google Scholar] [CrossRef]
- Giglio, S.; Pantano, E.; Bilotta, E.; Melewar, T.C. Branding luxury hotels: Evidence from the analysis of consumers’ big visual data on TripAdvisor. J. Bus. Res. 2019, 119, 495–501. [Google Scholar] [CrossRef]
- Berndt, D.J.; Clifford, J. Using dynamic time warping to find patterns in time series. In Proceedings of the 3rd International Conference on Knowledge Discovery and Data Mining (AAAIWS’94), Seattle, WA, USA, 31 July–1 August 1994; AAAI Press: Palo Alto, CA, USA, 1994; pp. 359–370. [Google Scholar]
- Li, H.; Wu, Y.J.; Chen, Y. Time is money: Dynamic model based time series data-mining for correlation analysis of commodity sales. J. Comput. Appl. Math. 2020, 370, 1–20. [Google Scholar] [CrossRef]
- Kschischang, F.R.; Frey, B.J.; Loeliger, H. Factor graphs and the sum-product algorithm. IEEE Trans. Inf. Theory 2001, 47, 498–519. [Google Scholar] [CrossRef] [Green Version]
- Givoni, I.E.; Frey, B.J. A Binary Variable Model for Affinity Propagation. Neural Comput. 2009, 21, 1589–1600. [Google Scholar] [CrossRef] [PubMed]
- Esling, P.; Agon, C. Time-series data mining. ACM Comput. Surv. 2012, 45, 1–34. [Google Scholar] [CrossRef] [Green Version]
- Keogh, E.; Pazzani, M. Derivative Dynamic Time Warping. In Proceedings of the First SIAM International Conference on Data Mining. SDM 2001, Chicago, IL, USA, 5–7 April 2001. [Google Scholar] [CrossRef] [Green Version]
- Wang, C.C.; Chang, S.C.; Chen, P.-Y. The Brand Sustainability Obstacle: Viewpoint Incompatibility and Consumer Boycott. Sustainability 2021, 13, 5174. [Google Scholar] [CrossRef]
- Suwala, L.; Albers, H.H. Corporate Spatial Responsibility and Sustainable Development Goals. In Decent Work and Economic Growth. Encyclopedia of the UN Sustainable Development Goals; Filho, W.L., Azul, A.M., Brandli, L., Salvia, A.L., Wall, T., Eds.; Springer: Berlin/Heidelberg, Germany, 2020; pp. 141–153. ISBN 978-3-319-71058-7. [Google Scholar] [CrossRef]


| Origin | Brand | Origin | Brand | Origin | Brand | Origin | Brand |
|---|---|---|---|---|---|---|---|
| US | 92 | Switzerland | 8 | Denmark | 2 | Finland | 1 |
| France | 11 | Italy | 5 | Spain | 2 | Ireland | 1 |
| Germany | 11 | Netherlands | 4 | Canada | 2 | Mexico | 1 |
| UK | 9 | South Korea | 4 | China | 2 | Taiwan | 1 |
| Japan | 9 | Sweden | 4 | Bermuda | 1 | Total | 168 |
| Sector | N | Sector | N | Sector | N | Sector | N |
|---|---|---|---|---|---|---|---|
| FMCG | 21 | Luxury | 12 | Beverages | 4 | Hospitality | 2 |
| Automotive | 18 | Media | 8 | Internet Services | 4 | Home Furnishings | 1 |
| Financial Service | 20 | Business Service | 7 | Energy | 3 | Tobacco | 1 |
| Technology | 15 | Apparel | 6 | Pharmaceuticals | 3 | Telecommunications | 1 |
| Alcohol | 12 | Diversified | 6 | Sporting Goods | 3 | Toys & Games | 1 |
| Electronics | 12 | Restaurants | 5 | Transportation | 3 | Enterprise | 1 |
| Value | Exemplar | N | Description |
|---|---|---|---|
| V1 | 9 | Fast Riser | |
| V2 | Gillette | 27 | Top Tier |
| V3 | GUCCI | 10 | Stable |
| V4 | Adobe | 19 | Slow Grower |
| V5 | Hewlett Packard | 9 | Sudden Entrant |
| V6 | Caterpillar | 27 | Unstable |
| V7 | Compaq | 10 | Fall |
| V8 | AIG | 4 | Short lived |
| V9 | Boeing | 26 | Decline |
| V10 | Ericsson | 8 | Drop |
| V11 | Dior | 40 | Potential |
| Origin | 2001–2017 | % | 2001–2020 | % |
|---|---|---|---|---|
| US | 91 | 54% | 97 | 55.4% |
| France | 11 | 6.6% | 11 | 6.3% |
| Germany | 11 | 6.6% | 11 | 6.3% |
| UK | 9 | 5.5% | 9 | 5.1% |
| Japan | 8 | 4.8% | 9 | 5.1% |
| Switzerland | 8 | 4.8% | 8 | 4.7% |
| Italy | 5 | 3% | 5 | 2.9% |
| Netherlands | 4 | 2.3% | 4 | 2.3% |
| South Korea | 4 | 2.3% | 4 | 2.3% |
| Sweden | 4 | 2.3% | 4 | 2.3% |
| Denmark | 2 | 1.1% | 2 | 1.1% |
| Spain | 2 | 1.1% | 2 | 1.1% |
| Canada | 2 | 1.1% | 2 | 1.1% |
| China | 2 | 1.1% | 2 | 1.1% |
| Others | 5 | 3% | 5 | 2.9% |
| Total | 168 | 175 |
| 2017 | 2018 | 2019 | 2020 | |
|---|---|---|---|---|
| Alcohol | 7 | 6 | 6 | 6 |
| Apparel | 2 | 2 | 2 | 2 |
| Automotive | 15 | 16 | 15 | 15 |
| Beverages | 4 | 4 | 3 | 3 |
| Business Service | 6 | 5 | 5 | 7 |
| Diversified | 5 | 5 | 5 | 5 |
| Electronics | 4 | 5 | 5 | 6 |
| Energy | 1 | 1 | 1 | 0 |
| Enterprise | 1 | 1 | 1 | 0 |
| Financial Service | 12 | 12 | 12 | 12 |
| FMCG | 9 | 9 | 9 | 9 |
| Logistics | 0 | 0 | 0 | 3 |
| Home Furnishings | 1 | 1 | 1 | 0 |
| Hospitality | 0 | 0 | 0 | 0 |
| Internet Services | 3 | 4 | 3 | 0 |
| Luxury | 8 | 9 | 9 | 9 |
| Media | 3 | 3 | 6 | 7 |
| Pharmaceuticals | 0 | 0 | 0 | 0 |
| Restaurants | 3 | 3 | 3 | 3 |
| Retail | 0 | 0 | 0 | 2 |
| Sporting Goods | 2 | 2 | 2 | 2 |
| Technology | 11 | 9 | 9 | 9 |
| Telecommunications | 0 | 0 | 0 | 0 |
| Tobacco | 0 | 0 | 0 | 0 |
| Toys & Games | 0 | 0 | 0 | 0 |
| Transportation | 3 | 3 | 3 | 0 |
| 100 | 100 | 100 | 100 |
| Part A | ||||||||
|---|---|---|---|---|---|---|---|---|
| Brand | 2017 | 2018 | 2019 | 2020 | Sector | Origin | Value | Trend |
| Oracle | 17 | 20 | 18 | — | Business Services | USA | V2 | Top Tier |
| Adobe | 56 | 51 | 39 | 27 | Technology | USA | V4 | Slow Grower |
| Thomson Reuters | 66 | — | — | — | Business Services | Canada | V3 | Stable |
| Harley Davidson | 77 | 93 | 99 | — | Automotive | USA | V10 | Drop |
| NETFLIX | 78 | 66 | 65 | 41 | Media | USA | V11 | Potential |
| Discovery | 79 | 81 | 91 | — | Media | USA | V6 | Unstable |
| Salesforce | 84 | 75 | 70 | 58 | Business | USA | V11 | Potential |
| Sprite | 90 | 96 | — | — | Beverages | USA | V6 | Unstable |
| Shell | 91 | 89 | 97 | — | Energy | Netherlands | V6 | Unstable |
| John Deere | 92 | 88 | 84 | 89 | Diversified | USA | V11 | Potential |
| Corona | 93 | 85 | 79 | 78 | Alcohol | Mexico | V11 | Potential |
| PRADA | 94 | 95 | 100 | 99 | Luxury | USA | V6 | Unstable |
| Dior | 95 | 91 | 82 | 83 | Luxury | France | V11 | Potential |
| Johnnie Walker | 96 | 97 | — | 98 | Alcohol | UK | V11 | Potential |
| SMIRNOFF | 97 | — | — | — | Alcohol | UK | V9 | Decline |
| TESLA | 98 | — | — | 40 | Technology | USA | V11 | Potential |
| Moët & Chandon | 99 | — | — | — | Alcohol | France | V9 | Decline |
| Part B | ||||||||
| Brand | 2017 | 2018 | 2019 | 2020 | Sector | Origin | Value | Trend |
| — | — | — | 20 | Media | USA | |||
| CHANEL | — | 23 | 22 | 21 | Luxury | France | V9 | Decline |
| YouTube | — | — | — | 30 | Media | USA | ||
| Spotify | — | 92 | 92 | 70 | Media | Sweden | ||
| Nintendo | — | 99 | 89 | 76 | Electronics | Japan | V10 | Drop |
| — | — | 98 | 90 | Media | USA | |||
| Hennessy | — | 98 | 95 | 91 | Alcohol | France | V11 | Potential |
| Uber | — | — | 87 | 96 | Technology | USA | ||
| Zoom | — | — | — | 100 | Technology | USA | ||
Publisher’s Note: MDPI stays neutral with regard to jurisdictional claims in published maps and institutional affiliations. |
© 2021 by the authors. Licensee MDPI, Basel, Switzerland. This article is an open access article distributed under the terms and conditions of the Creative Commons Attribution (CC BY) license (https://creativecommons.org/licenses/by/4.0/).
Share and Cite
Chang, Y.-Y.; Huang, H.-C. Exploring Patterns of Evolution for Successful Global Brands: A Data-Mining Approach. Sustainability 2021, 13, 7915. https://doi.org/10.3390/su13147915
Chang Y-Y, Huang H-C. Exploring Patterns of Evolution for Successful Global Brands: A Data-Mining Approach. Sustainability. 2021; 13(14):7915. https://doi.org/10.3390/su13147915
Chicago/Turabian StyleChang, Yu-Yin, and Heng-Chiang Huang. 2021. "Exploring Patterns of Evolution for Successful Global Brands: A Data-Mining Approach" Sustainability 13, no. 14: 7915. https://doi.org/10.3390/su13147915
APA StyleChang, Y.-Y., & Huang, H.-C. (2021). Exploring Patterns of Evolution for Successful Global Brands: A Data-Mining Approach. Sustainability, 13(14), 7915. https://doi.org/10.3390/su13147915