Article

Does the Community Conservancy Model Work for Pastoralists? Insights from Naibunga Conservancy in Northern Kenya

by
Ken Ogao Oburah
1,*,
Clement Lenachuru
1 and
Wilfred O. Odadi
1,2,*
1
Department of Natural Resources, Egerton University, 536-20115 Egerton, Kenya
2
Mpala Research Centre, 555-10400 Nanyuki, Kenya
*
Authors to whom correspondence should be addressed.
Sustainability 2021, 13(14), 7772; https://doi.org/10.3390/su13147772
Submission received: 11 May 2021 / Revised: 18 June 2021 / Accepted: 21 June 2021 / Published: 12 July 2021

Abstract

:
Community conservancies are increasingly being established across African pastoral rangelands to help bolster wildlife conservation and livelihoods. Enhancing the effectiveness and sustainability of such conservancies requires better understanding of local community participation and perceptions of their socioeconomic outcomes. Working in Naibunga Community Conservancy in northern Kenya, we evaluated: (1) local community members’ perceptions of conservancy-related socioeconomic outcomes; (2) their involvement in conservancy management and conservation activities; and (3) association between these factors (perceptions and involvement) and various demographic factors. We conducted surveys in 358 households, selected using multi-stage sampling, and additionally interviewed key informants. Large proportions (65–90%) respondents perceived conservancy-related improvements in their overall socioeconomic status, security, household income, livestock numbers, and accessibility to grazing resources, schools, and health facilities. Over 75% of respondents indicated that they were involved in conservancy management and conservation activities. Involvement in these activities was positively associated with perception of socioeconomic improvements. In addition, various demographic factors shaped both perceptions of socioeconomic changes and involvement in conservancy activities. Our findings suggest that community conservancies can improve local pastoralists’ socioeconomic wellbeing. Such conservancies can achieve far greater outcomes with greater focus on maximizing socioeconomic benefits for local pastoralists and enhancing their participation in conservancy activities.

1. Introduction

Despite a twofold global increase in government-protected conservation areas over the past five decades, such protected areas are considered too small and highly isolated to support viable populations of wildlife [1,2]. Consequently, large proportions of the world’s wildlife are found outside government-protected areas [2,3]. In East Africa, for example, it is estimated that 70% of wildlife populations are dispersed outside government-protected areas, mostly on community and private lands [4,5,6]. However, wildlife populations have been rapidly dwindling in these areas [1], partly due to increased land degradation, habitat loss, and increased human–wildlife conflicts.
The continued decline in wildlife populations has made it necessary for national and international support towards engaging communities and private landowners who live with wildlife in efforts to sustainably conserve biodiversity and support community livelihoods [7,8]. This engagement typically encompasses the involvement of local communities in conservation (community-based conservation) as an alternative approach to wildlife conservation in recognition of the costs the communities living with wildlife suffer [9]. In particular, considerable efforts have been directed towards promoting and facilitating the establishment of community conservancies to bolster conservation of wildlife on communal pastoral lands [8,9]. Consequently, many pastoral rangelands have been transformed into community conservancies where pastoralism and biodiversity conservation are jointly pursued through collaborative, decentralized arrangements for managing communal lands and natural resources [10]. Such conservancies are thought to act as a catalyst for wildlife conservation, environmental rehabilitation, resource conflict resolution, and sustainable livelihood development for local pastoralist communities [6,8,11,12,13,14]
In northern Kenya, a community conservancy typically develops a natural resource management plan that encompasses participatory land zoning, designating zones for core conservation, livestock grazing, and human settlement [6]. Under this plan, sustainable land and grazing management practices such as planned grazing and rangeland restoration activities are implemented [10,12]. In addition, pastoralists often trade off some of their traditional pastoral practices for management practices that incorporate wildlife conservation and wildlife-based tourism [13]. For example, the creation of conservation zones under the conservancy model reduces livestock grazing areas and restricts access to areas that pastoralists once relied on for livestock forage [14]. Additionally, many pastoralists and agro-pastoralists have had to contend with heightened human–wildlife conflicts in various forms, including increased livestock depredation by carnivores, injuries to humans inflicted by wildlife, crop-raiding by wild herbivores, competition for pasture and water, and transmission of zoonotic parasites and diseases [15].
From the foregoing, community conservancies can have potentially significant socioeconomic implications for local pastoralists’ socioeconomic wellbeing as well as for the conservation of natural resources. However, the actual implications of such conservancies on the socioeconomic wellbeing of the local pastoralist communities remain poorly understood. Understanding such implications is important for enhancing socioeconomic effectiveness and the sustainable management of community conservancies for biodiversity conservation and livelihoods. In addition, it is important to understand the extent to which local pastoralists are involved in conservancy management and conservation programs because local participation is a key determinant of successful implementation of community-based conservation initiatives [16,17]. In this study, we investigated local perceptions of the socioeconomic outcomes of a community-based conservancy in northern Kenya. We also assessed local participation in conservancy management and conservation activities. Finally, we evaluated the interaction between local community members’ perceptions of conservancy-driven socioeconomic outcomes and their involvement in conservancy management and conservation activities, and how each of these factors is shaped by various demographic factors.

2. Materials and Methods

2.1. Study Area

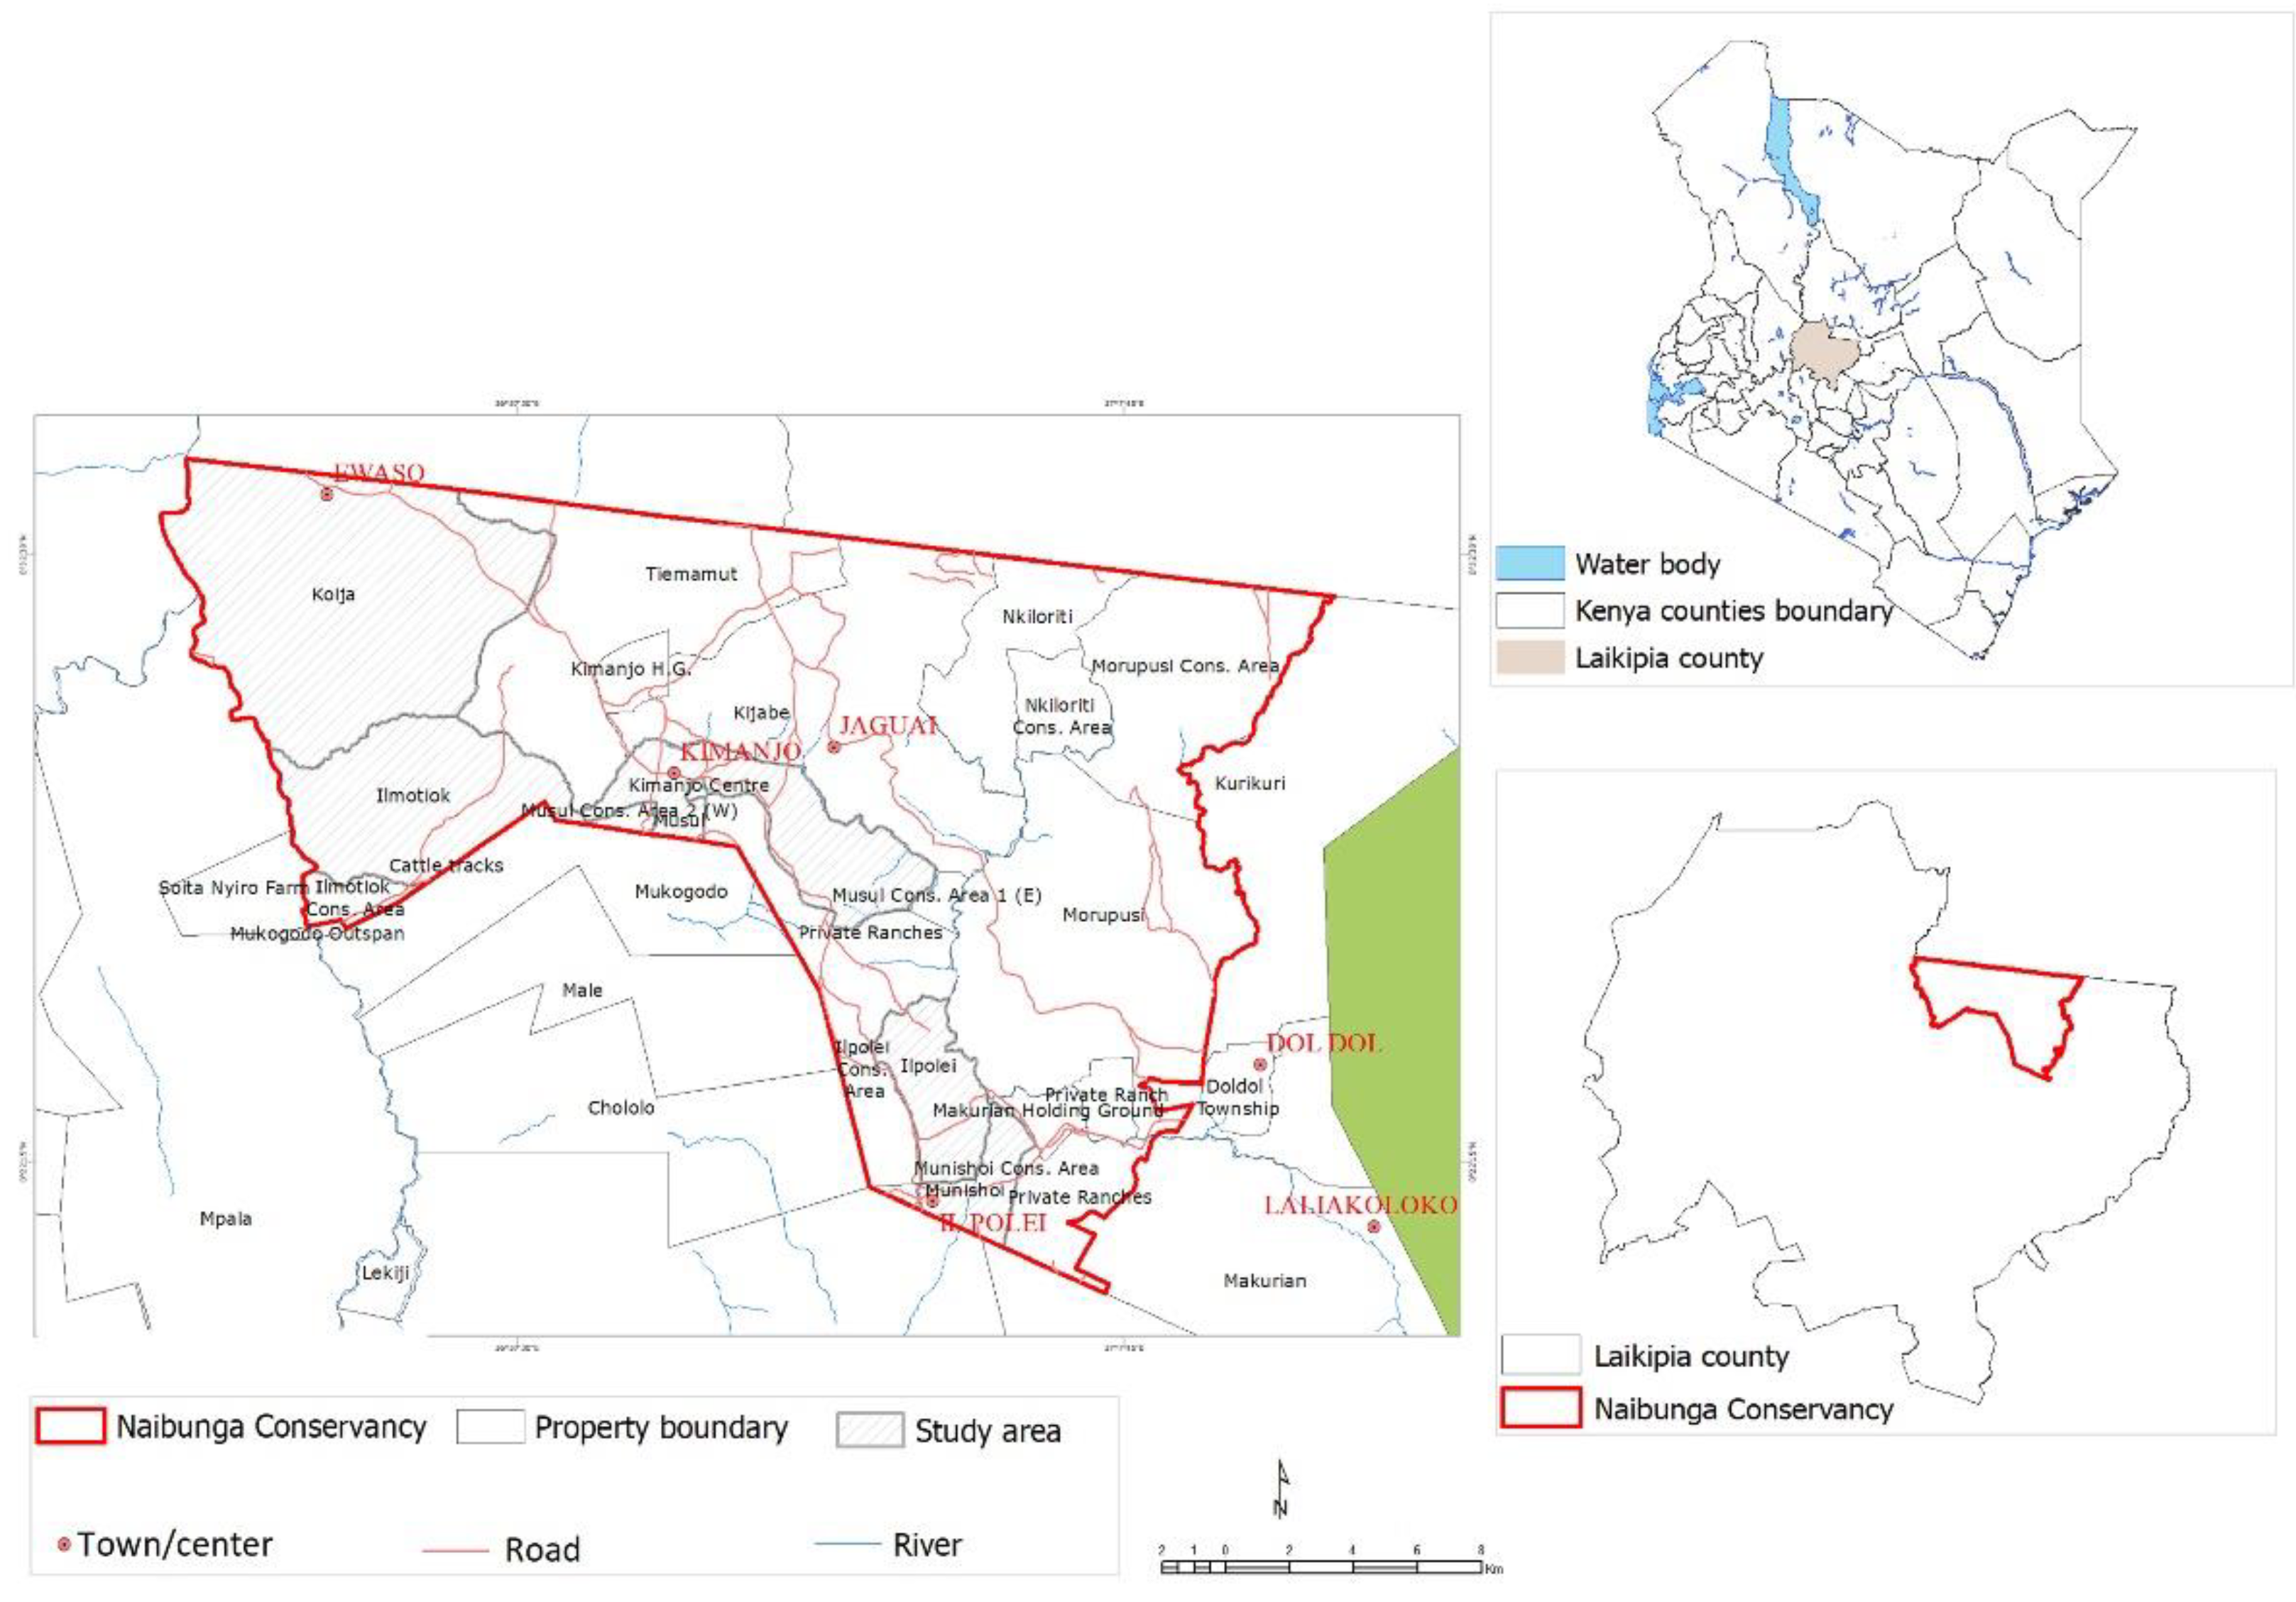
The study was conducted in Naibunga Community Conservancy (hereafter, “Naibunga Conservancy”) located in Laikipia County, Kenya (Figure 1). Naibunga Conservancy lies within longitude 36°5′–37°15′ and latitude 0°20′ N–0°35′ N. The conservancy comprises nine community group ranches: Koija, Kijabe, Tiamamut, Il Motiok, Nkiloriti, Munishoi, Musul, Il Polei, and Murupusi. It covers a total area of 47,740 hectares of land.
Naibunga Conservancy experiences relief or orographic rainfall due to its altitude and location. It receives 400–700 mm of rainfall annually. Rainfall is typically distributed in two seasons: the long rains, between April and June, and the short rains, between October and December. The annual mean temperature ranges between 16 °C and 26 °C [18].
Naibunga Conservancy is largely characterized by savanna vegetation with varying densities of woody vegetation. The herbaceous layer is comprised of perennial grasses such as Themeda triandra, Eragrostis tenuifolia, Cenchrus ciliaris, Aristida congesta, and numerous species of forbs. The woody species layer comprises of trees and shrubs including whistling thorn acacia (Acacia drepanolobium), wait-a-bit thorn (Acacia mellifera), mgunga (Acacia etbaica), prickly thorn (Acacia brevispica), and white crossberry (Grewia tenax) [19]. Some areas have also been encroached by unpalatable weeds such as Sansevieria intamida, Opuntia spp., and Ipomea spp. which have significantly reduced important grazing areas [20].
The area is an important home and a migratory corridor for elephants. It also hosts several other wild mammals, including plains zebras, Grevy’s zebras, gerenuks, warthogs, dik-diks, impalas, gazelles, hippos, buffaloes, African wild dogs, hyenas, and lions, underscoring the ecological importance of the conservancy [6,21].
Livestock rearing, primarily through pastoralism, and wildlife-based tourism are the major socioeconomic activities in the area. Other socioeconomic activities include charcoal burning, small-scale businesses, sand extraction, subsistence farming, beekeeping, and subsistence hunting [21,22].

2.2. Study Design and Data Collection

We collected data through household surveys and key informant interviews during January–February 2021. For household surveys, we used a multi-stage sampling strategy to select households to be included in the study. First, five out of the nine group ranches that constitute Naibunga Conservancy were randomly selected: Koija, Il Motiok, Musul, Munishoi, and Murupusi. Transect walks/drives were then conducted in randomly selected settlements areas in each of the selected group ranches with every household encountered selected for the study. A total of 358 households proportionately distributed among the five selected group ranches based on their population size were included in the study. Structured questionnaires were used to collect data from the selected households, with household heads or their suitable adult representatives as the respondents. The questionnaires were administered face-to-face by trained enumerators drawn from the local communities.
Through the household surveys, we collected data on the respondents’ perception of conservancy-related changes in their overall socioeconomic status and various other socioeconomic indicators, namely, average household income, ownership and herd size of different livestock types, security situation, status of roads, and accessibility to grazing resources, water, health facilities, schools, and electricity. The indicators were adopted from the World Bank Poverty Framework, which views socioeconomic status as a complex product of the opportunities available to a household, the security under which such opportunities are exploited, and the empowerment level a household or community possess [23]. We also sought to find out whether, and to what extent (number of hours per week), respondents were involved in the management and conservation activities implemented by the conservancy. In addition, we collected data on various demographic factors including gender, formal education, household size (i.e., number of individuals per household), occupation, main source of livelihood, ownership of different livestock types (cattle, sheep and goats (combined), camels, and donkeys), and livestock herd size (i.e., number of animals by livestock type). The levels of the various factors assessed during household surveys are detailed in Table A1.
We employed key informant interviews to collect qualitative data. The key informants included the chairpersons of the five selected group ranches (one per group ranch) and four leaders of the conservancy’s land management committees. The key informants were interviewed on the conservancy’s socioeconomic development, management and conservation strategies, initiatives, and programs. In addition, we sought key informants’ opinions on conservancy-related socioeconomic outcomes for local community members, with emphasis on local livelihoods, security situation, and accessibility to water, forage resources, schools, and health facilities.

2.3. Data Analysis

We analyzed quantitative data using Statistical Package for Social Sciences (SPSS) statistical software version 26 [24]. We used descriptive statistics (percentages and counts) to summarize these data. Chi-square tests were used to test for association between various categorical variables. Specifically, we tested for association between local perceptions of conservancy-related socioeconomic outcomes and involvement in conservancy management and conservation activities. We also tested for association between gender and education. In addition, we tested for association between each of selected demographic attributes (gender, education, household size, livestock ownership, and herd size) and respondents’: (1) perception of conservancy-related socioeconomic outcomes; and (2) involvement in conservancy management and conservation activities. For multi-level factors, we sometimes combined levels for better interpretation or when doing so was necessary to satisfy the Chi-square test of association’s assumption of at least 80% of cells having expected count values not lower than 5 [25]. The levels of each factor used in these Chi-square tests are specified in Table A1. We accepted statistical significance at p < 0.05.
We analyzed qualitative data from key informant interviews using thematic analysis. Specifically, we grouped and summarized qualitative data under three main themes: (1) the conservancy’s strategies to enhance the socioeconomic wellbeing of local community members; (2) the conservancy’s strategies and initiatives for local community participation in conservancy management and conservation activities; and (3) the socioeconomic outcomes of the conservancy’s socioeconomic development and conservation strategies, initiatives, and programs.

3. Results

3.1. Demographics

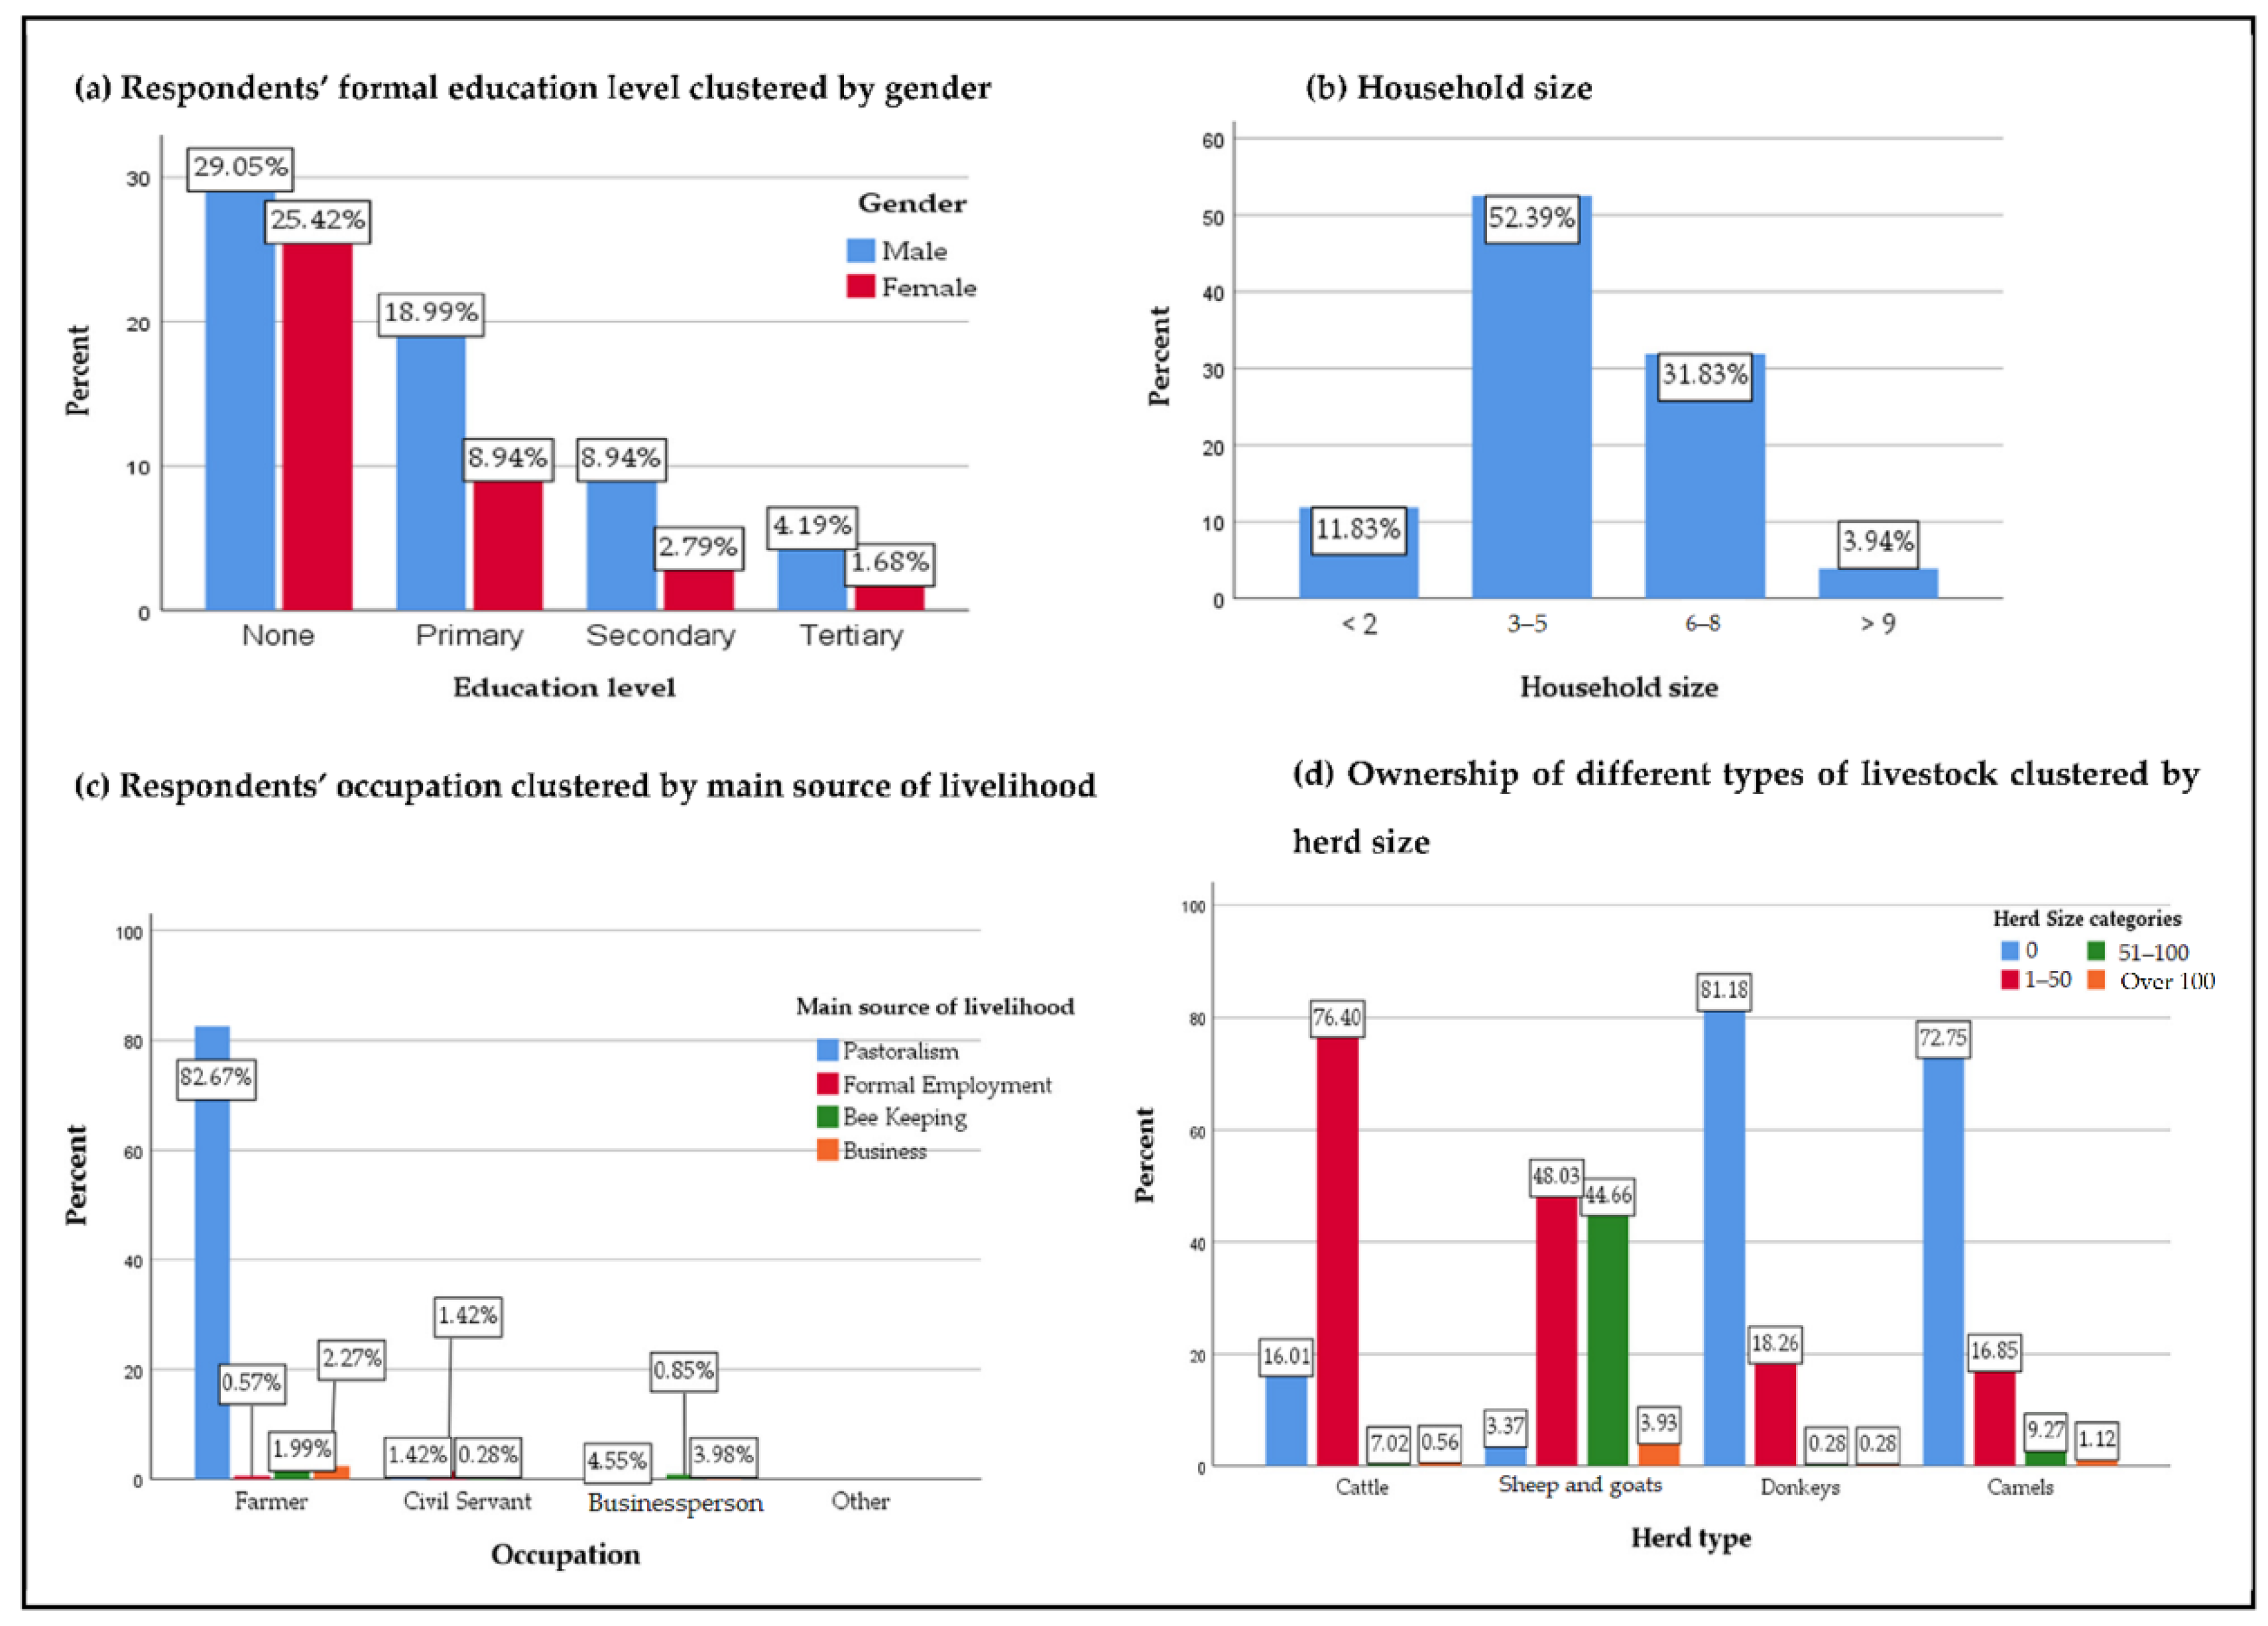
A majority (61.2%) of the respondents were males (Figure 2a). Overall, a slight majority (54%) of the respondents had no formal education (Figure 2a). Of those who had formal education, the majority (61.3%) had primary education, whereas 25.8% and 12.9% had secondary and tertiary education, respectively. Notably, there was a significant association between education level and gender, with males generally being more educated than females (χ2 = 11.9, p = 0.008; Figure 2a).
In terms of household size, slightly more than one half of the sampled households had 3–5 individuals, whereas 31.8%, 11.8%, and 3.9% of the households were comprised of 6–8, <3, and >9 individuals, respectively (Figure 2b). Farming was the main occupation; 87.7% of the respondents reported that they were farmers (Figure 2c). All other respondents not involved in farming were either businesspersons (9.2%) or civil servants (3.1%) (Figure 2c). An overwhelming majority (82.4%) of the respondents who indicated that they were farmers practiced pastoralism as their main source of livelihood (Figure 2c). Most (76.4%) of the sampled households owned 50 or fewer cattle (Figure 2d). In addition, 48% and 44.7% of them owned 1–50 and 51–100 small stock (sheep and goats), respectively (Figure 2d). Donkeys and camels were relatively less common as more than 72% of the sampled households owned neither of these livestock types (Figure 2d).

3.2. Conservancy-Related Socioeconomic Outcomes

Nearly 90% of the respondents perceived that the conservancy had improved their overall socioeconomic status (Table 1). Analysis of other socioeconomic attributes revealed that the security situation, accessibility to grazing resources, household income, and accessibility to schools improved the most, with more than 72% of the respondents perceiving improvements in these attributes. In the second tier were improvements in accessibility to health facilities and livestock numbers, with 66.1% and 65.3% of the respondents perceiving improvements in these attributes, respectively (Table 1). Moderate proportions (52.9% and 53.5%) of the respondents perceived improvements in the status of roads and accessibility to water, whereas only slightly more than 25% of the respondents perceived improved accessibility to electricity (Table 1). Based on livestock type, high proportions (67–70%) of respondents perceived increases in the number of cattle and sheep and goats, whereas only 22.1% and 8.1% of respondents perceived increases in camel and donkey numbers, respectively (Table 1).
Key informant interviews revealed increased employment opportunities for local community members under the community conservancy setting. For example, through collaboration between the community conservancy and the Northern Rangelands Trust (NRT), an umbrella membership organization for community conservancies in the region, local community members get employed as conservancy managers, community scouts (rangers), and grazing coordinators. Key informants also indicated that through partnership with NRT and other stakeholders, members of the conservancy benefit from improved access to livestock markets through initiatives such as “Livestock to Market” (LTM) and “livestockWORKS” [26,27]. They further noted that these initiatives have helped minimize reliance on exploitative middlemen, thereby enabling local pastoralists to maximize profits from livestock sales. In addition, the key informants revealed that through partnership with various stakeholders, the conservancy has improved market access for local women’s handicraft products. The key informants further revealed that under the conservancy, various youth groups are usually trained on financial management prior to accessing credit facilities such as savings and credit co-operatives (SACCO) loans for entrepreneurship. Further, the key informants indicated that local conservancy members benefit from increased livestock productivity due to conservancy-related improvements in ecological conditions coupled with increased access to grazing resources.
Regarding security, the key informants revealed that through partnership with NRT, the conservancy has employed community scouts, who conduct community patrols to help maintain security. In addition, the key informants indicated that the conservancy has a functional conflict resolution committee, which “has immensely contributed to timely response in case of attacks by cattle rustlers, and mediation of any misunderstanding”. Explaining the impact of insecurity, one key informant said, “Insecurity has been costing us our livestock and grazing resources. We have frequently suffered incursions from Isiolo and Samburu. When they attack one area of the conservancy, there is always a shift in (grazing) pressure from the insecure areas to secure areas. For example, the current insecurity situation in Tiamamut has shifted (grazing) pressure into Musul, Koija, and Il Motiok leading to scarce grazing resources in those areas”.
However, the key informants indicated that the security situation has generally improved across the conservancy due to conservancy-led security enhancement efforts. The key informant further observed, “however, the situation is not as bad as it was before, we now have improved security and with improved security, we at least have enough grazing resources for ourselves as our community patrol teams on many occasions have foiled such attacks before they happen. In addition, National Police Reservists have helped a lot as they collaborate with Administration Police to respond timely to any insecurity situation”.
Concerning accessibility to water, the key informants indicated that although the conservancy has helped increase the number of water pans across the landscape, accessibility to water remains a challenge because such water pans dry up almost immediately when the dry season sets in. They also noted that water scarcity is one of the biggest problems facing local community members, who are often forced to walk for long distances in search of water. One of the key informants opined, “water is not enough as we share the same with our livestock and wildlife, particularly elephants”. However, the key informants indicated that the conservancy currently has a water committee charged with managing and rehabilitating existing water points.
The key informants indicated that one way in which the conservancy enhances accessibility to schools is providing bursaries to needy students. Regarding accessibility to health facilities, the key informers revealed that the conservancy from time to time helps offset hospital bills for needy community members.

3.3. Local Community Involvement in Conservancy Management and Conservation Activities

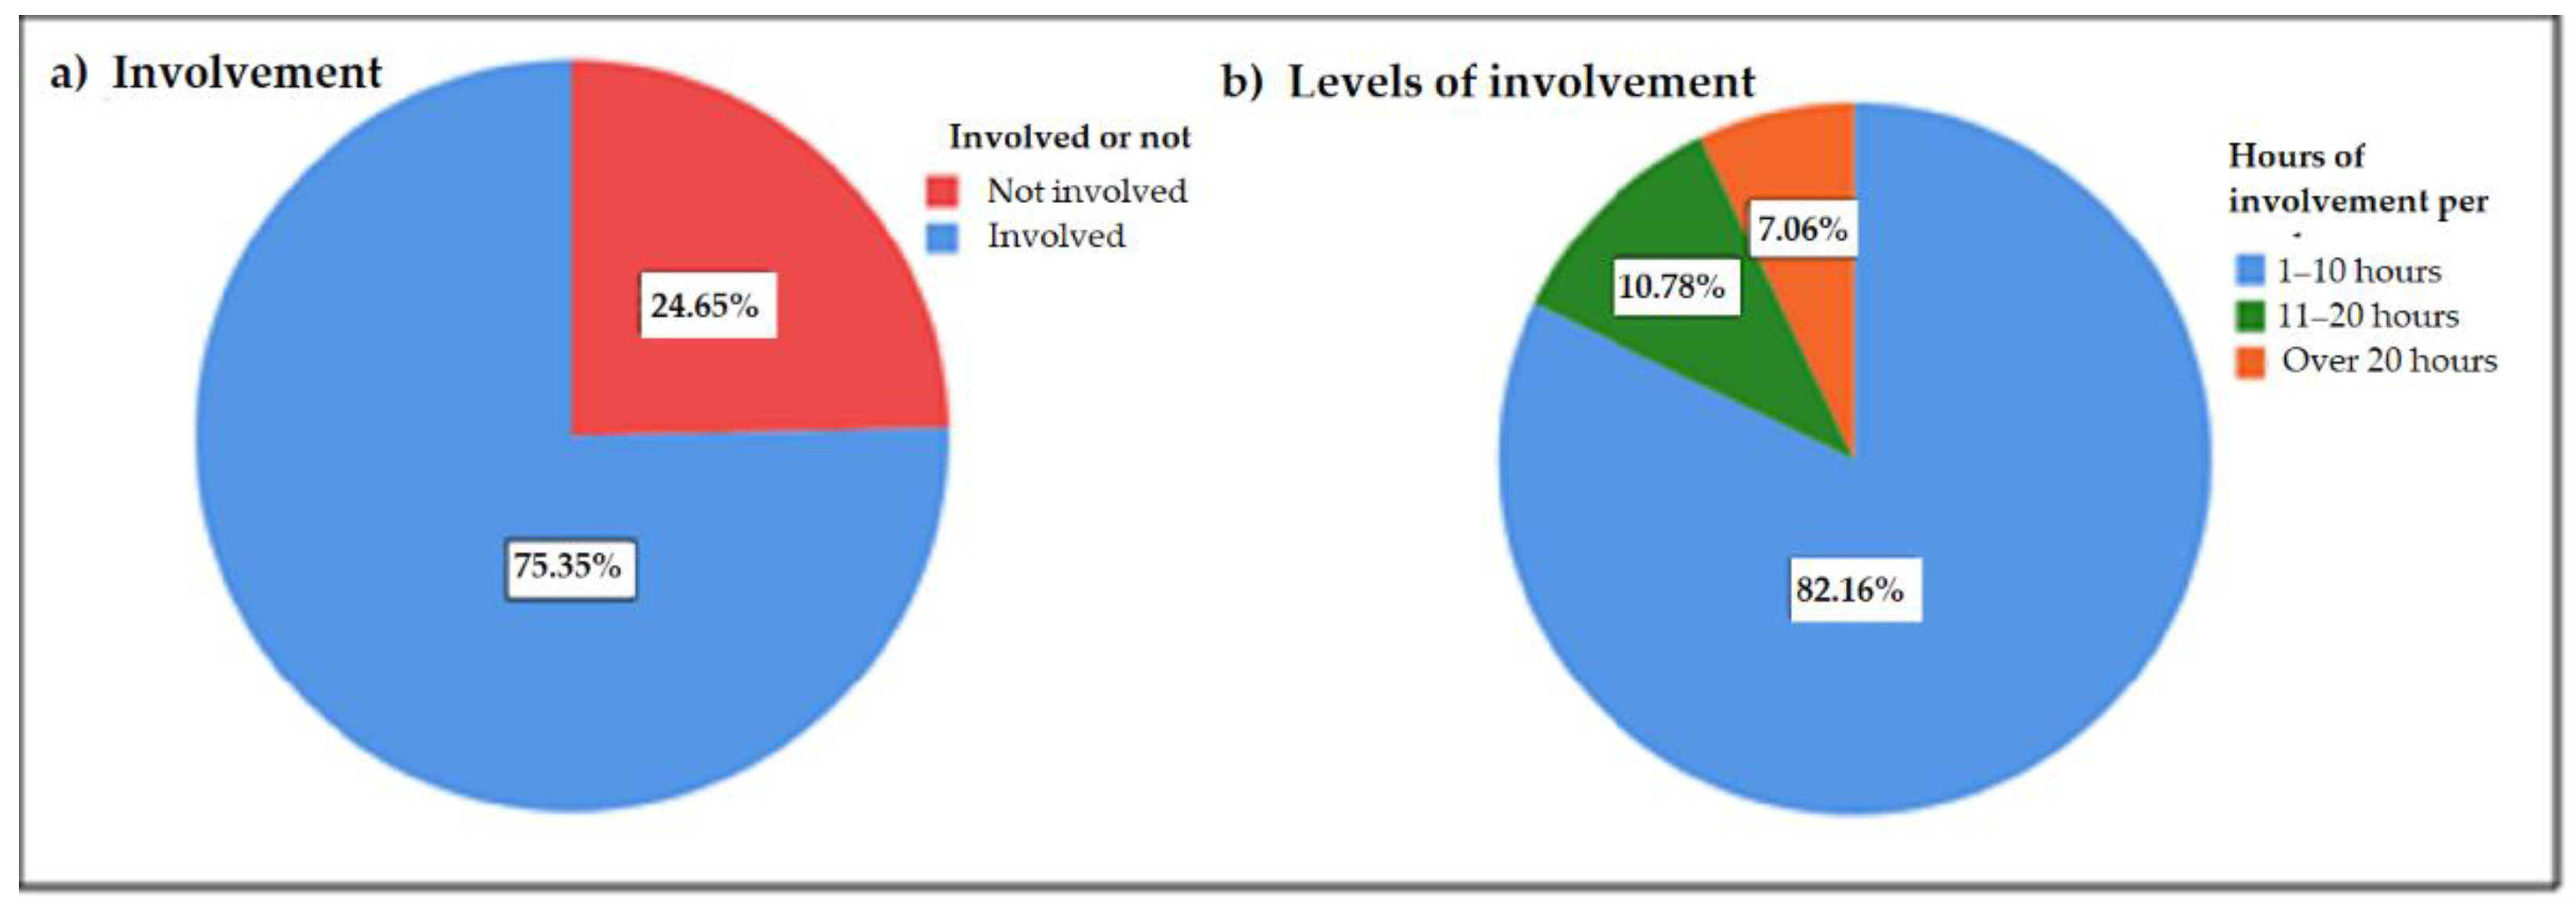
Slightly more than 75% of the respondents reported that they were involved in conservancy management and conservation activities (Figure 3). An overwhelming majority (82.2%) of them reported an involvement level of 1–10 h per week, whereas only 10.8% and 7.1% reported involvement levels of 11–20 h and over 20 h, respectively (Figure 3).
Key informants listed various rangeland management programs that community members were involved in, namely, holistic management (community-based planned rotational grazing), rehabilitation of water points, soil erosion control, grass reseeding, control of invasive species such as Opuntia and Sansevieria spp., and participatory land zoning programs. The key informants further indicated that most of these activities are carried out in collaboration with NRT and other organizations in the region. For instance, through partnership with NRT, the community conservancy established various green houses across communal group ranches from which a Cochineal fungus, used as a biological control of the invasive plant Opuntia spp. is cultured.
According to key informant interviews, community members also participate in conservancy management and conservation programs in various other ways including active participation in management decision-making through various committees such as business, grazing and water committees, and through conservancy annual meetings. Key informants also indicated that local participation in these committees is important for ensuring that conservancy members influence management decisions. In addition, they revealed that under the community conservancy setting, community members are regularly trained to strengthen their capacity to participate more effectively in conservancy management and conservation activities.

3.4. Associations between Perceived Socioeconomic Outcomes, Involvement in Conservancy Management and Conservation Activities, and Demographic Factors

Respondents’ perception of conservancy-driven change in their overall socioeconomic status was significantly associated with their involvement in conservancy management and conservation activities (χ2 = 83.5, p < 0.001; Table 2). Specifically, a higher-than-expected proportion of respondents who perceived improvement in their overall socioeconomic status were involved in these activities (Table 2). Conversely, lower than expected proportions of respondents who perceived either no change or a decrease in their overall socioeconomic status were involved in these activities (Table 3). These patterns were similar for nearly all other socioeconomic indicators (all χ2 > 6.1, p < 0.048; Table 2). The only exception was that respondents’ perception of conservancy-related change in donkey numbers was not significantly associated with their involvement in conservancy management and conservation activities (χ2 = 2.9, p = 0.232; Table 2).
Perception of conservancy-related change in socioeconomic status was also associated with various demographic factors, namely, household size, cattle ownership, camel ownership, and sheep and goat herd size (all χ2 > 9.5, p < 0.016; Table 3). Specifically, a higher-than-expected proportion of respondents from households with fewer (1–5) members perceived that their socioeconomic status had improved since conservancy establishment, and vice versa (Table 3). Similarly, higher than expected proportions of respondents with cattle, those with camel and those with no more than 50 sheep and goats reported conservancy-related socioeconomic status improvement, and vice versa. However, perception of overall socioeconomic status change was associated with neither gender nor formal education (χ2 < 0.3, p > 0.178; Table 3).
Analyses of association between specific socioeconomic indicators and demographic factors revealed mixed results (Appendix A Table A2, Table A3, Table A4, Table A5, Table A6, Table A7, Table A8, Table A9 and Table A10). Of note, there was an association between gender and perception of change in accessibility to grazing resources; a higher-than-expected proportion of female respondents perceived improved accessibility to these resources, whereas the reverse was the case for male respondents (χ2 = 15.7, p < 0.001; Table A2). Of further note, both cattle ownership and camel ownership were positively associated with perceptions of improvements in security status, livestock numbers, household income, and accessibility to health facilities (all χ2 > 7.0, p < 0.03; Table A5 and Table A8). We noted similar association patterns for ownership of sheep and goats, but these results did not meet one of the requisite assumptions of the Chi-square test (Table A6). Camel ownership also associated positively with perception of improved access to forage resources (χ2 = 6.7, p = 0.035; Table A8). Conversely, cattle ownership was negatively associated with perceived improvements in accessibility to water and status of roads (χ2 = 6.5, p = 0.038; Table A5). However, cattle herd size was not significantly associated with any of the socioeconomic indicators (all χ2 < 3.2, p > 0.192; Table A9).
Local involvement in conservancy management and conservation activities was associated with several demographic factors (all χ2 > 4.5, p < 0.034; Table 4). Specifically, higher than expected proportions of female respondents, respondents with formal education, and those from households with fewer (1–5) individuals reported that they were involved in these activities (Table 4). Conversely, lower than expected proportions of male respondents, respondents with no formal education, and respondents from larger households were involved in these activities (Table 4). In addition, higher than expected proportions of respondents who owned cattle, those who owned camels, and those with no more than 50 sheep and goats indicated that they were involved in conservancy management and conservation activities (Table 4). In contrast, lower than expected proportions of respondents with no cattle, those with no camels, and those with more than 50 sheep and goats, were involved in these activities (Table 4).

4. Discussion

4.1. Conservancy-Related Socioeconomic Outcomes

Socioeconomic outcomes are important in determining the success or failure of community-based conservation initiatives because local community members will likely support initiatives that improve their socioeconomic wellbeing and shun those that they deem non-beneficial to them [28,29,30,31]. In the present study, we found that a vast majority (~90%) of local community members perceived improvement in their socioeconomic status following conservancy establishment. We also found that large proportions (>65%) of community members perceived conservancy-related improvements in several other socioeconomic indicators, namely, security situation, access to grazing resources, household income, access to educational and health facilities, and livestock numbers. These findings generally suggest that the community conservancy model, as applied in our study region, can improve the socio-economic wellbeing of local pastoralists.
The observed high proportion of respondents reporting perceived improvement in security situation is consistent with a recent evaluation in northern Kenya indicating that nearly eight-tenths of conservancy members felt safer due to security enhancement and peace-building efforts undertaken by conservancies [26]. In our study region and similar pastoralist settings across sub-Saharan Africa, local communities commonly suffer from various forms of insecurity including livestock theft (e.g., through cattle raiding), wildlife poaching, banditry, invasions and illegal grazing, and conflict over natural resources [12,32,33,34]. Persistent insecurity threatens pastoralists’ socioeconomic wellbeing by impairing their ability to participate more effectively in income generating activities [35,36] We attribute improved security to better coordination and enhanced peace building and conflict resolution efforts under the community conservancy framework. Community conservancies in our study region often invest in community policing to complement efforts by local and national government agencies and non-governmental organizations [26,27,33]. Specifically, the conservancies work closely with the Northern Rangelands Trust (NRT), Kenya’s National Police Service (NPS), the Kenya Wildlife Service (KWS), and county governments to provide a community-driven approach to tackling security and reducing conflict. Our key informant interviews revealed that similar security enhancement efforts are implemented in Naibunga Conservancy.
In our study, we found that local perception of improved security was positively associated with cattle ownership and camel ownership, suggesting that enhancing security is particularly important for livestock owners. Although we noted a similar association between security perception and ownership of sheep and goats, this particular finding should be interpreted with caution because it was not statistically valid (i.e., less than 80% of cells had expected frequency values equal to or greater than 5). Livestock (especially cattle, sheep, goats, and camels) are highly valued and are a major source of livelihoods for pastoral communities in Kenya’s arid and semiarid regions [36,37]. Therefore, pastoralists may be particularly concerned about the security of their livestock. Our findings suggest that enhancing security benefits for local pastoralists can increase their support for community-based conservation initiatives. Therefore, community conservancies should prioritize security enhancement for local communities for better socioeconomic and wildlife conservation outcomes.
At face value, the observed perceived improvements in accessibility to grazing resources and livestock numbers may appear somewhat surprising. Under the community conservancy framework in our study region, local pastoralists typically make a trade off by setting aside portions of their communal land for wildlife conservation [1,6,10], which should reduce the area available for grazing their livestock. However, local community members are usually allowed to graze their livestock in these areas during the dry season [38], thereby partly mitigating the impact of this trade off. The fact that large proportions of respondents noted these improvements suggests that it is possible to achieve a win-win outcome for both biodiversity conservation and livestock production under the community conservancy framework.
We partly attribute improvements in accessibility to grazing resources and livestock numbers to the various conservancy-driven land and grazing management initiatives that were revealed by our key informants. As our key informants attested, these initiatives may have improved rangeland condition and forage availability for both livestock and wildlife, consistent with previous findings in our region [12,39,40]. Further, we relate these improvements to improved security under the community conservancy setting. Specifically, we posit that improved security reduces livestock losses to theft, thereby contributing to overall increases in livestock numbers across the landscape. In addition, we propose that improved security minimizes incursion grazing and conflicts over resources, thereby increasing forage availability for local community members’ livestock. These arguments are supported by the views of our key informants, who pointed out the negative impacts of insecurity on livestock and grazing resources. As our key informants observed, insecurity reduces accessibility to grazing resources because pastoralists tend to avoid herding their livestock in areas they consider insecure. Consequently, their high concentrations in areas considered safer leads to overgrazing and subsequent degradation of forage resources in these areas. We recommend that in addition to allowing pastoralists’ livestock to periodically access conservation areas, community conservancies can enhance socioeconomic and conservation outcomes by increasing efforts towards implementing community-based sustainable land and grazing management practices and enhancing security for local pastoralists and their livestock.
We relate the observed perceived conservancy-driven improvement in average household income to increased profitability of livestock rearing, based on the fact that an overwhelming majority of community members in our study region are pastoralists. In addition, the observed positive association between perception of increase in household income and ownership of livestock suggests that livestock keeping is a major driver of household income improvement. Under the community conservancy framework, local pastoralists can derive enhanced benefits from livestock through multiple pathways. One such pathway is the improved profitability of livestock sales through the various conservancy-driven livestock market access enhancement initiatives that were identified by our key informants. As pointed out by the key informants, such initiatives enable local pastoralists to maximize profits by selling their livestock at more competitive prices. Consistent with our findings, it was recently reported that cattle sales by pastoralists from community conservancies in northern Kenya improved by nearly 50% over a one-year period due to such livestock market enhancement initiatives [26]. Our findings underscore the important role that such conservancy-driven livestock market access initiatives play in improving local livelihoods.
In addition to improved livestock markets, increased pastoralists’ household income could also be related to increased livestock productivity triggered by conservancy-driven improved availability of forage resources [12,39]. Furthermore, we posit that the improved security situation creates an enabling environment for better livestock rearing and productivity, thereby leading to improved household income for local pastoralists. Improvement in local household income can additionally be related to employment and business opportunities created by the conservancy, based on the information obtained from key informant interviews. The creation of such opportunities appears to be vital in helping local community members diversify their income streams, leading to increased local household incomes.
Our findings on perceived changes in accessibility to schools and health facilities resonate with information obtained from our key informants and the conservancy’s current strategic plan [21]. Specifically, the conservancy strives to improve accessibility to schools in various ways including expanding education facilities to include adult education and boarding schools, lobbying community members to increase school enrolment, and awarding bursaries to needy students. In terms of health, the conservancy prioritizes the construction of health facilities to cover as many settlements as possible, enhancing mobile clinic and ambulance services, and the training of community health workers. The observed perceived improvements in accessibility to schools and health facilities generally suggest that the conservancy is making some progress on these fronts. However, based on our findings that the majority of local community members had no formal education, and that just one out of ten members had post-primary education, more efforts need to be directed towards enhancing accessibility to educational facilities. Notably, the observed positive association between formal education and involvement in conservancy activities suggests that expanding education opportunities for local community members will be beneficial to local community members while also contributing towards desirable outcomes for conservancy management and conservation programs.
In addition, the positive association between livestock ownership and local perception of improvement in access to both schools and health facilities suggests that livestock owners may have better access to these facilities, likely because of higher household income. This argument is consistent with the positive association between perception of improved household income and livestock ownership that was observed in this study. In addition, there is evidence that pastoralists in this region sell their livestock to pay school fees for their children [41], further underscoring the role of livestock in enhancing accessibility to schools. Therefore, community conservancies should redouble their efforts to create a favorable environment for livestock rearing as a strategy to enhance local household incomes and accessibility to these facilities. In addition, based on the observed gender disparity in formal education (females were less educated than males), community conservancies should further direct their efforts towards enhancing girl-child education to address this disparity.
The conservancy also focuses on improving road networks and improving accessibility to water by renovating water points and constructing water pans [21]. However, the fact that only moderate proportions (~53%) of respondents perceived improvements in these facilities indicates that much more needs to be done on these fronts. Our finding on local perceptions of change in water accessibility is consistent with information from our key informants. Whereas the key informants indicated that the conservancy attempted to increase accessibility to water, they also indicated that water scarcity remains a big challenge for local community members. As opined by our key informants, water scarcity heightens conflicts among people as well as between people and wildlife. The observed negative association between the perception of improved accessibility to water and cattle ownership suggests that available water sources are insufficient not only for people but also for livestock and wildlife. Therefore, to better enhance conservation and socioeconomic outcomes, community conservancies should focus on developing more effective strategies to improve water availability for pastoralists, their livestock, and wildlife.
The fact that an overwhelming majority (more than seven-tenths) of respondents did not note improvement in accessibility to electricity may be due to difficulties in distributing mains electricity in such vast and sparsely populated landscapes. This could be one of the reasons why improving accessibility to electricity has not been prioritized, based on the conservancy’s current strategic plan [21]. We propose that community conservancies in such pastoral landscapes should direct more efforts towards improving local accessibility to alternative energy sources, especially solar power, if they are to better enhance the socioeconomic wellbeing of local pastoralists. Such an intervention could importantly bolster the local economy by enhancing domestic lighting, accessibility to water through solar-powered water pumps, and the use of mobile phones, which is fast expanding in these pastoral regions [42]. In addition, improving local accessibility to solar power could contribute towards better mitigation of human–wildlife conflicts through the use of solar-powered light-emitting diode (LED) flashlights to reduce livestock depredation by lions [43].

4.2. Local Participation in Conservancy Management and Conservation Activities

Local participation has been identified as a key determinant of socioeconomic and conservation outcomes of community-based conservation projects [16,17,31,32]. In our study, key informants revealed several ways in which local community members were involved in conservancy management and conservation activities, including rangeland rehabilitation and restoration, community-based grazing management, participation in management committees, and capacity building. The observed overwhelming majority (nearly eight-tenths) of respondents reporting involvement in these activities demonstrates a considerably high level of support for the conservancy and its programs among local community members. We associate the observed high level of local community participation in conservancy activities with the observed equally high levels of local community perceptions of socioeconomic improvements. This proposition is consistent with the fact that local community members’ involvement in these activities was positively associated with their perceptions of conservancy-related socioeconomic improvements. These findings resonate with other studies showing that local perceptions of socioeconomic benefits of community-based conservation initiatives play a pivotal role in increasing local participation in such initiatives [44,45]. The observed overwhelming majority (approximately eight-tenths) of respondents reporting to be involved for not more than 10 h per week suggests that this is the participation level that best balances engagement in individual activities with engagement in conservancy activities.
The observed positive association between possession of formal education and respondents’ participation in conservancy management and conservation activities underscores the importance of education in enhancing local participation in conservancy programs. Education has been identified as a key factor in improving local participation in conservation [46]. Specifically, formal education importantly prepares people to participate in activities that require the application of skills and knowledge and improves their self-confidence [47]. The observed higher than expected proportion of females reporting involvement in conservancy management and conservation activities suggests that females can play a pivotal role in community-based initiatives, as has also been reported elsewhere [37,48]. It is noteworthy that this gender disparity in local participation in conservancy activities was observed despite the fact that females were generally less educated than males, yet education positively influenced local participation. While what drove gender disparity in local participation is unclear, we posit that the observed gender disparity in the perception of conservancy-related improvement in accessibility to grazing resources could be responsible. In addition, in our study region, adult males largely take care of cattle, which usually require more forage and water, and are normally herded in far-flung areas away from homesteads [41]. Therefore, males engaged in cattle herding may have little time to participate in conservancy management and conservation activities.
The observed positive association between livestock ownership and local community members’ participation in conservancy activities can be attributed to the fact that livestock ownership was also positively associated with perception of conservancy-related socioeconomic improvements, a major determinant of local participation. Livestock owners appear to be more motivated to participate in these activities as a way of ensuring better livestock productivity and profitability. The observed negative relationship between sheep and goat herd size and involvement in conservancy activities could be due to the possibility that households with larger herd sizes have less time available to participate in conservancies as they have more animals to look after.
Based on the foregoing findings, we suggest that community conservancies should focus on addressing individual-level differences in involvement in conservancy management and conservation activities if they are to better achieve broad-based, equitable, and sustainable participation in these activities by local community members. In particular, the conservancies should prioritize identifying and addressing the disparities in local participation related to educational, gender, and livestock ownership and herd size differences among local community members.
5. Conclusions

Increasing food security with minimal negative impacts on biodiversity continues to be one of the most pressing global challenges [49]. Community-based conservation aims to address this challenge by producing both conservation and socioeconomic benefits [38]. In this study of Naibunga Conservancy in northern Kenya, we found that a vast majority (nine-tenths) of local community members perceived that their overall socioeconomic status had improved since the establishment of the conservancy. In addition, large proportions of local community members perceived conservancy-related improvements in various other socioeconomic attributes including security situation, household income, livestock numbers, and accessibility to grazing resources, schools, and health facilities. These socioeconomic improvements were related to various initiatives implemented by the conservancy, including peace and security enhancement, community-based rangeland restoration and grazing management, enhancement of access to livestock markets, enhancing employment and small business opportunities, and provision of educational bursaries. However, only low to moderate proportions of community members perceived improvements in the status of roads and accessibility to water and electricity, suggesting slower progress in addressing the challenges associated with these socioeconomic attributes. We also found that a large proportion (nearly eight-tenths) of community members were involved in conservancy management and conservation activities. Our study further showed that local participation in these activities was positively influenced by perceptions of conservancy-related positive socioeconomic outcomes, as well as by possession of formal education. In addition, we observed a gender disparity in local participation in conservancy activities, with a higher proportion of females reporting participation compared to males.
Taken together, our findings suggest that the community conservancy model as applied in our study region can improve the socioeconomic wellbeing of local pastoralists, and consequently contribute to tackling the global challenge of balancing socioeconomic development interests with wildlife conservation interests. For greater socioeconomic and environmental outcomes, community conservancies should prioritize multi-pronged strategies that maximize socioeconomic benefits for local community members, in combination with strategies to ensure that biodiversity values are also protected. In particular, because the vast majority of members of such conservancies are pastoralists who primarily rely on livestock for survival, strategies that enhance the security of pastoralists and their livestock, rangeland, and livestock productivity and accessibility to water should be given utmost priority.
In addition, such community conservancies should focus on increasing accessibility to educational facilities to address low literacy levels among local community members, especially girls. Further, the conservancies should focus on improving infrastructure and explore ways of enhancing local accessibility to alternative energy sources, especially solar power, to further spur socioeconomic growth and development in such remote landscapes. Finally, to further enhance their socioeconomic and conservation outcomes, such conservancies should devise and implement strategies aimed at enhancing and entrenching local community participation in conservancy programs. In particular, the conservancies should pay greater attention to identifying and addressing the major barriers to behavior change and equitable local participation in conservancy activities, including barriers to educational and gender equity.

Author Contributions

Conceptualization, K.O.O. and W.O.O.; methodology, K.O.O. and W.O.O.; data curation, K.O.O.; formal analysis, K.O.O.; original draft preparation, K.O.O.; supervision, W.O.O. and C.L.; writing—review and editing, W.O.O. and C.L.; finance acquisition, W.O.O. All authors have read and agreed to the published version of the manuscript.

Funding

This study was funded by The Royal Society under the Future Leaders African Independent Researcher (FLAIR) Fellowship program (Grant #FLR\R1\191204 to W.O.O.).

Institutional Review Board Statement

The study was conducted according to the guidelines of the Declaration of Helsinki and approved by Egerton University Research Ethics Review Committee (EUREC) on 30th November 2020 (Approval number EUREC/APP/108/2020).

Informed Consent Statement

Informed consent was obtained from all respondents involved in the study.

Data Availability Statement

The datasets generated and used by this study are available at figshare at https://figshare.com/s/d96524133a6f82bc0a78 or https://doi.org/10.6084/m9.figshare.14825034.

Acknowledgments

We would like to thank all those involved in data collection including field assistants, and enumerators from the studied group ranches for field assistance. We are also grateful to the chairpersons of the selected group ranches for their cooperation and assistance during field data collection. We thank Naibunga Conservancy and all the sampled group ranches for allowing us access to the study area.

Conflicts of Interest

The authors declare no conflict of interest.

Appendix A

Table A1. Various variables and their levels as used in original (household survey) assessments and Chi-square tests of association.
VariableOriginal Level AssessedLevels Used for Chi-Square Tests
Socioeconomic indicatorsIncreased/Improved, No change, Decreased/DeterioratedIncreased/Improved, No change/decreased or deteriorated
InvolvementInvolved, Not involvedInvolved, Not involved
Involvement levels (hours per week)0, 1–10, 11–20, >20Not used in Chi-square tests
GenderMale, femaleMale, female
Education levelNone, primary, secondary, tertiaryNone, primary, secondary, tertiary (for association test with gender)
None, primary, secondary, tertiaryNo formal education, formal education (for association test with variables other than gender)
Household size<2, 3–5, 6–8, >91–5, >6
OccupationFarmer, civil servant, businessperson, othersNot used in Chi-square tests
Main source of livelihoodPastoralism, formal employment, beekeeping, otherNot used in Chi-square tests
Livestock typeCattle, sheep and goats, camels, donkeysNot used in Chi-square tests
Cattle ownershipYes, noYes, no
Sheep and goat ownershipYes, noYes, no
Camel ownershipYes, noYes, no
Donkey ownershipYes, noYes, no
Cattle herd size0, 1–50, 51–100, >1001–50, >50
Sheep and goat herd size0, 1–50, 51–100, >1001–50, >50
Camel herd size0, 1–50, 51–100, >100Not used in Chi-square tests
Table A2. Chi-square tests of association between respondents’ gender and their perceptions of conservancy-related changes in various socioeconomic indicators. Values in parentheses are expected counts.
Gender
MaleFemale
Freq.%Freq.%χ2p-Value
How livestock numbers changedIncreased/Improved147(142.9)67.186 (90.1)62.3
No change58 (57.1)26.535 (35.9)25.4
Decreased/Deteriorated14 (19.0)6.417 (12.0)12.33.760.152
How the average household income changedIncreased/Improved168 (165.0)76.7101 (104.0)73.2
No change25 (21.5)11.410 (13.5)7.2
Decreased/Deteriorated26 (32.5)11.927 (20.5)19.65.0150.081
How accessibility to water changedIncreased/Improved118 (115.9)53.971 (73.1)51.4
No change66 (62.0)30.135 (39.0)25.4
Decreased/Deteriorated35 (41.1)16.032 (25.9)23.23.120.210
How accessibility to health facility changedIncreased/Improved152 (144.8)69.484 (91.2)60.9
No change60 (65.0)27.446(41.0)33.3
Decreased/Deteriorated7 (9.2)3.28 (5.8)5.83.300.192
How accessibility to schools changedIncreased/Improved157 (158.3)71.7101 (99.7)73.2
No change59 (56.4)26.933 (35.6)23.9
Decreased/Deteriorated3 (4.3)1.44 (2.7)2.91.340.513
How status of roads changedIncreased/Improved122 (117.2)55.769 (73.8050.0
No change56 (63.2)25.647 (39.8)34.1
Decreased/Deteriorated41 (38.6)18.722 (24.4)15.93.000.223
How accessibility to grazing resources changedIncreased/Improved160 (168.7)73.1115 (106.3)83.3
No change14 (17.8)6.415 (11.2)10.9
Decreased/Deteriorated45 (32.5)20.58 (20.5)5.815.66<0.001
How accessibility to electricity changedIncreased/Improved53 (56.4)24.239 (35.6)28.3
No change162 (154.6)74.090 (97.4)65.2
Decreased/Deteriorated4 (8.0)1.89 (5.0)6.56.590.037
How security status changedIncreased/Improved182 (179.7)83.1111 (113.3)80.4
No change8 (8.0)3.75 (5.0)3.6
Decreased/Deteriorated29 (31.3)13.222 (19.7)15.90.5060.777
Table A3. Chi-square tests of association between household size and respondents’ perceptions of conservancy-related changes in various socioeconomic indicators. Values in parentheses are expected counts.
Household Size
1–56 and Above
Freq.%Freq.%χ2p-Value
How livestock numbers changedIncreased/Improved153 (148.1)67.478 (82.9)61.4
No change51 (59.0)22.541 (33.0)32.3
Decreased/Deteriorated23 (19.9)10.18 (11.1)6.34.830.089
How the average household income changedIncreased/Improved177 (170.6)78.089 (95.4)70.1
No change23 (22.4)10.112 (12.6)9.4
Decreased/Deteriorated27 (34.0)11.926 (19.0)20.54.720.95
How accessibility to water changedIncreased/Improved119 (120.6)52.469 (67.4)54.3
No change67 (64.1)29.533 (35.9)26.0
Decreased/Deteriorated41 (42.3)18.125 (23.7)19.70.5300.767
How accessibility to health facility changedIncreased/Improved152 (150.7)67.083 (84.3)65.4
No change65 (66.7)28.639 (37.3)30.7
Decreased/Deteriorated10 (9.6)4.45 (5.4)3.90.1930.908
How accessibility to schools changedIncreased/Improved172 (164.2)75.884 (91.8)66.1
No change50 (58.4)22.041 (32.6)32.3
Decreased/Deteriorated5 (4.5)2.22 (2.5)1.64.540.103
How status of roads changedIncreased/Improved128 (121.2)56.461 (67.8)48.0
No change63 (66.0)27.840 (37.0)31.5
Decreased/Deteriorated36 (39.8)15.926 (22.2)20.52.450.125
How accessibility to grazing resources changedIncreased/Improved179 (174.4)78.993 (97.6)73.2
No change21 (18.6)9.38 (10.4)6.3
Decreased/Deteriorated27 (34.0)11.926 (19.0)20.55.200.074
How accessibility to electricity changedIncreased/Improved61 (58.4)26.930 (32.6)23.6
No change156 (160.3)68.794 (89.7)74.0
Decreased/Deteriorated10 (8.3)4.43 (4.7)2.41.580.453
How security status changedIncreased/Improved193 (186.0)85.097 (104.0)76.4
No change11 (8.3)4.82 (4.7)1.6
Decreased/Deteriorated23 32.7)10.128 (18.3)22.011.140.004
Table A4. Chi-square tests of association between respondents’ formal education level and their perceptions of conservancy-related changes in various socioeconomic indicators. Values in parentheses are expected counts.
Education Level
No Formal EducationFormal Education
Freq.%Freq.%χ2p-Value
How livestock numbers changedIncreased/Improved127 (126.6)65.5106 (106.4)65.0
No change50 (50.5)25.843 (42.5)26.4
Decreased/Deteriorated17 (16.8)8.814 (14.2)8.60.0180.991
How the average household income changedIncreased/Improved150 (146.2)77.3119 (122.3)73.0
No change14 (19.0)7.221 (16.0)12.9
Decreased/Deteriorated30 (28.8)15.523 (24.2)14.13.230.199
How accessibility to water changedIncreased/Improved101 (102.7)52.188 (86.3)54.0
No change54 (54.9)27.847 (46.1)28.8
Decreased/Deteriorated39 (36.4)20.128 (30.6)17.20.4970.780
How accessibility to health facility changedIncreased/Improved129 (128.2)66.5107 (107.8)65.6
No change60 (57.6)30.946 (48.4)28.2
Decreased/Deteriorated5 (8.2)2.610 (6.8)6.12.900.235
How accessibility to schools changedIncreased/Improved141 (140.2)72.7117 (117.8)71.8
No change50 (50.0)25.842 (42.0)25.8
Decreased/Deteriorated3 (3.8)1.54 (3.2)2.50.3820.826
How status of roads changedIncreased/Improved86 (103.8)44.3105 (87.2)64.4
No change70 (56.0)36.133 (47.0)20.2
Decreased/Deteriorated38 (34.2)19.625 (28.8)15.315.29<0.001
How accessibility to grazing resources changedIncreased/Improved152 (149.4)78.4123 (125.6)75.5
No change10 (15.8)5.219 (13.2)11.7
Decreased/Deteriorated32 (28.8)16.521 (24.2)12.95.480.064
How accessibility to electricity changedIncreased/Improved41 (50.0)21.151 (42.0)31.3
No change147 (136.9)75.8105 (115.1)64.4
Decreased/Deteriorated6 (7.1)3.17 (5.9)4.35.510.063
How security status changedIncreased/Improved157 (159.2)80.9136 (133.8)83.4
No change8 (7.1)4.15 (5.9)3.1
Decreased/Deteriorated29 (27.7)14.922 (23.3)13.50.4700.791
Table A5. Chi-square tests of association between cattle ownership and respondents’ perceptions of conservancy-related changes in various socioeconomic indicators. Values in parentheses are expected counts.
Own Cattle
YesNo
Freq.%Freq.%χ2p-Value
How livestock numbers changedIncreased/Improved216 (195.7)72.217 (37.3)29.8
No change64 (77.3)21.428 (14.7)49.1
Decreased/Deteriorated19 (26.0)6.412 (5.0)21.139.27<0.001
How the average household income changedIncreased/Improved243 (225.9)81.326 (43.1)45.6
No change26 (29.4)8.79 (5.6)15.8
Decreased/Deteriorated30 (43.7)10.022 (8.3)38.637.25<0.001
How accessibility to water changedIncreased/Improved150 (158.7)50.239 (30.3)68.4
No change90 (84.0)30.110 (16.0)17.5
Decreased/Deteriorated59 (53.6)19.78 (10.7)14.06.520.038
How accessibility to health facility changedIncreased/Improved206 (197.4)68.929 (37.6)50.9
No change82 (89.0)27.424 (17.0)42.1
Decreased/Deteriorated11 (12.6)3.74 (2.4)7.07.090.029
How accessibility to schools changedIncreased/Improved228 (215.9)76.329 (41.1)50.9
No change64 (77.3)21.428 (14.7)49.1
Decreased/Deteriorated7 (5.9)2.30 (1.1)0.019.84<0.001
How status of roads changedIncreased/Improved162 (160.4)54.229 (30.6)50.9
No change79 (86.5)26.424 (16.5)42.1
Decreased/Deteriorated58(52.1)19.44 (9.9)7.08.380.015
How accessibility to grazing resources changedIncreased/Improved228 (231.0)76.347 (44.0)82.5
No change25 (24.4)8.44 (4.6)7.0
Decreased/Deteriorated46 (43.7)15.46 (8.3)10.51.1180.572
How accessibility to electricity changedIncreased/Improved74 (77.3)24.718 (14.7)31.6
No change214 (211.7)71.638 (40.3)66.7
Decreased/Deteriorated11 (10.1)3.71 (1.9)1.81.5530.460
How security status changedIncreased/Improved258 (245.2)86.334 (46.8)59.6
No change10 (10.9)3.33 (2.1)5.3
Decreased/Deteriorated31 (42.8)10.420 (8.2)35.125.05<0.001
Table A6. Chi-square tests of association between sheep and goat ownership and respondents’ perceptions of conservancy-related changes in various socioeconomic indicators. Values in parentheses are expected counts. Highlighted statistics indicate unmet Chi-square assumption of at least 80% of cells having expected values ≥ 5.
Own Sheep and Goats
YesNo
Freq.%Freq.%χ2p-Value
How livestock numbers changedIncreased/Improved233 (225.1)67.70 (7.9)0.0
No change81 (88.9)23.511 (3.1)91.7
Decreased/Deteriorated30 (30.0)8.71 (1.0)8.328.95<0.001
How the average household income changedIncreased/Improved265 (259.9)77.04 (9.1)33.3
No change28 (33.8)8.17 (1.2)58.3
Decreased/Deteriorated51 (50.114.81 (1.8)8.332.98<0.001
How accessibility to water changedIncreased/Improved184 (182.6)53.55 (6.4)41.7
No change93 (96.6)27.07 (3.4)58.3
Decreased/Deteriorated67 (64.7)19.50 (2.3)0.06.6860.035
How accessibility to health facility changedIncreased/Improved230 (227.1)66.95 (7.9)41.7
No change99 (102.4)28.87 (3.6)58.3
Decreased/Deteriorated15 (14.5)4.40 (0.5)0.05.0400.080
How accessibility to schools changedIncreased/Improved252 (248.3)73.35 (8.7)41.7
No change85 (88.9)24.77 (3.1)58.3
Decreased/Deteriorated7 (6.8)2.00 (0.2)0.06.9200.031
How status of roads changedIncreased/Improved183 (184.6)53.28 (6.4)66.7
No change99 (99.5)28.84 (3.5)33.3
Decreased/Deteriorated62 (59.9)18.00 (2.1)0.02.6380.267
How accessibility to grazing resources changedIncreased/Improved268 (265.7)77.97 (9.3)58.3
No change25 (28.0)7.34 (1.0)33.3
Decreased/Deteriorated51 (50.2)14.81 (1.8)8.310.5810.005
How accessibility to electricity changedIncreased/Improved90 (88.9)26.22 (3.1)16.7
No change242 (243.5)70.310 (8.5)83.3
Decreased/Deteriorated12 (11.6)3.50 (0.4)0.01.1000.577
How security status changedIncreased/Improved283 (282.2)82.39 (9.8)75.0
No change11 (12.6)3.22 (0.4)16.7
Decreased/Deteriorated50 (49.3)14.51 (1.7)8.36.1470.046
Table A7. Chi-square tests of association between donkey ownership and respondents’ perceptions of conservancy-related changes in various socioeconomic indicators. Values in parentheses are expected counts.
Own Donkeys
YesNo
Freq.%Freq.%χ2p-Value
How livestock numbers changedIncreased/Improved43 (43.9)64.2190 (189.1)65.7
No change15 (17.3)22.477 (74.7)26.6
Decreased/Deteriorated9 (5.8)13.422 (25.2)7.62.5170.284
How the average household income changedIncreased/Improved49 (50.6)73.1220 (218.4)76.1
No change5 (6.6)7.530 (28.4)10.4
Decreased/Deteriorated13 (9.8)19.439 (42.2)13.51.8350.399
How accessibility to water changedIncreased/Improved43 (35.6)64.2146 (153.4)50.5
No change17 (18.8)25.483 (81.2)28.7
Decreased/Deteriorated7 (12.6)10.460 (54.4)20.85.2030.074
How accessibility to health facility changedIncreased/Improved46 (44.2)68.7189 (190.8)65.4
No change19 (19.9)28.487 (86.1)30.1
Decreased/Deteriorated2 (2.8)3.013 (12.2)4.50.4390.803
How accessibility to schools changedIncreased/Improved47 (48.4)70.1210 (208.6)72.7
No change18 (17.3)26.974 (74.7)25.6
Decreased/Deteriorated2 (1.3)3.05 (5.7)1.70.5170.772
How status of roads changedIncreased/Improved40 (35.9)59.7151 (155.1)52.2
No change18 (19.4)26.985 (83.6)29.4
Decreased/Deteriorated9 (11.7)13.453 (50.3)18.31.4370.488
How accessibility to grazing resources changedIncreased/Improved49 (51.8)73.1226 (223.2)78.2
No change6 (5.5)9.023 (23.5)8.0
Decreased/Deteriorated12 (9.8)17.940 (42.2)13.80.8640.649
How accessibility to electricity changedIncreased/Improved9 (17.3)13.483 (74.7)28.7
No change57 (47.4)85.1195 (204.6)67.5
Decreased/Deteriorated1 (2.3)1.511 (9.7)3.88.1620.017
How security status changedIncreased/Improved53 (55.0)79.1239 (237.0)82.7
No change2 (2.4)3.011 (10.6)3.8
Decreased/Deteriorated12 (9.6)17.939 (41.4)13.50.9260.629
Table A8. Chi-square tests of association between camel ownership and respondents’ perception of conservancy-related changes in various socioeconomic indicators. Values in parentheses are expected counts.
Own Camels
YesNo
Freq.%Freq.%χ2p-Value
How livestock numbers changedIncreased/Improved80 (63.5)82.5153 (169.5)59.1
No change12 (25.1)12.480 (66.9)30.9
Decreased/Deteriorated5 (8.4)5.226 (22.6)10.017.20<0.001
How the average household income changedIncreased/Improved82 (73.3)84.5187 (195.7)72.2
No change11 (9.5)11.324 (25.5)9.3
Decreased/Deteriorated4 (14.2)4.148 (37.8)18.511.760.003
How accessibility to water changedIncreased/Improved52 (52.5)53.6137 (137.5)52.9
No change32 (27.2)33.068 (72.8)26.3
Decreased/Deteriorated13 (18.3)13.454 (48.7)20.83.2260.199
How accessibility to health facility changedIncreased/Improved86 (64.0)88.7149 (171.0)57.5
No change9 (28.9)9.397 (77.1)37.5
Decreased/Deteriorated2 (4.1)2.113 (10.9)5.030.638<0.001
How accessibility to schools changedIncreased/Improved85 (70.0)87.6172 (187.0)66.4
No change9 (225.1)9.383 (66.9)32.0
Decreased/Deteriorated3 (1.9)3.14 (5.1)1.519.42<0.001
How status of roads changedIncreased/Improved58 (52.0)59.8133 (139.0)51.4
No change21 (28.1)21.682 (74.9)31.7
Decreased/Deteriorated18 (16.9)18.644 (45.1)17.03.4820.175
How accessibility to grazing resources changedIncreased/Improved77 (74.9)79.4198 (200.1)76.4
No change12 (7.9)12.417 (21.1)6.6
Decreased/Deteriorated8 (14.2)8.244 (37.8)17.06.6920.035
How accessibility to electricity changedIncreased/Improved6 (25.1)6.286 (66.9)33.2
No change88 (68.7)90.7164 (183.3)63.3
Decreased/Deteriorated3 (3.3)3.19 (8.7)3.527.45<0.001
How security status changedIncreased/Improved90 (79.6)92.8202 (212.4)78.0
No change6 (3.5)6.27 (9.5)2.7
Decreased/Deteriorated1 (13.9)1.050 (37.1)19.320.68<0.001
Table A9. Chi-square tests of association between respondents’ cattle herd size and their perceptions of conservancy-related changes in various socioeconomic indicators. Values in parentheses are expected counts. Highlighted statistics indicate unmet Chi-square assumption of at least 80% of cells having expected values ≥ 5.
Number of Cattle
1–5051 and Above
Count%Count%χ2p-Value
How livestock numbers changedIncreased/Improved196 (196.5)72.120 (19.5)74.1
No change61 (58.2)22.43 (5.8)11.1
Decreased/Deteriorated15 (17.31)5.54 (1.7)14.84.8260.90
How the average household income changedIncreased/Improved219 (221.1)80.524 (21.9)88.9
No change24 (23.7)8.82 (2.3)7.4
Decreased/Deteriorated29 (27.3)10.71 (2.7)3.71.4540.483
How accessibility to water changedIncreased/Improved138 ((136.5)50.712 (13.5)44.4
No change81 (81.9)29.89 (8.1)33.3
Decreased/Deteriorated53 (53.7)19.56 (5.3)22.20.3900.823
How accessibility to health facility changedIncreased/Improved185 (187.4)68.021 (18.6)77.8
No change76 (74.6)27.96 (7.4)22.2
Decreased/Deteriorated11 (10)4.00 (1.0)0.01.7250.422
How accessibility to schools changedIncreased/Improved205 (207.4)75.423 (20.6)85.2
No change60 (58.2)22.14 (5.8)14.8
Decreased/Deteriorated7 (6.4)2.60 (0.6)0.01.6070.448
How status of roads changedIncreased/Improved148 (147.4)54.414 (14.6)51.9
No change70 (71.9)25.79 (7.1)33.3
Decreased/Deteriorated54 (52.8)19.94 (5.2)14.80.8880.642
How accessibility to grazing resources changedIncreased/Improved204 (207.4)75.024 (20.6)88.9
No change23 (22.7)8.52 (2.3)7.4
Decreased/Deteriorated45 (41.8)16.51 (4.2)3.73.2860.193
How accessibility to electricity changedIncreased/Improved70 (67.3)25.74 (6.7)14.8
No change193 (194.7)71.021 (19.3)77.8
Decreased/Deteriorated9 (10.0)3.32 (1.0)7.42.4650.292
How security status changedIncreased/Improved235 (234.7)86.423 (23.3)85.2
No change8 (9.1)2.92 (0.9)7.4
Decreased/Deteriorated29 (28.2)10.72 (2.8)7.41.7200.423
Table A10. Chi-square tests of association between respondents’ sheep and goat herd size and their perceptions of conservancy-related changes in various socioeconomic indicators. Values in parentheses are expected counts.
Number of Sheep and Goats
1–5051 and Above
Count%Count%χ2p-Value
How livestock numbers changedIncreased/Improved109 (115.9)63.7124 (117.2)71.7
No change43 (40.3)25.138 (40.7)22.0
Decreased/Deteriorated19 (14.9)11.111 (15.1)6.43.3960.183
How the average household income changedIncreased/Improved131 (131.7)76.6134 (133.3)77.5
No change20 (13.9)11.78 (14.1)4.6
Decreased/Deteriorated20 (25.4)11.731 (25.6)17.97.5380.023
How accessibility to water changedIncreased/Improved91 (91.5)53.293 (92.5)53.8
No change49 (46.2)28.744 (46.2)25.4
Decreased/Deteriorated31 (33.3)18.136 (33.3)20.80.6520.722
How accessibility to health facility changedIncreased/Improved112 (114.3)65.5118 (115.7)68.2
No change49 (49.2)28.750 (49.8)28.9
Decreased/Deteriorated10 (7.5)5.85 (7.5)2.91.8220.402
How accessibility to schools changedIncreased/Improved124 (125.3)72.5128 (126.7)74.0
No change42 (42.3)24.643 (42.7)24.9
Decreased/Deteriorated5 (3.5)2.92 (3.5)1.21.3490.509
How status of roads changedIncreased/Improved100 (91.0)58.583 (92.0)48.0
No change46 (49.2)26.953 (49.8)30.6
Decreased/Deteriorated25 (30.8)14.637 (31.2)21.44.3850.112
How accessibility to grazing resources changedIncreased/Improved131 (133.2)76.6137 (134.8)79.2
No change17 (12.4)9.98 (12.6)4.6
Decreased/Deteriorated23 (25.4)13.528 (225.6)16.23.8530.146
How accessibility to electricity changedIncreased/Improved50 (44.7)29.240 (45.3)23.1
No change113 (120.3)66.1129 (121.7)74.6
Decreased/Deteriorated8 (6.0)4.74 (6.0)2.33.4910.175
How security status changedIncreased/Improved144 (140.7)84.2139 (142.3)80.3
No change7 (5.5)4.14 ((5.5)2.3
Decreased/Deteriorated0 (24.9)11.730 (25.1)17.32.8950.217

References

  1. Krug, W. Private Supply of Protected Land in Southern Africa: A Review of Markets, Approaches, Barriers and Issues. In Proceedings of the World Bank/OECD International Workshop on Market Creation for Biodiversity Products and Services, Paris, France, 2001; pp. 1–42. [Google Scholar]
  2. Fynn, R.W.S.; Bonyongo, M.C. Functional Conservation Areas and the Future of Africa’s Wildlife. Afr. J. Ecol. 2011, 49, 175–188. [Google Scholar] [CrossRef]
  3. Dudley, N. Guidelines for Applying Protected Area Management Categories; Dudley, N., Ed.; IUCN: Gland, Switzerland, 2008; Volume 38, ISBN 9782831716367. [Google Scholar]
  4. Western, D.; Gichohi, H. Segregation Effects and the Impoverishment of Savanna Parks: The Case for Ecosystem Viability Analysis. Afr. J. Ecol. 1993, 31, 269–281. [Google Scholar] [CrossRef]
  5. Western, D.; Russell, S.; Cuthil, I. The Status of Wildlife in Protected Areas Compared to Non-Protected Areas of Kenya. PLoS ONE 2009, 4, e6140. [Google Scholar] [CrossRef] [PubMed] [Green Version]
  6. Mureithi, S.M.; Verdoodt, A.T.; Njoka, J.S.; Olesarioyo, J.; van Ranst, E. Community-Based Conservation: An Emerging Land Use at the Livestock-Wildlife Interface in Northern Kenya. In Wildlife Management—Failures, Successes and Prospects; Kideghesho, J., Ed.; IntechOpen: London, UK, 2019; pp. 61–79. [Google Scholar]
  7. Carter, E.; Adams, W.M.; Hutton, J. Private Protected Areas: Management Regimes, Tenure Arrangements and Protected Area Categorization in East Africa. Oryx 2008, 42, 177–186. [Google Scholar] [CrossRef] [Green Version]
  8. Jones, B.T.B. Community Conservation in Africa. Successes and Failures–Lessons for the Current Poaching Crisis; Centre D’Estudis Africans i Interculturals (CEA): Barcelona, Spain, 2015. [Google Scholar]
  9. African Wildlife Foundation. African Conservancies Volume: Towards Best Practices; African Wildlife Foundation: Nairobi, Kenya, 2016; Volume 1. [Google Scholar]
  10. Kimiti, D.W.; Jeffrey, A.C.H.; Adam, E.H.; Abbott, L.E. Rehabilitation of Community-Owned, Mixed-Use Rangelands: Lessons from the Ewaso Ecosystem in Kenya. Plant Ecol. 2017, 218, 23–37. [Google Scholar] [CrossRef]
  11. Suich, H. Evaluating the Household Level Outcomes of Community Based Natural Resource Management: The Tchuma Tchato Project and Kwandu Conservancy. Ecol. Soc. 2013, 18. [Google Scholar] [CrossRef] [Green Version]
  12. Odadi, W.O.; Fargione, J.; Rubenstein, D.I. Vegetation, Wildlife, and Livestock Responses to Planned Grazing Management in an African Pastoral Landscape. Land Degrad. Dev. 2017, 28, 2030–2038. [Google Scholar] [CrossRef]
  13. Bersaglio, B.; Cleaver, F. The Institutional Workings of Community Conservancies in Kenya. Conserv. Soc. 2020, 16, 467–480. [Google Scholar] [CrossRef]
  14. Bedelian, C.; Ogutu, J.O. Trade-Offs for Climate-Resilient Pastoral Livelihoods in Wildlife Conservancies in the Mara Ecosystem, Kenya. Pastoralism 2017, 7, 1–22. [Google Scholar] [CrossRef] [PubMed]
  15. Thirgood, S.; Woodroffe, R.; Rabinowitz, A. The impact of human–wildlife conflict on human lives and livelihoods. In People and Wildlife, Conflict or Co-Existence? Woodroffe, R., Thirgood, S., Rabinowitz, A., Eds.; Conservation Biology; Cambridge University Press: Cambridge, UK, 2005; pp. 13–26. [Google Scholar]
  16. Brooks, J.; Waylen, K.A.; Mulder, M.B. Assessing Community-Based Conservation Projects: A Systematic Review and Multilevel Analysis of Attitudinal, Behavioral, Ecological, and Economic Outcomes. Environ. Evid. 2013, 2, 1–34. [Google Scholar] [CrossRef] [Green Version]
  17. Lichtenfeld, L.L.; Naro, E.M.; Snowden, E. Community, Conservation, and Collaboration: A Framework for Success; National Geographic Society: Washington, DC, USA; African People & Wildlife: Arusha, Tanzania, 2019. [Google Scholar]
  18. GoK. Arid and Semi-Arid Lands Branch, Laikipia District: A Pre-Investment Study of Human and Natural Resources; Range Management Division: Nairobi, Kenya, 2007. [Google Scholar]
  19. Kinnaird, M.F.; O’brien, T.G. Effects of Private-Land Use, Livestock Management, and Human Tolerance on Diversity, Distribution, and Abundance of Large African Mammals. Conserv. Biol. 2012, 26, 1026–1039. [Google Scholar] [CrossRef] [PubMed]
  20. Kinyua, D.; McGeoch, L.E.; Georgiadis, N.; Young, T.P. Short-Term and Long-Term Effects of Soil Ripping, Seeding, and Fertilization on the Restoration of a Tropical Rangeland. Restor. Ecol. 2010, 18, 226–233. [Google Scholar] [CrossRef]
  21. Northern Rangeland Trust Naibunga Community Conservancy: Conservancy Management and Community Development Plan (2017–2021); Nothern Rangeland Trust: Nanyuki, Kenya, 2017.
  22. Graham, M. Laikipia Wildlife Forum. A Wildlife Conservation Strategy for Laikipia County (2013–2030); Laikipia Wildlife Forum: Nanyuki, Kenya, 2012. [Google Scholar]
  23. World Bank. World Development Report 2000/2001: Attacking Poverty; Oxford University Press: New York, NY, USA, 2001; ISBN 0195215982. [Google Scholar]
  24. IBM Corperation. IBM SPSS Statistics for Windows; IBM Corperation: Armonk, NY, USA, 2019. [Google Scholar]
  25. Mchugh, M.L. The Chi-Square Test of Independence Lessons in Biostatistics. Biochem. Med. 2013, 23, 143–149. [Google Scholar] [CrossRef] [PubMed] [Green Version]
  26. Northern Rangeland Trust. State of Conservancies Report 2018; Nothern Rangeland Trust: Nanyuki, Kenya, 2019. [Google Scholar]
  27. Northern Rangeland Trust. State of Conservancies Report 2019; Nothern Rangeland Trust: Nanyuki, Kenya, 2020. [Google Scholar]
  28. Oduor, A.M.O.O. Benefits and Challenges of Community-Based Wildlife Conservancies in Kenya’s Maasai Mara Ecosystem. J. Environ. Manag. 2020, 260, 110133. [Google Scholar] [CrossRef]
  29. Riehl, B.; Zerriffi, H.; Naidoo, R. Effects of Community-Based Natural Resource Management on Household Welfare in Namibia. PLoS ONE 2015, 10, e125531. [Google Scholar] [CrossRef]
  30. Syallow, D.M. The Role of Community Conservancies in Wildlife Conservation and Livelihoods Systems of The Maasai: A Case Study of Enoonkishu Conservancy, Narok County, Kenya. Ph.D. Thesis, University of Nairobi, Nairobi, Kenya, 2013. [Google Scholar]
  31. Goodwin, H.; Santilli, R. Community-Based Tourism: A Success? Tour. Manag. 2009, 11, 1–37. [Google Scholar]
  32. Liniger, H.; Studer, R.M. Sustainable Rangeland Management in Sub-Saharan Africa—Guideline to Good Practice; University of Bern: Bern, Switzerland, 2019. [Google Scholar]
  33. Kenya Wildlife Conservancies Association. State of Wildlife Conservancies in Kenya Report; Kenya Wildlife Conservancies Association: Nairobi, Kenya, 2016; Volume 84. [Google Scholar]
  34. Kantai, R. Tracing Community Conservation Evolution, Power Relations and Sustainability in Northern Kenya. Master’s Thesis, University of Oxford, Oxford, UK, 2012. [Google Scholar]
  35. Mbugua, N.R. The Causes and Impact of Insecurity on Pastoralists Economies: The Case of West Pokot County, Kenya (1990–2015). Master’s Thesis, University of Nairobi, Nairobi, Kenya, 2016. [Google Scholar]
  36. Nyariki, D.M.; Amwata, D.A. The Value of Pastoralism in Kenya: Application of Total Economic Value Approach. Pastoralism 2019, 9. [Google Scholar] [CrossRef]
  37. Keane, A.; Gurd, H.; Kaelo, D.; Said, M.Y.; de Leeuw, J.; Rowcliffe, J.M.; Homewood, K. Gender Differentiated Preferences for a Community-Based Conservation Initiative. PLoS ONE 2016, 11, e152432. [Google Scholar] [CrossRef] [Green Version]
  38. Glew, L.; Hudson, M.D.; Osborne, P.E. Evaluating the Effectiveness of Community-Based Conservation in Northern Kenya: A Report to The Nature Conservancy; University of Southampton School of civil Engineering and the Environment: Southampton, UK, 2010. [Google Scholar]
  39. Lalampaa, P.K.; Wasonga, O.V.; Rubenstein, D.I.; Njoka, J.T. Effects of Holistic Grazing Management on Milk Production, Weight Gain, and Visitation to Grazing Areas by Livestock and Wildlife in Laikipia County, Kenya. Ecol. Process. 2016, 5. [Google Scholar] [CrossRef] [Green Version]
  40. Hauck, S.; Rubenstein, D.I. Pastoralist Societies in Flux: A Conceptual Framework Analysis of Herding and Land Use among the Mukugodo Maasai of Kenya. Pastoralism 2017, 7. [Google Scholar] [CrossRef] [Green Version]
  41. Mwangi, V.; Owuor, S.; Kiteme, B.; Giger, M. Beef Production in the Rangelands: A Comparative Assessment between Pastoralism and Large-Scale Ranching in Laikipia County, Kenya. Agriculture 2020, 10, 399. [Google Scholar] [CrossRef]
  42. Butt, B. Herding by Mobile Phone: Technology, Social Networks and the “Transformation” of Pastoral Herding in East Africa. Hum. Ecol. 2015, 43, 1–14. [Google Scholar] [CrossRef]
  43. Lesilau, F.; Fonck, M.; Gatta, M.; Musyoki, C.; van’t Zelfde, M.; Persoon, G.A.; Musters, K.C.J.M.; de Snoo, G.R.; de Iongh, H.H. Effectiveness of a LED Flashlight Technique in Reducing Livestock Depredation by Lions (Panthera Leo) around Nairobi National Park, Kenya. PLoS ONE 2018, 13, e190898. [Google Scholar] [CrossRef] [PubMed]
  44. Wyman, M.; Stein, T. Examining the Linkages between Community Benefits, Place-Based Meanings, and Conservation Program Involvement: A Study within the Community Baboon Sanctuary, Belize. Soc. Nat. Resour. 2010, 23, 542–556. [Google Scholar] [CrossRef]
  45. Ward, C.; Holmes, G.; Stringer, L. Perceived Barriers to and Drivers of Community Participation in Protected-Area Governance. Conserv. Biol. 2018, 32, 437–446. [Google Scholar] [CrossRef] [PubMed]
  46. Kaeser, A.S. Attitudes and Barriers to Women’ s Participation in a Proposed Community-Based Conservation Program in Western Belize. Ph.D. Dissertation, The University of Tennessee, Knoxville, Tennessee, 2016. [Google Scholar]
  47. OECD What Are the Social Benefits of Education? Choice Rev. Online 2013, 35, 1–4. [CrossRef]
  48. Ray, B.; Mukherjee, P.; Bhattacharya, R.N.; Ray, B.; Mukherjee, P.; Bhattacharya, R.N. Attitudes and Cooperation: Does Gender Matter in Community-Based Forest Management? Environ. Dev. Econ. 2017, 22, 594–623. [Google Scholar] [CrossRef]
  49. Pozo, R.A.; Cusack, J.J.; Acebes, P.; Malo, J.E.; Traba, J.; Iranzo, E.C.; Morris-Trainor, Z.; Minderman, J.; Bunnefeld, N.; Radic-Schilling, S.; et al. Reconciling Livestock Production and Wild Herbivore Conservation: Challenges and Opportunities. Trends Ecol. Evol. 2021, xx, 1–12. [Google Scholar] [CrossRef]
Figure 1. Map of Naibunga Conservancy in Laikipia County, Kenya. Source: This study.
Sustainability 13 07772 g001
Figure 2. Respondents’ various demographic attributes.
Sustainability 13 07772 g002
Figure 3. Respondents’ involvement in community conservancy management and conservation activities.
Sustainability 13 07772 g003
Table 1. Respondents’ perceptions of conservancy-related changes in various socioeconomic indicators.
Increased/ImprovedNo ChangeDecreased/Deteriorated
Freq.%Freq.%Freq.%
How socioeconomic status changed generally29389.6288.661.8
How livestock numbers changed23365.39326.1318.7
How cattle numbers changed25070.07521.0329.0
How goat/sheep numbers changed24067.26217.45515.4
How camel numbers changed7922.126173.1174.8
How donkey numbers changed298.129281.83610.1
How the average household income changed26975.4359.85314.8
How accessibility to water changed18952.910128.36718.8
How accessibility to health facility changed23666.110629.7154.2
How accessibility to schools changed25872.39225.872.0
How status of roads changed19153.510328.96317.6
How accessibility to grazing resources changed27577.0298.15314.8
How accessibility to electricity changed9225.825270.6133.6
How security status changed29382.1133.65114.3
Table 2. Chi-square tests for association between respondents’ perceptions of conservancy-related socioeconomic outcomes and their involvement in conservancy management and conservation activities. Values in parentheses are expected counts.
Involvement
InvolvedNot Involved
Freq.%Freq.%χ2p-Value
How socioeconomic status changed generallyIncreased/Improved243 (221.3)82.950 (71.7)17.1
No change4 (21.1)14.324 (6.9)85.7
Decreased/Deteriorated0 (4.5)0.06 (6.0)100.084.1<0.001
How livestock numbers changedIncreased/Improved204 (179.5)87.629 (53.5)12.4
No change53 (71.6)57.040 (21.4)43.0
Decreased/Deteriorated18 (23.9)58.113 (7.1)41.941.0<0.001
How cattle numbers changedIncreased/Improved218 (192.6)87.232 (57.4)12.8
No change37 (57.8)49.338 (17.2)50.7
Decreased/Deteriorated20 (24.6)62.512 (7.4037.551.0<0.001
How goat/sheep numbers changedIncreased/Improved203 (184.9)84.637 (55.1)15.4
No change32 (47.8)51.630 (14.2)48.4
Decreased/Deteriorated40 (42.4)72.715 (12.6)27.331.0<0.001
How camel numbers changedIncreased/Improved78 (60.9)98.71 (18.1)1.3
No change187 (201.1)71.674 (59.9)28.4
Decreased/Deteriorated10 (13.1)58.87 (3.9)41.228.5<0.001
How donkey numbers changedIncreased/Improved26 (22.3)89.73 (6.7)10.3
No change221 (224.9)75.771 (67.1)24.3
Decreased/Deteriorated28 (27.7)77.88 (8.3)22.22.90.232
How the average household income changedIncreased/Improved236 (207.2)87.733 (61.8)12.3
No change21 (27.0)60.014 (8.0)40.0
Decreased/Deteriorated18 (40.8)34.035 (12.2)66.078.7<0.001
How accessibility to water changedIncreased/Improved155 (145.6)82.034 (43.4)18.0
No change74 (77.8)73.327 (23.2)26.7
Decreased/Deteriorated46 (51.6)68.721 (15.4)31.36.10.047
How accessibility to health facility changedIncreased/Improved198 (181.8)83.938 (54.2)16.1
No change63 (81.7)59.443 (24.3)40.6
Decreased/Deteriorated14 (11.6)93.31 (3.4)6.727.1<0.001
How accessibility to schools changedIncreased/Improved220 (198.7)85.338 (59.3)14.7
No change49 (70.9)53.343 (21.1)46.7
Decreased/Deteriorated6 (5.4)85.71 (1.6)14.339.6<0.001
How status of roads changedIncreased/Improved175 (147.1)91.616 (43.9)8.4
No change62 (79.3)60.241 (23.7)39.8
Decreased/Deteriorated38 (48.5)60.325 (14.5)39.749.4<0.001
How accessibility to grazing resources changedIncreased/Improved226 (211.8)82.249 (63.2)17.8
No change22 (22.3)75.97 (6.7)24.1
Decreased/Deteriorated27 (40.8)50.926 (12.2)49.124.5<0.001
How accessibility to electricity changedIncreased/Improved87 (70.9)94.65 (21.1)5.4
No change175 (194.1)69.477 (57.9)30.6
Decreased/Deteriorated13 (10.0)100.00 (3.0)0.028.1<0.001
How security status changedIncreased/Improved244 (225.7)83.349 (67.3)16.7
No change10 (10.0)76.93 (3.0)23.1
Decreased/Deteriorated21 (39.3)41.230 (11.7)58.843.5<0.001
Table 3. Chi-square tests of association between respondents’ perceptions of conservancy-related socioeconomic outcomes and various demographic factors. Values in parentheses are expected counts.
Changes in Overall Socioeconomic Status
ImprovedNot Improved
Freq.%Freq.%χ2p-Value
GenderMale178 (179.2)89.022 (20.8)11.0
Female115 (113.8)90.612 (13.2)9.40.20.654
Education levelNo formal education154 (157.7)87.522 (18.3)12.5
Formal education139 (135.3)92.112 (15.7)7.91.80.179
Household size1–5192 (184.4)93.214 (21.6)6.8
6 and above98 (105.6)83.120 (12.4)16.98.20.004
Own cattle?Yes258 (245.4)94.216 (28.6)5.8
No34 (46.6)65.418 (5.4)34.638.7<0.001
Own sheep and goats?Yes286 (283.0)90.530 (33.0)9.5
No6 (9.0)60.04 (1.0)40.09.70.002
Own donkeys?Yes55 (55.5)88.77 (6.5)11.3
No237 (236.5)89.827 (27.5)10.20.10.805
Own camels?Yes91 (81.5)100.00 (9.5)0.0
No201 (210.5)85.534 (24.5)14.514.7<0.001
Number of cattle1–50236 (236.3)94.015 (14.7)6.0
51 and above22 (21.7)95.71 (1.3)4.30.10.750
Number of sheep and goats1–50142 (139.4)92.212 (14.6)7.8
51 and above144 (146.6)88.918 (15.4)11.11.00.314
Table 4. Chi-square tests of association between respondents’ involvement in conservancy management and conservation programs and various demographic factors. Values in parentheses are expected counts.
Involvement
InvolvedNot Involved
Freq.%Freq.%χ2p-Value
GenderMale160 (168.7)73.159 (50.3)26.95.10.025
Female115 (106.3)83.323 (31.7)16.7
Education levelNo formal education141 (149.4)72.753 (44.6)27.3
Formal education134 (125.6)82.229 (37.4)17.84.60.033
Household size1–5191 (175.7)84.136 (51.3)15.9
6 and above83 (98.3)65.444 (28.7)34.616.4<0.001
Own cattle?Yes239 (230.1)79.960 (68.9)20.19.30.002
No35 (43.9)61.422 (13.1)38.6
Own sheep and goats?Yes263 (264.8)76.581 (79.2)23.5
No11 (9.2)91.71 (2.8)8.31.50.219
Own donkeysYes46 (51.6)68.721 (15.4)31.3
No228 (222.4)78.961 (66.6)21.13.20.073
Own camels?Yes88 (74.7)90.79 (22.3)9.3
No186 (199.3)71.873 (59.7)28.214.2<0.001
Number of cattle1–50215 (217.4)79.057 (54.6)21.0%
51 and above24 (21.6)88.93 (5.4)11.1%1.50.224
Number of sheep and goats1–50140 (130.7)81.931 (40.3)18.1%
51 and above123 (132.3)71.1%50 (40.7)28.9%5.50.019
Publisher’s Note: MDPI stays neutral with regard to jurisdictional claims in published maps and institutional affiliations.