Review

Impacts of Event-Based Recharge on the Vulnerability of Public Supply Wells

1
Department of Earth and Environmental Sciences, University of Waterloo, Waterloo, ON N2L 3G1, Canada
2
Les Services EXP Inc., Montréal, QC H1Z 4J2, Canada
3
Jacobs Engineering Group Inc., Kitchener, ON N2G 4Y9, Canada
4
Hamilton Water, Hamilton, ON L8R 2K3, Canada
5
Golder Associates Ltd., Cambridge, ON N1T 1A8, Canada
*
Author to whom correspondence should be addressed.
Sustainability 2021, 13(14), 7695; https://doi.org/10.3390/su13147695
Submission received: 16 May 2021 / Revised: 3 July 2021 / Accepted: 7 July 2021 / Published: 9 July 2021
(This article belongs to the Special Issue Advances in Source Water Protection and Sustainability)

Abstract

:
Dynamic recharge events related to extreme rainfall or snowmelt are becoming more common due to climate change. The vulnerability of public supply wells to water quality degradation may temporarily increase during these types of events. The Walkerton, ON, Canada, tragedy (2000) highlighted the threat to human health associated with the rapid transport of microbial pathogens to public supply wells during dynamic recharge events. Field research at the Thornton (Woodstock, ON, Canada) and Mannheim West (Kitchener, ON, Canada) well fields, situated in glacial overburden aquifers, identified a potential increase in vulnerability due to event-based recharge phenomena. Ephemeral surface water flow and local ponding containing microbial pathogen indicator species were observed and monitored within the capture zones of public supply wells following heavy rain and/or snowmelt. Elevated recharge rates beneath these temporary surface water features were estimated to range between 40 and 710 mm over two-week periods using analytical and numerical modelling based on the water level, soil moisture, and temperature data. Modelling also suggested that such events could reduce contaminant travel times to a supply well, increasing vulnerability to water quality degradation. These studies suggest that event-based recharge processes occurring close to public supply wells may enhance the vulnerability of the wells to surface-sourced contaminants.

1. Introduction

Large rainfall or snowmelt events are known to increase contamination risks to public supply wells, including those related to pathogenic contaminants [1]. Risks may be associated with spatially and temporally dynamic groundwater recharge, where localized infiltration is caused by temporary overland flow or ponding at the ground surface. Contaminants including microbial pathogens and indicator species, for example, may be transported by overland runoff [2,3,4] or re-suspended from streambed sediments during events [5,6,7,8]. If contaminant species infiltrate into the groundwater system, migration rates are influenced by the permeability of the subsurface units. For example, transport is likely to be faster in karstic carbonate bedrock aquifers than in unconsolidated soils because of the rapid groundwater flow associated with the dissolution pathways and fractures [9,10,11].
Potential site-specific threats to most public supply wells related to transient hydrologic events may not be adequately understood. Threats associated with karstic and fractured carbonate rock aquifers were apparent after the Walkerton, Ontario, Canada, disease outbreak (May 2000; [12,13]), but other types of aquifers have received less attention. The vulnerability of wells screened in unconsolidated overburden aquifers may be perceived to be less of a concern than that of wells screened in fractured rock due to slower contaminant transport rates and the potential filtration capacity of sediments; however, caution and greater understanding are also needed in these cases. For instance, wells drilled in a semi-confined alluvial gravel aquifer [14] near the town of Havelock North in New Zealand were the source of a Campylobacteriosis outbreak in Aug 2016 after heavy rainfall (165 mm in two days) [15]. Furthermore, extreme hydrological events are expected to become increasingly frequent due to climate change [16,17,18], and such events are likely to induce overland flow and the potential for enhanced infiltration of contaminants [19]. These types of transient hydrologic events may increase the vulnerability of public supply wells to surface-sourced contaminants.
Many studies of disease outbreaks have jointly implicated both heavy rainfall events and groundwater supplies, and this likely represents an under-reporting of the overall number of outbreaks and a geographical bias towards communities in developed countries [20]. However, disease outbreaks associated with public groundwater supply systems continue to occur (e.g., Transtrand, Sweden—2002; Lake Mývatn, Iceland—2004; South Bass Island, OH, USA—2004; Nokia, Finland—2007; Adliswil, Switzerland—2008; Podgorica, Montenegro—2008; Alamosa, CO, USA—2008; Tune, Denmark—2009; Køge, Denmark—2010; Saratoga Springs, UT, USA—2010; Darfield, New Zealand—2012; Havelock North, New Zealand—2016) [21]. It is therefore important to increase our understanding of the risk factors related to the vulnerability of public supply wells to contamination, including via pathogenic microbes. Most overviews of disease outbreaks related to groundwater consumption are not specific about the type of aquifer system involved in the incidents. Further study of the hydrogeological settings and recharge dynamics that occur during major hydrological events may suggest pathways and rates of groundwater flow that could be useful in assessing transient contamination risks to public supply wells. An example of this is the work carried out following the disease outbreak in Walkerton in May 2000 [22].
During the Walkerton tragedy, a heavy rainfall event caused temporary ponding in a field near a public supply well; viable pathogenic microbes infiltrated rapidly through thin overburden sediments into a fractured bedrock aquifer, where they migrated to a shallow public well, resulting in widespread illness [12]. Following the outbreak, source water protection legislation was adopted in many jurisdictions in Ontario and elsewhere. Groundwater under the direct influence of surface water (GUDI) became a formal concern for water managers, and a multiple barrier approach was recommended as a helpful strategy for the protection of public drinking water (e.g., [12,23]). Barriers to contamination include natural attenuation of contaminants within flow systems, treatment (disinfection), and residual treatment within distribution system pipes. In the conventional GUDI assessment of the flow system barrier, a horizontal, saturated zone travel time of 50 days from a surface water source to a well screen has been used as a threshold for microbial pathogens, where arrival before this threshold is of concern. Pathogenic contaminants following longer travel paths in the subsurface are assumed to become inactivated to the extent that they pose an acceptable health risk after this threshold [8,24,25,26,27,28,29]. However, viruses can survive longer (e.g., >200 days; [20,30]).
Assessment of the vulnerability of public supply wells has been a topic of interest and development for several decades. Frind et al. [23] provide a summary of various approaches to quantifying well and aquifer vulnerability ranging from parameter-based indexing methods such as DRASTIC [31] and AVI [32] to modelling-based times of travel, utilizing forward- and backward-in-time transport to estimate contaminant travel time from ground surface to a receptor such as a public supply well [24,33]. At the regional scale, numerical modelling tools have been used as part of source water protection work to delineate time of travel zones around public supply wells, which describe the amount of time a contaminant within an aquifer would take to migrate to a well screen under steady state, advective flow conditions (Ontario Clean Water Act; [34,35]). Most conventional source protection assessments rely on constant steady-state groundwater flow systems for delineating capture zones, and many have employed particle tracking as a numerical approach [24,36,37]. Episodic groundwater recharge events are rarely considered or integrated into such assessments.
The nature of the hydrologic processes leading to enhanced contaminant mobility during transient recharge events is poorly understood and documented at the field scale. Several studies have been conducted in areas with bedrock aquifers. Cey and Rudolph [38] and Cey et al. [39] quantified macropore infiltration rates and colloid transport within the thin overburden soils at the Walkerton site using tension infiltration tests. Worthington et al. [40] and Worthington and Smart [22] discussed tracer experiments, microbial sampling, and numerical modelling that was conducted near Walkerton. Bradbury et al. [41] investigated virus concentrations in deep (220 to 300 m) bedrock wells in Madison, WI, and found correlations between recharge events and virus detections. Investigations completed within glacial overburden environments in southern Ontario have focused on identifying and quantifying localized recharge beneath ephemeral surface water flow features and depression focused recharge (DFR) beneath ponding in topographic depressions. These investigations are discussed below.
The objective of the present study is to develop and present the concept of enhanced well vulnerability related to event-based recharge during ephemeral overland flow and temporary ponding in closed depressions within glacial overburden sediments. The analysis is based on two case studies in southern Ontario, Canada. Detailed field investigations of surface water and groundwater interactions resulting in localized, episodic groundwater recharge are presented along with numerical data analysis to quantify potential impact on the public supply wells. The results are discussed within the context of the enhanced, short-term risk to water quality within public supply wells represented by these types of dynamic recharge events. The issue of bacterial contamination is specifically considered for discussion purposes. Recommendations are then provided on how to incorporate the ensuing increase in risk to the water quality at public supply wells in well vulnerability analyses.

2. Background

Although there is a rich literature on the concepts and various approaches to evaluating aquifer and well vulnerability (e.g., [23,31,32]), very little focus has been placed on the potential, short-term increased threat to groundwater quality from extreme hydrologic events. The major driver for this increase in threat is localized, enhanced groundwater recharge that occurs near a public supply well. Within the scope of this work, the background information below focuses on the nature of hydrologic events that might lead to a temporary increase in well vulnerability and some of the primary contaminants of concern.

2.1. Hydrological Event Frequency and Contaminant Sources

Extreme precipitation events are often defined as the 90th or 95th percentile of local rainfall events [42]. While hydrological events that occur on average once a year (e.g., the ultimate spring snowmelt) may not be extreme due to their return period, they could in some cases be significant from a well vulnerability perspective. The Walkerton outbreak involved 140 mm of rain in five days, which is statistically about a 1 in 60-year event for the area [43]. The last and largest daily rainfall of the five days (~70 mm at Walkerton, 99th percentile) had a return period of about 10 years in the area [43,44,45]. Though May 2000 was a rainy month for the Walkerton area (~200 mm), this was not an uncommon monthly rainfall magnitude for southern Ontario for other months of the year [43], and would be very small in some parts of the world. However, the microbial contamination event that developed in the town’s water distribution system was extreme from a public health standpoint. Metrics that combine multiple factors such as event magnitude, frequency, and possible well exposure time could be helpful for defining which events increase the risk at public supply wells. For instance, Curriero et al. [46] studied disease outbreaks and rainfall in the USA over nearly 50 years and found that potable groundwater supply contamination events were often associated with heavy (80th percentile) rainfall events that occurred within three months of the outbreaks.
Pathogenic microbes represent one of the most acute threats to human health through water quality at public supply wells. Such microbes may rapidly migrate into the subsurface or be remobilized in large numbers and present a concern following large hydrological events, as shown by the frequency of correlation (e.g., [8,20,46]) between heavy rainfall and disease outbreaks. Other point-source contaminants such as hydrocarbon plumes and landfill leachate plumes are certainly concerning for water quality, but they are more likely to be of concern over a longer time period, and targeted land use management can help to keep such spatially permanent sources from impacting a public supply well. Non-point source contaminants such as nitrate and road salt similarly threaten wells over a longer time scale. Their loading history is influenced by hydrological events, but a correlation between a single large hydrological event and a dramatic increase in concentration at a municipal well is less likely due to dilution and dispersion along a flow path at the decadal time scale. It may be difficult to prevent microbial contaminants originating from wild animals (e.g., deer; [47,48]) and livestock [1,49] that become transported by overland runoff from infiltrating near public wells.

2.2. Seasonality

There are differences in conceptual understandings of the processes and impacts of precipitation-related events in different seasons. Winter events may take place when surficial soils are frozen, which may lead to overland flow (runoff) dominating over infiltration [50]. Greenwood and Buttle [50] differentiated between different degrees of frost extent, noting that agricultural fields developed more continuous soil frost during some years, which inhibited infiltration, while forested sites developed less extensive soil frost that allowed infiltration. A critical issue during winter and spring events is whether porewater has frozen and sealed off drainage pathways to the water table, forming so-called “concrete” frost [50]. This issue may make the impacts of mid-winter or early spring rain and/or snowmelt events on recharge rates difficult to predict.
Summer rainstorms have the potential to facilitate substantial infiltration magnitudes, but evapotranspiration (ET) during the height of the growing season may prevent significant recharge from occurring, and rainfall may only replenish soil moisture deficits (e.g., [51]). However, overland flow coupled with the DFR process has the potential to locally overcome ET and soil moisture changes [52]. The hydraulic conductivity of shallow soils plays an important role in whether drainage will migrate beneath the root zone before plants remove it, and whether recharge will occur. Late spring, summer, and early fall events conceptually lack the barrier of frozen soils that could delay infiltration. The presence of macropores further complicates infiltration and therefore recharge dynamics [38]. The wetting and drying history of the soil influences the existence of desiccation cracks and its hydraulic conductivity, possibly allowing permeability to fluctuate during the year [53,54,55]. Some macropores may persist throughout all seasons, while others may be seasonally activated. During moist soil conditions, clay may swell and seal some macropores. Dry conditions may lead to their re-opening.

2.3. Microbial Pathogens
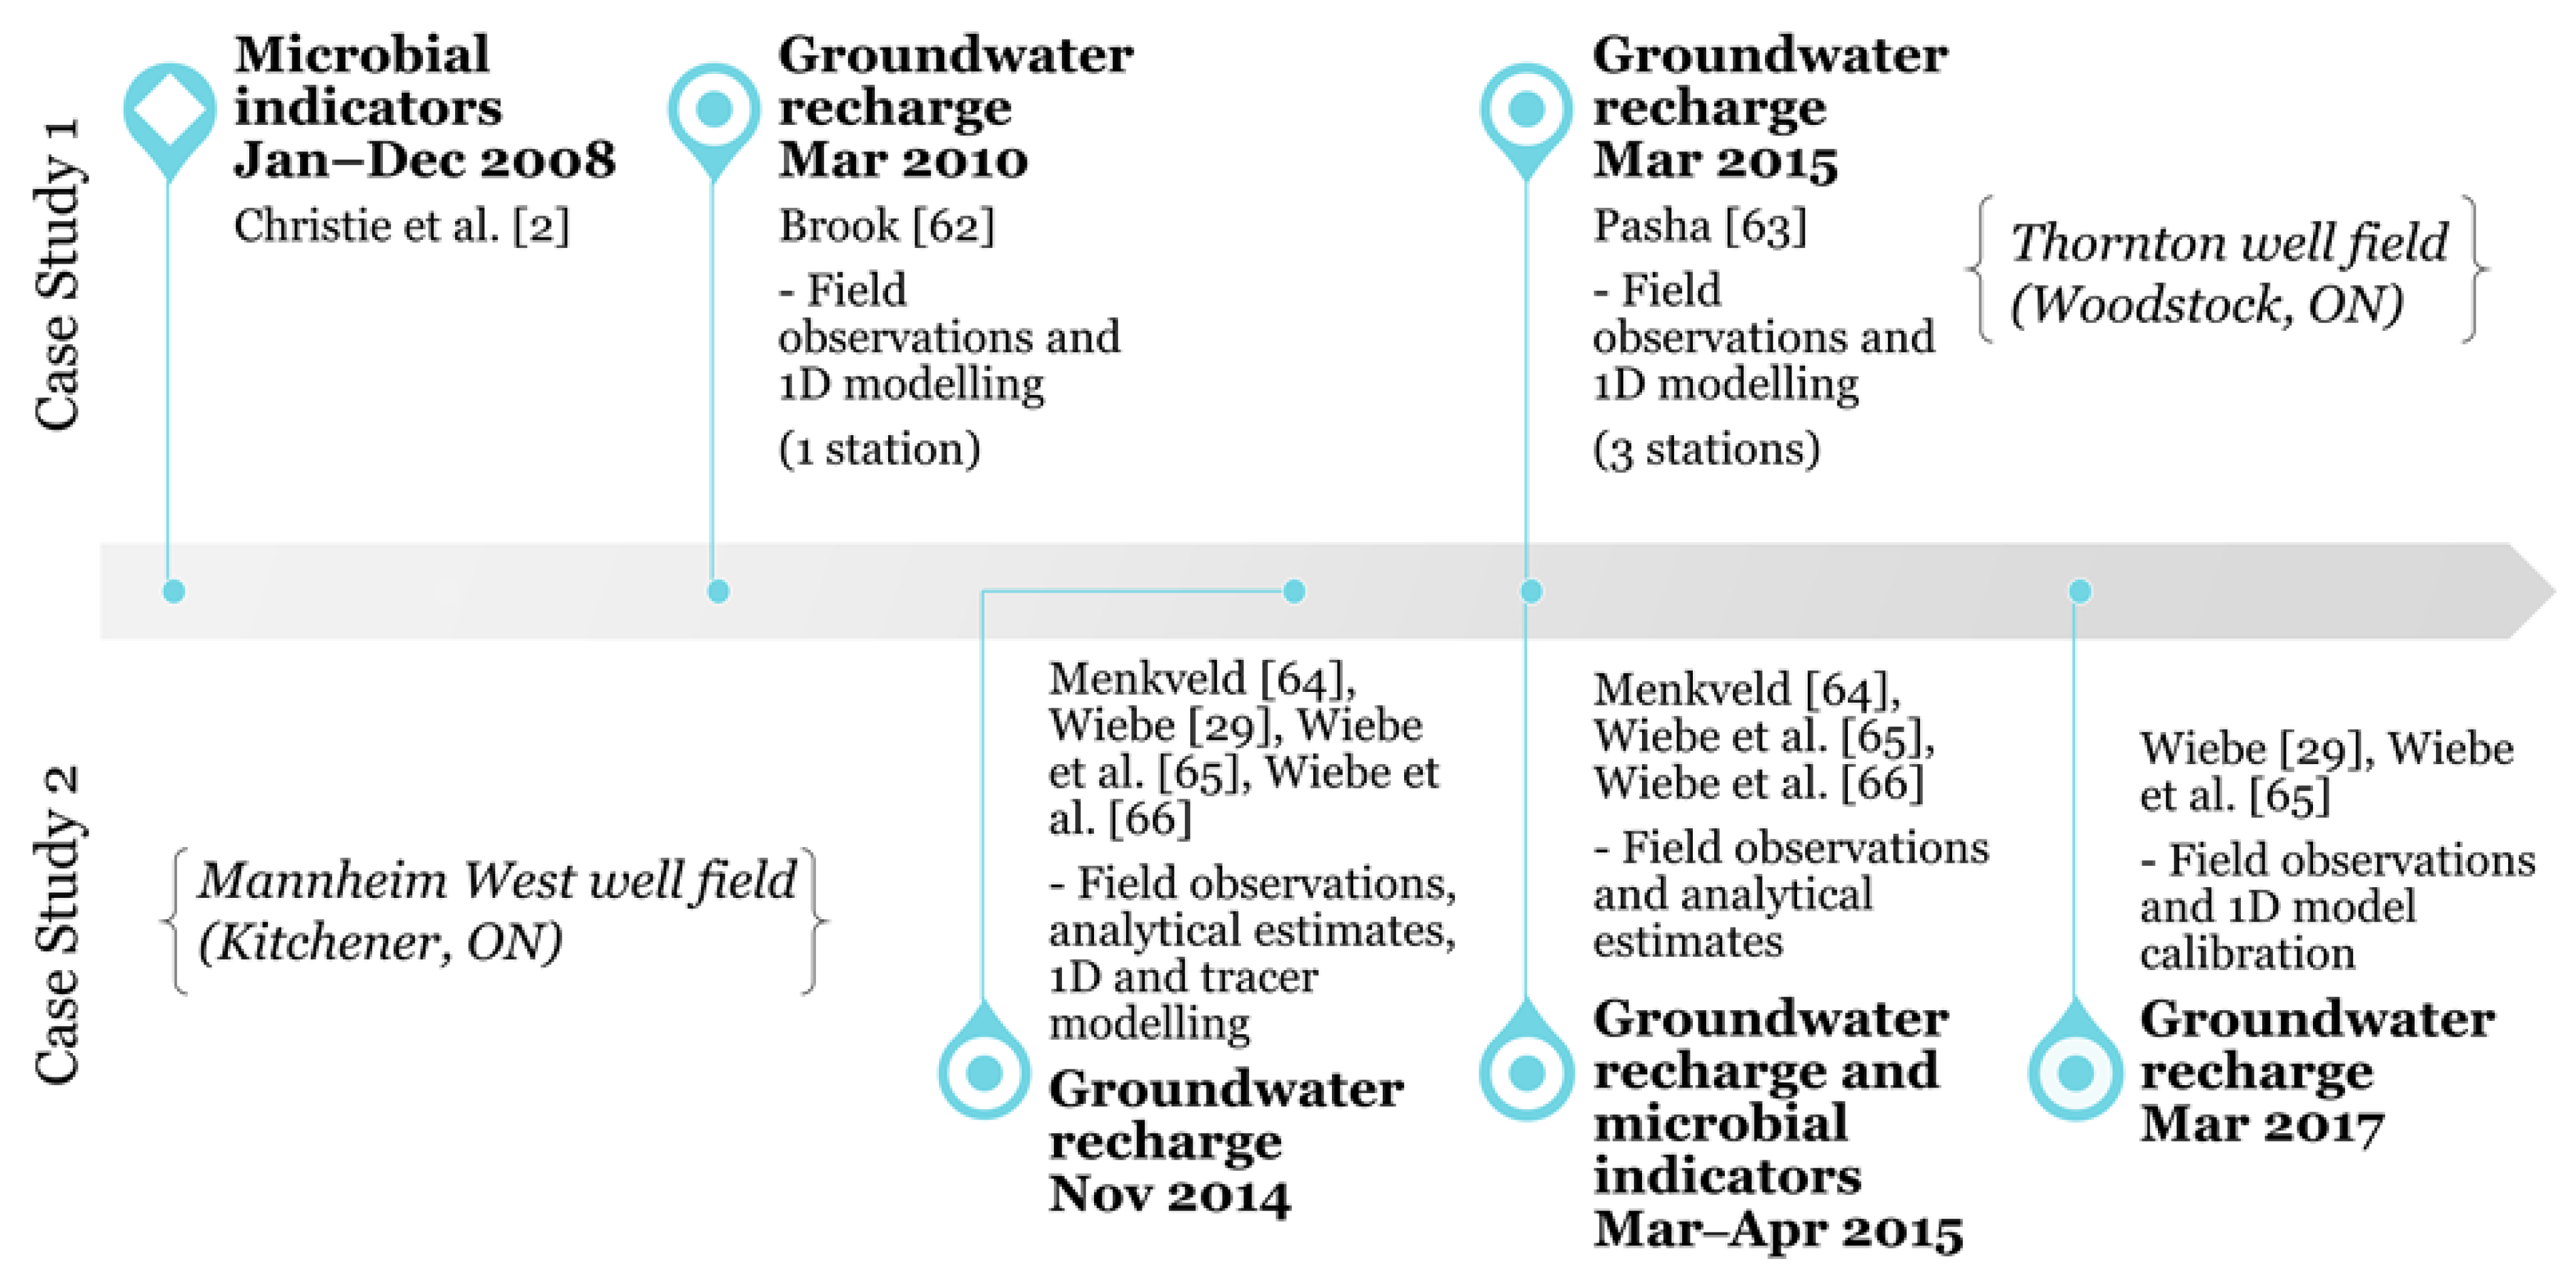
Fecal bacteria, some of which may cause disease, are commonly found in surface water [56]. As pathogenic microbe concentrations are difficult and costly to quantify, indicator bacteria are frequently considered as proxies [56,57,58,59,60]. Fecal indicator bacteria concentrations generally correlate with the occurrence of human illness and are typically higher during storm events [56]. Potential sources for fecal bacteria may include wildlife, livestock, and private septic systems [56], or wastewater treatment plants [19,61].
The Walkerton tragedy illustrates the potential for microbes hazardous to human health to be mobilized into the subsurface during hydrological events. Though rapid flow paths through karstic rock aquifers present an obvious concern for well water managers, it is unclear whether risks of the same kind exist for many wells screened in overburden aquifers. The characteristics that make sites attractive for public supply wells—such as glacial outwash deposits (high transmissivity aquifers) and locations where water tables are relatively shallow, including low-lying terrain—could be associated with rapid recharge and therefore microbial risks, should a source be present in the vicinity.

3. Case Studies

During the course of independent hydrogeological studies conducted around two public groundwater supply systems in southern Ontario, conditions that could lead to significant localized recharge phenomena were observed. Subsequent research focused on developing probable conceptual models of recharge phenomena and documenting the occurrence of recharge processes in situ. Although the hydrogeologic settings within glacial overburden sediments are similar in both cases, the nature of the recharge processes was very different. The results from these field studies are used here to illustrate the potential impact of large, localized recharge events on water well vulnerability.
The first case study (Thornton well field) includes an assessment of microbial indicator species in surface water and groundwater at the site during snowmelt events and at other times of the year (Christie et al. [2]), in addition to discussing the observation and estimation of groundwater recharge by Brook [62] and Pasha [63]. The second case study (Mannheim West well field) discusses recharge observations (Menkveld [64], Wiebe et al. [65], and Wiebe [29]) and estimates (Wiebe et al. [66], and Supplementary Materials document S1) and simulations of numerical tracer transport (Wiebe [29], and Supplementary Materials document S1) related to an episodic recharge event. The tracer simulations evaluated the potential for a temporary increased threat to the public supply well at the site due to a large recharge event. Figure 1 presents a timeline of the research discussed in the two case studies.

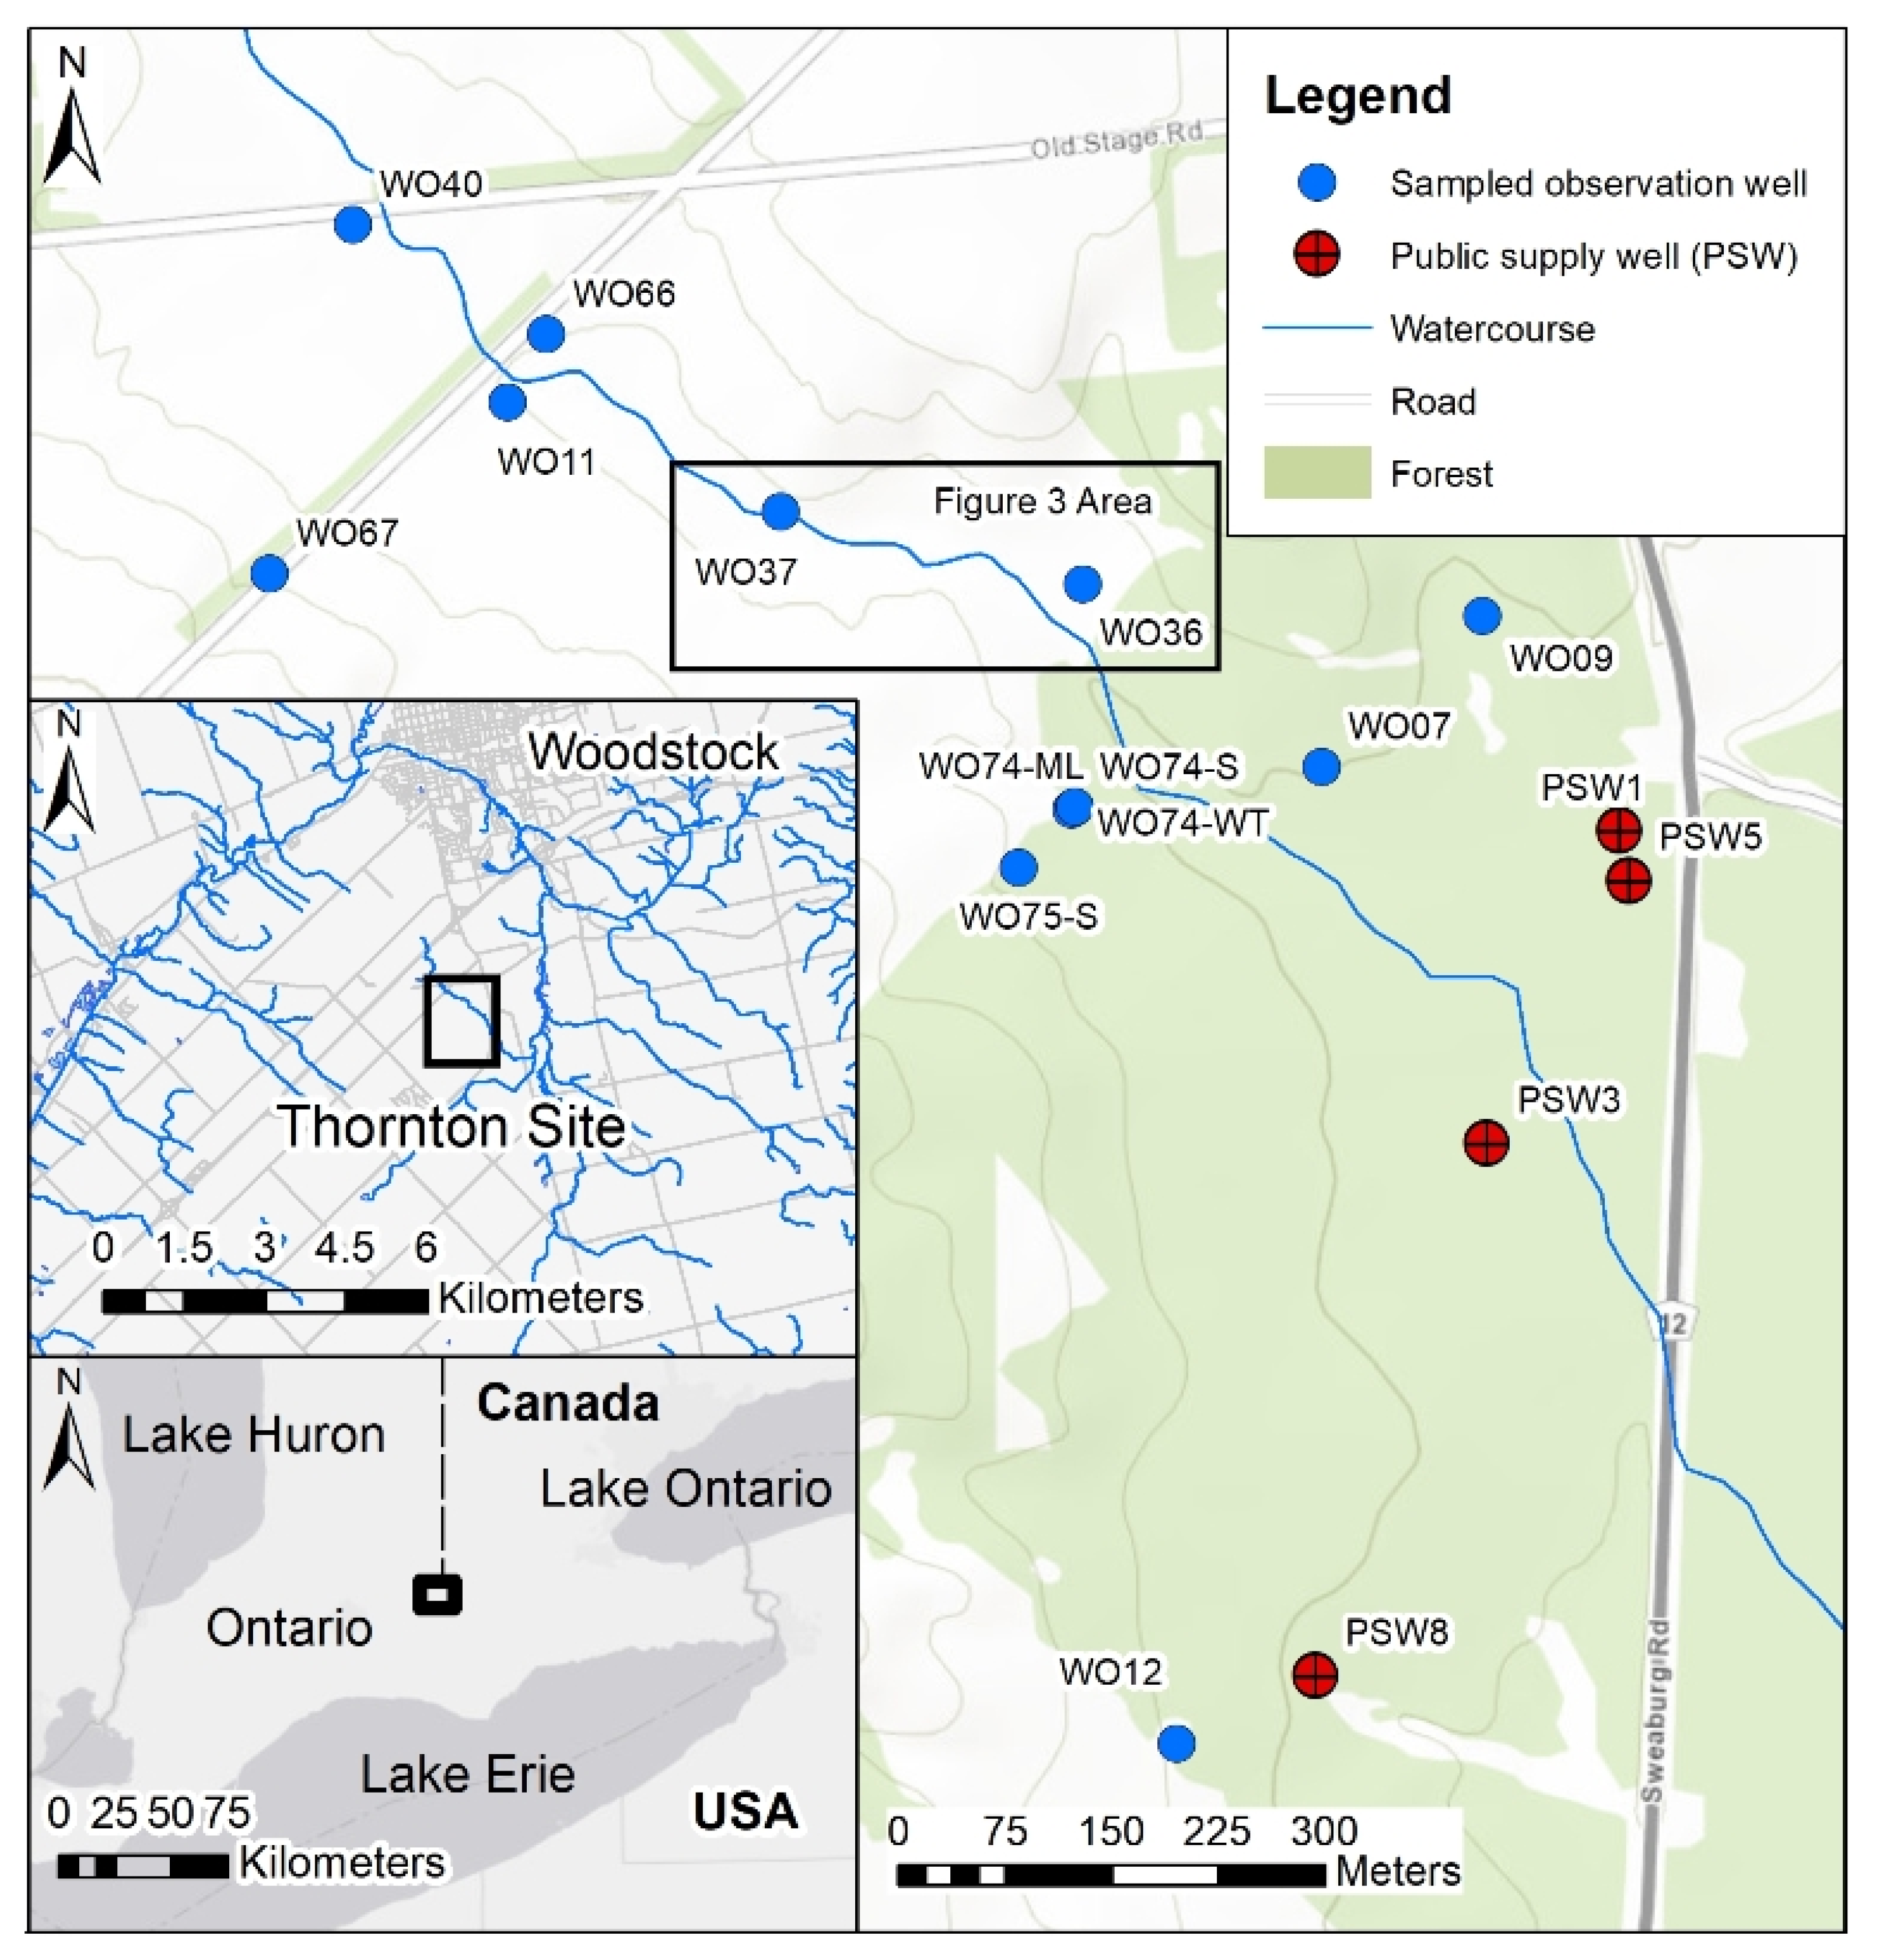
3.1. Case Study 1: Thornton Well Field, Woodstock, ON

3.1.1. Field Site

The Thornton well field (Figure 2; “Thornton” site) is located within a drumlin field related to an interlobate zone that was influenced by up to three different glacial lobes during the last glaciation [67,68]. The area is characterized by hummocky terrain with local elevation changes of up to 40 m within the immediate topographic drainage area within <1.5 km of the well field [69]. Aquifers and aquitards are inter-bedded in the subsurface, though some aquitards have been interpreted to be discontinuous, allowing connections between upper and lower aquifer units [70,71]. This complex intermingling of aquifer and aquitard units is typical of the glacial moraine deposits throughout southern Ontario and elsewhere. Topographically driven overland flow derived from melting snow has been observed on many occasions during winter and spring seasons, and this can result in the formation of a temporary or ephemeral surface water feature that flows toward the Thornton supply wells (Figure 2). Rapid water level responses and temperature changes in observation wells located near the ephemeral surface water are evidence of infiltration associated with this temporary runoff event [62,70,71]. Hydraulic interconnections between upper and lower aquifer units may facilitate an active flow path between the surface infiltration area and the water supply aquifer [70,71].

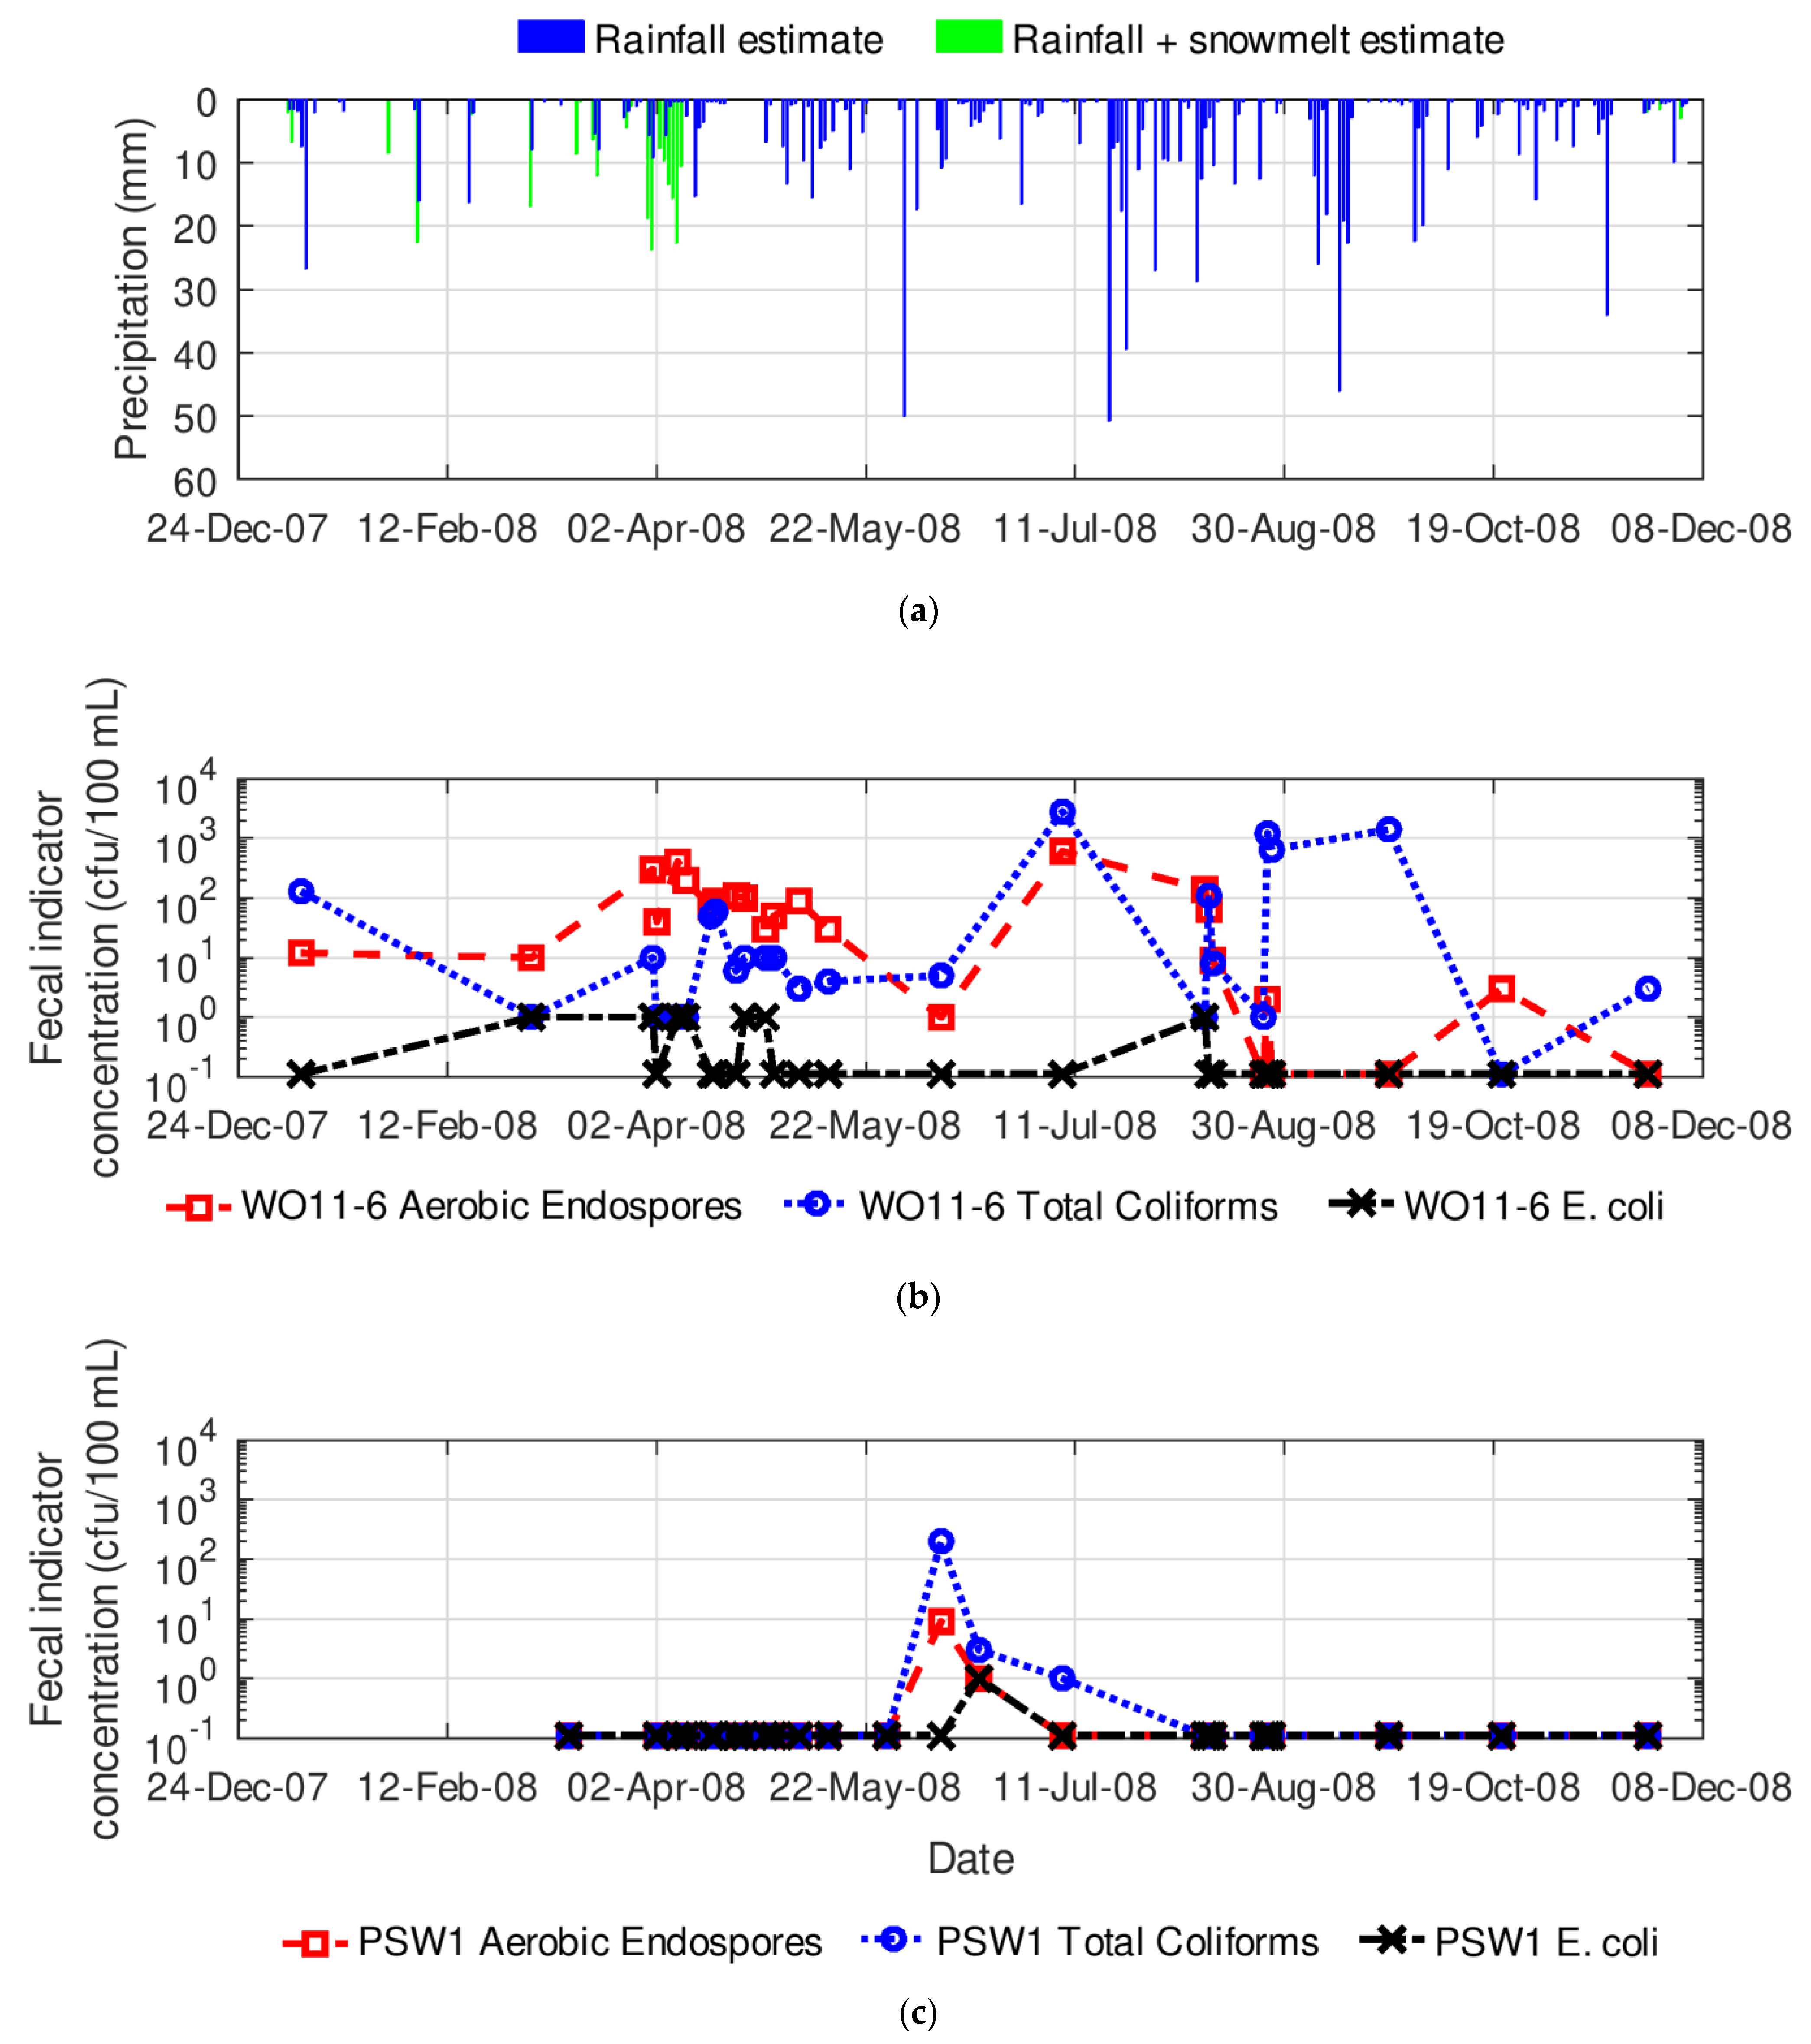
3.1.2. Microbial Indicator Assessment

Christie et al. [2] observed the formation of ephemeral flow features during the spring melt of 2008 and collected water samples during the event. Samples were collected from the ephemeral stream, from a network of 18 groundwater observation wells (Figure 2) mostly located along the course of the temporary stream, and from the raw water from two public supply wells (PSW1 and PSW8; Figure 2). The water samples were analyzed for several inorganic solutes including nitrate and chloride, and also for the presence of fecal pathogen indicator species, including aerobic endospores, total coliforms, and E. coli. The microbial sampling procedures of [75] were followed, and background samples were also collected throughout the year. Membrane filtration and microbial analysis was performed by the INRS lab in Laval, QC. Microbial indicator species data were compared to precipitation data (Supplementary Materials document S2) from the site.

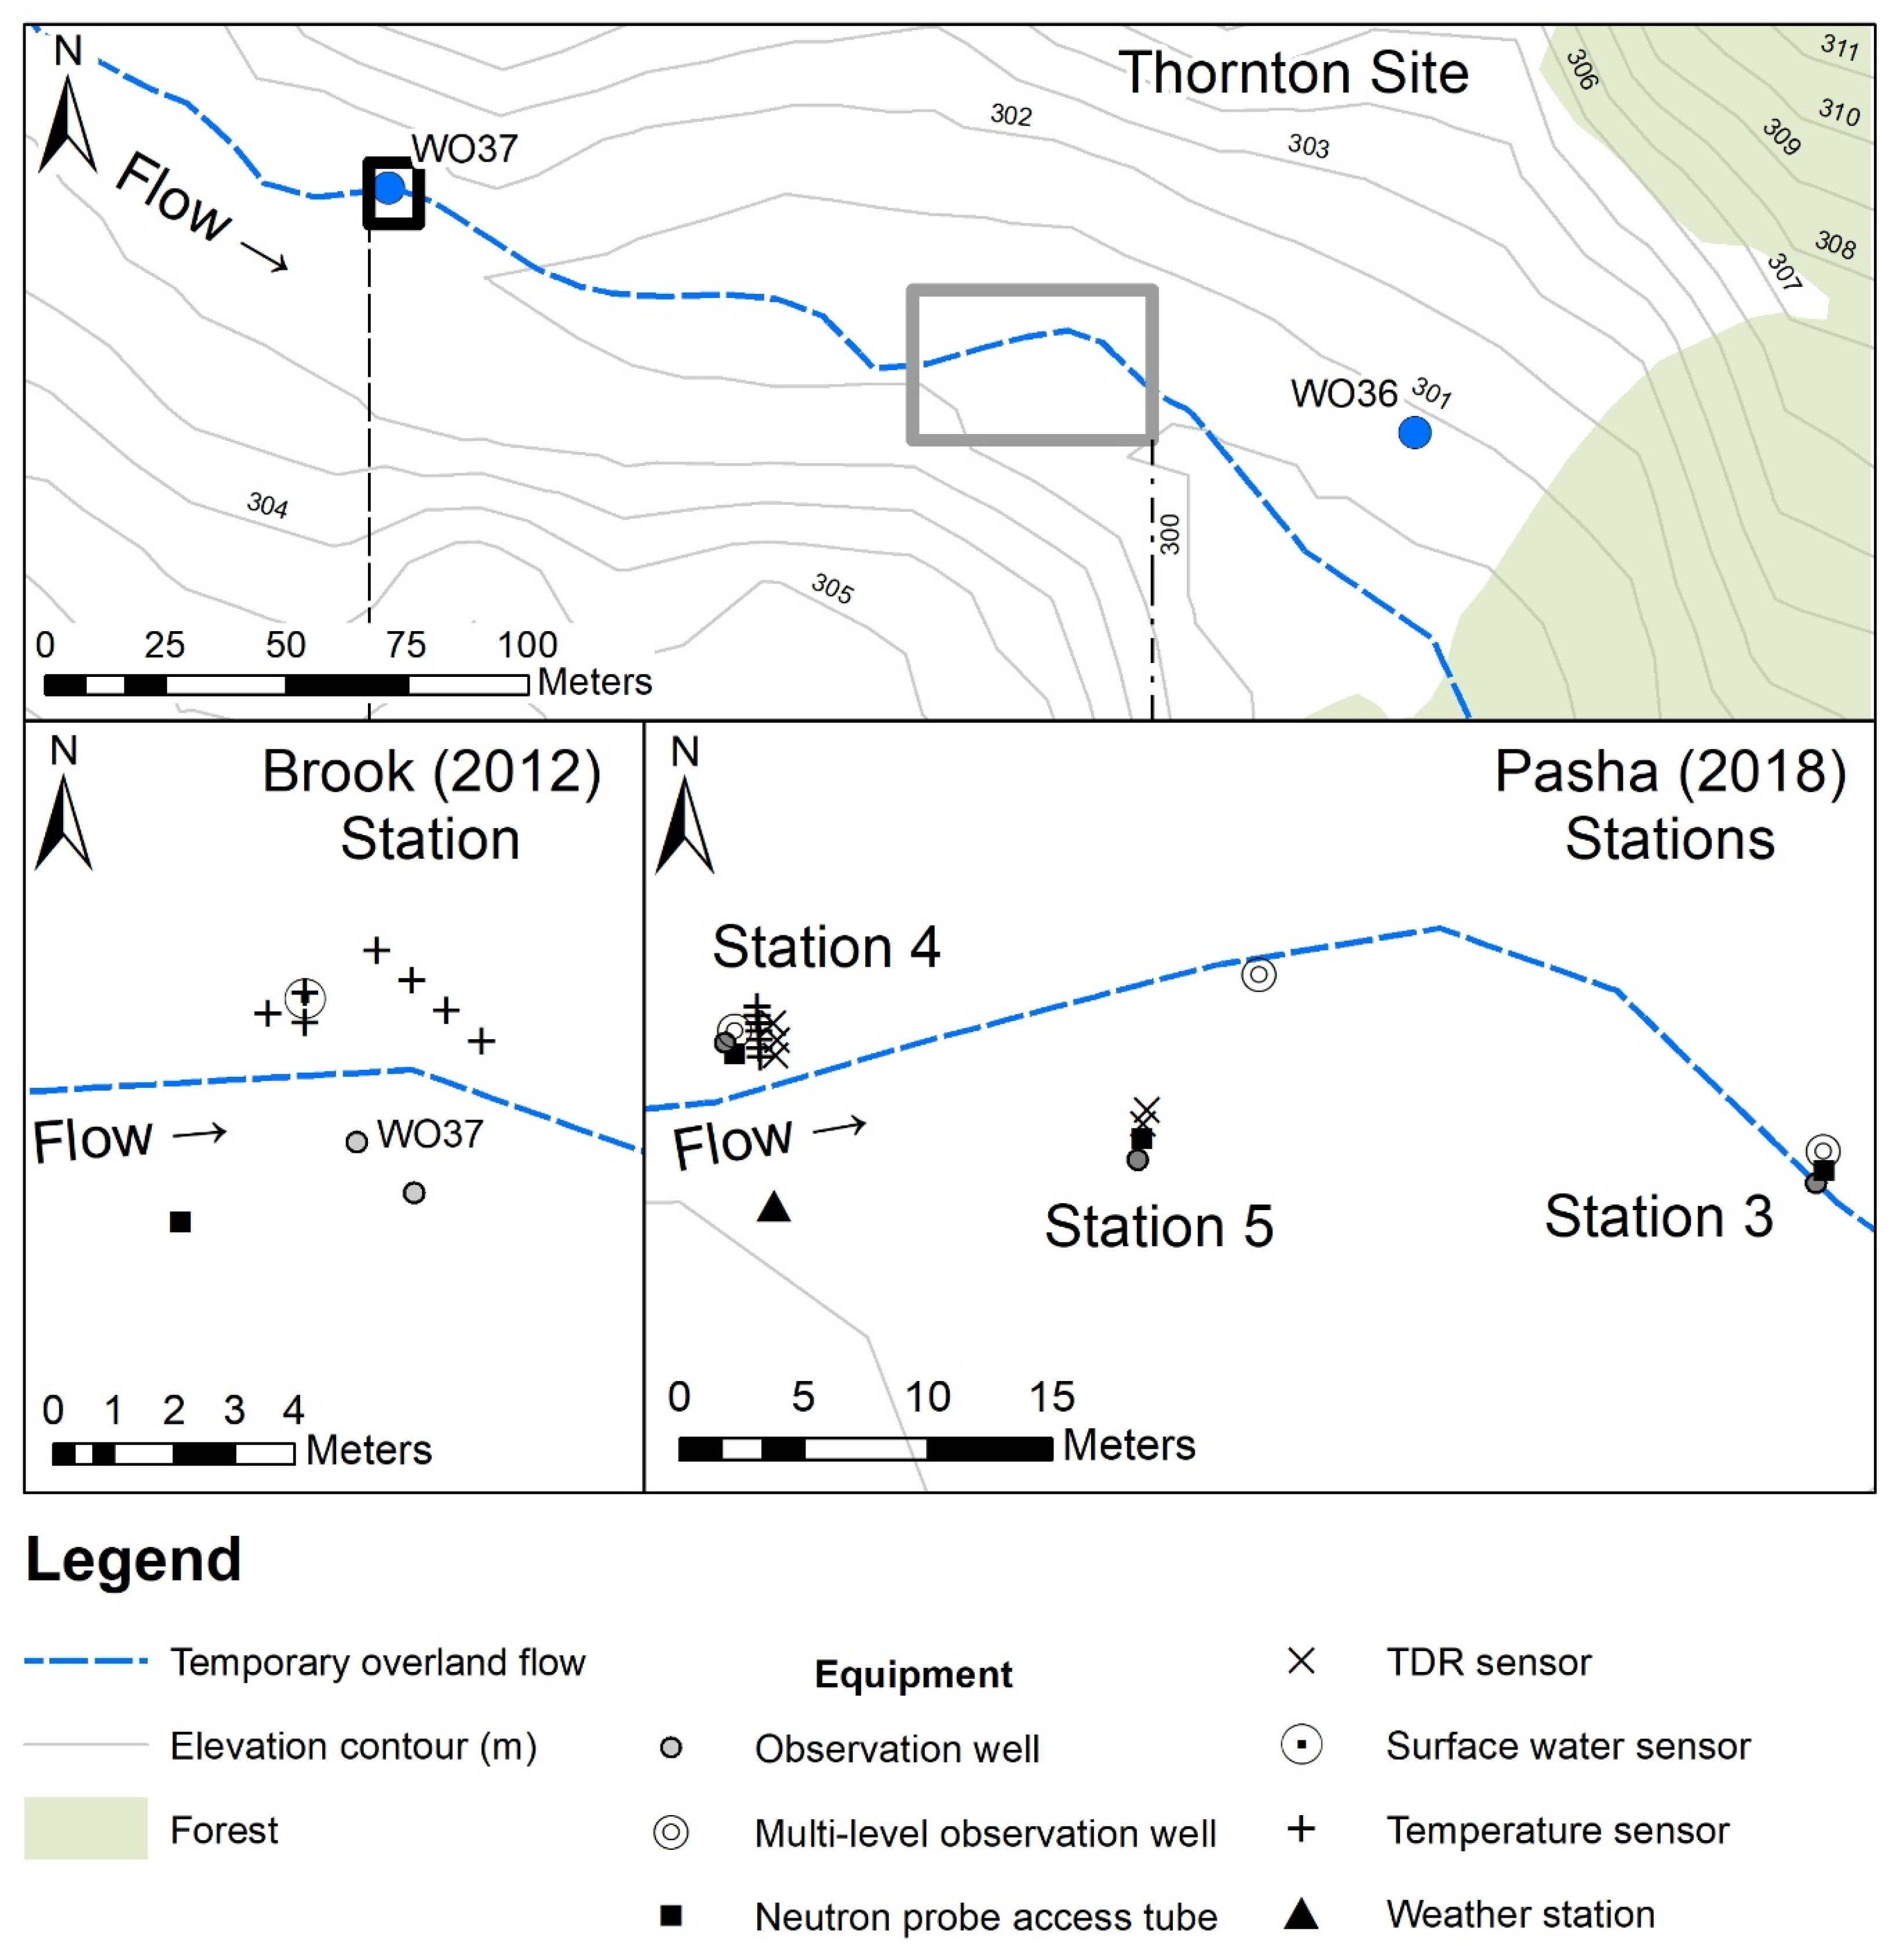
3.1.3. Field Instrumentation and Monitoring

Weather data such as air temperature and precipitation were collected at the Thornton site during the research by Christie et al. [2], Brook [62], and Pasha [63]. Precipitation data were recorded every 15 min during 2008 by a tipping bucket rain gauge, where a snow adapter was installed in winter and reported snowfall as the equivalent in liquid water height [71]. Supplementary Materials document S2 lists daily air temperature and precipitation data for 2008.
In order to investigate and quantify the infiltration processes associated with the ephemeral flow events, Brook [62] and Pasha [63] each studied recharge phenomena following snowmelt-induced overland flow events occurring in 2010 and 2015, respectively, at locations several hundred meters upgradient of Thornton wells PSW1 and PSW5. The Brook [62] field site was situated adjacent to observation well WO37, where the surficial soils consisted primarily of silt loam, and the Pasha [63] monitoring location was situated about 150 m further downstream, where the soils are characterized by more permeable sands and silty sands (Figure 2 and Figure 3). At each site, measurements were made of ephemeral surface water depth, soil water in the vadose zone, soil temperature at multiple depths between the ground surface and the average water table elevation, and groundwater levels and temperature.
Figure 4 shows examples of the Brook [62] and Pasha [63] equipment installations. Brook [62] installed temperature sensors mounted on PVC pipes in the vadose zone at seven depths between 0 and 1.6 m, in the shallow sediments above the average water table elevation and in a location anticipated to be inundated during the ephemeral runoff events (Figure 4a). These sensors (CS107B, Campbell Scientific Inc., Logan, UT, USA) were installed at angles of 20° to 30° from the vertical, either with a hand auger (shallower sensors) or a solid stem auger on a Geoprobe 7720DT drill rig, and the borehole annulus space was backfilled with a cement and bentonite slurry to minimize the risk of vertical preferential infiltration along the casings. Brook [62] assessed water levels in observation well WO37 (Figure 3; screened from 3.35 m to 4.88 m below ground surface). Pasha [63] installed vertical strings of temperature sensors (TidBit V2, Onset Corporation) mounted to PVC casings, and concurrently installed angled temperature sensors similar to those employed by Brook [62] (Figure 4b). Groundwater level variations were monitored manually and via pressure transducers in conventional (5.1 cm diameter, 30 cm screen length; bottom depth at each station between 1.5 m and 1.75 m below ground surface) and multilevel observation wells (1 cm diameter, 10 cm screen length; seven screens ranging between 1 m and 4.5 m below ground surface) to assess water table responses to localized infiltration beneath the overland flow channel. Surface water levels in the overland flow channel were monitored with a pressure transducer. Soil water measurements were made with a neutron probe (503 DR Hydroprobe, CPN International Inc.), with data being collected periodically and during infiltration events to monitor transient soil water variations. Soil coring and geologic logging provided additional information for defining the shallow subsurface conditions. The combined data sets were used to inform numerical modelling of the transient infiltration processes.

3.1.4. Calculations and Numerical Modelling

Snowmelt was calculated to assist interpretation of the Christie et al. [2] microbial indicator species data. Total rainfall and snowfall were estimated for each day of 2008 based on total liquid precipitation measurements at the weather station on site, where snowfall was assumed to occur for air temperatures < 0 °C, and rainfall otherwise. Snowmelt was estimated via a degree-day method [76] based on the site data (Supplementary Materials document S2) after calibrating the degree-day factor (0.245 cm °C−1 day−1) to daily changes in snow depth from the Woodstock Environment Canada weather station (6 km from the Thornton site) over 5 years. This involved minimizing the sum of squared errors between a cumulative snowmelt estimate based on changes in observed snow depth at the Woodstock weather station [77] and cumulative snowmelt based on the daily degree-day method estimates. Actual daily snowmelt estimates were constrained by the estimated snow water equivalent of the evolving snowpack. The snow water equivalent of the snow on the ground [77] was assumed to be 1 mm of liquid water for every 1 cm of snow depth. Missing air temperature and snowpack thickness values were linearly interpolated between the values preceding and following the gap.
Both [62] and [63] used transient soil water, surface and groundwater levels, and subsurface temperature data to set initial and boundary conditions and calibrate one-dimensional (1D) numerical models to estimate recharge flux. The modelling software employed, HYDRUS-1D [78,79], is a finite element model that uses the variably saturated Richards equation to represent water flux and the Chung and Horton [80] heat transfer equation for heat flux in the subsurface; water flux and heat flux are solved sequentially. The van Genuchten [81] equations were used to relate soil water content and hydraulic conductivity of the partially saturated sediments based on values derived from the Rosetta database, which is part of the HYDRUS modelling platform. Initial hydraulic conductivity values for soil layers were estimated from core sediment characteristics, grain size analyses, and literature values. Thermal conductivity and heat capacity were estimated through the HYDRUS-1D model based on sediment characteristics determined from the core logging data [62].
Observed surface water and groundwater levels were used as specified head boundaries at the top and bottom of the model domain, respectively, and temperature and soil moisture content values measured throughout the vertical soil profile were used as initial conditions. The model was calibrated to transient soil temperatures and moisture contents measured during infiltration events and was used to estimate cumulative infiltration (potential recharge) occurring beneath the temporary stream channel. The main hydraulic parameters utilized in the simulations are listed in Table S1.2 in Supplementary Materials document S1. Brook [62] and Pasha [63] provide further details on the 1D numerical modelling process.

3.1.5. Results

Christie et al. [2] assessed the annual variability in concentrations of the three fecal indicators (Figure 5) within several groundwater observation wells and two of the public supply wells at the Thornton well field site. Figure 5 shows rainfall and snowmelt estimates, and fecal indicator concentrations at one observation well (WO11, in the northwest of Figure 2) and one public supply well (PSW1, the northernmost supply well on Figure 2). WO11 is screened from 5.3 to 6.1 m below ground surface, and PSW1 is screened from 24.8 to 29.4 m below ground surface [70]. Concentrations below 1.0 cfu/100 mL on the graph indicate “not detected.” Increases in total coliforms and aerobic endospores were found to occur in two public supply wells in June 2008 (PSW1 and PSW8) and in August 2008 (PSW8), following snowmelt events and associated ephemeral overland flow occurrences between January and April 2008. One heavy rainfall event of 50 mm also preceded the peak detections of aerobic endospores and total coliforms at PSW1 by 19 days. Christie et al. [2] concluded that indicator species were consistently present in the regional aquifer at low concentrations throughout the year and that the highest concentrations were temporally correlated with dynamic hydrological events, and spatially correlated with the meltwater channel. The observed elevated presence of the microbial indicator species in the public supply wells, occurring within five months after the infiltration events, suggested the possibility that the infiltrating ephemeral water could be the source of the temporary indicator species detections in the raw water from the supply wells.
Figure 6 shows photos taken during the 2008 snowmelt. Ephemeral flow in March 2008 was observed to convey runoff within 50 m of the public supply well 1 (PSW1) well house during the peak of the runoff event (Figure 6b; the well house is in the background on the right side).
Figure 7 shows typical groundwater level and temperature responses at the Thornton site during snowmelt events (Brook [62] station; Figure 3 and Figure 4a). Brook [62] observed the surface water flow between 3 March and 10 March 2010, and then briefly again on 14 March 2010. Periods of rapid decline in groundwater temperature and simultaneous rise in the water table observed during the snowmelt period in 2010 beneath the ephemeral stream at the Brook station are indicated by the arrows on Figure 7. The influence of the rapidly infiltrating cold ephemeral surface water is evident in the data.
Calculated estimates (HYDRUS-1D) of cumulative infiltration based on the field data collected during this event are shown in Figure 8. A rapid period of infiltration is estimated during the two periods when the ephemeral water was present at ground surface. Over the two-week simulation period, Brook [62] estimated a potential recharge of 153 mm (Table S1.2 in Supplementary Materials document S1). The average annual recharge in this area is estimated to be approximately 300 mm/year [71], so this transient recharge event could account for up to 50% of the annual amount.
Pasha [63] monitored ephemeral overland flow during the 2015 snowmelt period (Figure 4b) at three independent locations at the Thornton site (Stations 3, 4 and 5; Figure 3). During the month of March 2015, surface and subsurface hydrologic data were collected at each of the three stations. As air temperatures rose above 0 °C (around 11 March 2015), groundwater levels began to rise rapidly at each site [63]. Simultaneously, soil temperatures began to rapidly change throughout the entire monitored profile in response to infiltration of cold ephemeral surface water [63]. Again, utilizing a HYDRUS-1D model informed by the field measured data and estimates of the local hydraulic parameters as explained earlier, Pasha [63] estimated cumulative infiltration to range from 46 mm (station 3) to 422 mm (station 5) to 709 mm (station 4) over about two weeks in March 2015 (Figure 8 and Table S1.2 in Supplementary Materials document S1). The results of Pasha [63] show spatial variability in recharge rates beneath and near the snowmelt runoff channel, likely influenced by local differences in near-surface soil conditions and exact installation locations of the groundwater observation wells. However, in this region of more permeable surficial soils, event-based recharge related to the annual snowmelt event may exceed the regional average annual recharge rate within a two-week period.

3.2. Case Study 2: Mannheim West Well Field, Kitchener, ON

3.2.1. Field Site

The Mannheim West well field is located southwest of Kitchener, ON, Canada (Figure 9), within the Waterloo Moraine, a depositional feature characterized by interlayered sand and gravel aquifers and till aquitards [82]. The public supply wells are screened in the glacial overburden, primarily within a locally unconfined sand and gravel aquifer sequence. Closed topographic depressions are known to exist in the hummocky terrain of the moraine, and these have been suspected to be locations of significant local recharge [83]. The public supply wells in this well field are surrounded by agricultural land and expanding urban development. Two of the wells within this well field presented potential GUDI concerns [25] due to their proximity to the adjacent watercourse, Alder Creek. The site of one of these wells contains a topographic depression (>10,000 m2), where overland flow ponds in the base of the depression within 50 m of the public supply well (PSW22) during heavy rainfall events. Menkveld [64] and Wiebe [29] studied a range of DFR phenomena at this site (the “Mannheim” site; Figure 9).

3.2.2. Field Instrumentation and Monitoring

A field monitoring strategy similar to that employed by [62,63] was implemented within the base of a topographic depression and in the creek reach near the well (Figure 9). A meteorological station installed on site provided air temperature and rainfall data, and one season of snowfall data [65]. Observation wells and streambed piezometers were installed for groundwater level and temperature monitoring. A vertical cluster of observation wells (Figure S1.1 in Supplementary Materials document S1) was installed beneath the base of the topographic depression to monitor changes in groundwater levels during recharge events when ponding occurred (Figure 10). A 60 cm layer of bentonite chips was added in the borehole annulus space above each well screen, and native soil was then added and tamped in 15 cm sections up to the surface to ensure hydraulic isolation of the screens [64]. Continuous soil coring was conducted with a GeoProbe 7720DT drilling rig when the wells were installed, which provided information to support the development of a conceptual model of the subsurface stratigraphy. Groundwater level measurements were made within the observation well network at 15 min or 30 min intervals using pressure transducers (Levelogger, Solinst Canada Ltd., Georgetown, ON, Canada; and AquiStar PT12, INW Inc., Kirkland, WA, USA). Surface water levels within the depression feature and the creek were also continuously monitored with pressure transducers and used to detect event responses in the surface water system that could indicate the onset of a possible recharge event. Soil water content was monitored via neutron probe (503 Elite Hydroprobe, CPN International Inc., Concord, CA, USA) and time domain reflectometry (TDR; CS616, Campbell Scientific Inc., Logan, ON, Canada). Soil temperatures were measured with sensors installed at different depths in the vadose zone (CS109, Campbell Scientific Inc.; and TidBit V2, Onset Corporation, Bourne, MA, USA). Surface water sampling for total coliforms and E. coli was conducted occasionally as a rough screening approach [64], though procedures were not as rigorous as those recommended by Myers et al. [75] and used by Christie et al. [2]. Again, the combined data sets and field observations were utilized to support quantitative modelling of the transient infiltration and groundwater flow dynamics in response to the events.

3.2.3. Calculations and Numerical Modelling

Estimates of DFR at the Mannheim field site under ponded conditions were conducted with two quantitative approaches, and potential contaminant breakthrough at PSW22 was also simulated. The first recharge method involved an application of the conventional water table fluctuation (WTF) method where transient monitoring of the rise in the water table is used along with estimates of the specific yield of the subsurface sediments to estimate the water flux across the water table [86]. The groundwater hydrographs for observation wells located beneath the flooded base of the depression, along with an estimate of specific yield (0.1) based on soil moisture observations at the site, were used for these calculations. During the November 2014 infiltration event, water level data indicated that the entire vertical soil profile reached full saturation partway through the infiltration event. In that case, the WTF method was used to estimate recharge during the rising limb of the groundwater hydrograph, and then Darcy’s Law was used to approximate recharge flux under conditions of saturation [64]. This analytical approach generally represents a rough approximation of recharge and does not account for radial flow away from the groundwater mound or drainage of event water after the peak of the groundwater hydrograph. For these reasons, these analytical estimates likely underestimate total event recharge.
In the second method, HYDRUS-1D [87] was used to estimate recharge at the Mannheim site in a manner similar to that noted above for the Thornton site (Supplementary Materials document S1). Parameters for the van Genuchten [81] water retention curves were obtained from the literature (UNSODA database [88]), and hydraulic conductivity values were calibrated for six soil layers beneath the base of the topographic depression (Supplementary Materials document S1). Calibration of hydraulic conductivity values for the six layers was conducted for a small event (March 2017). Cumulative infiltration during one large late fall event (November 2014) was simulated as an estimate of potential recharge beneath the topographic depression. The modelling parameters are summarized in Table S1.2 in Supplementary Materials document S1, which provides further details on the modelling process.
Based on ideas from [23], Wiebe [29] used the results of field monitoring at the Mannheim site to model breakthrough curves for conservative yet dispersing tracers as an analog for the fate and transport of surface-sourced contaminants in order to assess risk to a public supply well due to large hydrological events. The metric of a 50-day time of travel was used to interpret the results. The possible effects of transient ponding and resulting DFR on breakthrough at the well were assessed with the HydroGeoSphere (HGS) model [89,90]. HGS is a fully integrated hydrologic and solute transport model that accommodates variably saturated subsurface conditions and transient surface water and groundwater flow dynamics. The model was used in finite difference mode, solving Richards’ Equation (3D) for vadose zone and saturated groundwater flow. The van Genuchten [81] equations were used to generate soil moisture retention curves based on observed soil types (core logs) and parameters from the literature [88]. Initial values of hydraulic conductivity and the storage coefficients were derived from field and laboratory observations and relevant literature values. Initial and boundary conditions were prescribed based on field-measured hydraulic head values and ponding depths [29].
Three finite-element domains (Figure S1.11 in Supplementary Materials document S1) were constructed for parameter calibration and transient solute transport simulations. Calibration (via PEST—[91]) of the near surface soil layers was performed using a nearly rectangular 3D finite-element model domain that encompassed the base of the depression and surrounding areas, where transient infiltration during the March 2017 event was simulated. Calibration of the near-surface soils in the HYDRUS-1D and HGS models was performed separately because of the differences in spatial scale and model dimensionality. A wedge-shaped grid extending outward (maximum radius: 2400 m) from PSW22 was utilized for calibration (via PEST) of the main aquifer’s hydraulic conductivity values during simulation of an extended pumping test. A shorter version (maximum radius: 183.6 m) of the wedge-shaped flow model with smaller elements was used to run solute transport simulations that introduced a conservative numerical tracer into ponded water in the base of the topographic depression. This finer mesh was necessary to meet the Peclet criterion [92]. Simulations were conducted for a November 2014 (simulation 1) event that had been monitored in the field, and also for an alternative version of the November 2014 event in which no ponding was specified (simulation 1-NP) in the base of the topographic depression. Comparison of simulation 1 and simulation 1-NP tested the sensitivity of the breakthrough curve at PSW22 to ponding induced by the event. Longitudinal dispersivity (αL) values were based on the literature [93] for the vadose zone and assigned as 10% of lateral transport scale for the main sand and gravel aquifer. See [29] for more information on the modelling process. Alder Creek, located between the base of the topographic depression and the well (Figure 9), was represented in the wedge model as a linear feature with a V-shaped cross-section that cut across the domain at a distance of 26 m from the well. The observed transient water levels were used as a specified head boundary condition at the two nodes representing the creek thalweg.
Building on the approach of [29], a degree-day snowmelt method [76] was used to estimate the daily snowmelt based on temperature records at the Roseville Environment Canada weather station [94] and calibrated to cumulative snowmelt estimated based on observed daily Roseville snowpack thicknesses [94] between November 2013 and April 2018. Missing temperature values were filled in using data from the University of Waterloo weather station [95]. The degree-day factor (which must be empirically determined for each watershed—[96,97]) was determined to be 0.725 cm °C−1 day−1, similar to the average factor calculated by [96] for a site in Manitoba. Supplementary Materials document S1 describes the revised snowmelt calculations in more detail. A combined time series of snowmelt and on-site rainfall was specified as a flux to the top surface of the HGS model domain.

3.2.4. Results

Menkveld [64] collected surface water samples in the base of the topographic depression at the Mannheim site during the March 2015 snowmelt event. These were analyzed for pathogen indicator species, and concentrations of total coliforms and E. coli were 17,000 cfu/100 mL and 300 cfu/100 mL, respectively. The concentration of total coliforms was of the same order of magnitude as the results of [2] for the Thornton site, while the concentration of E. coli was one order of magnitude higher.
Transient infiltration phenomena were monitored at the Mannheim site in November 2014, March and April 2015, and in March 2017, when surface water ponding occurred within the shallow depression near the public supply well at this location. A photograph of the ponded water within the depression feature during the November 2014 event is shown in Figure 10. For illustrative purposes, groundwater level and temperature data measured beneath the depression area during the November 2014 event is shown in Figure 11, where CPP2 to CPP5 are clustered observation wells (Figure S1.1, Supplementary Materials document S1). A relatively rapid rise in the water table was observed beneath the base of the depression following the transient inundation, and temperatures at the uppermost wells responded with a shift toward the surface water temperature, suggesting the occurrence of DFR.
At the Mannheim site, two independent methods were employed to estimate cumulative recharge beneath the depression area during the ponding events listed above. The first involved a modified version of the water table fluctuation method (WTF), described earlier. Wiebe et al. [66] estimated cumulative DFR at the site to be 260 mm (WTF method plus additional Darcy Flux estimate) during the November 2014 event and 200 mm (WTF method) during a spring melt event in March–April 2015, based on the work of [64]. Cumulative infiltration based on HYDRUS-1D modelling was estimated to be up to 392 mm (Figure 12; Table S1.2 in Supplementary Materials document S1) during the November 2014 event. The difference between the cumulative infiltration estimates based on HYDRUS-1D (392 mm) and the analytical WTF estimate (260 mm) for the November 2014 event illustrates the challenges of estimating recharge during complex, transient, 3D flow systems. Lateral flow away from the depression area may have resulted in an underestimation of the cumulative recharge by the WTF approach. However, the quantitative estimates indicate that event-based DFR may result in very high spatially and temporally localized recharge rates, on the order of the total regional average annual recharge rate (321 mm; [98,99]).
Figure 13 illustrates the concept of how localized recharge associated with transient surface water features such as those shown above (Figure 4, Figure 6 and Figure 10) could temporarily lead to an increased threat to water quality at a public supply well. Simulated breakthrough curves at PSW22 for the November 2014 event at the Mannheim site are shown in Figure 13a, and cumulative effective precipitation (i.e., cumulative daily net infiltration flux applied to the top of the model domain × 1 day) and creek water levels are shown in Figure 13b. The difference between simulation 1 and the lack of ponding in simulation 1-NP shows that the presence of surface water ponding in the base of the topographic depression was associated with larger relative concentrations at PSW22. Both simulations show tracer breakthrough at larger relative concentrations (e.g., C/C0 > 1.0 × 10⁻⁵) occurring after a 50-day time of travel, but the phenomenon of ponding appears to shorten the travel time to any particular relative concentration drastically (e.g., arrival 50 days earlier for C/C0 = 1.0 × 10⁻⁵). Water levels in the creek between the base of the topographic depression and the well (Figure 9) were also found to be an important factor. Creek water levels rising above the banks around a simulation time of 110 days, concurrent with an increase in applied precipitation, seem to be associated with a sharp increase in relative breakthrough around 120 days, after some delay (Figure 13). The relative concentrations of the simulation 1-NP scenario also increased to a lesser extent after this time. Dynamic recharge events following those originally associated with microbial transport into the subsurface may enhance transport to a well indirectly.

4. Discussion

The work of Christie et al. [2] suggested the possibility that microbial fecal indicator species such as aerobic endospores, total coliforms, and E. coli were commonly present in shallow observation wells in the agricultural setting of the Thornton well field. Fecal indicator species were also found occasionally in two of the public supply wells at the site during 2008. Short snowmelt runoff events on the order of days to weeks were observed by Brook [62] and Pasha [63] and showed evidence of high recharge rates beneath a temporary surface water feature at the Thornton site. At another site in southern Ontario, Menkveld [64] and Wiebe [29] observed overland flow, ponding, and evidence of DFR within 50 m of a public supply well of the Mannheim West well field. The potential implications of these studies for understanding well vulnerability to transient recharge resulting from heavy rainfall and/or snowmelt events is discussed in the following.
The results of Christie et al. [2] raise the questions of when, how, and where the fecal indicators observed at the public supply wells entered the subsurface. Mid-winter snowmelt events, the ultimate winter snowmelt event, or any heavy rainfall events prior to their detection in the wells (Figure 5) are possible candidates. Snowmelt rather than rainfall may be the more likely source because the ephemeral overland flow has been observed during multiple snowmelt events, when soil frost at the ground surface initially promotes overland flow before thaw occurs. Brook [62] and Pasha [63] presented evidence of rapid yet heterogeneous recharge rates beneath the ephemeral snowmelt channel. Quaternary surficial soil mapping suggests that glaciofluvial outwash sands are present along the ephemeral meltwater channel and extend to the east past wells PSW1, PSW5, and PSW3 (Figure 2; [67]). Photos suggest that snowmelt runoff may flow within 10s of meters of PSW1 (Figure 6b).
Figure 13 depicts the idea of a temporary increased threat to a well resulting from a localized recharge event. It also suggests that an extreme event may enhance the transport of a contaminant that is already in the subsurface. Howard [98] commented that this may have been the case during the Walkerton 2000 disease outbreak. The possibility exists that the large (50 mm) rainfall event that occurred just before the peak microbial indicator species concentrations at the Thornton site in June 2008 (Figure 5) indirectly enhanced the concentrations. Just as antecedent conditions such as the degree of soil saturation and water table depth influence loadings to the water table during an event, prior contamination may also be captured by a well following an event.
Public supply well vulnerability assessments in Ontario [35] have tended to focus on steady-state groundwater flow conditions, including for the delineation of capture zones. Field instrumentation and monitoring activity required to assess infiltration dynamics related to temporary overland flow features may not commonly be present in the vicinity of potentially vulnerable public supply wells. Permanent water courses are the more obvious targets for such studies, and temporary overland flow events may not be noticed by assessors. Frequent visits to the field sites described above were necessary in order for researchers to observe the ephemeral flow features at the Thornton and Mannheim sites; further work was required to instrument the specific locations of overland flow or ponding and to monitor extreme event responses.
Given the potential for localized recharge associated with ephemeral overland flow and DFR related to extreme hydrological events to convey microbial contaminants into the saturated zone near public supply wells, groundwater management actions could include the following. First, increased monitoring could be performed. Pressure transducers could be installed at ground surface in low-lying areas near wells to record the possibility of temporary overland flow or ponding, especially when surficial soils are frozen. If locations of event infiltration are found, further assessment of localized recharge could be pursued (e.g., via observation wells with groundwater level and temperature monitoring). Second, understanding the risks related to extreme events requires continuous rainfall and snow depth data near a well field. Analysis of rainfall events and estimates of snowmelt amounts and timing could be used to inform risk estimates for the raw water quality at wells. Drinking water well permits could require monitoring of precipitation and groundwater responses. Third, groundwater managers need well vulnerability modelling strategies that incorporate the transient conditions of extreme precipitation events that may induce short-term, spatially variable recharge rates near wells of concern. It may be possible to employ the method of Frind et al. [23] to estimate temporary risks. Finally, reporting on hydrogeological factors related to disease outbreaks associated with public supply wells may assist in increasing understanding that could be used to prevent future outbreaks [99].

5. Conclusions

In the 21 years since the Walkerton waterborne disease outbreak, progress has been made in terms of regulations and attention to the security of water quality in Ontario public supply wells. However, threats to overburden wells due to extreme hydrological events remain poorly understood and have not routinely been considered within the scope of regulatory assessment. In order to address this knowledge gap, research has been conducted to study temporary overland flow and event-based groundwater recharge within two wellhead protection areas located in hummocky terrain in southwestern Ontario. At the Thornton well field (Woodstock, ON, USA), on-site monitoring found event-induced increases in pathogen indicator species within the surface water and groundwater system during overland flow events associated with snowmelt that channeled water toward public supply wells. Quantitative analysis based on field data estimated elevated recharge rates of between 40 and 710 mm during the spring snowmelt event in the vicinity of the overland flow paths at the site. The fact that recharge estimates were on the order of the annual recharge rate, with overland flow possible within 10s of meters of the public supply wells and fecal indicators sometimes detected in them, is a cause for concern. Researchers at the Mannheim West well field (Kitchener, ON, USA) estimated recharge rates up to approximately 400 mm beneath the base of a topographic depression inundated with overland flow during large hydrologic events, including snowmelt. Again, the possibility for recharge events on the order of the annual average rate to convey fecal indicator species into the subsurface within 10s of meters of a well was suggested. Monitoring rainfall, snow depth, and low topographic locations for temporary overland flow or ponding near public supply wells could be part of a well vulnerability assessment strategy including transient modelling to quantify temporary risks. Understanding event-induced recharge rates may assist the interpretation of whether hydrological events are likely to temporarily increase risks to water quality at public supply wells.

Supplementary Materials

The following are available online at https://www.mdpi.com/article/10.3390/su13147695/s1, Document S1: Numerical models and calculations; Document S2: Thornton weather data for 2008.

Author Contributions

Conceptualization, A.J.W., D.L.R., E.P., J.M.B., M.C., P.G.M.; methodology, A.J.W., D.L.R., E.P., J.M.B., M.C., P.G.M.; software, A.J.W., E.P., J.M.B.; formal analysis, A.J.W., E.P., J.M.B., P.G.M.; investigation, A.J.W., E.P., J.M.B., M.C., P.G.M.; resources, D.L.R.; data curation, A.J.W.; writing—original draft preparation, A.J.W.; writing—review and editing, A.J.W., D.L.R., E.P., J.M.B., M.C., P.G.M.; visualization, A.J.W., J.M.B., E.P.; supervision, D.L.R.; project administration, D.L.R.; funding acquisition, D.L.R. All authors have read and agreed to the published version of the manuscript.

Funding

This research was funded by NSERC, Discovery Grant to D.R.

Institutional Review Board Statement

Not applicable.

Informed Consent Statement

Not applicable.

Data Availability Statement

Data available in a publicly accessible repository: the data presented in this study for the Mannheim site [65] are openly available in FRDR at DOI:10.20383/101.0178.; data are contained within the Supplementary Materials: the data presented in this study are available in Supplementary Materials document S1: Numerical models and calculations, and in Supplementary Materials document S2: Thornton weather data for 2008.

Acknowledgments

We acknowledge the support of the Natural Sciences and Engineering Research Council of Canada (NSERC; Discovery Grant to D.L. Rudolph). Thanks to the County of Oxford, the Region of Waterloo, and Colour Paradise Greenhouses for allowing site access and equipment installation. E. Mesec photographed snowmelt and temporary ponding at the Mannheim site, which led to the work there. The authors would like to thank the students who assisted with this research: N. Long, J. Stevens, I. Mercer, K. Blowes, E. Pai, E. Huang, S. Indris, J. Ju, A. Wicke, M. Sousa, C. Davis, H. Blumenthal, J. Melchin, C. Micheli, A. Rudy, K. Critchley, J. Niemi, S. Frey, G. Pope, S. Sinclair, J. Charlton, X. Xu, C. McCutcheon, J. Kreller, and K. Siefreid. Thanks to technicians P. Johnson and B. Ingleton, who constructed equipment, drilled wells, and collected soil cores. We are grateful to E. Frind, M. Frind, and two anonymous reviewers who reviewed the manuscript and provided insightful comments.

Conflicts of Interest

The authors declare no conflict of interest. The funders had no role in the design of the study; in the collection, analyses, or interpretation of data; in the writing of the manuscript, or in the decision to publish the results.

References

  1. Hrudey, S.; Payment, P.; Huck, P.; Gillham, R.; Hrudey, E. A fatal waterborne disease epidemic in Walkerton, Ontario: Comparison with other waterborne outbreaks in the developed world. Water Sci. Technol. 2003, 47, 7–14. [Google Scholar] [CrossRef]
  2. Christie, M.; Rudolph, D.; Payment, P.; Locas, A.L. Monitoring the Occurrence of Microbial Contaminants within the Wellhead Protection Area of a Municipal Well Field in an Agricultural Setting. In Proceedings of the Microbial Transport and Survival in the Subsurface: First International Conference, Niagara-on-the-Lake, ON, Canada, 10–13 May 2009. [Google Scholar]
  3. Nieder, R.; Benbi, D.K.; Reichl, F.X. Soil as a Transmitter of Human Pathogens. In Soil Components and Human Health; Springer Science and Business Media LLC: Dordrecht, The Netherlands, 2018. [Google Scholar]
  4. Tyrrel, S.; Quinton, J. Overland flow transport of pathogens from agricultural land receiving faecal wastes. J. Appl. Microbiol. 2003, 94, 87–93. [Google Scholar] [CrossRef] [PubMed]
  5. Cho, K.H.; Pachepsky, Y.; Kim, J.H.; Guber, A.; Shelton, D.; Rowland, R. Release of Escherichia coli from the bottom sediment in a first-order creek: Experiment and reach-specific modeling. J. Hydrol. 2010, 391, 322–332. [Google Scholar] [CrossRef]
  6. Droppo, I.; Krishnappan, B.; Liss, S.; Marvin, C.; Biberhofer, J. Modelling sediment-microbial dynamics in the South Nation River, Ontario, Canada: Towards the prediction of aquatic and human health risk. Water Res. 2011, 45, 3797–3809. [Google Scholar] [CrossRef] [PubMed]
  7. Drummond, J.; Davies-Colley, R.; Stott, R.; Sukias, J.; Nagels, J.; Sharp, A.; Packman, A. Retention and remobilization dynamics of fine particles and microorganisms in pastoral streams. Water Res. 2014, 66, 459–472. [Google Scholar] [CrossRef]
  8. Ferguson, C.; de Roda Husman, A.M.; Altavilla, N.; Deere, D.; Ashbolt, N. Fate and Transport of Surface Water Pathogens in Watersheds. Crit. Rev. Environ. Sci. Technol. 2003, 33, 299–361. [Google Scholar] [CrossRef]
  9. Atherholt, T.B.; Bousenberry, R.T.; Carter, G.P.; Korn, L.R.; Louis, J.B.; Serfes, M.E.; Waller, D.A. Coliform Bacteria in New Jersey Domestic Wells: Influence of Geology, Laboratory, and Method. Ground Water 2012, 51, 562–574. [Google Scholar] [CrossRef]
  10. Embrey, S.S.; Runkle, D.L. Microbial Quality of the Nation’s Ground-Water Resources, 1993–2004; US Department of the Interior, US Geological Survey: Reston, VA, USA, 2006. Available online: https://pubs.usgs.gov/sir/2006/5290/ (accessed on 13 May 2020).
  11. Worthington, S.R.; Davies, G.J.; Alexander, E.C. Enhancement of bedrock permeability by weathering. Earth Sci. Rev. 2016, 160, 188–202. [Google Scholar] [CrossRef]
  12. O’Connor, D.R. Report of the Walkerton Inquiry. Part 1. The Events of May 2000 and Related Issues; The Walkerton Inquiry: Toronto, ON, Canada, 2002. Available online: http://www.archives.gov.on.ca/en/e_records/walkerton/index.html (accessed on 17 January 2018).
  13. O’Connor, D.R. Report of the Walkerton Inquiry. Part 2. A Strategy for Safe Drinking Water; The Walkerton Inquiry: Toronto, ON, Canada, 2002. Available online: http://www.archives.gov.on.ca/en/e_records/walkerton/index.html (accessed on 23 April 2021).
  14. Government of New Zealand. Report of the Havelock North Drinking Water Inquiry: Stage 1.; Government of New Zealand: Auckland, New Zealand, 2017. Available online: https://www.dia.govt.nz/Stage-1-of-the-Water-Inquiry (accessed on 11 January 2021).
  15. Gilpin, B.J.; Walker, T.; Paine, S.; Sherwood, J.; Mackereth, G.; Wood, T.; Hambling, T.; Hewison, C.; Brounts, A.; Wilson, M.; et al. A large scale waterborne Campylobacteriosis outbreak, Havelock North, New Zealand. J. Infect. 2020, 81, 390–395. [Google Scholar] [CrossRef]
  16. Donat, M.G.; Lowry, A.L.; Alexander, L.V.; O’Gorman, P.A.; Maher, N. More extreme precipitation in the world’s dry and wet regions. Nat. Clim. Chang. 2016, 6, 508–513. [Google Scholar] [CrossRef]
  17. IPCC. Summary for policymakers. In Climate Change 2013: The Physical Science Basis. Contribution of Working Group I to the Fifth Assessment Report of the Intergovernmental Panel on Climate Change; Cambridge University Press: Cambridge, UK, 2013; Available online: https://www.ipcc.ch (accessed on 14 February 2020).
  18. Perkins-Kirkpatrick, S.; Pitman, A. Extreme events in the context of climate change. Public Health Res. Pr. 2018, 28, e2841825. [Google Scholar] [CrossRef] [Green Version]
  19. Jiang, C.; Shaw, K.S.; Upperman, C.R.; Blythe, D.; Mitchell, C.; Murtugudde, R.; Sapkota, A.R.; Sapkota, A. Climate change, extreme events and increased risk of salmonellosis in Maryland, USA: Evidence for coastal vulnerability. Environ. Int. 2015, 83, 58–62. [Google Scholar] [CrossRef] [Green Version]
  20. Murphy, H.M.; Prioleau, M.D.; Borchardt, M.A.; Hynds, P.D. Review: Epidemiological evidence of groundwater contribution to global enteric disease, 1948–2015. Hydrogeol. J. 2017, 25, 981–1001. [Google Scholar] [CrossRef]
  21. Hrudey, S.E.; Hrudey, E.J. Common themes contributing to recent drinking water disease outbreaks in affluent nations. Water Supply 2019, 19, 1767–1777. [Google Scholar] [CrossRef] [Green Version]
  22. Worthington, S.R.H.; Smart, C.C. Transient bacterial contamination of the dual-porosity aquifer at Walkerton, Ontario, Canada. Hydrogeol. J. 2017, 25, 1003–1016. [Google Scholar] [CrossRef]
  23. Frind, E.; Molson, J.; Rudolph, D. Well Vulnerability: A Quantitative Approach for Source Water Protection. Ground Water 2006, 44, 732–742. [Google Scholar] [CrossRef] [PubMed]
  24. Frind, E.; Muhammad, D.; Molson, J. Delineation of Three-Dimensional Well Capture Zones for Complex Multi-Aquifer Systems. Ground Water 2002, 40, 586–598. [Google Scholar] [CrossRef]
  25. CH2M HILL. Final Report: Hydrogeological Study to Evaluate the GUDI Status of the Mannheim West, Mannheim East, and Peaking Well Fields; Prepared for The Regional Municipality of Waterloo; CH2M HILL: Kitchener, ON, Canada, 2002. [Google Scholar]
  26. Enzenhoefer, R.; Nowak, W.; Helmig, R. Probabilistic exposure risk assessment with advective–dispersive well vulnerability criteria. Adv. Water Resour. 2012, 36, 121–132. [Google Scholar] [CrossRef]
  27. Nalarajan, N.A.; Govindarajan, S.K.; Nambi, I.M. Numerical modeling on flow of groundwater energies in transient well capture zones. Environ. Earth Sci. 2019, 78, 142. [Google Scholar] [CrossRef]
  28. Ontario Ministry of the Environment, Conservation, and Parks (OMECP). Guide for Applying for Drinking Water Works Permit Amendments, License Amendments. Available online: https://www.ontario.ca/page/guide-applying-drinking-water-works-permit-amendments-licence-amendments (accessed on 29 April 2019).
  29. Wiebe, A.J. The Influences of Spatially Variable Rainfall and Localized Infiltration on Groundwater Recharge in a Water Management Context. Ph.D. Dissertation, University of Waterloo, Waterloo, ON, Canada, 2020. Available online: http://hdl.handle.net/10012/16476 (accessed on 27 October 2020).
  30. Espinosa, A.C.; Mazari-Hiriart, M.; Espinosa, R.; Maruri-Avidal, L.; Méndez, E.; Arias, C.F. Infectivity and genome persistence of rotavirus and astrovirus in groundwater and surface water. Water Res. 2008, 42, 2618–2628. [Google Scholar] [CrossRef]
  31. Aller, L.; Bennett, T.; Lehr, J.; Petty, R.; Hackett, G. DRASTIC: A Standardized System for Evaluating Ground Water Pollution Potential Using Hydrogeologic Settings; Office of Research and Development, U.S. Environmental Protection Agency: Ada, OK, USA, 1987. [Google Scholar]
  32. Van Stempvoort, D.; Ewert, L.; Wassenaar, L. AVI: A Method for Groundwater Protection Mapping in the Prairie Provinces of Canada; Prairie Provinces Water Board: Saskatoon, SK, Canada, 1992. [Google Scholar]
  33. Fogg, G.E.; LaBolle, E.M.; Weissmann, G.S. Groundwater Vulnerability Assessment: Hydrogeologic Perspective and Example from Salinas Valley, California. In Assessment of Non-Point Source Pollution in the Vadose Zone; American Geophysical Union (AGU): Washington, DC, USA, 1999; Volume 108, pp. 45–61. ISBN 9780875900919. [Google Scholar]
  34. Province of Ontario. Clean Water Act; S.O. 2006, c 22; Updated 22 Mar 2017. Available online: https://www.ontario.ca/laws/statute/06c22 (accessed on 11 February 2019).
  35. Province of Ontario. 2017 Technical Rules Under the Clean Water Act; updated 28 Jun 2018. Available online: https://www.ontario.ca/page/2017-technical-rules-under-clean-water-act (accessed on 11 February 2019).
  36. Frind, E.O.; Molson, J. Issues and Options in the Delineation of Well Capture Zones under Uncertainty. Ground Water 2018, 56, 366–376. [Google Scholar] [CrossRef]
  37. Rayne, T.W.; Bradbury, K.R.; Zheng, C. Correct Delineation of Capture Zones Using Particle Tracking under Transient Conditions. Ground Water 2014, 52, 332–334. [Google Scholar] [CrossRef]
  38. Cey, E.E.; Rudolph, D.L. Field study of macropore flow processes using tension infiltration of a dye tracer in partially saturated soils. Hydrol. Process. 2009, 23, 1768–1779. [Google Scholar] [CrossRef]
  39. Cey, E.E.; Rudolph, D.L.; Passmore, J. Influence of macroporosity on preferential solute and colloid transport in unsaturated field soils. J. Contam. Hydrol. 2009, 107, 45–57. [Google Scholar] [CrossRef]
  40. Worthington, S.R.; Smart, C.C.; Ruland, W. Effective porosity of a carbonate aquifer with bacterial contamination: Walkerton, Ontario, Canada. J. Hydrol. 2012, 464-465, 517–527. [Google Scholar] [CrossRef]
  41. Bradbury, K.R.; Borchardt, M.A.; Gotkowitz, M.; Spencer, S.K.; Zhu, J.; Hunt, R.J. Source and Transport of Human Enteric Viruses in Deep Municipal Water Supply Wells. Environ. Sci. Technol. 2013, 47, 4096–4103. [Google Scholar] [CrossRef]
  42. Su, S.-H.; Kuo, H.-C.; Hsu, L.-H.; Yang, Y.-T. Temporal and Spatial Characteristics of Typhoon Extreme Rainfall in Taiwan. J. Meteorol. Soc. Jpn. 2012, 90, 721–736. [Google Scholar] [CrossRef] [Green Version]
  43. Auld, H.; Maciver, D.; Klaassen, J. Heavy Rainfall and Waterborne Disease Outbreaks: The Walkerton Example. J. Toxicol. Environ. Health Part A 2004, 67, 1879–1887. [Google Scholar] [CrossRef] [PubMed]
  44. Government of Canada. Historical Data: Rainfall Data for the Environment Canada Weather Station at Walkerton, ON (Climate ID 6129235), 1915–1971. Available online: http://climate.weather.gc.ca/historical_data/search_historic_data_e.html (accessed on 7 May 2020).
  45. Government of Canada. Historical Data: Rainfall Data for the Environment Canada Weather Station at Hanover, ON (Climate ID 6113329), 1972–2008. Available online: http://climate.weather.gc.ca/historical_data/search_historic_data_e.html (accessed on 7 May 2020).
  46. Curriero, F.C.; Patz, J.A.; Rose, J.B.; Lele, S. The Association Between Extreme Precipitation and Waterborne Disease Outbreaks in the United States, 1948–1994. Am. J. Public Health 2001, 91, 1194–1199. [Google Scholar] [CrossRef] [PubMed]
  47. Laidler, M.R.; Tourdjman, M.; Buser, G.L.; Hostetler, T.; Repp, K.K.; Leman, R.; Samadpour, M.; Keene, W.E. Escherichia coli O157:H7 Infections Associated with Consumption of Locally Grown Strawberries Contaminated by Deer. Clin. Infect. Dis. 2013, 57, 1129–1134. [Google Scholar] [CrossRef] [Green Version]
  48. Olsen, S.J.; Miller, G.; Breuer, T.; Kennedy, M.; Higgins, C.; Walford, J.; McKee, G.; Fox, K.; Bibb, W.; Mead, P. A Waterborne Outbreak of Escherichia coli O157:H7 Infections and Hemolytic Uremic Syndrome: Implications for Rural Water Systems. Emerg. Infect. Dis. 2002, 8, 370–375. [Google Scholar] [CrossRef] [Green Version]
  49. Casman, E.; Fischhoff, B.; Small, M.; Dowlatabadi, H.; Rose, J.; Morgan, M.G. Climate Change and Cryptosporidiosis: A Qualitative Analysis. Clim. Chang. 2001, 50, 219–249. [Google Scholar] [CrossRef]
  50. Greenwood, W.J.; Buttle, J.M. Land cover controls on depression-focused recharge on the Oak Ridges Moraine, southern Ontario, Canada. Hydrol. Process. 2018, 32, 1909–1926. [Google Scholar] [CrossRef]
  51. Aulenbach, B.T.; Peters, N.E. Quantifying Climate-Related Interactions in Shallow and Deep Storage and Evapotranspiration in a Forested, Seasonally Water-Limited Watershed in the Southeastern United States. Water Resour. Res. 2018, 54, 3037–3061. [Google Scholar] [CrossRef]
  52. Hayashi, M.; van der Kamp, G.; Rosenberry, D.O. Hydrology of Prairie Wetlands: Understanding the Integrated Surface-Water and Groundwater Processes. Wetlands 2016, 36, 237–254. [Google Scholar] [CrossRef]
  53. Albrecht, B.A.; Benson, C.H. Effect of Desiccation on Compacted Natural Clays. J. Geotech. Geoenviron. Eng. 2001, 127, 67–75. [Google Scholar] [CrossRef]
  54. Grant, K. Preferential Flowpaths and Fertilizer Placement Influence Subsurface P Transport across Soil Textures and Seasonal Conditions. Master’s Thesis, University of Waterloo, Waterloo, ON, Canada, 2018. Available online: http://hdl.handle.net/10012/14248 (accessed on 15 May 2020).
  55. Tang, C.-S.; Cui, Y.-J.; Shi, B.; Tang, A.-M.; An, N. Effect of Wetting-Drying Cycles on Soil Desiccation Cracking Behaviour. In Proceedings of the 3rd European Conference on Unsaturated Soils “E-UNSAT 2016”, Paris, France, 12–14 September 2016. [Google Scholar]
  56. Bradshaw, J.K.; Snyder, B.J.; Oladeinde, A.; Spidle, D.; Berrang, M.E.; Meinersmann, R.J.; Oakley, B.; Sidle, R.C.; Sullivan, K.; Molina, M. Characterizing relationships among fecal indicator bacteria, microbial source tracking markers, and associated waterborne pathogen occurrence in stream water and sediments in a mixed land use watershed. Water Res. 2016, 101, 498–509. [Google Scholar] [CrossRef] [Green Version]
  57. Brookes, J.D.; Hipsey, M.; Burch, M.D.; Regel, R.H.; van der Linden, L.; Ferguson, C.M.; Antenucci, J.P. Relative Value of Surrogate Indicators for Detecting Pathogens in Lakes and Reservoirs. Environ. Sci. Technol. 2005, 39, 8614–8621. [Google Scholar] [CrossRef] [PubMed]
  58. Doyle, M.P.; Erickson, M.C. Closing the Door on the Fecal Coliform Assay. Microbe Mag. 2006, 1, 162–163. [Google Scholar] [CrossRef] [Green Version]
  59. Page, R.M.; Scheidler, S.; Polat, E.; Svoboda, P.; Huggenberger, P. Faecal Indicator Bacteria: Groundwater Dynamics and Transport Following Precipitation and River Water Infiltration. Water Air Soil Pollut. 2012, 223, 2771–2782. [Google Scholar] [CrossRef] [Green Version]
  60. Pronk, M.; Goldscheider, N.; Zopfi, J. Particle-Size Distribution as Indicator for Fecal Bacteria Contamination of Drinking Water from Karst Springs. Environ. Sci. Technol. 2007, 41, 8400–8405. [Google Scholar] [CrossRef] [PubMed] [Green Version]
  61. Semenza, J.C.; Herbst, S.; Rechenburg, A.; Suk, J.E.; Höser, C.; Schreiber, C.; Kistemann, T. Climate Change Impact Assessment of Food- and Waterborne Diseases. Crit. Rev. Environ. Sci. Technol. 2012, 42, 857–890. [Google Scholar] [CrossRef] [Green Version]
  62. Brook, J.M. Evaluating Innovative Nutrient Management Options and Seasonal Groundwater Recharge Dynamics in an Agricultural Source Water Protection Area. Master’s Thesis, University of Waterloo, Waterloo, ON, Canada, 2012. Available online: http://hdl.handle.net/10012/7070 (accessed on 30 July 2014).
  63. Pasha, E. Quantifying Groundwater Recharge during Dynamic Seasonality in Cold Climates. Master’s Thesis, University of Waterloo, Waterloo, ON, Canada, 2018. Available online: http://hdl.handle.net/10012/12883 (accessed on 25 January 2018).
  64. Menkveld, P.G. A Field Study of Event Based, Seasonally Affected, Depression Focused Recharge in Glaciated Terrain. Master’s Thesis, University of Waterloo, Waterloo, ON, Canada, 2019. Available online: http://hdl.handle.net/10012/14568 (accessed on 29 April 2019).
  65. Wiebe, A.J.; Menkveld, P.G.; Hillier, C.E.; Mesec, E.; Rudolph, D.L. Meteorological and Hydrological Data from the Alder Creek Watershed, Grand River Basin, Ontario; New Digital Research Infrastructure Organization: Toronto, ON, Canada, 2019. [Google Scholar] [CrossRef]
  66. Wiebe, A.J.; Menkveld, P.G.; Rudolph, D.L. A Field Study of Seasonal, Depression Focused Recharge Events in Glaciated Terrain; University of Waterloo: Waterloo, ON, Canada, 2021; manuscript in preparation. [Google Scholar]
  67. Bekeris, L. Field-Scale Evaluation of Enhanced Agricultural Management Practices Using a Novel Unsaturated Zone Nitrate Mass Load Approach. Master’s Thesis, University of Waterloo, Waterloo, ON, Canada, 2007. Available online: http://hdl.handle.net/10012/2701 (accessed on 6 August 2014).
  68. Cowan, W.R. Geological Report 119: Quaternary Geology of the Woodstock Area, Southern Ontario; Ontario Div. of Mines: Toronto, ON, Canada, 1975. Available online: http://www.geologyontario.mndm.gov.on.ca/mndmaccess/mndm_dir.asp?type=pub&id=R119 (accessed on 9 March 2021).
  69. Ontario Ministry of Agriculture, Food and Rural Affairs (OMAFRA). Ontario Digital Terrain Model, Lidar DTM Lake Erie 2016-18, Package L: LIDAR Topographic Elevation Data, 0.5 m Vertical Resolution. 2016. Available online: https://geohub.lio.gov.on.ca/ (accessed on 6 May 2020).
  70. Haslauer, C. Hydrogeologic Analysis of a Complex Aquifer System and Impacts of Changes in Agricultural Practices on Nitrate Concentrations in a Municipal Well Field: Woodstock, Ontario. Master’s Thesis, University of Waterloo, Waterloo, ON, Canada, 2005. Available online: http://hdl.handle.net/10012/1223 (accessed on 16 October 2014).
  71. Koch, J. Evaluating Regional Aquifer Vulnerability and BMP Performance in an Agricultural Environment Using a Multi-Scale Data Integration Approach. Master’s Thesis, University of Waterloo, Waterloo, ON, Canada, 2009. Available online: http://hdl.handle.net/10012/4492 (accessed on 6 August 2014).
  72. Light Grey Canvas Base. Available online: http://goto.arcgisonline.com/maps/World_Light_Gray_Base (accessed on 2 November 2020).
  73. World Topographic Map. Available online: http://goto.arcgisonline.com/maps/World_Topo_Map (accessed on 2 November 2020).
  74. Province of Ontario. Ontario Integrated Hydrology Data: Enhanced Watercourse; updated 05 Oct 2015. Available online: https://geohub.lio.gov.on.ca/ (accessed on 2 May 2018).
  75. Myers, D.N.; Stoeckel, D.M.; Bushon, R.N.; Francy, D.S.; Brady, A.M.G. Fecal Indicator Bacteria Version 2.0; U.S. Geological Survey: Reston, VA, USA, 2007; Chapter A7. [Google Scholar] [CrossRef]
  76. Rango, A.; Martinec, J. Revisiting the Degree-Day Method for Snowmelt Computations. JAWRA J. Am. Water Resour. Assoc. 1995, 31, 657–669. [Google Scholar] [CrossRef]
  77. Government of Canada. Historical Data: Snowpack Thickness and Mean Air Temperature Data for the Environment Canada Weather Station at Woodstock, ON (Climate ID 6149625), 2002–2006. Available online: http://climate.weather.gc.ca/historical_data/search_historic_data_e.html (accessed on 21 April 2021).
  78. Šimůnek, J.; Šejna, M.; Saito, H.; Sakai, M.; van Genuchten, M.T. The HYDRUS-1D Software Package for Simulating the Movement of Water, Heat, and Multiple Solutes in Variably Saturated Media; Department of Environment Science, University of California Riverside: Riverside, CA, USA, 2008; Available online: https://www.pc-progress.com/en/Default.aspx?H1d-downloads (accessed on 13 December 2009).
  79. Chung, S.-O.; Horton, R. Soil heat and water flow with a partial surface mulch. Water Resour. Res. 1987, 23, 2175–2186. [Google Scholar] [CrossRef] [Green Version]
  80. Van Genuchten, M.T. A Closed-form Equation for Predicting the Hydraulic Conductivity of Unsaturated Soils. Soil Sci. Soc. Am. J. 1980, 44, 892–898. [Google Scholar] [CrossRef] [Green Version]
  81. Bajc, A.F.; Russell, H.A.; Sharpe, D.R. A three-dimensional hydrostratigraphic model of the Waterloo Moraine area, southern Ontario, Canada. Can. Water Resour. J. Rev. Can. Des Ressour. Hydr. 2014, 39, 95–119. [Google Scholar] [CrossRef]
  82. CH2M HILL; Papadopulos and Associates Inc. (SSPA). Alder Creek Groundwater Study: Final Report; Prepared for The Regional Municipality of Waterloo, Kitchener, ON, Canada; CH2M HILL: Kitchener, ON, Canada, 2003. [Google Scholar]
  83. DMTI Spatial Inc. (DMTI). CanMap Streetfiles, Major Water Regions, and Minor Water Regions 2011; University of Waterloo Geospatial Centre. Available online: https://uwaterloo.ca/library/geospatial/collections/canadian-geospatial-data-resources/ontario (accessed on 29 March 2012).
  84. Hillier, C.E. Establishing Metrics to Quantify the Vulnerability of Municipal Supply Wells to Contaminants from Surface Water Sources. Master’s Thesis, University of Waterloo, Waterloo, ON, Canada, 2014. Available online: http://hdl.handle.net/10012/8683 (accessed on 23 September 2014).
  85. Healy, R.W.; Cook, P. Using groundwater levels to estimate recharge. Hydrogeol. J. 2002, 10, 91–109. [Google Scholar] [CrossRef]
  86. Leij, F.J.; Alves, W.J.; van Genuchten, M.T.; Williams, J.R. The UNSODA Unsaturated Soil Hydraulic Database: User’s Manual Version 1.0.; U.S. Environmental Protection Agency: Cincinnati, OH, USA, 1996; EPA/600/R-96/095 (NTIS 97-149496). Available online: https://cfpub.epa.gov/si/ (accessed on 12 April 2019).
  87. Aquanty Inc. (Aquanty). HGS User Manual: Manual for HydroGeoSphere Code; Aquanty, Inc.: Waterloo, ON, Canada, 2015; Available online: https://www.aquanty.com/ (accessed on 12 February 2018).
  88. Aquanty Inc. (Aquanty). HGS Reference Manual: Manual for HydroGeoSphere Code; Aquanty, Inc.: Waterloo, ON, Canada, 2015; Available online: https://www.aquanty.com/ (accessed on 12 February 2018).
  89. Doherty, J. Calibration and Uncertainty Analysis for Complex Environmental Models; Watermark Numerical Computing: Brisbane, Australia, 2015. [Google Scholar]
  90. Daus, A.; Frind, E.; Sudicky, E. Comparative error analysis in finite element formulations of the advection-dispersion equation. Adv. Water Resour. 1985, 8, 86–95. [Google Scholar] [CrossRef]
  91. Rockhold, M.L.; Zhang, Z.F.; Bott, Y.-J. Scale-Dependent Solute Dispersion in Variably Saturated Porous Media; Pacific Northwest National Laboratory: Richland, WA, USA, 2016; pp. PNNL-25146:1–PNNL-25146:52. Available online: https://beta11.pnnl.gov/publications/scale-dependent-solute-dispersion-variably-saturated-porous-media (accessed on 11 August 2020).
  92. Government of Canada. Historical Data: Rainfall, Snowfall, Snowpack Thickness, and Temperature Data for the Environment Canada Weather Station at Roseville, ON (Climate ID 6147188), 1973–2018. Available online: http://climate.weather.gc.ca/historical_data/search_historic_data_e.html (accessed on 15 January 2019).
  93. Seglenieks, F. University of Waterloo Weather Station Data Archives. Available online: http://weather.uwaterloo.ca/data.html (accessed on 9 October 2020).
  94. McGinn, R.A. Degree-Day Snowmelt Runoff Experiments; Clear Lake Watershed, Riding Mountain National Park. Prairie Perspect. Geogr. Essays 2012, 15, 38–53. [Google Scholar]
  95. Dingman, S.L. Physical Hydrology, 3rd ed.; Waveland Press Inc.: Long Grove, IL, USA, 2015; ISBN 978-1-4786-1118-9. [Google Scholar]
  96. Brouwers, M.H.; Matrix Solutions Inc., Guelph, ON, Canada. Personal communication, 2017.
  97. Matrix Solutions Inc. (Matrix); S.S. Papadopulos Inc. (SSPA). Region of Waterloo Tier Three Water Budget and Local Area Risk Assessment, Model Calibration and Water Budget Report; Matrix Solutions Inc.: Breslau, ON, Canada, 2014. [Google Scholar]
  98. Howard, K.W.F. Polluted Groundwater—Deadly Lessons from Walkerton, Ontario, Canada. In New Approaches Characterizing Groundwater Flow: Proceedings of the Proceedings of the XXXI International Association of Hydrogeologists Congress, Munich, Germany, 10–14 September 2001; Seiler, K.-P., Wohnlich, S., Eds.; Swets & Zeitlinger: Lisse, The Netherlands, 2001; pp. 521–525. ISBN 902-651-848-X. [Google Scholar]
  99. Andrade, L.; O’Dwyer, J.; O’Neill, E.; Hynds, P. Surface water flooding, groundwater contamination, and enteric disease in developed countries: A scoping review of connections and consequences. Environ. Pollut. 2018, 236, 540–549. [Google Scholar] [CrossRef]
Figure 1. Timeline of field research and related analyses.
Sustainability 13 07695 g001
Figure 2. Groundwater sampling locations near the Thornton well field, Woodstock, ON, Canada (after 2; [72,73,74]).
Sustainability 13 07695 g002
Figure 3. Field instrumentation [62,63] to study recharge beneath temporary snowmelt stream at the Thornton site [69,74].
Sustainability 13 07695 g003
Figure 4. Monitoring equipment at the Thornton site. (a) Facing northwest from near WO37 (J. Brook); (b) facing northwest from near WO36 (E. Pasha).
Sustainability 13 07695 g004
Figure 5. Comparison of (a) precipitation (Supplementary Materials document S2), and pathogen indicator species concentrations (b) in observation well WO11 [data from 2] and (c) public supply well PSW1 [data from 2].
Sustainability 13 07695 g005
Figure 6. Snowmelt channel at the Thornton site. (a) Facing south from near WO11 (M. Christie, [2]); (b) facing east from near PSW1 (M. Christie).
Sustainability 13 07695 g006
Figure 7. Groundwater level and temperature responses at the Thornton site in 2010 [62]. The arrows indicate times of rapid change in both temperature and water table elevation.
Sustainability 13 07695 g007
Figure 8. Cumulative infiltration estimated at the Thornton site via HYDRUS-1D [62,63].
Sustainability 13 07695 g008
Figure 9. Mannheim site and instrumentation [64,65,72,73,74,83,84,85].
Sustainability 13 07695 g009
Figure 10. Photo of largest hydrological event at the Mannheim site (A. Wiebe).
Sustainability 13 07695 g010
Figure 11. Observed responses at the Mannheim site [65]: (a) groundwater (GW) and surface water (SW) levels, and (b) temperature responses.
Sustainability 13 07695 g011
Figure 12. Cumulative infiltration at the Mannheim site (Supplementary Materials document S1).
Sustainability 13 07695 g012
Figure 13. HGS modelling results for the Mannheim site (after [29]): (a) breakthrough curves at PSW22 for the DFR solute, and (b) creek water levels [65] and cumulative applied effective precipitation (cumulative daily specified flux to top boundary × 1 day).
Sustainability 13 07695 g013
Publisher’s Note: MDPI stays neutral with regard to jurisdictional claims in published maps and institutional affiliations.

