Abstract
Phuket is well-known around the world as a popular tourist destination. Tourism-related population growth depends more on groundwater as the only available source of potable water in Phuket. The proper precautions must be taken to reduce the risk of spending large sums of money in sinking abortive boreholes, and a groundwater potential map would enhance the success rate of future groundwater exploration and exploitation in the study area. Geoelectrical surveys were carried out in this study to collect electrical properties of the subsurface, and the Dar-Zarrouk parameters (DZP) were calculated using the geoelectrical data. The first thematic groundwater potential map was constructed using the interpretation of DZP, while the second thematic groundwater potential map was created using the basis maps of the depth-of-basement and aquifer thickness parameters. Finally, two thematic maps based on geographic information system (GIS) environments were overlaid on a groundwater potential map of Phuket. However, in order to provide a reliable assessment of groundwater potential, time-lapse electrical resistivity imaging was used to confirm the area of the high-potential zone indicated on the map. The map created by this study is aimed to act as a reference for future groundwater exploration and exploitation, preventing water supplies from becoming unsustainable through botched borehole drilling for groundwater production.
1. Introduction
Groundwater has become an important source of water and is used extensively in urbanization, industry development, and domestic consumption []. Because of the growing demand for water, groundwater exploration is becoming increasingly important, particularly in areas where surface water is scarce []. Groundwater potential maps can show the quantitative condition of groundwater to indicate possible sites for groundwater exploration, the amount of precipitation, nature of infiltration, lithology, geomorphology, and subsurface structure, all of which affect groundwater potential [].
Phuket is a province located in southern Thailand, and it is an island well-known as a popular tourist destination around the world. In the past, Phuket was mostly a mining and industrial area, but it has been developed as a tourist destination since 1970s []. The residents of Phuket used to rely on surface water such as the canal and the river for their domestic water needs. The rapid and steady increase in tourists and tourism-related local residents has outweighed the potential potable water supply from surface water and thus more attention has been paid to the exploration of groundwater. However, due to a lack of understanding of subsurface conditions in many areas of Phuket, a greater understanding of aquifer development and characteristics in Phuket is required to evaluate groundwater potential properly. In most cases, a combination of factors determines the groundwater potential, where the zones or areas define the amount of groundwater available in the study area. Groundwater occurrence and flow are influenced by a variety of factors, including the type, thickness, and structural fabric of the underlying rocks, denudation, structural features, topography, and others. From one place to another, these components have a distinct influence on groundwater recharge potential. For example, linear features such as fractures and faults can act as conduits or barriers for groundwater circulation []. There is limited research on groundwater potential delineations in Thailand, particularly in Phuket. In the Chiang Mai Basin, Northern Thailand, Taweelarp et al. [] combined a large-scale field survey and hydrogeological data to explore groundwater potential. They used a computational model to evaluate groundwater potential in their research area by assessing yearly recharge variations. Konkul et al. [] applied a potential surface analysis to map the groundwater potential in terms of both water quality and quantity in the Huay Sai area of Phetchaburi province in western Thailand. Charoenpong et al. [] used an interpolation method to outline the groundwater potential map in the research area and the geographical distribution of groundwater using specific capacity (SPC) data to construct a groundwater potential map in Phuket.
A variety of ways to evaluate groundwater potential have been proposed, and among them, the geoelectrical approach has proven to be one of the most valuable tools in delineations and has been used for many applications []. In particular, electrical resistivity surveys are the most effective and efficient method for groundwater assessment and exploration []. Electrical resistivity surveys focus on the contrast between the characteristics of the target’s resistivity and the environment’s resistivity properties to assess the quantity of the target in the environment []. In Andaman Island, India, Maury and Balaji [] used borehole data to assess the accuracy of the interpretation of an electrical resistivity model to identify various hydrogeological settings of groundwater. Similarly, Owen et al. [] used related wells in conjunction with a geological map that aided the multielectrode resistivity study to evaluate the potential for extracting groundwater, and specifically for locating drilling points. Agbasi and Edet [] determined the depth to the water table, aquifer geometry, and groundwater quality by analyzing measured apparent resistivity, and the distribution of aquifer repositories was delineated through the use of the Schlumberger configuration.
Groundwater potential maps were developed by the interpretation of the aquifer’s resistivity and thickness in combination with thematic maps of geology, geomorphology, and hydro-lineament undertaken by Ojo et al. [] and Alabi et al. [] in Southwest Nigeria. Geoelectrical properties obtained from electrical resistivity calculation and interpretation known as DZP, including S, T, transmissivity, and hydraulic conductivity, were combined with geological data, such as the depth-of-basement and aquifer thickness, to assess groundwater potential [,,]. VES and hydrogeologic observations were used by Ebong et al. [] to estimate geohydraulic parameters from fractured shales and sandstone aquifers in Abi, Nigeria. Based on the interaction between transmissivity and transverse resistance determined by VES, an increase in transmissivity resulted in a large increase in T, indicating a continuous fluid flow potential throughout the entire region, according to the several researchers. Furthermore, when S increased, T and transmissivity tended to decrease, especially in areas where clayey materials were present in the aquifer’s rock matrix. Variations in transmissivity and T levels in the area were linked to the heterogeneous and anisotropic nature of the aquifer systems in the area. In any case, the DZP are diagnostic of transmissivity because it is influenced by the aquifer formation resistivity and thickness. In Pakistan, Akhter and Hasan [] used VES in conjunction with pumping test data to calculate aquifer parameters. In their investigation, the VES was investigated, and resistivities and thickness characteristics were determined. The transmissivity and hydraulic conductivity data were calculated using the DZP. In their conclusions, the transmissivity and hydraulic conductivity values derived from pumping test data and the VES technique showed a good correlation (R2 > 0.9). In addition, Amadi et al. [] and Devi et al. [] used the depth-of-basement parameter in conjunction with an electrical resistivity study to build a groundwater potential map. Anbazhagan and Jothibasu [] and Ali et al. [] used geospatial data from resistivity measurements for data production and spatial integration of the groundwater potential map using a GIS.
As previously stated, all integrated studies have given an assessment of groundwater potential, but only a few studies are supported by map validation. The purpose of this study is to delineate the groundwater potential zones in Phuket, Thailand, using interpretations of geoelectrical (DZP and resistivity parameters) and geological (depth of the basement) data with the aid of GIS techniques. A comprehensive electrical resistivity survey was conducted throughout the study region to determine the formation and thickness of the aquifer. Numerous boreholes that were bored in the research region for producing groundwater were used to acquire basement depth data. The groundwater potential map was verified using time-lapse electrical resistivity in different seasons. Groundwater exploration is critical for the target’s development, and this study, as well as future works, should serve as a good example of how scientific methods can be used to aid and facilitate future groundwater exploration and exploitation. Finally, the outcomes of this study’s map are aimed to serve as a guide for future groundwater exploration and exploitation. Effective groundwater exploration and exploitation can help to avoid unsustainable water supplies caused by failed borehole drilling for groundwater production.
2. Site Description
Phuket is a small island off the coast of Thailand’s southern peninsula. It is surrounded by the Andaman Sea and lies between latitudes 70°58′30″ N and 70°51′50″ N and longitudes 98°15′10″ E and 98°21′50″ E, encompassing an area of about 543 km2, as shown in Figure 1. The study area is still categorized as rural, with more potential for urbanization and tourism development. The region of the study area comprises a geologically varied terrain, including hilly topography, alluvial plains, and coastal areas. Phuket is made up of newer foundation rocks that date from the Oligocene to the Late Cretaceous geological periods []. The rocks are mainly granite, and they have been severely worn by tectonic processes. This means that they provide a good amount of potential groundwater [].
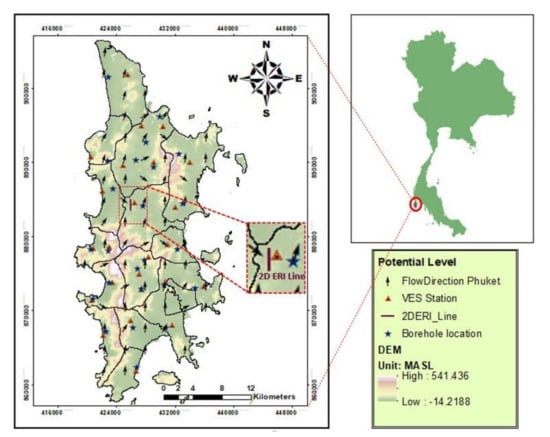
Figure 1.
Phuket map with an illustration of flow direction, VES stations, borehole/depth-of-basement location, the 2D ERI-Timelapse line and DEM.
Fence diagrams of cross-section lines E-W and S-N from north to south and east to west across Phuket Island are depicted in Figure 2. The top layer (fine-grain layer) is made up of sand, clayey sand, and loose soils, while the second layer (coarse-grain layer) is composed of weathered and fractured rocks. The basement is the third (bottom) layer, which was predominantly found of granite and some shales, according to Puttiwongrak et al. []. The study region comes inside the weathered and fractured units of hard rock environment that may store groundwater, and weathering and fracturing improve the water-bearing capacity. The study area’s rainfall pattern is predictable and wet for most of the year, and thus the climate simply varies between dry and rainy seasons. The monsoon season (June to September) has a lot of rain, and the wettest month is August when the water level rises below 10 mbgl (meter below ground level) in certain areas.
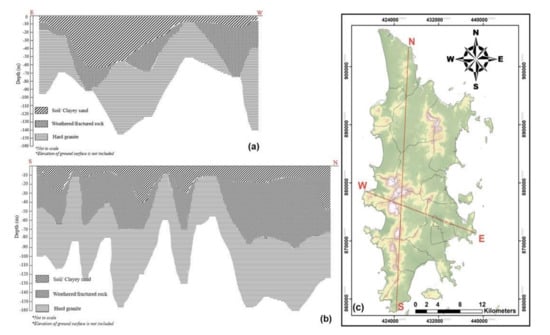
Figure 2.
Subsurface layers in Phuket Island: (a) cross-section line E-W, (b) cross-section line S-N and (c) lines of cross-section illustration in the Phuket map (modified from Puttiwongrak et al. []).
3. Methods
The methods employed to assess the groundwater potential and map the potential zones with the aid of the GIS environment are described in this section, whose overview is shown in Figure 3.
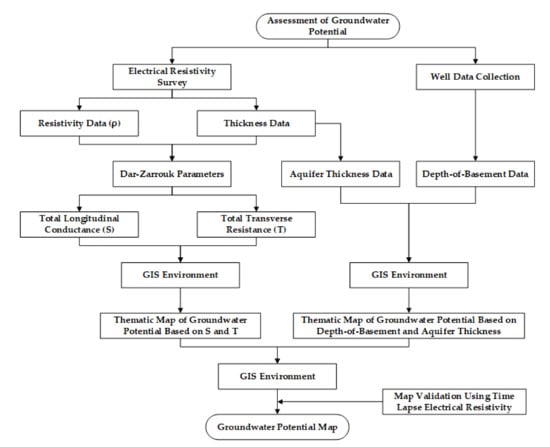
Figure 3.
A schematic description of the research methodology.
3.1. Electrical Resistivity Survey
A geoelectrical survey was carried out at 24 sites using the VES technique, as illustrated in Figure 1. The resistivity of the subsurface is measured using the VES approach, which is based on the reaction of the subsurface to the flow of an electrical current []. The electrical current, the potential differential, and the electrode array shape all influence subsurface resistivity. The subsurface’s water saturation and pore space connectivity affect resistivity measurements. In addition, every VES station’s coordinates were measured using the GPS as a geo-referenced position. The VESs were performed utilizing a Schlumberger setup with the SuperSting R2 resistivity meter [], with a half-current electrode spacing (AB/2) range of 5 to 200 m. Because the correct lateral variation of resistivity is determined from the duplication of measurements with the same values of AB/2 but different values of MN/2, the Schlumberger setup was used for this investigation. The current electrodes (A-B distance) were gradually extended for subsequent tests, but the potential electrodes (M-N distance) were kept constant until the ideal configuration was achieved.
The difference in apparent resistivity for each electrode spacing was also taken into account for a quantitative interpretation of the resistivity data. Using the EarthImager 1-D software [] to analyze all of the acquired data sets, layer resistivity and thickness estimations were derived. The program showed apparent resistivity and AB/2 value connections, and an iterative calculation approach was used to conduct the qualitative interpretation of subsurface resistivity distributions, which successfully minimized interpretation mistakes. The calculation of the true resistivity of the underlying materials needs the iterative inversion method from the apparent resistivity (or iso-resistivity) observed in the field survey. The VES data were then processed using the curve matching approach and 1D EarthImager computer software to obtain the layer (true) resistivities and thicknesses, resulting in a model with the least RMS error between measured and computed resistivity values. Furthermore, by correlating with the lithology information from groundwater drilling data, the models were improved to remove non-predictive bias interpretations. The drill data lithology was based on the previous work in the research region [], and all model findings were in good agreement with known borehole geological formations.
The interpreted results showed the distribution of resistivities as a function of layer thickness, providing a comprehensive picture of the studied area’s subsurface geology. Within the research region, three main subsurface units were recognized based on the VES curve interpretation: topsoil, worn basement, and fresh bedrock. The low zone (14–100 ohm-m) is normally an aquifer layer spanning from 7 to 40 mbgl that was interpreted as the weathered basement in all geological units’ second layer. The of the topsoil layer varies between 50 and 200 ohm-m, and its thickness varies between 4 and 20 mbgl. Finally, the fresh bedrock has a high that exceeds 300 ohm-m in all of the research area’s locations. The interpretation curves were coupled in close proximity to existing borehole data from the field surveys to validate the correctness of the VES interpretations (Figure 1). For example, a comparison of VES-6, VES-14, and VES-18 for interpretation utilizing 1D EarthImager software with boreholes of BH-595, BH-614, and BH-498, respectively, reveals a significant lithology agreement between the VES interpretations and borehole data (Figure 4). It is also worth noting that the VES interpretations match the geological profiles presented by []. Table 1 shows how the measurements from 24 VES stations were interpreted in relation to borehole lithology.
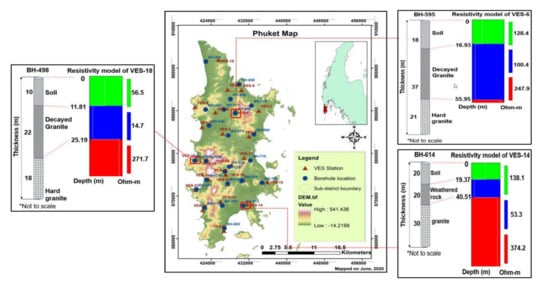
Figure 4.
Example of VES-6, VES-14 and VES-18 for resistivity interpretation using 1D EarthImager software with borehole validation of BH-595, BH-614 and BH-498, respectively.

Table 1.
Summary of geoelectric and borehole profiles.
3.2. Delineation of Depth-of-Basement
The depth-of-basement was obtained using lithologic data from boreholes conducted for groundwater production in the study region. In order to determine the thickness of the saturation zone, a depth-of-basement measurement is required. The basement depth in Phuket is relatively shallow; bedrock is found at a shallow depth of around—MASL in the northern part of the island, while it is thickest at 200 MASL in the southeast (mountainous areas). The depth-of-basement data obtained from the boreholes (Figure 1) were imported in the form of data points with a projected coordinating system of WGS 1984 UTM zone 47N datum, and then spatial interpolation was implemented as a base map using the IDW method from the GIS technique. The bulk of the bedrock of Phuket is fresh granite. Figure 5 depicts the depth-of-basement delineation in the study area. The map also depicts a mountainous area with an elevation of more than 50 MASL (blue color zones).
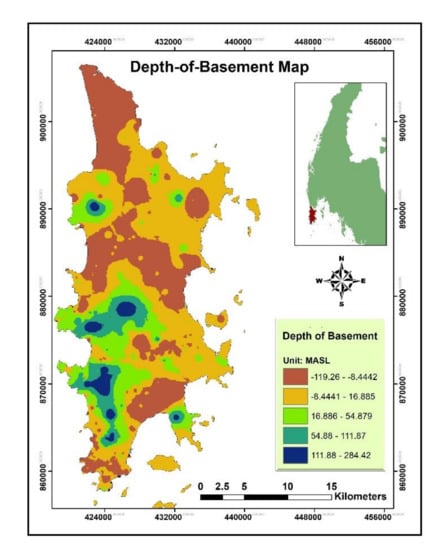
Figure 5.
The base map of depth-of-basement in Phuket.
3.3. Groundwater Potential Map Creation Using GIS Environment
Two thematic maps of groundwater potential interpretations were used to identify groundwater potential zones. The groundwater potential map of S and total T or DZP was created using the spatial analysis extension of ArcGIS as the first thematic map, and both S and T base maps (Figure 6a,b) were combined using a weighted overlay method to construct groundwater potential mapping. During the weighted overlay analysis, each parameter of each thematic map was ranked, and weights were allocated based on the influence of the various parameters [,]. Low S areas in the groundwater potential map are connected with high T and indicate a good potential in the zone []. The variation of S and T in hard rock reflects the predominance of resistive and conductive zones in the formation above the bedrock, signifying the groundwater potential. S is defined by the ratio of and of a layer, whereas T is defined by the product of and of a layer. The Equations (1) and (2) from Mailet [] were used to compute S (mho) and T (ohm-m2), respectively.
where the thickness of the layer determined by VES in each station is h (m), the electrical resistivity of the layer determined by VES in each station is (ohm-m), and the number of layers in the geoelectric profiles is n.
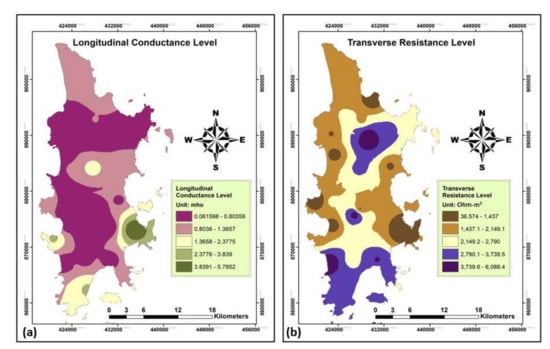
Figure 6.
The interpolation maps of Dar-Zarrouk parameters: (a) longitudinal conductance (S) base map and (b) transverse resistance (T) base map.
The overlay technique of the ArcGIS spatial analysis tool was also used to create the second thematic map of groundwater potential interpreted by depth-of-basement and aquifer thickness. The low groundwater potential zone is characterized by a shallow depth-of-basement and a minimum aquifer thickness []. The depth-of-basement (Figure 5) and aquifer thickness base maps (Figure 7), which were obtained from borehole data and VES interpretation, respectively, were imported as point data with georeferences and then spatially interpolated using the IDW method, just like the base maps of S and T.
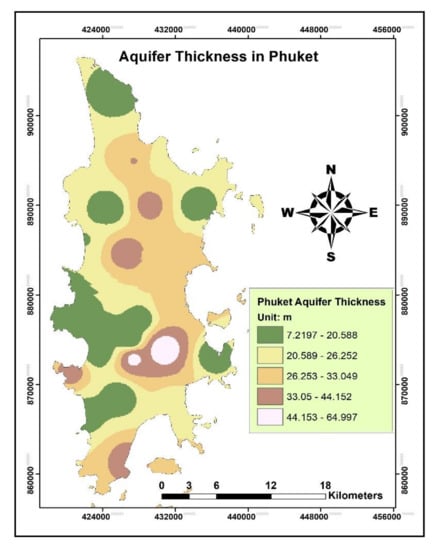
Figure 7.
The base map of aquifer thickness in Phuket.
Finally, based on the weighted overlay analysis of both the first and second thematic maps, a Phuket groundwater potential map was constructed using DZP, depth-of-basement, and aquifer thickness data. The weighted overlay reclassifies values in input rasters onto a similar suitability evaluation scale, assigning a relative importance to each and adding them together for the same weight (50%) to obtain a suitability value for each point on the map.
3.4. Time-Lapse Electrical Resistivity
In most past studies, the groundwater potential map was not evaluated to ensure its accuracy. In this study, however, accuracy assurance was attempted with a time-lapse electrical resistivity mapping validation for the in-depth verification of a sample of a potential zone in the map. Time-lapse electrical resistivity is commonly used to show the dynamic effect of a parameter on subsurface resistivity distribution []. Because the aquifer is likely to be always saturated by groundwater, the of the high-potential zone in the dry season (December to April) is considered to be the same as in the rainy season (May to November). When the low-potential zone is found on the map, the seawater zone (acting as a natural recharge in the aquifer system) rises because of the loss of groundwater for production during the dry season. The equilibrium between fresh water in the aquifer and seawater intruding from the Andaman Sea has most likely been disrupted as a result of over-pumping of groundwater to accommodate major growth in water demand to sustain tourism in the last decade. Despite a high rate of groundwater extraction, the average groundwater level in some Phuket subdistricts gradually rose due to increased groundwater recharge, which was caused by a variety of factors including high precipitation rates, aquifer type, and seawater intrusion caused by Andaman Sea level rise [,]. On the other hand, no seasonal variation in in the time-lapse electrical resistivity in the aquifer indicates that there is a large volume of groundwater available in the high-potential area. As a result, the line survey (2D ERI line) illustrated in Figure 1 was carried out using time-lapse electrical resistivity in both dry and rainy seasons in order to demonstrate that the high-groundwater-potential area on the map is represented by no seasonal variation in .
4. Results and Discussion
4.1. Groundwater Potential Based on DZP Interpretation
S is the ratio of distinct strata to their respective resistivity, while T is commonly related to the transmissivity of the aquifer, which characterizes permeability to fluid. As a result, the high T suggests a high transmissivity toward a high yield of aquifer units [,,]. The low S, on the other hand, suggests that the aquifer unit has a high permeability, hydraulic conductivity, and low clay volume [,,,]. Therefore, as indicated in Table 2, the low S zone of less than 0.1 mhos (poor protective capacity rating) indicates an unprotected aquifer (contaminant concerns), and the high-groundwater-potential zone is largely in the northern and central regions of the research area. The high T zone (>5000 ohm-m2) in the case of a transverse resistance base map (Figure 6b) suggests a high potential of groundwater in the research area’s northern half. Base maps of S and T are complementary to each other, particularly in the research area’s northern reaches.
Table 2.
Longitudinal conductance rating (protective capacity) of Aquifers [].
The groundwater potential for the first thematic map was built using base maps, such as S and T calculated from VES interpretation results, and base maps of S and T were integrated by GIS software using the weighted overlay method as a spatial analysis tool in ArcGIS 10.3 software. The integration was based on the idea that good groundwater potential is related to low S and high T. Individual thematic maps were given equal weight, and ranks were assigned based on the importance of groundwater. In addition, as indicated in Figure 8, the groundwater potential was divided into three categories: (1) low, (2) medium, and (3) high. According to the groundwater potential map, a high aquifer potential zone can be found in the center of the northern part, as well as in some specific areas in the southern part, while low groundwater potential can be found in the top northern part, as well as the western and eastern flanks of the study area. Furthermore, the medium prospective zone encompasses the majority of the study area.
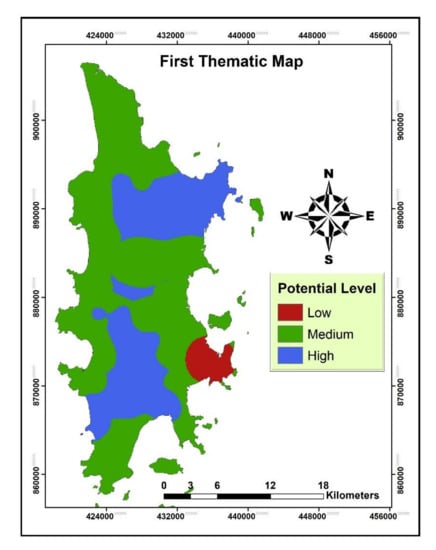
Figure 8.
The first thematic map as a groundwater potential map interpreted by Dar-Zarrouk parameters.
4.2. Groundwater Potential Based on Depth-Of-Basement and Aquifer Thickness Interpretation
The depth-of-basement and aquifer thickness basis maps were used to create the second thematic map of groundwater potential. Fresh basement rock is also distinguished by high values that exceed 10,000 ohm-m in practically every area. As illustrated in Figure 5 and Figure 7, the depth-of-basement (overburden thickness) and the aquifer thickness were mapped. These were done to provide a broad overview of the study area’s aquifer geometry. Groundwater resources are more likely to occur in areas with a heavy overburden (high depth-of-basement), especially when underlain by weathered hard rock []. Moreover, high and moderate groundwater potential can be obtained from the area based on the aquifer thickness, and the result shows that the south-central zone of the study area has the highest aquifer thickness (Figure 7) and that high groundwater potential can be inferred in this part of the study area.
Then, using the raster addition method in ArcGIS’s spatial analysis extension, a groundwater potential map based on depth-of-basement and aquifer thickness interpretation was created and shown in Figure 9. Based on the combination of the number of favorable layers, the sub-basin region was categorized into high, medium, and low groundwater potential zones. Considering the thickness values of the deep depth-of-basement and thick aquifer, the area considered a high groundwater zone was further correlated with the first thematic groundwater potential map. It was observed that the area around the south-central parts of the map is inferred to exhibit high-groundwater-potential characteristics. From the western area, the depth of the basement decreases eastward and northward. As groundwater flows down topography to it, the central section is naturally considered to be a catchment zone.
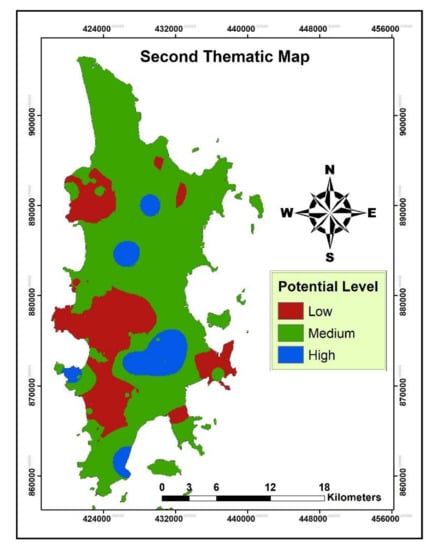
Figure 9.
The second thematic map as a groundwater potential map interpreted by depth-of-basement and aquifer thickness parameters.
4.3. Phuket Groundwater Potential
The thematic maps that depict the subsurface hydrogeological conditions and subsurface geometry, including geoelectrical qualities (DZP), at a different depth, depth-of-basement, and aquifer thickness, were examined to create the final groundwater potential map, as indicated in Figure 10a. The study area’s potential zones were defined by combining both thematic maps (the first and second thematic maps stated above) in a GIS environment using weighted overlay methods provided by ArcGIS software’s spatial analysis tool. Individual themes were given equal weight or influence, and ranks were assigned to each component within the theme based on their known value to groundwater. The groundwater potential zones on the integrated map were divided into three categories: (1) low, (2) moderate, and (3) high. The map shows that about 30% of the study area is a high-potential zone, while the medium-potential zone occupies about 67% of the study area, and a white patch (around 3%) of a low-groundwater-potential zone was observed in the southeast region of the study area.
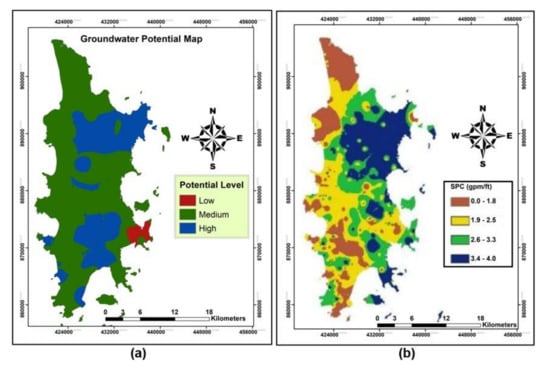
Figure 10.
Comparison of Phuket groundwater potential maps: (a) the potential map produced in this study and (b) the potential map modified from Charoenpong et al. [].
The integrated geoelectrical inquiry and hydrogeological analysis with aids of GIS techniques gave a useful outcome for groundwater potential mapping and sustainable planning. The map can be used to help future groundwater developments, management practices, and cropping patterns. The map created in this study shows a substantial correlation with and certain similarities to the previous map of Charoenpong et al. [], as shown in Figure 10b, but the map created in this study reveals the comfortable details and updated version of the groundwater potential map, which is well expected to provide a broader and more accurate understanding of favorable groundwater potential areas. Figure 10 shows comparative zones of high potential (blue color zones), where production times (time differences between two maps) and seasonal effects are not dominant, which are in good agreement with each other.
4.4. Groundwater Potential Map Validation
As stated earlier, map validation for this study was also conducted to improve accuracy and trustworthiness. Based on the idea that high-groundwater-potential zones in the map can be verified as high groundwater levels without seasoning, time-lapse electrical resistivity has been employed for seasonal monitoring of a high-potential zone of the study area. In the case of the time-lapse electrical resistivity of the line survey (Figure 1), the result displays a percentage change of 0%, indicating no changes in (corresponding to the high level of the groundwater in the aquifer) among seasons. During the dry season (April 2020), the of this zone is less than 200 ohm-m, and it remains constant during the rainy season (August 2020), as shown in Figure 11.
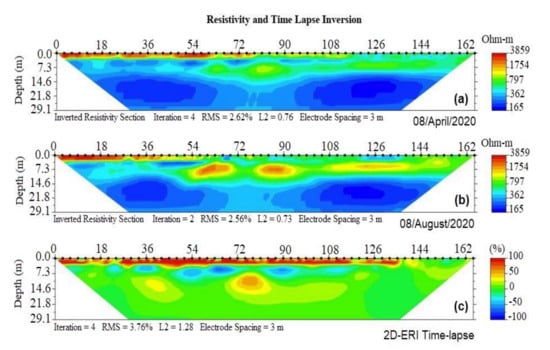
Figure 11.
The inverted results of 2D-ERI profile: (a) 2D ERI survey in dry season on 8 April 2020, (b) 2D ERI survey in rainy season on 8 August 2020 and (c) time-lapse inversion indicating the percentage change of the resistivity value between dry and rainy seasons in a high-potential zone for Phuket groundwater potential validation.
The results of this study can be applied appropriately to better borehole planning and give a new database for groundwater development and use in the area. Phuket is and will be considered a strategically important island in Thailand for tourism development, which necessarily requires more groundwater exploration to meet the growing need of tapwater by increasing groundwater resources. The information obtained in this study will facilitate future groundwater exploration and management in Phuket. To fulfill the expanding demands, a sustainable water supply must be built on successful boreholes, new groundwater resources, and effective exploration and exploitation of groundwater.
5. Conclusions
The groundwater potential of Phuket, Thailand, which is well known as a tourist destination, was identified and validated utilizing a geoelectrical survey and time-lapse electrical resistivity imaging, as well as the interpretation of geological datasets. The following are the study’s main findings:
- Plausibly promising zones for groundwater exploration in the study area were specified.
- The time-lapse electrical resistivity imaging confirmed the groundwater potential map of Phuket. The time-lapse electrical resistivity imaging indicates no seasonal changes in the high-potential zone.
- The groundwater potential map shows that medium potential zones make up the majority of the research region (67%), with a small patch (3%) of the low-potential zone in the southeastern corner. The high-potential zones, which make up 30% of the study area, are mostly in the south-central and northeastern parts.
- The effective geoelectrical survey, which combined geological data with a time-lapse electrical resistivity approach, provided a framework for assessing groundwater potential throughout the study area.
- To gather the subsurface data, a geoelectrical survey was carried out, and the resistivity and thickness data for each layer were interpreted using the 1D EarthImager software. After that, the DZP were calculated using those data (resistivity and thickness data).
- Thematic groundwater potential maps of Dar-Zarrouk characteristics and depth-of-basement with aquifer thickness were overlaid using GIS techniques on a map of groundwater potential in the study area.
The geoelectrical methods were effectively conducted to obtain the parameters used for the groundwater potential map in this study, which enabled the integrated map approach of groundwater potential evaluation. Future work, however, is also continually required for monitoring, as more groundwater exploration and exploitation will change the groundwater potential in the target area where rapid development related to tourism has been conducted and planned. It is also necessary to evaluate the impact of groundwater exploration and exploitation on ground subsidence to avoid excessive groundwater exploitation for sustainable development of Phuket, Thailand. Finally, a sustainable water supply must be built on successful boreholes, new groundwater resources, and effective exploration and exploitation of groundwater to meet the growing demands.
Author Contributions
Conceptualization, A.P.; methodology, A.P.; funding acquisition, A.P.; investigation, R.M.; data curation, R.M.; formal analysis, R.M.; writing—original draft preparation, S.V.; project administration, S.V.; resources, T.S.; writing—review and editing, K.H. supervision, A.P. All authors have read and agreed to the published version of the manuscript.
Funding
This research was funded by Research Fund of Prince of Songkla University Phuket Campus, grant number X611196.
Institutional Review Board Statement
Not applicable.
Informed Consent Statement
Not applicable.
Data Availability Statement
Not applicable.
Acknowledgments
We are grateful to the Department of Groundwater Resources, Thailand, for providing the groundwater data for this study. Furthermore, we would like to express special thanks to the Faculty of Technology and Environment, Prince of Songkla University (PSU) Phuket Campus for their many suggestions and helpful support.
Conflicts of Interest
The authors declare no conflict of interest.
Nomenclature
| DEM | Digital Elevation Model |
| DZP | Dar-Zarrouk Parameter |
| GIS | Geographic Information System |
| GPS | Global Positioning System |
| h | The thickness of layer from resistivity model with the unit of meter |
| IDW | Inverse Distance Weighting |
| MASL | Meters Above Sea Level |
| mbgl | Meters below ground level |
| ohm-m | ohm-meter |
| RMS | Root-Mean-Square |
| S | Electrical longitudinal conductance with unit of mho |
| T | Electrical transverse resistance with unit of ohm-m2 |
| VES | Vertical Electrical Sounding |
| 2D ERI | Two-dimensional Electrical Resistivity Imaging |
| ρ | Electrical resistivity (Rho) with the unit of ohm-m |
References
- Devi, P.D.; Srinivasulu, S.; Raju, K.K. Delineation of groundwater potential zones and electrical resistivity studies for groundwater exploration. Environ. Earth Sci. 2001, 40, 1252–1264. [Google Scholar] [CrossRef]
- Gowd, S.S. Electrical resistivity surveys to delineate groundwater potential aquifers in Peddavanka watershed, Anantapur District, Andhra Pradesh, India. Environ. Earth Sci. 2004, 46, 118–131. [Google Scholar] [CrossRef]
- Anbazhagan, S.; Jothibasu, A. Geoinformatics in groundwater potential mapping and sustainable development: A case study from southern India. Hydrol. Sci. J. 2016, 61, 1109–1123. [Google Scholar] [CrossRef] [Green Version]
- Boupun, P.; Wongsai, S. Land use change and the town planning policy of Phuket. Groundwater potential modelling using GIS in Phuket province, Thailand. In Proceedings of the 33rd Asian Conference on Remote Sensing, Pattaya, Thailand, 26–30 November 2012. [Google Scholar]
- Ahmed, A.; Alrajhi, A.; Alquwaizany, A.S. Identification of Groundwater Potential Recharge Zones in Flinders Ranges, South Australia Using Remote Sensing, GIS, and MIF Techniques. Water 2021, 13, 2571. [Google Scholar] [CrossRef]
- Taweelarp, S.; Khebchareon, M.; Saenton, S. Evaluation of Groundwater potential and safe yield of heterogeneous unconsolidated Aquifers in Chiang Mai basin, Northern Thailand. Water 2021, 13, 558. [Google Scholar] [CrossRef]
- Kunkul, J.; Rojborwornwittaya, W.; Chotpantarat, S. Hydrogeologic characteristics and groundwater potentiality mapping using potential surface analysis in the Huay Sai area, Phetchaburi province, Thailand. Geosci. J. 2014, 18, 89–103. [Google Scholar] [CrossRef]
- Charoenpong, S.; Suwanprasit, C.; Thongchumnum, P. Impacts of interpolation techniques on groundwater potential modeling using GIS in Phuket province, Thailand. Groundwater potential modelling using GIS in Phuket province, Thailand. In Proceedings of the 33rd Asian Conference on Remote Sensing, Pattaya, Thailand, 26–30 November 2012. [Google Scholar]
- Ndatuwong, L.G.; Yadav, G.S. Application of geo-electrical data to evaluate groundwater potential zone and assessment of overburden protective capacity in part of Sonebhadra district, Uttar Pradesh. Environ. Earth. Sci. 2015, 73, 3655–3664. [Google Scholar] [CrossRef]
- Hasan, M.; Shang, Y.; Akhter, G.; Jin, W. Geophysical assessment of groundwater potential: A case study from mian Channu Area, Pakistan. Groundwater 2018, 56, 783–796. [Google Scholar] [CrossRef]
- Saad, R.; Nawawi, M.N.M.; Mohamad, E.T. Groundwater Detection in Alluvium Using 2-D Electrical Resistivity Tomography (ERT). Available online: https://www.researchgate.net/publication/267243392_Groundwater_Detection_in_Alluvium_Using_2-D_Electrical_Resistivity_Tomography_ERT (accessed on 1 November 2021).
- Maury, S.; Balaji, S. Geoelectrical method in the investigation of groundwater resource and related issues in Ophiolite and Flysch formations of Port Blair, Andaman Island, India. Environ. Earth. Sci. 2014, 71, 183–199. [Google Scholar] [CrossRef]
- Owen, R.J.; Gwavava, O.; Gwaze, P. Multi-electrode resistivity survey for groundwater exploration in the Harare greenstone belt, Zimbabwe. Hydrogeol. J. 2005, 14, 244–252. [Google Scholar] [CrossRef]
- Agbasi, O.E.; Edet, S.E. Hydro-geoelectric study of aquifer potential in parts of Ikot Abasi local government area, Akwa Ibom state using Electrical Sesistivity Soundings. Int. J. Geol. Earth Sci. 2016, 2, 1–15. [Google Scholar]
- Ojo, J.S.; Olorunfemi, M.O.; Akintorinwa, O.J.; Bayode, S.; Omosuyi, G.O.; Akinluyi, F.O. GIS Integrated Geomorphological, Geological and Geoelectrical Assessment of the Groundwater Potential of Akure Metropolis, Southwest Nigeria. J. Earth Sci. Geotech. Eng. 2015, 5, 85–101. [Google Scholar]
- Alabi, O.O.; Ojo, O.; Akinpelu, D.F. Geophysical Investigation for Groundwater Potential and Aquifer Protective Capacity around Osun State University (UNIOSUN) College of Health Sciences. Am. J. Water Resour. 2016, 4, 137–143. [Google Scholar] [CrossRef]
- Ebong D., E.; Akpan, A.E.; Onwuegbuche, A.A. Estimation of geohydraulic parameters from fractured shales and sandstone aquifers of Abi (Nigeria) using electrical resistivity and hydrogeologic measurements. J. Afr. Earth Sci. 2014, 96, 99–109. [Google Scholar] [CrossRef]
- Akhter, G.; Hasan, M. Determination of aquifer parameters using geoelectrical sounding and pumping test data in Khanewal District, Pakistan. Open Geosci. 2016, 8, 630–638. [Google Scholar] [CrossRef]
- Amadi, A.N.; Nwawulu, C.D.; Unuevho, C.I.; Okoye, N.O.; Okunlola, I.A.; Egharevba, N.A.; Ako, T.A.; Alkali, Y.B. Evaluation of the groundwater potential in Pompo Village, Gidan Kwano, Minna using Vertical Electrical Resistivity Sounding. Br. J. Appl. Sci. Technol. 2011, 1, 53–66. [Google Scholar] [CrossRef]
- Ali, Y.H.; Priju, C.P.; Prasad, N.B.N. Delineation of groundwater potential zones in deep midland aquifers along Bharathapuzha river basin, Kerala using geophysical methods. Aquat. Procedia 2015, 4, 1039–1046. [Google Scholar] [CrossRef]
- Puttiwongrak, A.; Ratha, M.; Sakanann, V.; Kong, S.O.; Suteerasak, T.; Nontapot, T. Groundwater Modelling for Natural Recharge Estimation in Phuket Island, Thailan. BUSCIJ 2021, in press. [Google Scholar]
- Advanced Geosciences, Inc. (AGI). Instruction Manual: Resistivity; Advanced Geoscience Inc.: Austin, TX, USA, 2016. [Google Scholar]
- Advanced Geosciences, Inc. (AGI). Instruction Manual for Earthimager1D Version 2.4.2: Resistivity and IP Inversion Software; Advanced Geoscience Inc.: Austin, TX, USA, 2014. [Google Scholar]
- Puttiwongrak, A.; Vann, S.; Rattanakom, R.; Ruamkaew, S. Preliminary assessment of seawater intrusion on Phuket Island using groundwater data analysis and Geographic Information System (GIS) Techniques. Eng. J. Res. Dev. 2019, 30, 75–88. [Google Scholar]
- Giao, P.H.; Weller, A.; Hien, D.H.; Adisornsupawat, K. An approach to construct the weathering profile in a hilly granitic terrain based on electrical imaging. J Appl Geophy 2008, 65, 30–38. [Google Scholar] [CrossRef]
- Nagarajan, M.; Singh, S. Assessment of groundwater potential zones using GIS technique. J. Indian Soc. Remote Sens 2009, 37, 69–77. [Google Scholar] [CrossRef]
- Kura, N.U.; Ramli, M.F.; Ibrahim, S.; Sulaiman, W.N.A.; Zaudi, M.A.; Aris, A.Z. A preliminary appraisal of the effect of pumping on seawater intrusion and upconing in a small tropical island using 2D resistivity technique. Sci. World J. 2014, 2014, 1–11. [Google Scholar] [CrossRef] [Green Version]
- Mailet, R. The Fundamental equations of electrical prospecting. Geophy 1974, 12, 529–556. [Google Scholar] [CrossRef]
- Carey, A.M.; Paige, G.B.; Carr, B.J.; Dogan, M. Forward modeling to investigate inversion artifacts resulting from time-lapse electrical resistivity tomography during rainfall simulations. J Appl Geophy 2017, 145, 39–49. [Google Scholar] [CrossRef]
- Vann, S.; Puttiwongrak, A.; Suteerask, T.; Koedsin, W. Delineation of Seawater Intrusion Using Geo-Electrical Survey in a Coastal Aquifer of Kamala Beach, Phuket, Thailand. Water 2020, 12, 1–14. [Google Scholar] [CrossRef] [Green Version]
- Puttiwongrak, A.; Kong, S.O.; Vann, S. Groundwater Recharge Estimation in Kathu, Phuket using Groundwater Modelling. SEAGS AGSSEA J. 2018, 49, 4–9. [Google Scholar]
- Oladapo, M.; Akintorinwa, O. Hydrogeophysical study of Ogbese South Western Nigeria. Glob. J. Pure Appl. Sci. 2007, 13, 55–61. [Google Scholar] [CrossRef] [Green Version]
Publisher’s Note: MDPI stays neutral with regard to jurisdictional claims in published maps and institutional affiliations. |
© 2021 by the authors. Licensee MDPI, Basel, Switzerland. This article is an open access article distributed under the terms and conditions of the Creative Commons Attribution (CC BY) license (https://creativecommons.org/licenses/by/4.0/).