1. Introduction
Set pieces actions are those that have great importance in football, both men’s and women’s. These are static actions within a dynamic context such as soccer, where teams can achieve a significant number of goals [
1,
2]. Various studies consider these actions as performance indicators in football [
3,
4] due to their high relevance in the applied field. Many high-level games are decided on the scoreboard by a goal from set pieces actions [
5]. Traditionally, it is found that there are 110 set pieces actions per game (44.9 throw-ins per game; 0.49 penalties; 10.5 corners; 35 free kicks and 20.5 goal kicks), which represent 96.9% of the total of all interruptions, and which account for 41.7% (37.7 min) of the total match [
5,
6].
Set pieces actions have been related in retrospective studies as actions associated with a high probability of a goal [
1,
2,
7], specifically between 35% and 48% of goals. More recent studies have corroborated that soccer has evolved, and that this percentage has drastically decreased, both in men’s soccer [
7,
8,
9,
10,
11] and in women’s soccer [
6,
12,
13]. Corner kicks are one of the set pieces actions that most regularly occur during matches. Specifically, there are an average of 10 corner kicks per game, regardless of the competition analyzed, and the type of men’s or women’s football [
14,
15]. Furthermore, in view of the available data, these are actions of very low efficacy, although with different efficacy indices depending on the championship analyzed. Thus, higher percentages of shot on goal are found in world cups (FIFA World Cup) [
16,
17], than in European championships between nations (UEFA Euro) [
7,
10]. Regarding whether the shot goes to the goal (between the three posts), there are no notable differences between different men’s [
5] and women’s [
13] championships. Concerning the goal, and despite the fact that the differences are still small, it is possible to verify that more goals are achieved in women’s football [
13,
18] than in men’s football [
11]. On the other hand, there are better percentages in the Champions League (percentages between 8% and 10%) [
19] than in domestic league competitions [
11] (3.1%), or world competitions between nations [
6,
16] (2.3%).
On the other hand, on the final significance of these actions, there is unanimity among the authors consulted that these are actions that produce transcendental goals that help to achieve victory [
20,
21]. Specifically, between 69% and 76% of the goals resulting from corners have contributed to awarding victory or points to the teams [
11,
22].
In terms of delivery areas, there are also differences in terms of competitions. Thus, in world cups and European cups between nations there are more deliveries to the far post [
5]. Although in league championships, more are sent to the first post [
23]. It is important to highlight that these differences may be due to the different zoning proposed by the different authors. Regarding how match status affects the effectiveness of the corners, there are differences depending on the championship. Thus, the teams that are losing on the scoreboard take more corners than the teams that are winning [
14], although the highest number of corners is executed with the score in victory for the executor [
16].
In relation to the form of execution, the results are even more mixed. Schmicker [
24] and Pulling [
25] analyze the Major League Soccer and the Premier League, respectively, and they find higher rates of goals with a direct delivery (center and shot), than indirect plays. On the other hand, in national and world championships, corners that end in goals are characterized by indirect deliveries [
5].
As regards the number of players who intervene on the ball during the execution of the corner kick, we find again notable differences depending on the competition, the season and the type of football. Specifically, in league championships more goals are achieved with the intervention of only two players, the server and the auctioneer [
25]. On the other hand, in world championships, it was found that despite the fact that in most of the corners only the server intervenes [
11], different studies have shown that the highest efficiency rates occur when 3–4 attackers intervene with a minimum of elaboration [
16] in both men’s and women’s soccer [
6]. As for the type of defense used in the corners, the data seem to indicate that the most effective type of defense is the defense that performs a mixed marking, that is to say, combining zone defense with individual defense. These results are consistent regardless of the competition analyzed, such as world cups, UEFAS Euro and Champions League [
5,
17]. Differences are also found between the best and worst teams, specifically the best teams use mixed defenses, while the worst teams use zonal defenses [
11]. Finally, the organization of the attacking players is also a variable that modulates the success of these actions. The dynamic organization in attacking, that is to say, the mobility of the players in the opponent’s goal area, such as maneuvers to create and occupy spaces, clearings, dragging and numerical superiorities are behaviors that increase the potential for success of corners both in league championships [
11], and of world cup [
16] championships such as the UEFA Euro [
10]. In women’s soccer, this variable still needs more research.
In view of these results, a study on the evolution of corner kicks in top-level football is justified. The objective of this research was to analyze the relationship between different variables that may have modulated or conditioned the corner kicks throughout the 2010, 2014 and 2018 FIFA World Cups. For this, three types of complementary analysis were carried out: the statistic x2 was calculated to know if there were differences between the categories of each variable; next, a log linear analysis was implemented to know the relationship between the selected categorical variables, in terms of odds; finally, the decision tree technique was implemented to predict, classify and select the predictor variables that present the greatest gain in information in this type of action in top-level football.
3. Results
3.1. Descriptive and Bivariate Results
To begin this comparative analysis of the corner kicks, a description of the three competitions studied was carried out. Given the categorical format of the variables, the frequencies accompanied by their total percentages were recorded. The chi-square statistic was calculated to know if there were differences between the categories of the variable (
Table 2).
Table 2 shows all the criteria and categories considered for each of the competitions, as well as the frequencies and percentages for each category, in order to know if there are differences between the different FIFA World Cups considered. The tests indicate that the criteria time, number of attackers, number of defenders, delivery mode, interaction context, trajectory of the ball, type of marking, defenders at the posts, number of attackers involved, delivery zone, match status and criterion2.ShotOnGoal show significant differences between the different FIFA World Cups.
3.2. Results of the Log Linear Analysis for Three Categorical Variables
A model of independence of the three variables MatchStatus, Time and InterveningAttackers was proposed using a function of the Poisson family. The lack of fit of the model made it necessary to propose a more complex model; the homogeneous association model was selected, which allowed the variables to be related to each other. Observing the residual deviation in relation to the degrees of freedom, the fit was verified, and the association between the variables and the effects of one on the other was described, in addition to calculating the coefficients of the interactions and their odds ratios.
In the tested model, interactions were added for each combination of variables in pairs, which would be a homogeneous association.
Log-linear models for three-dimensional tables
: expected frequency of the cell (i, j, k): the average of the la media de los logaritmos de las frecuencias
: the mean of the logarithms of the frequencies
: effect of category i of factor X;
: effect of category j of factor J;
: effect of category k of factor Z;
: interaction effect of category i of factor X and category j of factor Y;
: interaction effect of category i of factor X and category K of factor;
: interaction effect of category j of factor Y and category k of factor K.
In
Table 3, the results for the 2010 FIFA World Cup competition are presented.
As a general rule, the value of the residual deviance should be close to the value of the degrees of freedom. In this case, the value of the residual deviance is 1.7381 and the degrees of freedom are 4. The deviation statistic has an approximate chi-square distribution, so the value of the |2 test was calculated, which was 0.783, which indicated the probability of obtaining a deviation as large or larger than the observed one. It is concluded that this model shows a good fit.
In
Table 4, the results for the 2014 FIFA World Cup competition are presented.
In this case the value of the residual deviance is 5.8082 and the degrees of freedom are 4. The value of the |2 statistic was 0.213, which indicated a good fit.
Table 5 presents the results for the 2018 FIFA World Cup competition.
The value of the residual deviance is 8.86 and the degrees of freedom are 4. The value of the |2 statistic was 0.064, which indicated a minimum adjustment.
Next,
Table 6 shows the Odds ratio values by competition.
In the 2010 FIFA World Cup, in a first interaction (InterveningAttackers*MatchStatus), the situations of InterveningAttackers with 3–4 players were estimated to have a probability of missing 1512 times higher than play situations InterveningAttackers 1–2. In the case of InterveningAttackers with 3–4 players, the probability of winning was 2022 times higher than with InterveningAttackers 1–2.
For the interaction (InterveningAttackers*Time), the situation InterveningAttackers 3–4 had an estimate that the probability of using Time31–60 was 1111 times higher than InterveningAttackers 1–2. However, in the case of InterveningAttackers 3–4, the probability of using the Time31–60 increased 1911 compared to InterveningAttackers 1–2.
Finally, the interaction (
MatchStatus*
Time) in the 2010 competition, the situation of losing in the scoreboard made the estimated probability of using
Time31–60 was 1422 times higher than with a winning scoreboard. In the winning situation, the estimated probability of using
Time31–60 was 2464 times higher than with a losing scoreboard. In the case of losing the estimated probability of using
Time61–90 increases 2891 times over compared to a winning scoreboard. In the situation of winning, the estimated probability of using
Time61–90 increases 4195 times compared to losing (
Table 6).
In FIFA World Cup 2014, first interaction (InterveningAttackers*MatchStatus), in the case of InterveningAttackers being 3–4 the probability of losing scoreboard was 1644 higher than the situations of InterveningAttackers 1–2 players, a slightly higher value compared to the 2010 competition. For the case of InterveningAttackers with 3–4 players, the estimated probability of winning was 2850 higher than the situation of InterveningAttackers 1–2.
The interaction (InterveningAttackers*Time), in the situation InterveningAttackers 3–4, the estimate of the probability of using Time31–60 was 0.950 times greater than in the case of using InterveningAttackers 1–2. For the case of InterveningAttackers 3–4 the probability to use Time61–90 was 2557 times higher compared to using InterveningAttackers 1–2.
The interaction (
MatchStatus*
Time), the situation of a losing scoreboard gave an estimated probability of using
Time31–60 that was 1378 times higher than winning. In the situation of winning, the estimated probability of using
Time31–60 was 2460 times higher than losing. In the case of losing the estimated probability of using
Time61–90, it increases 3035 times compared to winning. In the situation of winning, the estimated probability of using
Time61–90 increases by 4676 times compared to losing (
Table 6).
Finally, FIFA World Cup 2018, the first interaction (InterveningAttackers*MatchStatus) in the category InterveningAttackers 3–4 the estimate of the probability of a losing scoreboard was 0.997 higher than in the situations of InterveningAttackers 1–2, a lower value than in the other two competitions. In the InterveningAttackers 3–4 situation it was estimated that the probability of winning was 2912 times higher than in the InterveningAttackers 1–2 situation.
In the second interaction (InterveningAttackers*Time), in the situation InterveningAttackers 3–4 it was estimated that the probability of using the Time31–60 was 0.163 higher than using the category InterveningAttackers 1–2. For InterveningAttackers 3–4 using Time61–90, the probability increases by 0.837 compared to InterveningAttackers 1–2.
The interaction (
MatchStatus*
Time), in the situation to a losing scoreboard, the estimated probability of using a
Time31–60 was higher by 2.66 times than winning, while in the case of winning the estimated probability using a
Time31–60 increase 2.99 compared to losing. Regarding the category
Time61–90, the situation of losing has an estimated probability of 5.76 times higher than winning. In the situation of winning, the estimated probability of using the category
Time61–90 increases 4.80 compared to losing (
Table 6).
3.3. Decision Tree Analysis Results
The decision tree technique was applied for decision making in the three competitions, 2010, 2014 and 2018, for the explained variable “criterion1.Shot”. This criterion refers to whether the attacking team makes a shot on goal as a result of the execution of the corner kick. Following previous studies [
5,
13], the achievement of a shot in the corner kicks is considered a performance indicator. It has been tried to find the predictor variable that presents the greatest gain in information compared to the explained variable. In this way, it is possible to efficiently identify the most important variables in the tactical construction of corner kicks to achieve a shot on goal.
In the development of the decision trees, two samples were built, a training sample to generate a predictive model that consists of 70% of the total records, and a test sample of 30%, to verify the effectiveness of the model.
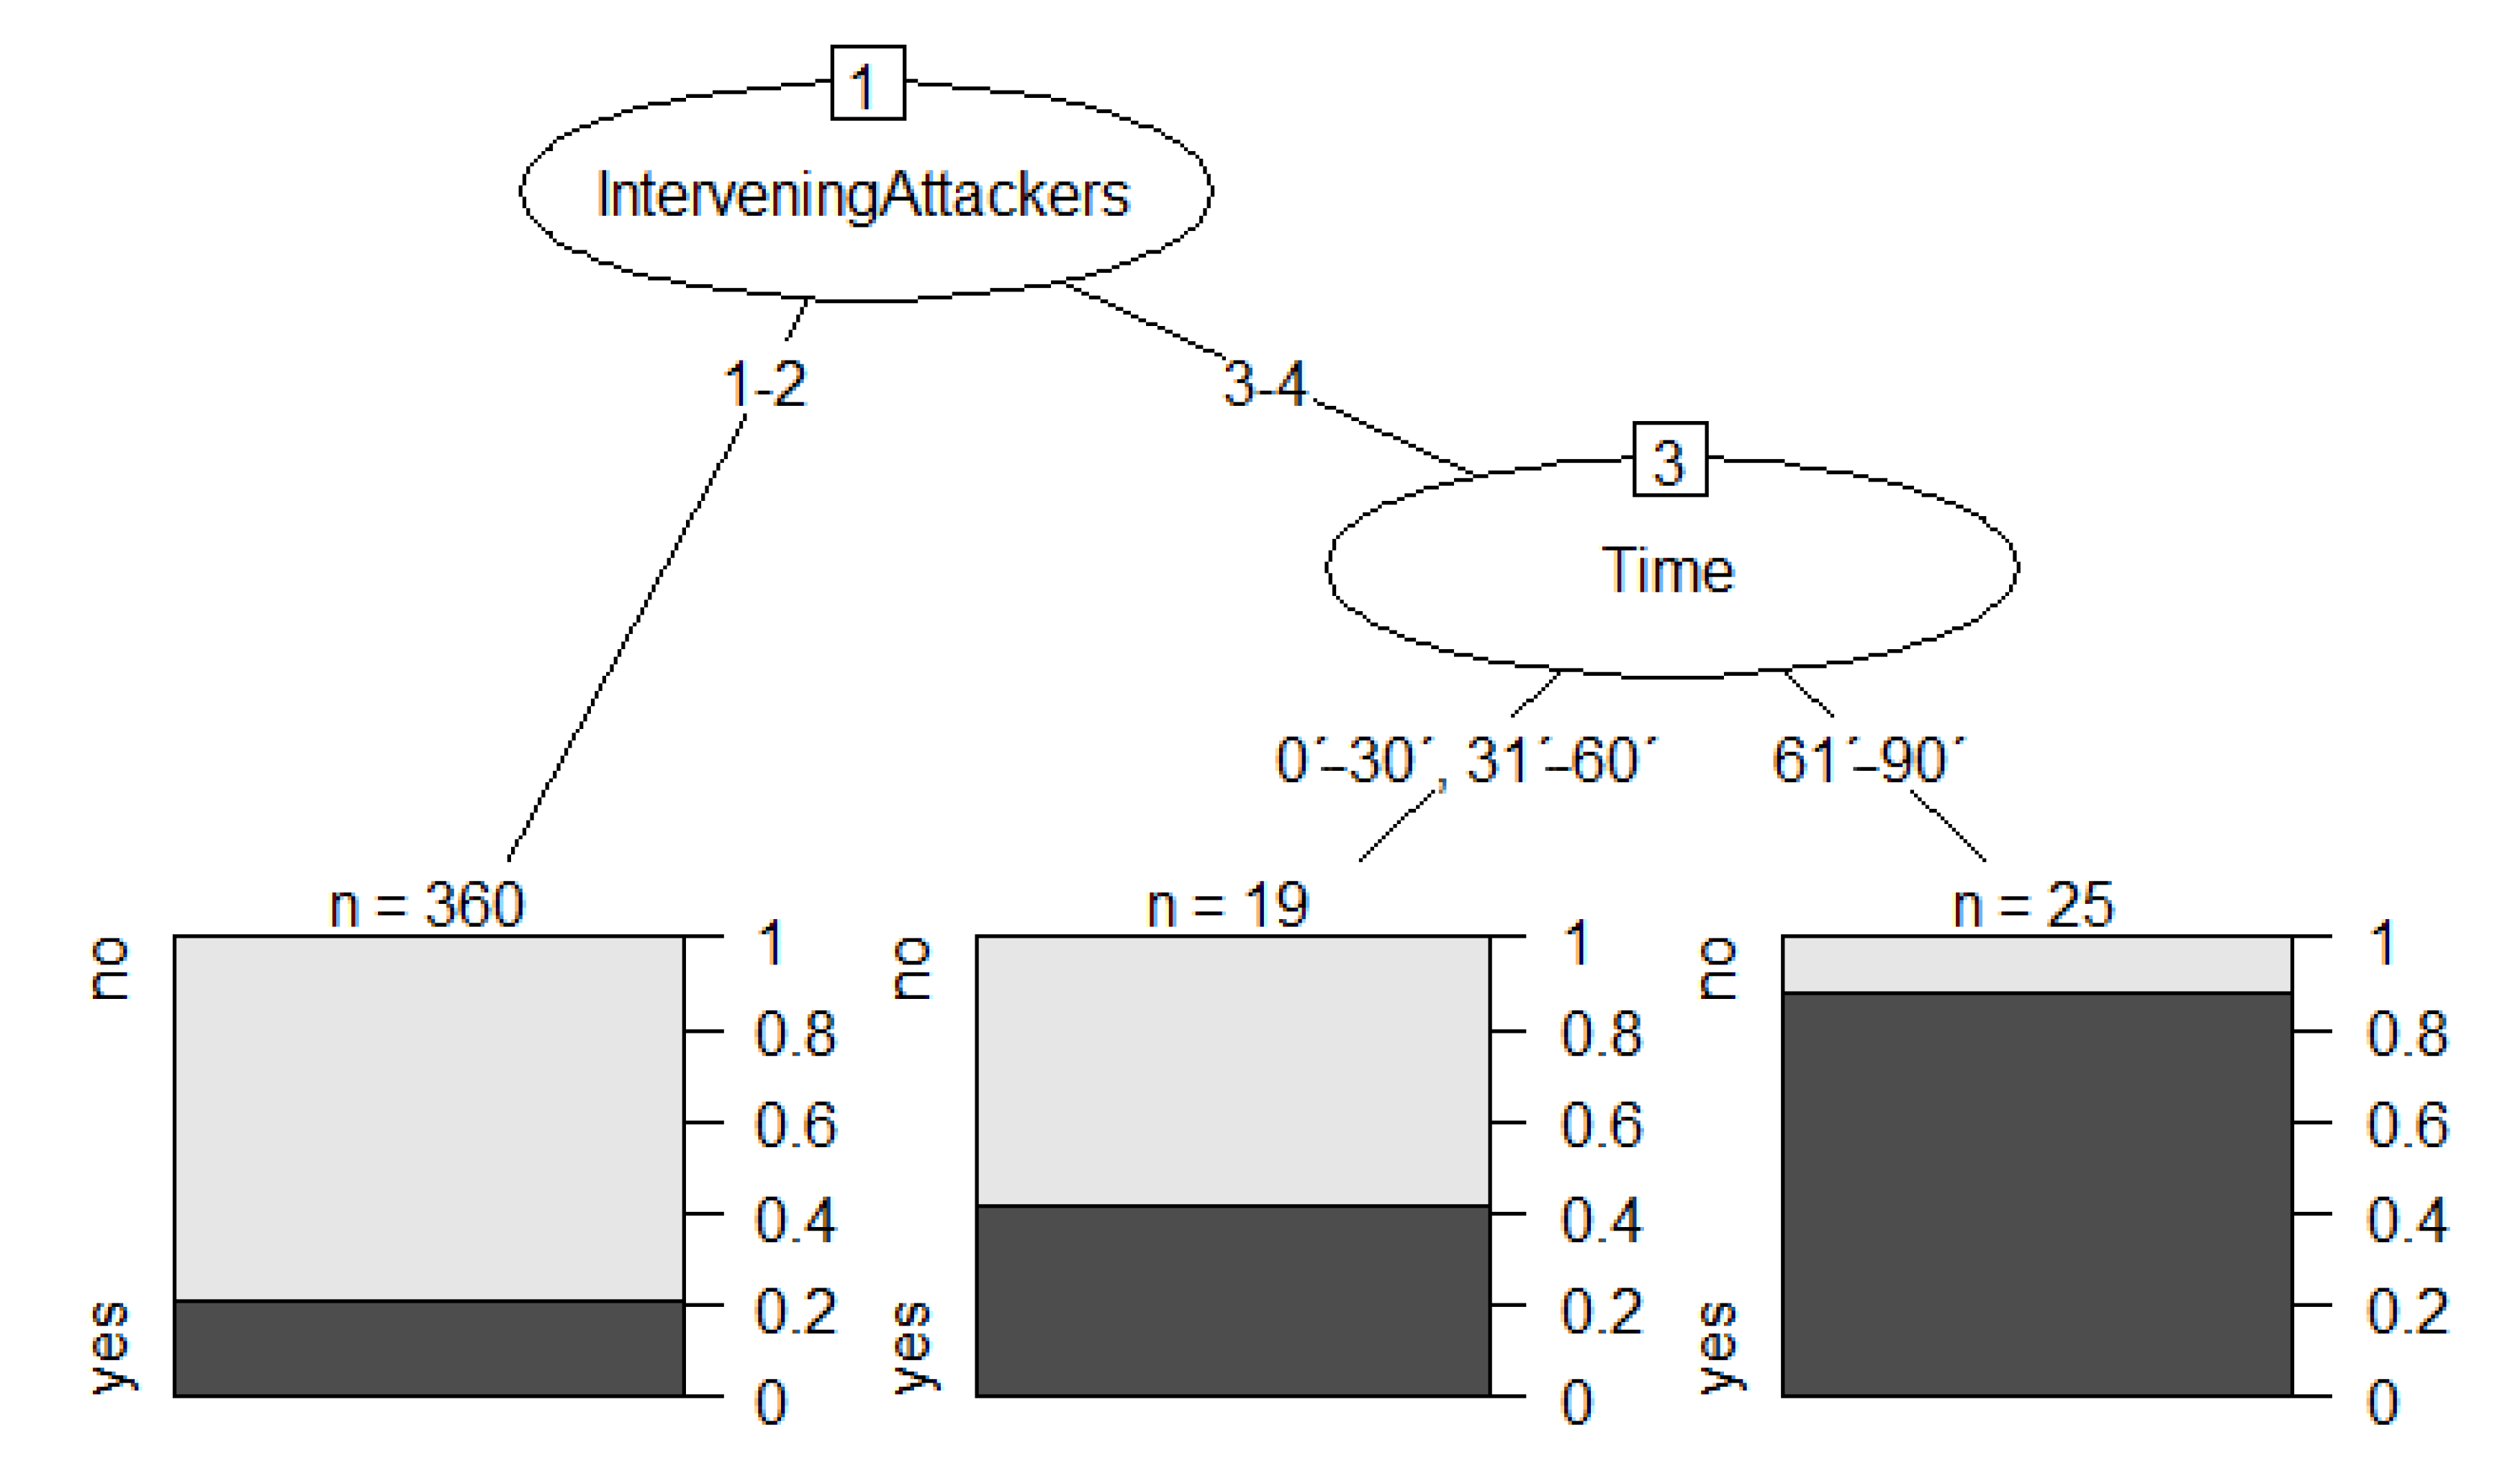
3.3.1. FIFA World Cup 2010
The starting variable uses 404 observations with a loss of 107 and a probability of 78.61% that “no” will occur, while there is a probability of 32.38% that “yes” will occur. Next, the algorithm includes the categories InterveningAttackers = 1–2, terminal node, with 360 observations and a loss of 77 observations where the probability of not achieving “criterion1.Shot”, is 78.61% and a probability of achieving it of 21.38%, the InterveningAttackers = 3–4 category with 44 observations and 14 losses, shows a probability of 68.18% of not being able to achieve “criterion1.Shot” and a probability of 31.81% of achieving it. The next variable included by the algorithm was “Time” with the intervention of two categories: Time = 0’–30’,31’–60’, terminal node, with 19 observations with 8 losses with a probability of not achieving “criterion1.Shot” of 57.89% and 42.10% of achieving it, and another category Time = 61’–90’, collects 25 observations with a loss of 3, obtained a favorable probability of 88% and a probability of not obtaining it of 12%. It is a terminal node (
Figure 1).
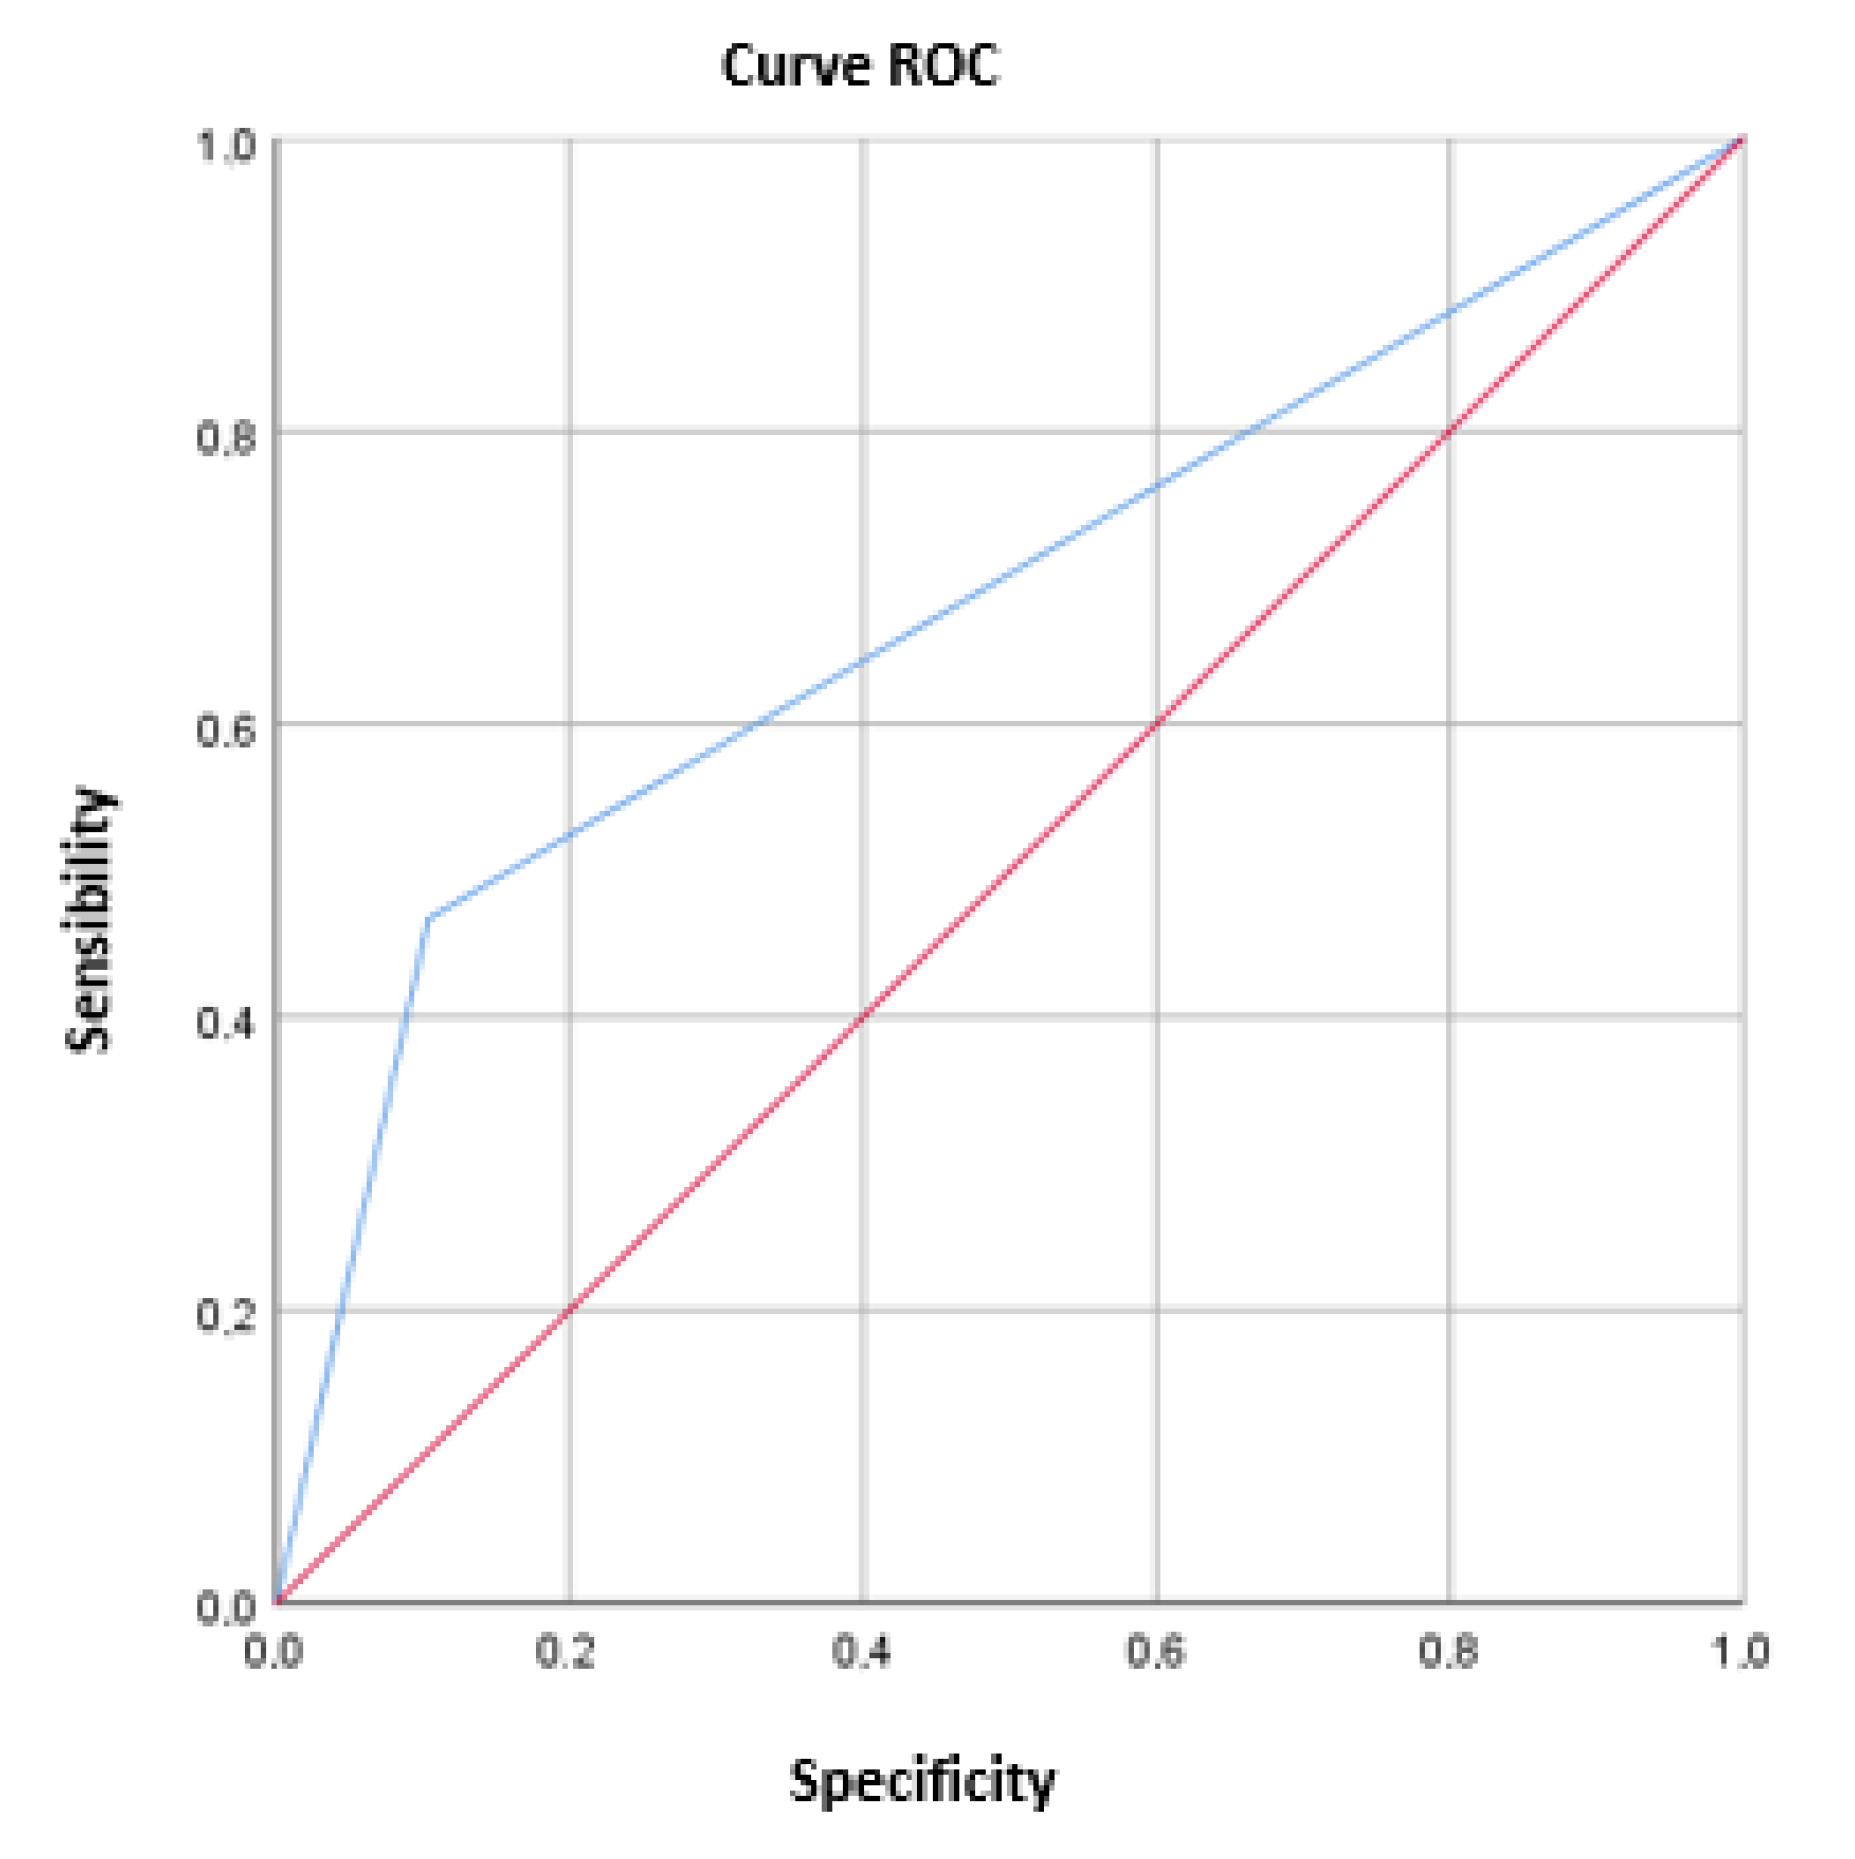
The area under the curve is 1.
This metric represents the overall accuracy and measures the overall agreement between what the model predicted and what was observed in the test data set.
Below is a table with the results of prediction accuracy, error rate, precision, sensitivity, specificity and F1 score (
Table 8).
The usual process we followed consisted of dividing the sample into two sets, a training set and a test set. The training data are used to fit a prediction model and the test data are used to check the behavior of the estimated model.
The supervised learning model is group into sets with similar characteristics, and the response variable is the group to which each item belongs. These are the results (
Table 9):
To study whether we need to keep the whole tree or only a part of it, we resort to Cross-Validation as a measure of “efficiency” of the number of branches.
The fitting process optimizes the model parameters so that the model fits the training data as well as it can. Most commonly, 10-fold cross-validation is used.
This model can be evaluated in terms of prediction, in such a way that it is verified that it has predicted that there is no “criterion1.Shot” a total of 67 times when it really has not been given, and 4 times when “criterion1.Shot” really has been given. The model estimates that the “criterion1.Shot” has not occurred 42 times when it has actually not occurred. The model says that “criterion1.Shot” does not occur 8 times while actually “criterion1.Shot” has been given.
Finally, the effectiveness of the model is evaluated, adding all the successes and dividing by the number of predictions, obtaining an effectiveness of 16.13% of successes.
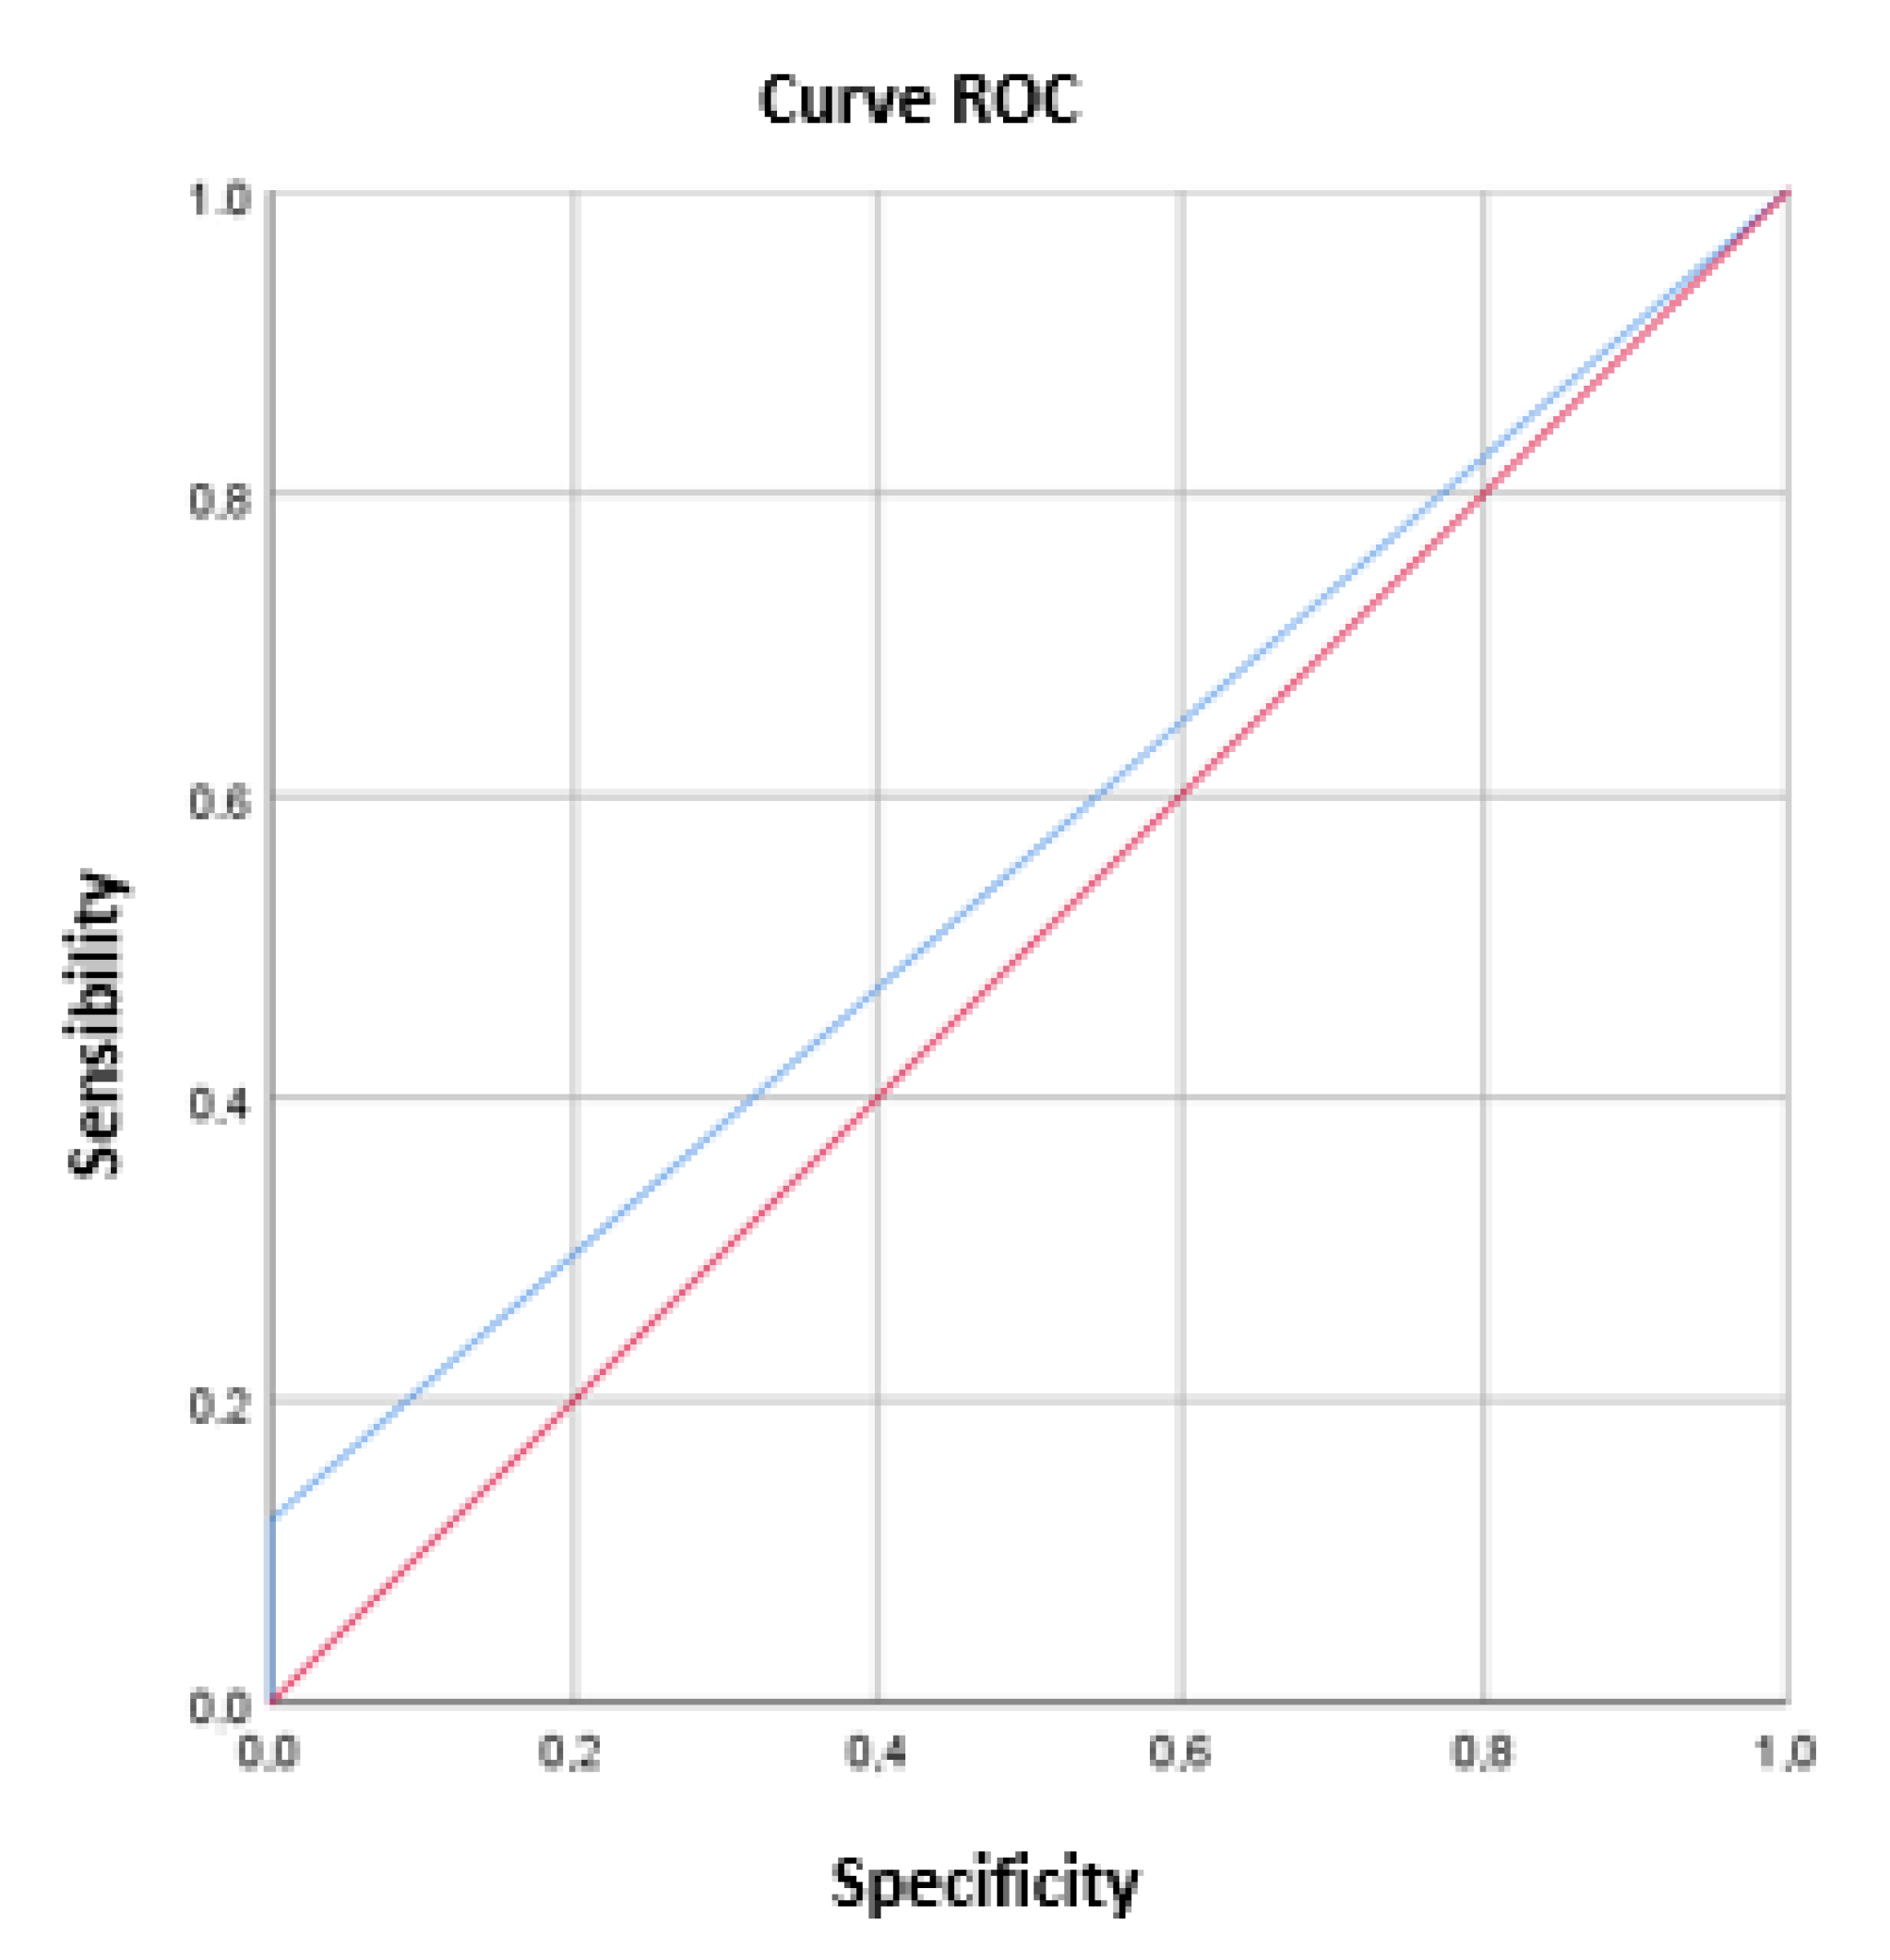
An alternative method for evaluating classifiers to the above metric is the Receiver Operating Characteristic (ROC) curve. The ROC curve is a graphical representation of classifier performance showing the distribution of the fractions of true positives and false positives. The fraction of true positives is known as sensitivity, which is the probability of correctly classifying an individual whose true status is defined as positive. Specificity is the probability of correctly classifying an individual whose true status is classified as negative. This is equal to subtracting one from the fraction of false positives.
3.3.2. FIFA World Cup 2014
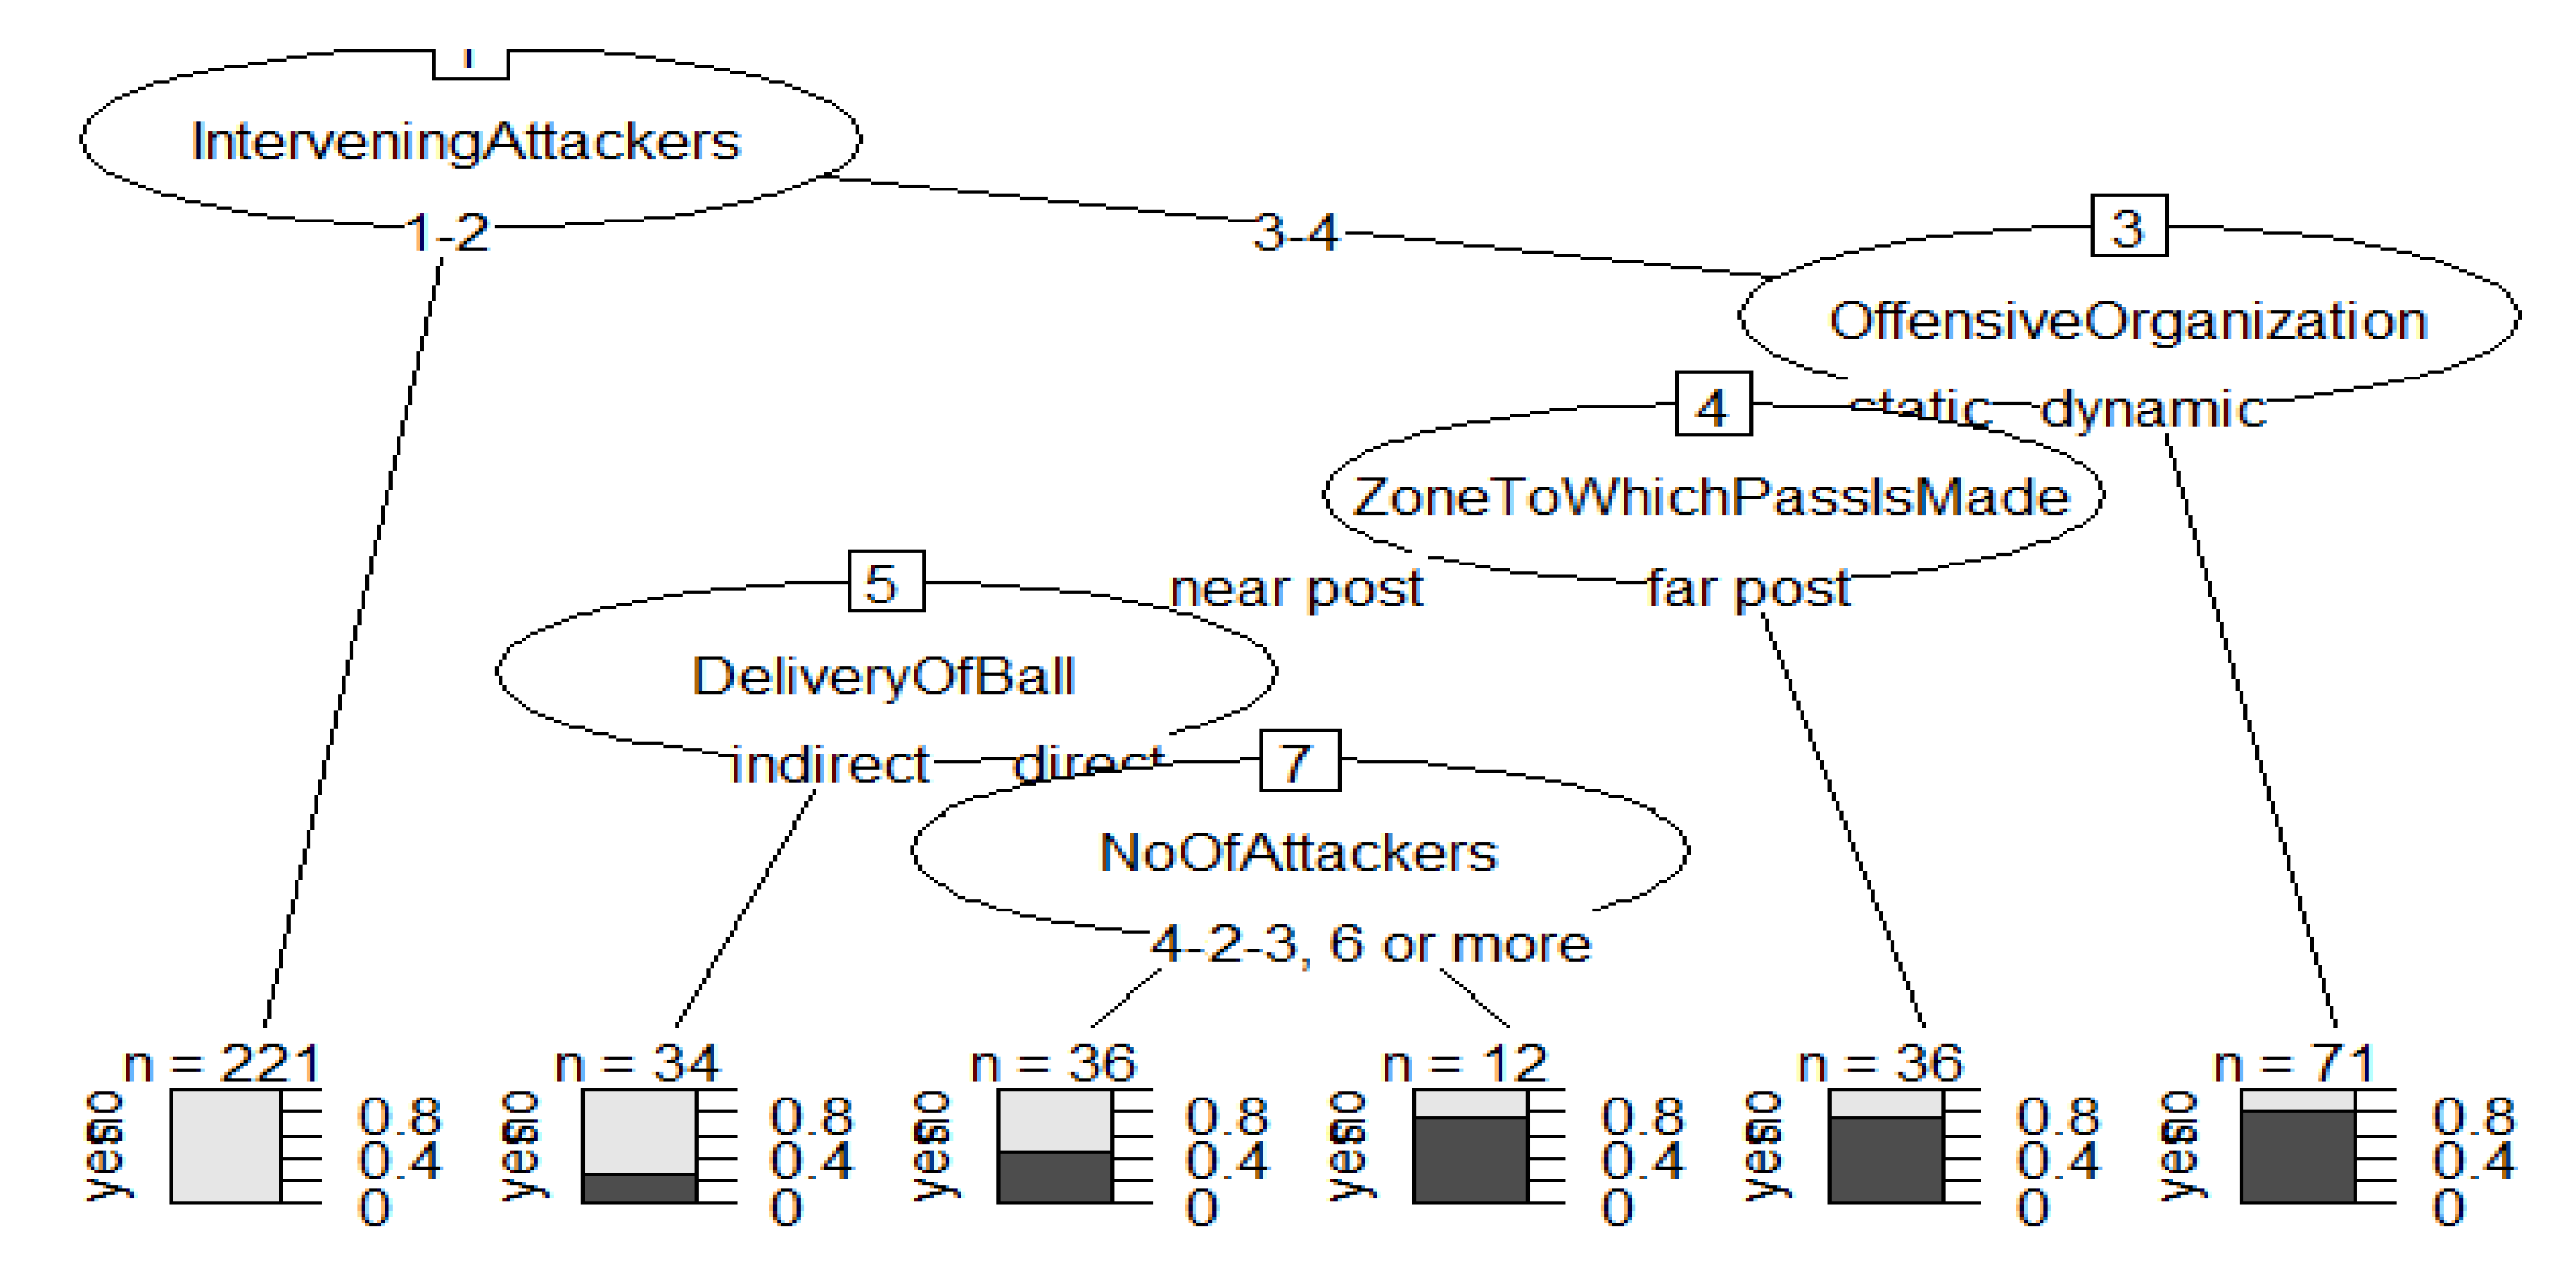
The terminal branches of this tree are six. The root node is criterion1.Shot with 410 observations and 120 losses, with a 70.73% probability of not obtaining criterion1.Shot, and a 29.26% of obtaining it. Combined with InterveningAttackers = 1–2 and its 221 observations and a loss of 2, it obtained a 99.09% chance of not getting criterion1.Shot and 0.90% of getting it.
Another terminal branch is formed by InterveningAttackers = 3–4 → OffensiveOrganization = static → DeliveryOfBall = indirect, with a total of 34 observations and a loss of 9 with a probability of not achieving criterion1.Shot of 73.52% and a probability of achieving it of 26.47%. The third branch of the decision tree would be formed by InterveningAttackers = 3–4 → DeliveryOfBall = direct → NoOfAttackers = 4–5 with 36 observations and 16 losses. The probability of not reaching criterion1.Shot was 55.55% and 44.44% of achieving it. Branch four would be formed by InterveningAttackers = 3–4 → DeliveryOfBall = direct → NoOfAttackers = 2–3, between 6 and 12 observations with 3 losses and with a probability of not reaching criterion1.Shot of 25% and therefore a probability to achieve criterion1.Shot of 75%. The fifth terminal node presents the following Development: InterveningAttackers = 3–4 → OffensiveOrganization = static → ZoneToWhichPassIsMade = far post with 36 observations and a loss of 9, where the probability of not achieving criterion1.Shot was 25% and of achieving it 75%. The last terminal node was configured InterveningAttackers = 3–4 → OffensiveOrganization=dynamic with 71 observations with 14 losses where the probability of not getting criterion1.Shot was 19.71% and of getting criterion1.Shot was 80.28% (
Figure 3).
This model can be evaluated in terms of prediction (
Table 10), in such a way that it is verified that it has predicted that there is no “criterion1.Shot” a total of 69 times when it really has not been given, and 11 times when “criterion1.Shot” really has been given. The model estimates that the “criterion1.Shot” has not occurred 13 times when it has actually not occurred. The model says that “criterion1.Shot” does not occur 35 times when “criterion1.Shot” has actually been given.
Finally, the effectiveness of the model is evaluated, adding all the successes and dividing by the number of predictions, obtaining an effectiveness of 81.25% of successes.
Training data
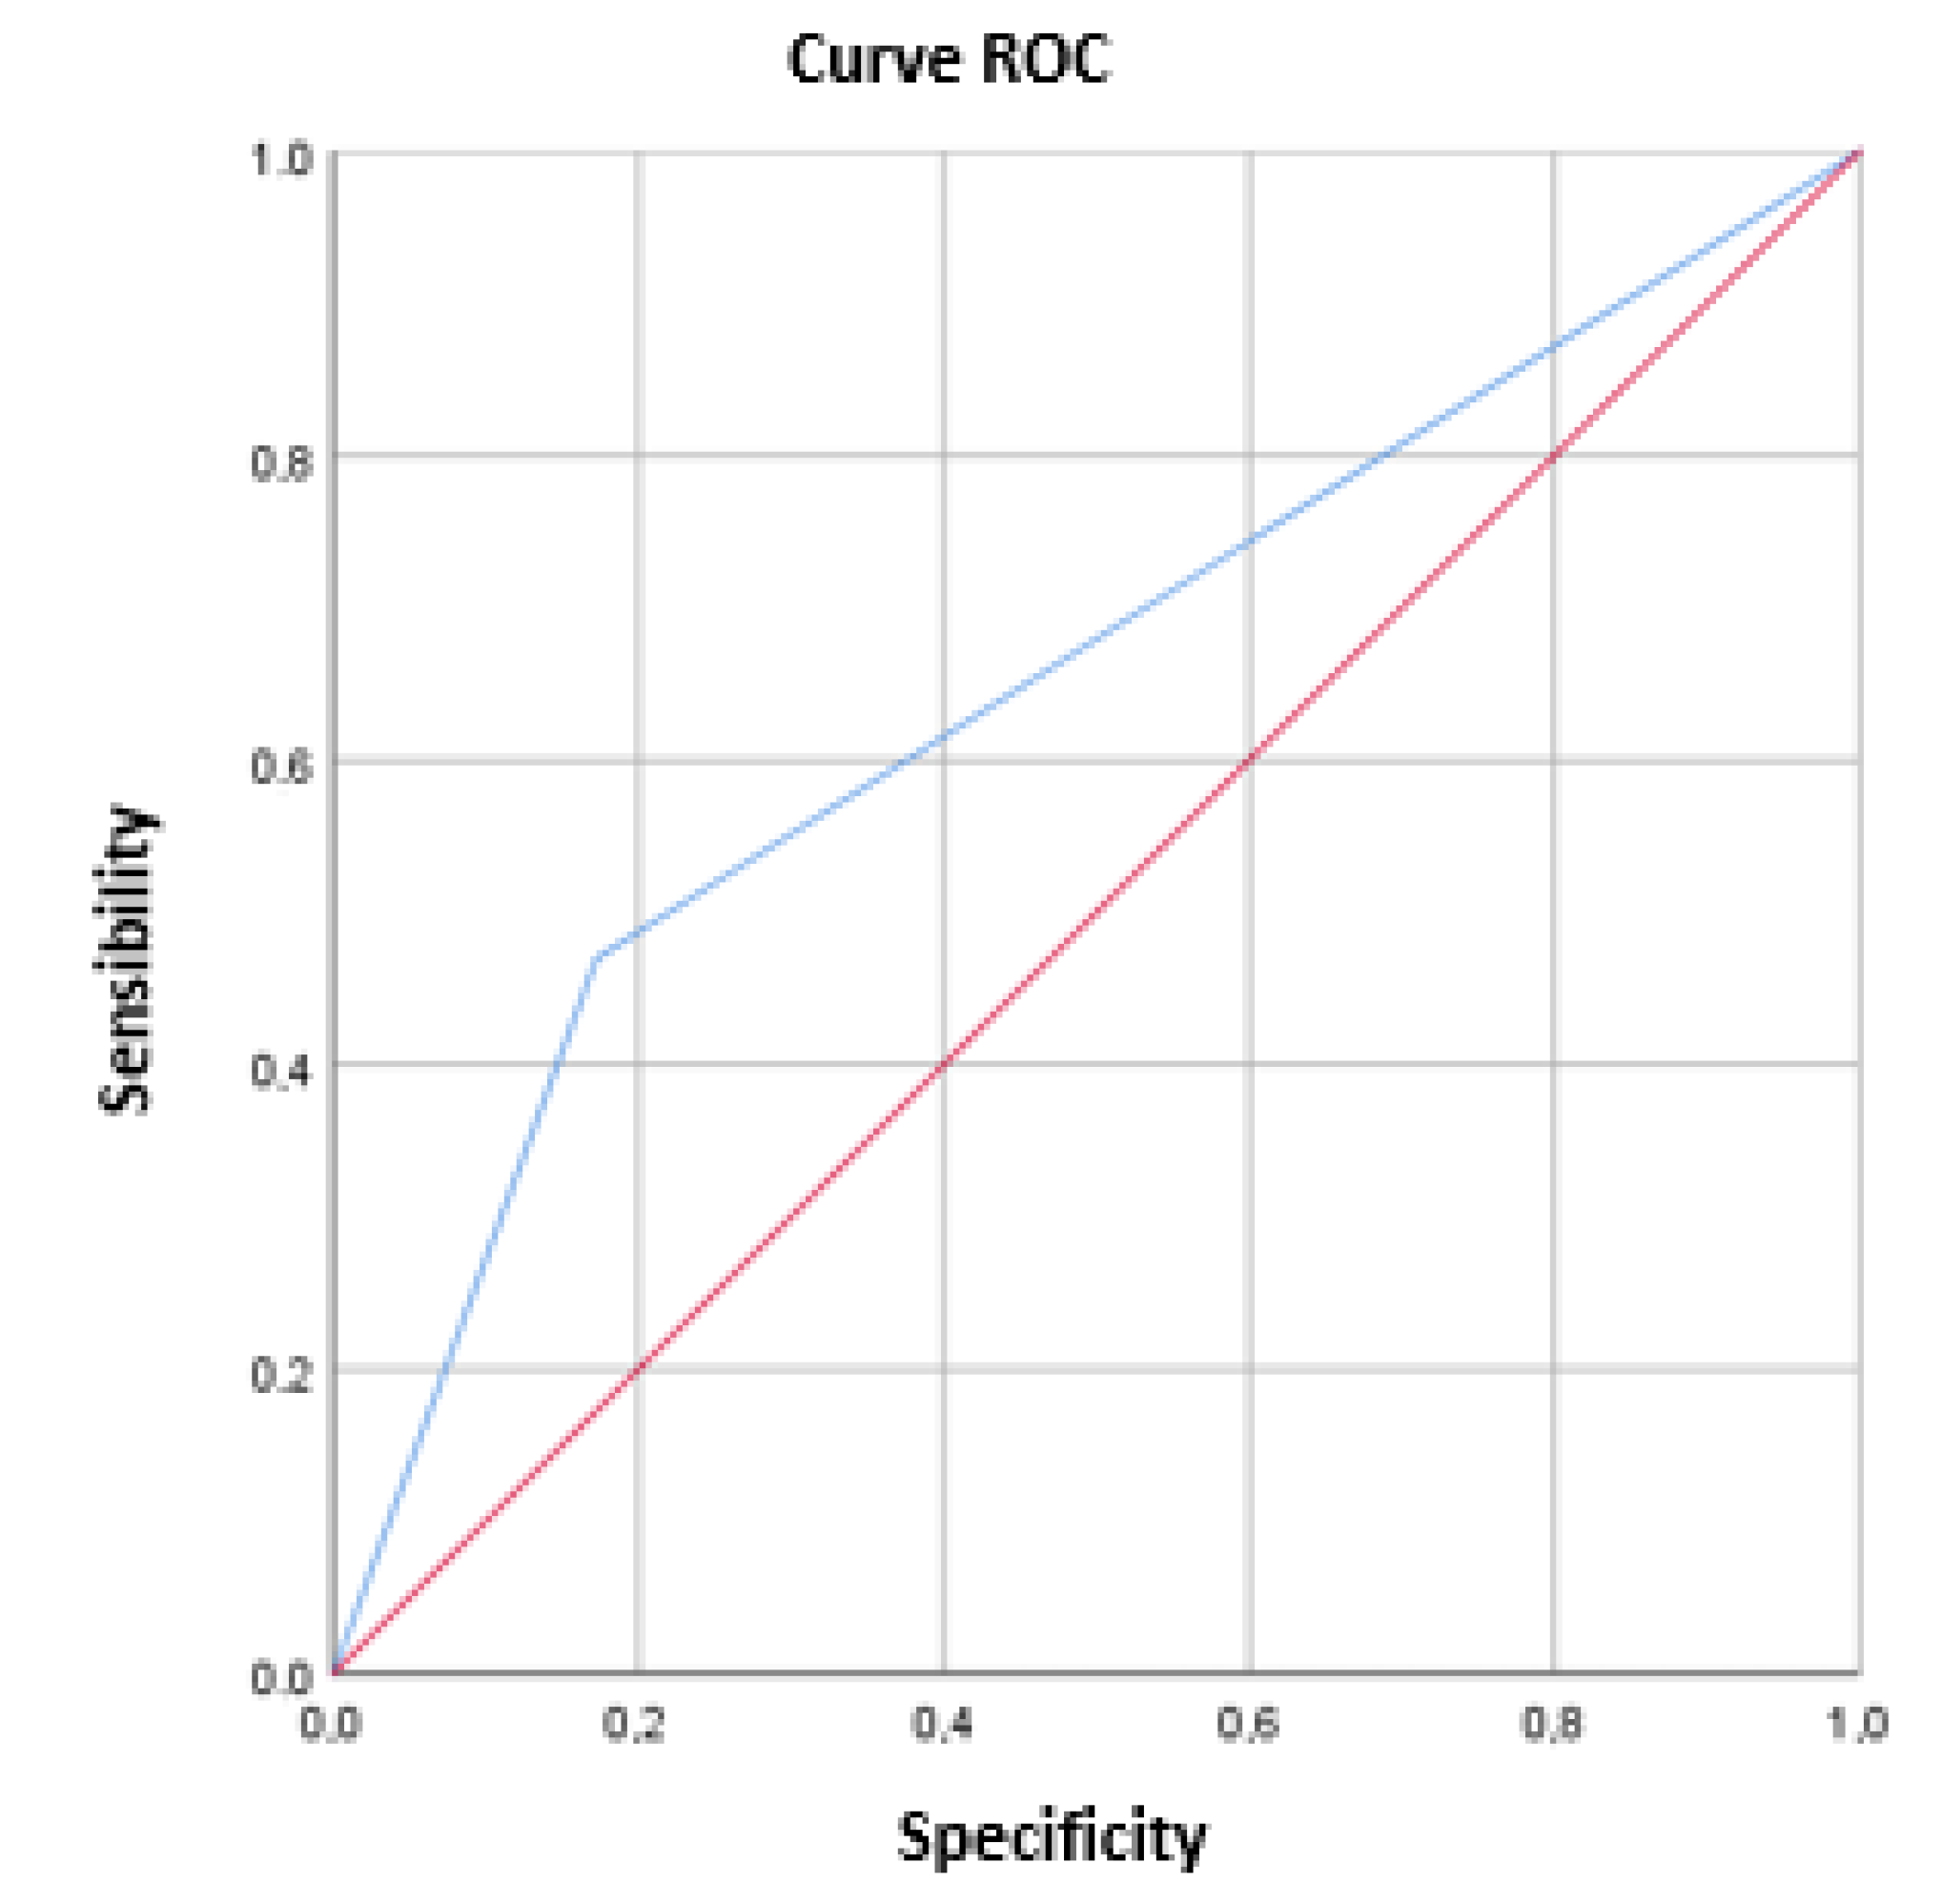
The area under the curve is 0.649 with a deviation of 0.022. In
Table 11 below, the learning model is presented.
Below is a table with the results of prediction accuracy, error rate, precision, sensitivity, specificity and F1 score (
Table 12).
3.3.3. FIFA World Cup 2018
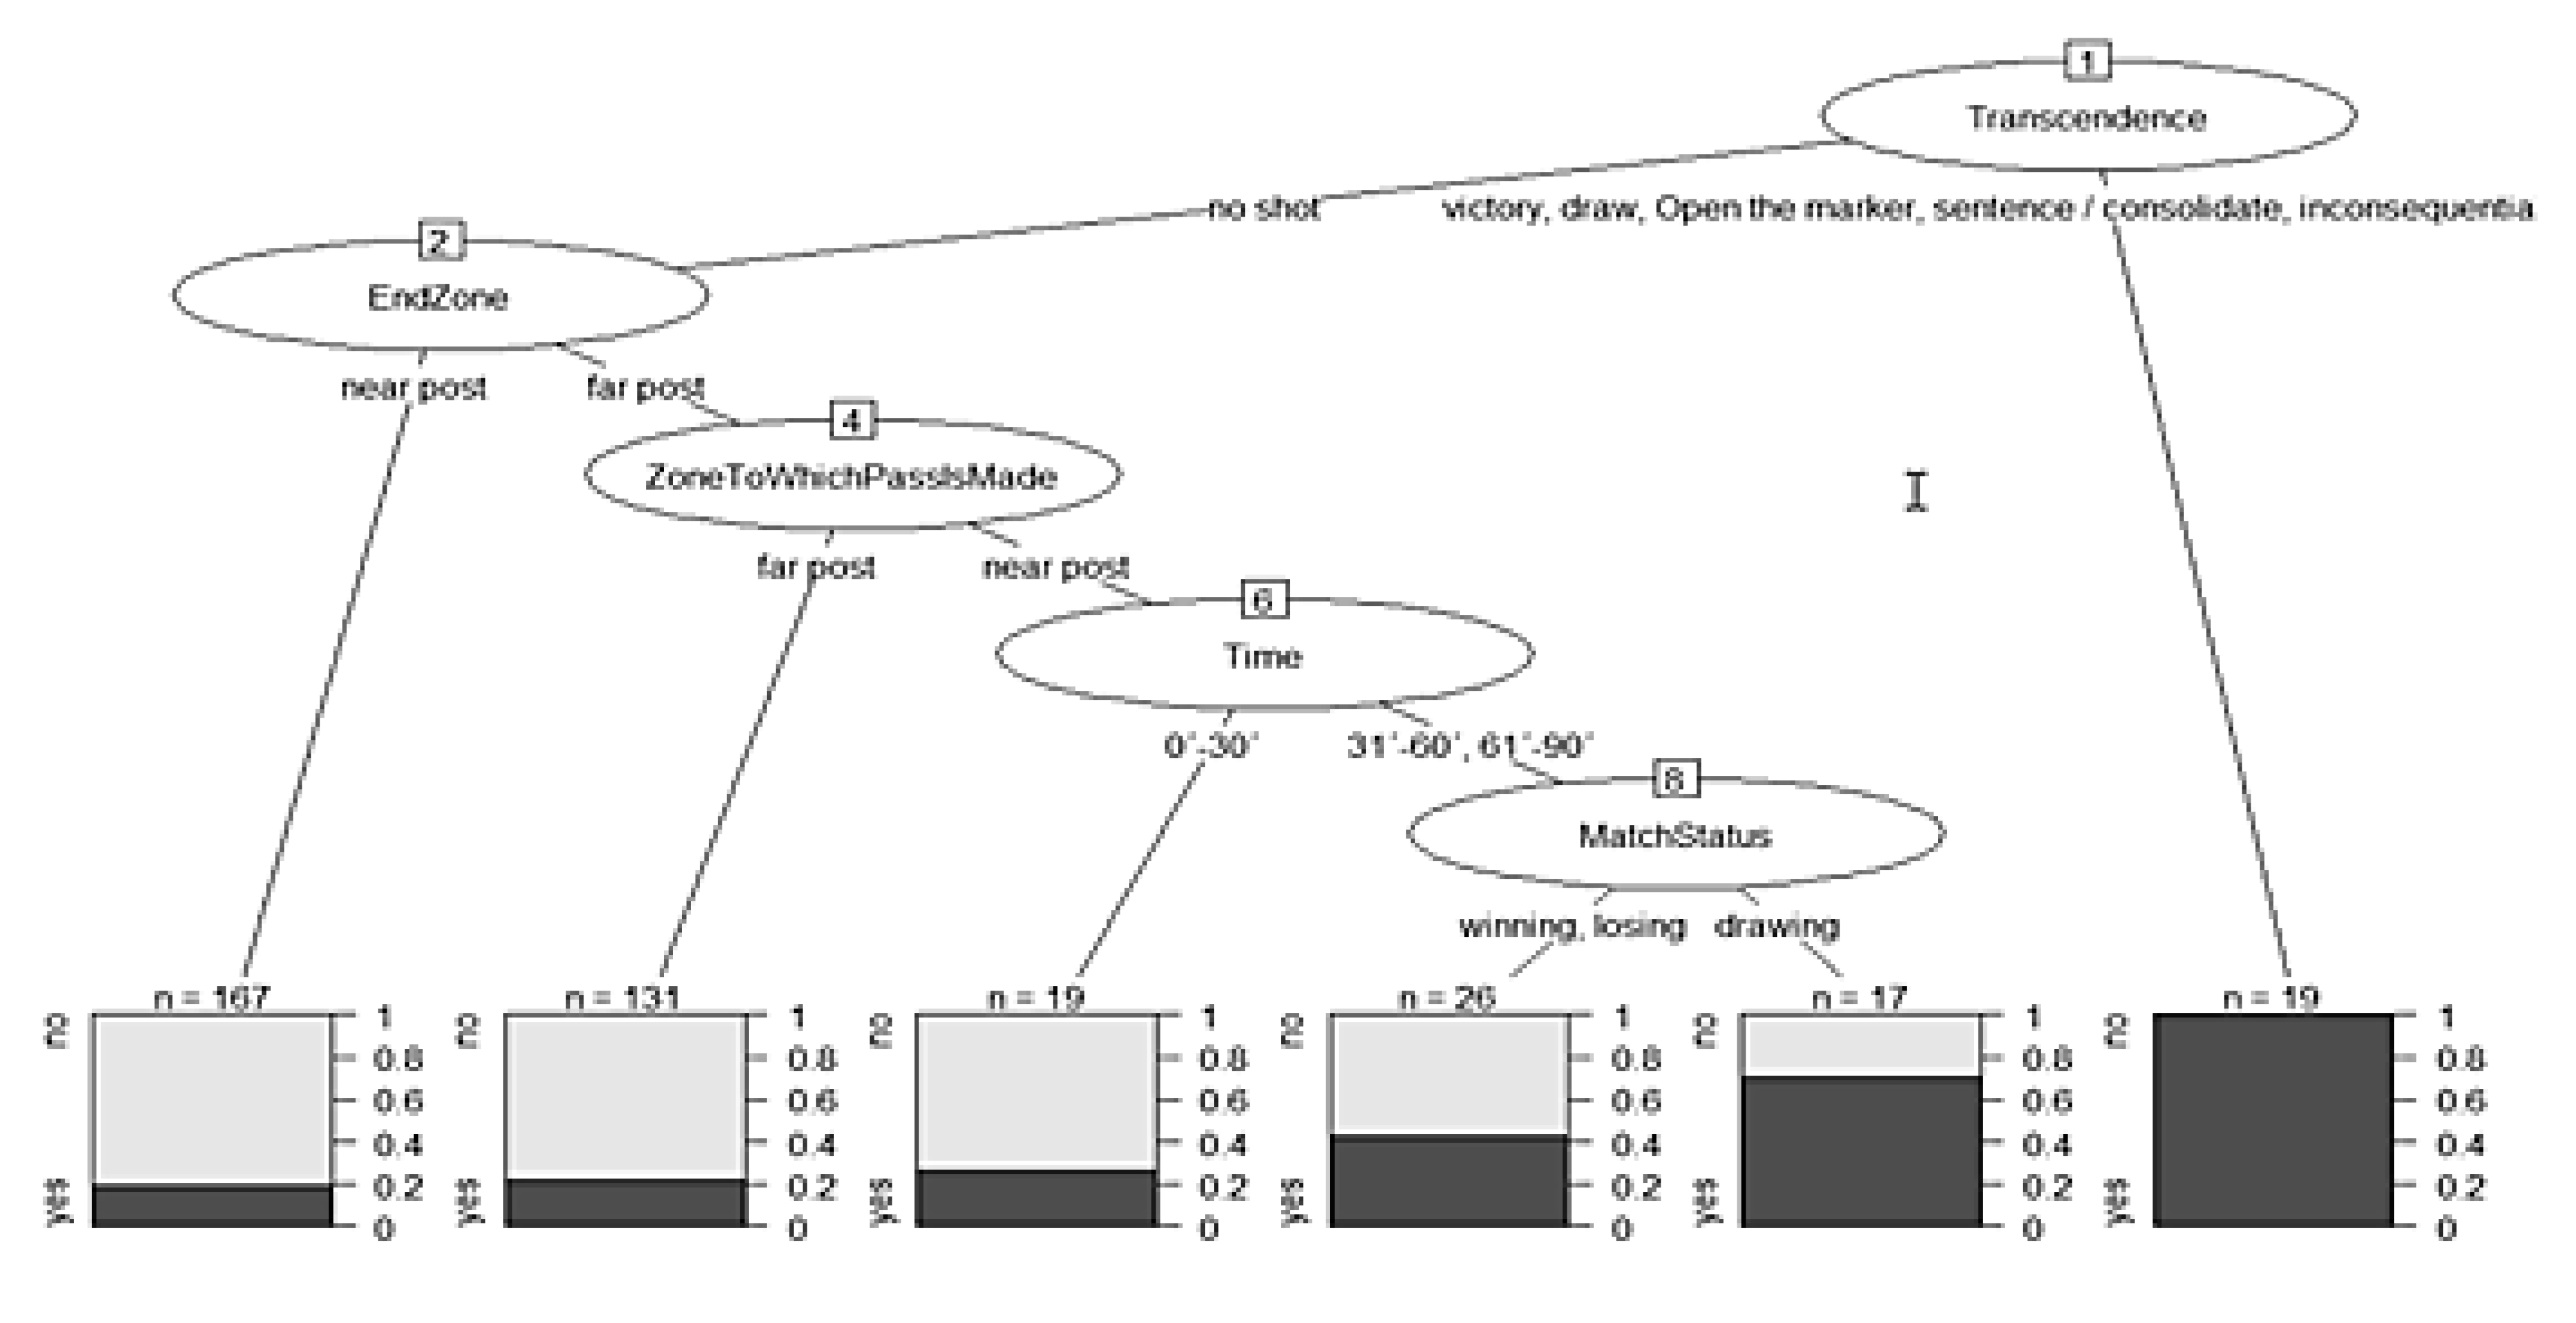
The root node was formed by 379 observations with 109 losses and with a probability of not achieving criterion1.Shot of 71.24% and a probability of achieving it of 28.75%. The first terminal node is formed by: Transcendence = no → shot EndZone = near post with 167 observations and 33 losses; it has a probability of not getting criterion1.Shot of 80.23% and 19.76% of getting it. The second terminal node: Transcendence = no shot → EndZone = far post → ZoneToWhichPassIsMade = far post, with 131 observations and 29 losses with a probability of not obtaining criterion1.Shot of 77.86% and 22.13% obtaining it. The third terminal node was Transcendence = no shot → EndZone = far post → ZoneToWhichPassIsMade = near post → Time = 0’–30’ with 19 observations and 5 missed. The probability of not achieving criterion1.Shot was 73.68% and of achieving it was 26.31%. The fourth terminal node: Transcendence = no shot → EndZone = far post → ZoneToWhichPassIsMade = near post → Time = 31’–60’, 61’–90’ → MatchStatus = winning, losing, based on 26 observations with 11 losses and the probability of not obtaining criterion1.Shot was 57.69%, and to obtain it, 42.30%. The fifth terminal node: Transcendence = no shot → EndZone = far post → ZoneToWhichPassIsMade = near post → Time = 31’–60’, 61’–90’ → MatchStatus = drawing had 17 observations with a loss of 5, generating a probability of not achieving criterion1.Shot of 29.41% and 70.58% of achieving it. Finally, the sixth terminal node: Transcendence = victory, draw, Open the marker, sentence/consolidate, inconsequential, help to victory with 19 observations and no losses, had a probability of achieving criterion1.Shot of 100% (
Figure 5).
It is verified that the model has predicted that there is no “criterion1.Shot” a total of 63 times when it really has not been given, and 4 times when “criterion1.Shot” really has been given. The model estimates that the “criterion1.Shot” has not occurred 29 times when it has actually not occurred. The model says that “criterion1.Shot” does not occur 9 times when “criterion1.Shot” has actually been given 9 times.
Finally, the effectiveness of the model is evaluated, adding all the successes and dividing by the number of predictions, obtaining an effectiveness of 69.57% of successes.
The area under the curve is 0.560 with a deviation of 0.016. Below, in
Table 14, the learning model is presented.
Below is a table with the results of prediction accuracy, error rate, precision, sensitivity, specificity and F1 score (
Table 15).
Analyzing the results, similar results are found in the FWC2010 and FWC2014 competitions, although with notable differences. Specifically, for both championships the algorithm selects the criterion “intervening attackers” as the one that presents the most information gain. When 3–4 players intervene and the corner kick is executed 61–90‘, the probability of finishing on goal is 88%. On the other hand, in FWC2014, with the intervention of 3–4 attackers, and dynamic offensive organization, the probability of getting a shot is 80.28%. Finally, in the FWC2018, all the goals have contributed to add points to the teams, but instead the “no shot” predicts and classifies better.
4. Discussion
The main objective of this study was to find out the possible differences in the execution and tactical approach of one of the most important set pieces actions in high-performance soccer, such as corner kicks. Studies such as the one by Carling et al. [
1] have shown that these are actions of high regularity, with different forms of execution [
25], which produce very important goals in decisive moments for the teams [
6] although of reduced effectiveness [
8,
11].
Knowing the evolution of the tactical behavior associated with corner kicks in high–level football stands as an important aspect in order to continue deepening the criteria of effectiveness of these actions, which according to previous literature is between 2% and 4% (1:50) [
5,
16]. Specifically, it takes 50 corner kicks to reach a goal, 10 to reach a shot between the three goalposts, and 4 to reach a shot.
A first interpretation that emerges as a result of the results presented in
Table 2 confirms that the offensive and defensive tactical approach to corner kicks has changed over the last three world championships. This shows that high-performance football, and more specifically corner kicks, are not immobile and fixed tactical situations, but rather evolve by adapting according to gender (men’s or women’s football) [
5,
13], to the type of defense used and the goalkeepers (Kubayi & Larkin, 2019), the circumstances of the competition [
24], the different players [
25], as well as depending on the match status [
23].
At the offensive level, it is possible to verify that the teams attack more in the first third of the game (0–30’), since they execute more deliveries at this moment of the game, than in the previous FIFA World Cups (p = 0.003). This may be due to the different styles of play implemented by the teams, where from the first minutes they look for greater options to get ahead on the scoreboard.
Regarding the number of attacking players ready to shoot on goal, it is possible to affirm that the number of players within the area has increased significantly (
p = < 0.001) in the last three world championships. This shows that offensive soccer has changed, and that teams are currently more offensive, with a greater number of players attacking in search of finishing the move [
40]. This increase in the will to attack in professional football may be due to the low success rate of the attacks, since it only reaches 1% in dynamic play [
41], and 2.3% in set pieces [
16,
42].
Regarding the delivery of the ball to the finishing area (penalty area), most of the deliveries are made by direct shots and by air routes. Once again, it is possible to verify that despite the fact that the variable that improves the prediction of the shot on goal is the one that involves 3–4 players [
6], the teams opt for a quick finish on goal, with only the intervention of the server and auctioneer.
Regarding the area for delivering and finishing the corner kick, once again the teams opt for delivering and finishing at the first post of the goal, a fact that corroborates previous studies [
1].
Regarding the match status at the time of executing the corner kick, it is possible to verify that more and more actions are executed with the team losing on the scoreboard. This a priori may be logical, since losing invites teams to seek more attack in order to equalize the score.
Finally, with regard to the results of the log linear analysis (
Table 6), an independence model of three specific variables was proposed, such as: “Match Status”, “Time” and “Intervening Attackers”. Based on the results in
Table 6, it is possible to affirm that in the three FIFA World Cups, the teams have a higher probability of winning on the scoreboard with the intervention of 3–4 players. This result is especially outstanding, since on the one hand it corroborates previous studies that highlighted the need to provide more tactical construction to corner kicks [
5,
6]; and on the other hand it highlights that the usual practices of the teams in these actions (based on more than 90% of direct deliveries, where potentially only 1–2 players intervene) are clearly ineffective (recent studies confirm that through this conduct, only a goal is scored in 1 out of every 50 corner kick).
On the other hand, and due to the different styles of play implemented and the technical and tactical characteristics of the different players who have participated in the three FIFA World Cups analyzed, it is possible to affirm that the probability of winning during the different championships is higher in the last third of the game (61–90’) (OR = 4.19 for FWC2010; OR = 4.67 for FWC2014; OR = 4.80 for FWC2018). This confirms that the best teams impose their individual and collective quality in the final moments of the match.
Finally, decision tree-based analysis made it possible to predict, classify, and segment the variables considered in the present study, in addition to creating a classification model based on flow diagrams. The criterion1: shot has been selected, since it is of interest to know which is the most robust predictor variable associated with the shot on goal in this type of action. This would provide the different teams with recommendations at the offensive level to achieve a shot on goal in the highest-level football, such as the FIFA World Cup.
Specifically, for the FIFA World Cup 2010, with the intervention of 1–2 attackers, only 20% of the corner kicks were finished, on the other hand, with the intervention of 3–4 attackers in the last third of the match, almost 90% of the corner kicks are finished off. The reasons for these high percentages can be found in the rival team’s fatigue, the surprise generated by a corner kick executed under a minimum of elaboration and with the association of several players (it is important to remember that, in view of the results of the
Table 1, 81% of the actions are executed with direct delivery, and practically 88% only involve 1 or 2 players). These results confirm previous studies [
5], where mention is made of the last minutes of the match, as well as giving the corner kick a tactical elaboration involving more than two players. This can create uncertainty and surprise for the defending team, as their defensive positions are prepared for direct deliveries.
Regarding the decision tree for the 2014 FIFA World Cup championship, once again the variable that presents the greatest gain in information is the variable “intervening attackers”. Specifically, when 3–4 attackers intervene in the corner kick, through a dynamic offensive organization (with movements of the players), practically 80% of the actions are finished off. The same percentage occurs when the delivery is made to the far post, forcing defenders and rival goalkeeper to move, and change their starting positions. This can generate misalignments and doubts in the opponent’s defensive tactical approach, since they must maintain visual contact with the attackers and with the ball simultaneously.
Finally, the data collected in
Figure 5 refer to the 2018 FIFA World Cup. The variable with the greatest gain in information is the variable “transcendence”. This variable refers to the significance of the goal that is scored as a result of a corner kick. The specifications of this variable can be consulted in the study of [
16]. Specifically, the goals produced with the intervention of 3–4 attackers, which were finished off in the far post, have awarded points for the teams, or have been transcendental. These results once again show that, although a majority of corner kicks are sent to the near post of the goal [
2], the highest efficiency rates are found in the far post.
Making a comparison of the results for the 2010, 2014 and 2018 FIFA World Cup championships, it is possible to affirm that there are similarities and differences between the three analyzed championships. In the first place, and in relation to the 1: shot criterion, the number of attackers involved is the most important variable in the 2010 and 2014 championships. This corroborates previous studies [
5,
6], where similar results were found. On the other hand, the model does not find significant results for the 2018 championship. A possible explanation may be due to the evolution of football and its players in this type of competition, as recorded by Castellano, Perea and Hernández-Mendo [
43]. Differences are also found in the next node of the three arranged models. Specifically, the “time” criterion that appears in
Figure 1 highlights the importance of executing the corner kick in the final minutes to get a shot [
6], but on the other hand, in the 2014 and 2018 championships, it does not seem be an important criterion. One of the possible causes may be the intensity of the match, or the type of defense used [
44]. In previous works it is observed that teams evolve and adapt to the changing circumstances of the environment in these actions [
5].


