1. Introduction
There are multiple infrastructure-related safety and maintenance challenges that are likely to be mitigated or eliminated through the deployment of wireless and embedded smart sensors. Analysis of data from the Federal Railroad Administration’s (FRA) accident database during the period of 2000–2018 revealed that 24% of accidents on mainlines and sidings were attributed to track-related cause codes. A subset of these may have been prevented by knowing a component’s stress state and its relationship with the median time to failure for that asset. Additionally, the adoption and further development of vehicle-based track geometry and heath inspection systems have been undertaken at an accelerating pace. While tremendously successful, there are voids in their ability to inspect for certain conditions at a fine-grained level; thus, supplemental technologies and deployments are needed to supplement current and emerging track inspection technologies. By employing this layered approach to understand the state of health of individual components and systems, a better estimate of the Life Cycle Costs (LCC) associated with railway track infrastructure can be realized. Ultimately, this can result in improved and more sustainable asset utilization and overall safer railway operations.
Currently, there are both technological and financial limitations to achieving wide-scale deployment of “smart” infrastructure components. On a commercial scale, wheel impact load detector (WILD) sites have proven successful at improving the wheel health of the North American interchange rolling stock fleet [
1,
2]. While other wayside inspection systems have been successfully deployed (e.g., truck performance detectors (TPDs)), most focus on mechanical inspections, are wired, and are only deployed at strategic locations in most cases due to their substantial associated cost. Hence, there is an opportunity to address safety-related challenges within the industry by developing wireless, “smart” infrastructure sensing technologies that could be deployed collectively or individually (i.e., via modules).
Many novel sensing technologies have been developed and deployed over the past decade to answer individual questions about various challenges, components, and layers of the track superstructure and substructure [
3,
4,
5,
6,
7]; a portion of which has been funded by the FRA [
6,
7]. In parallel, wireless communication technologies have continued to evolve (i.e., smaller chips, longer range, decreased costs, etc.) while battery capacity and life have also increased, partially due to a reduction in power consumption. Therefore, there is an opportunity to couple these together to design and deploy “smart” infrastructure technologies that could provide powerful vertically-integrated systems with multiple “smart” sensing devices to autonomously communicate their stress-state [
8,
9,
10,
11].
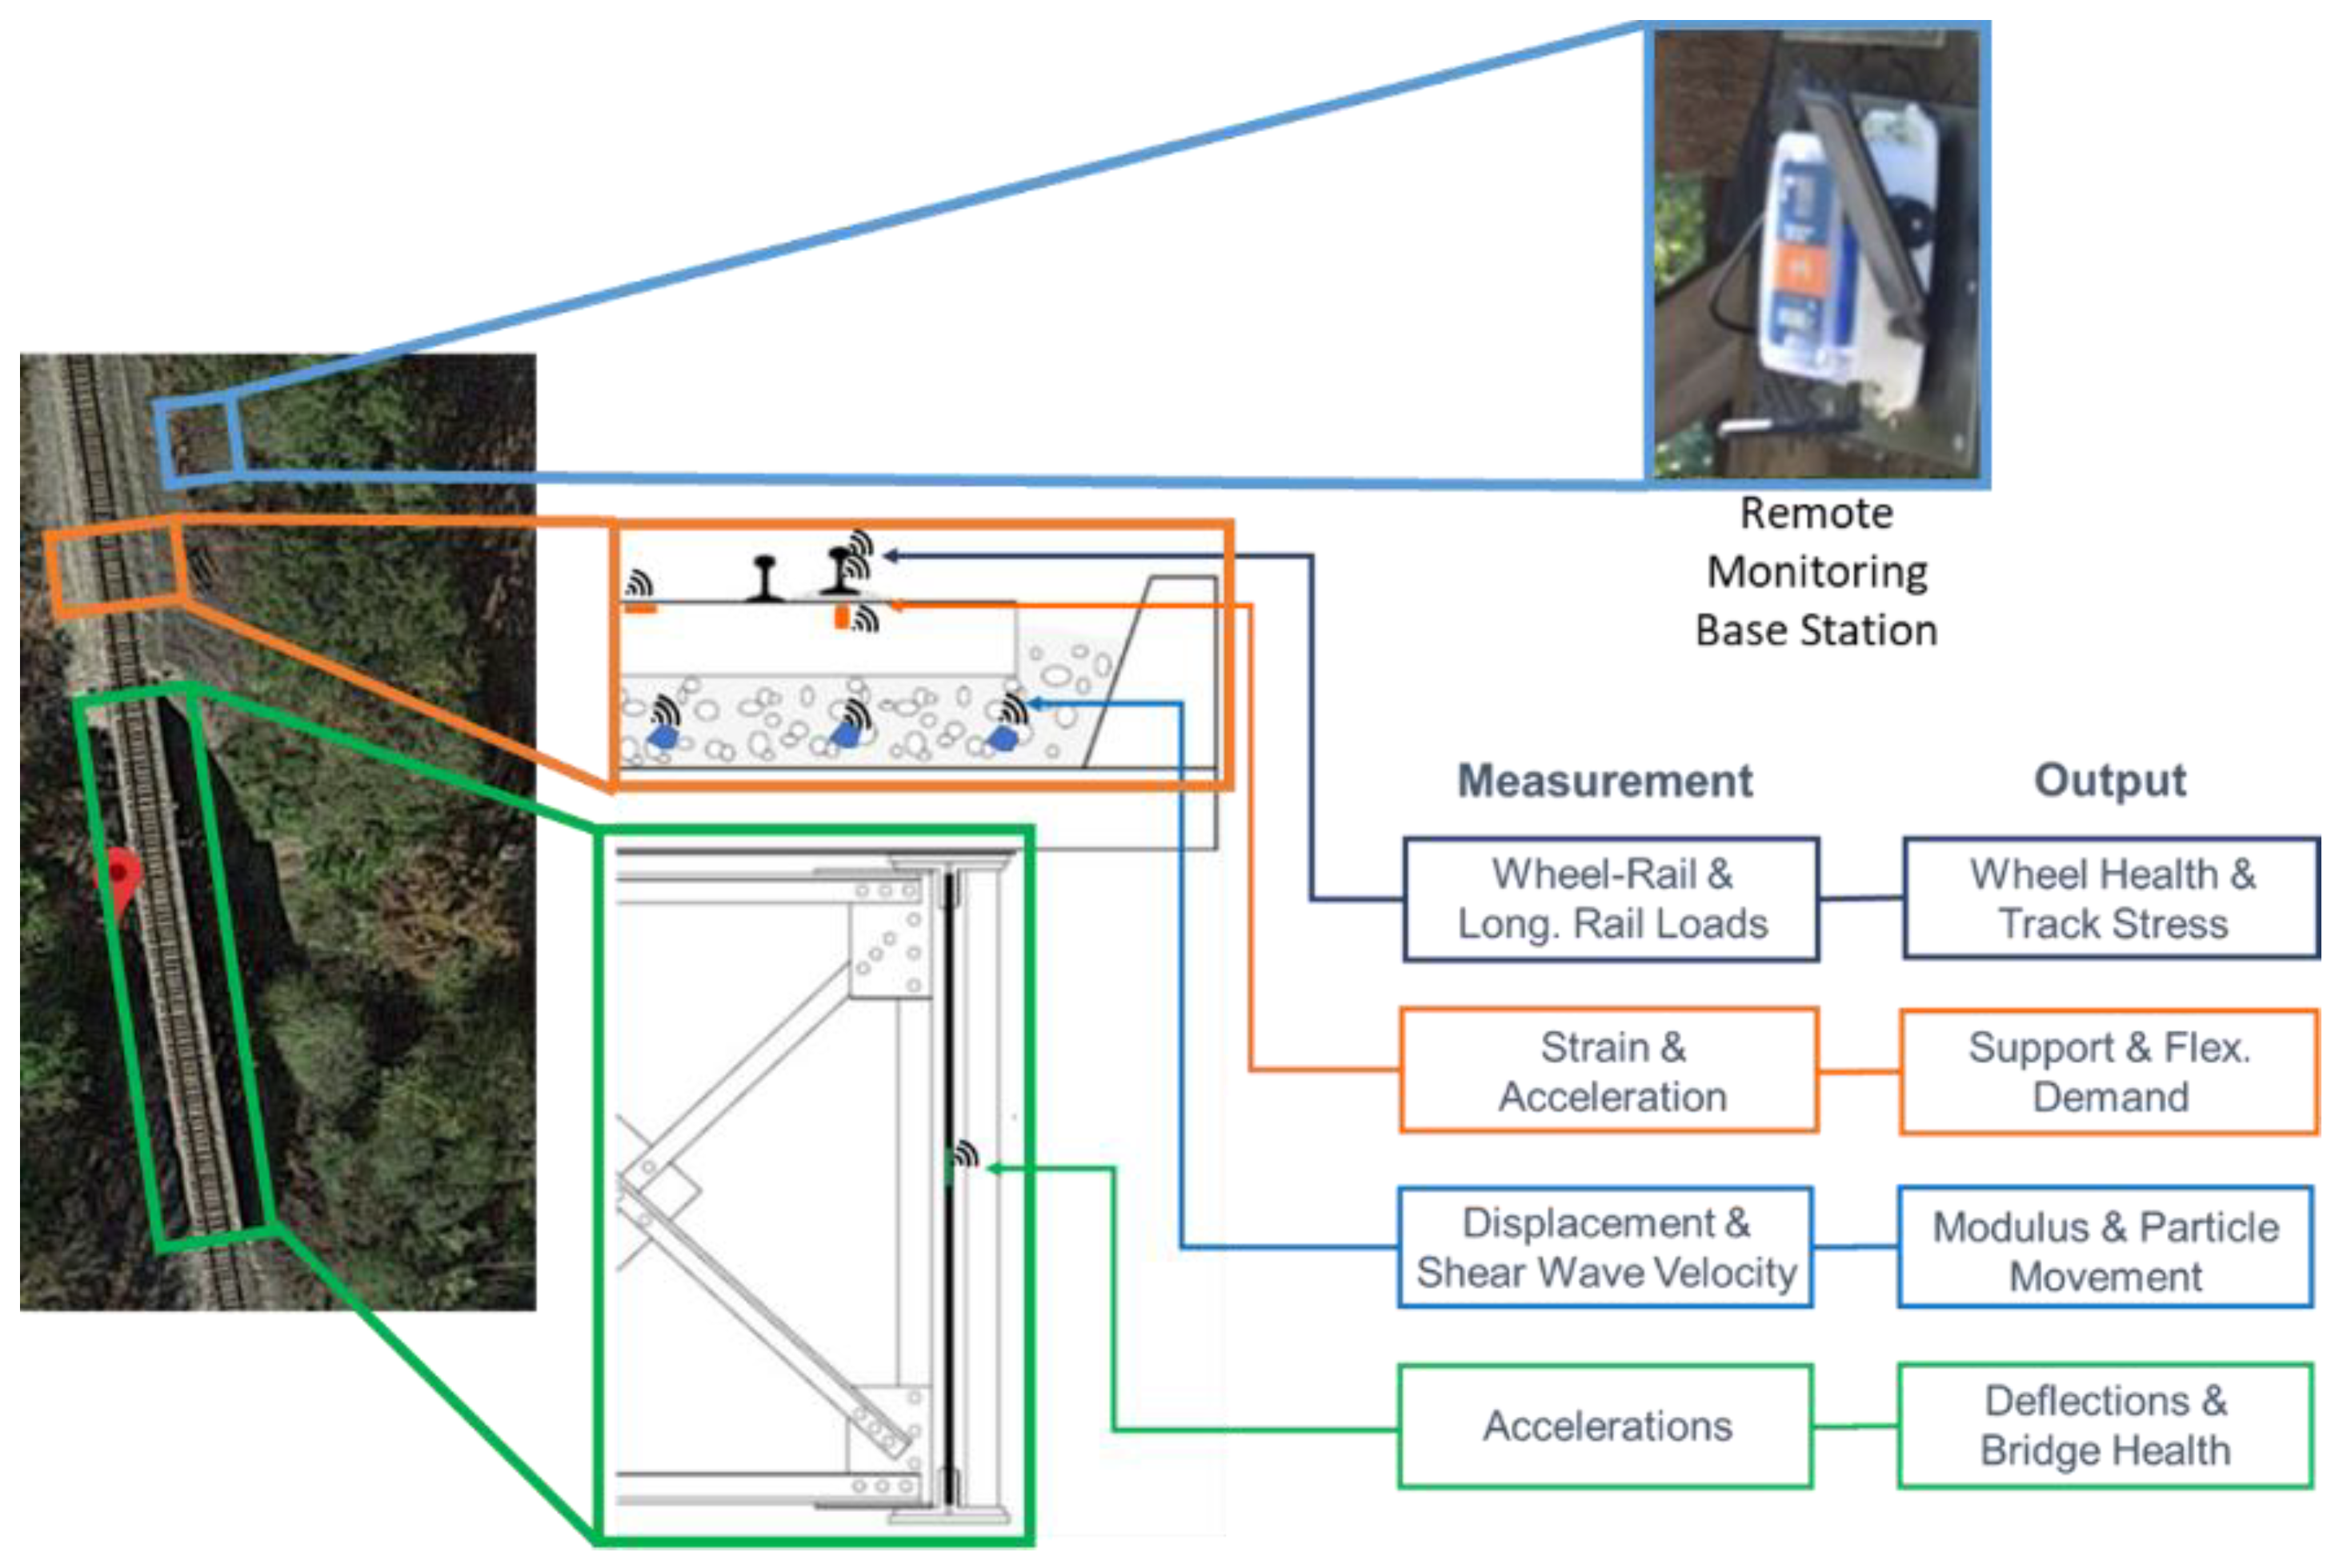
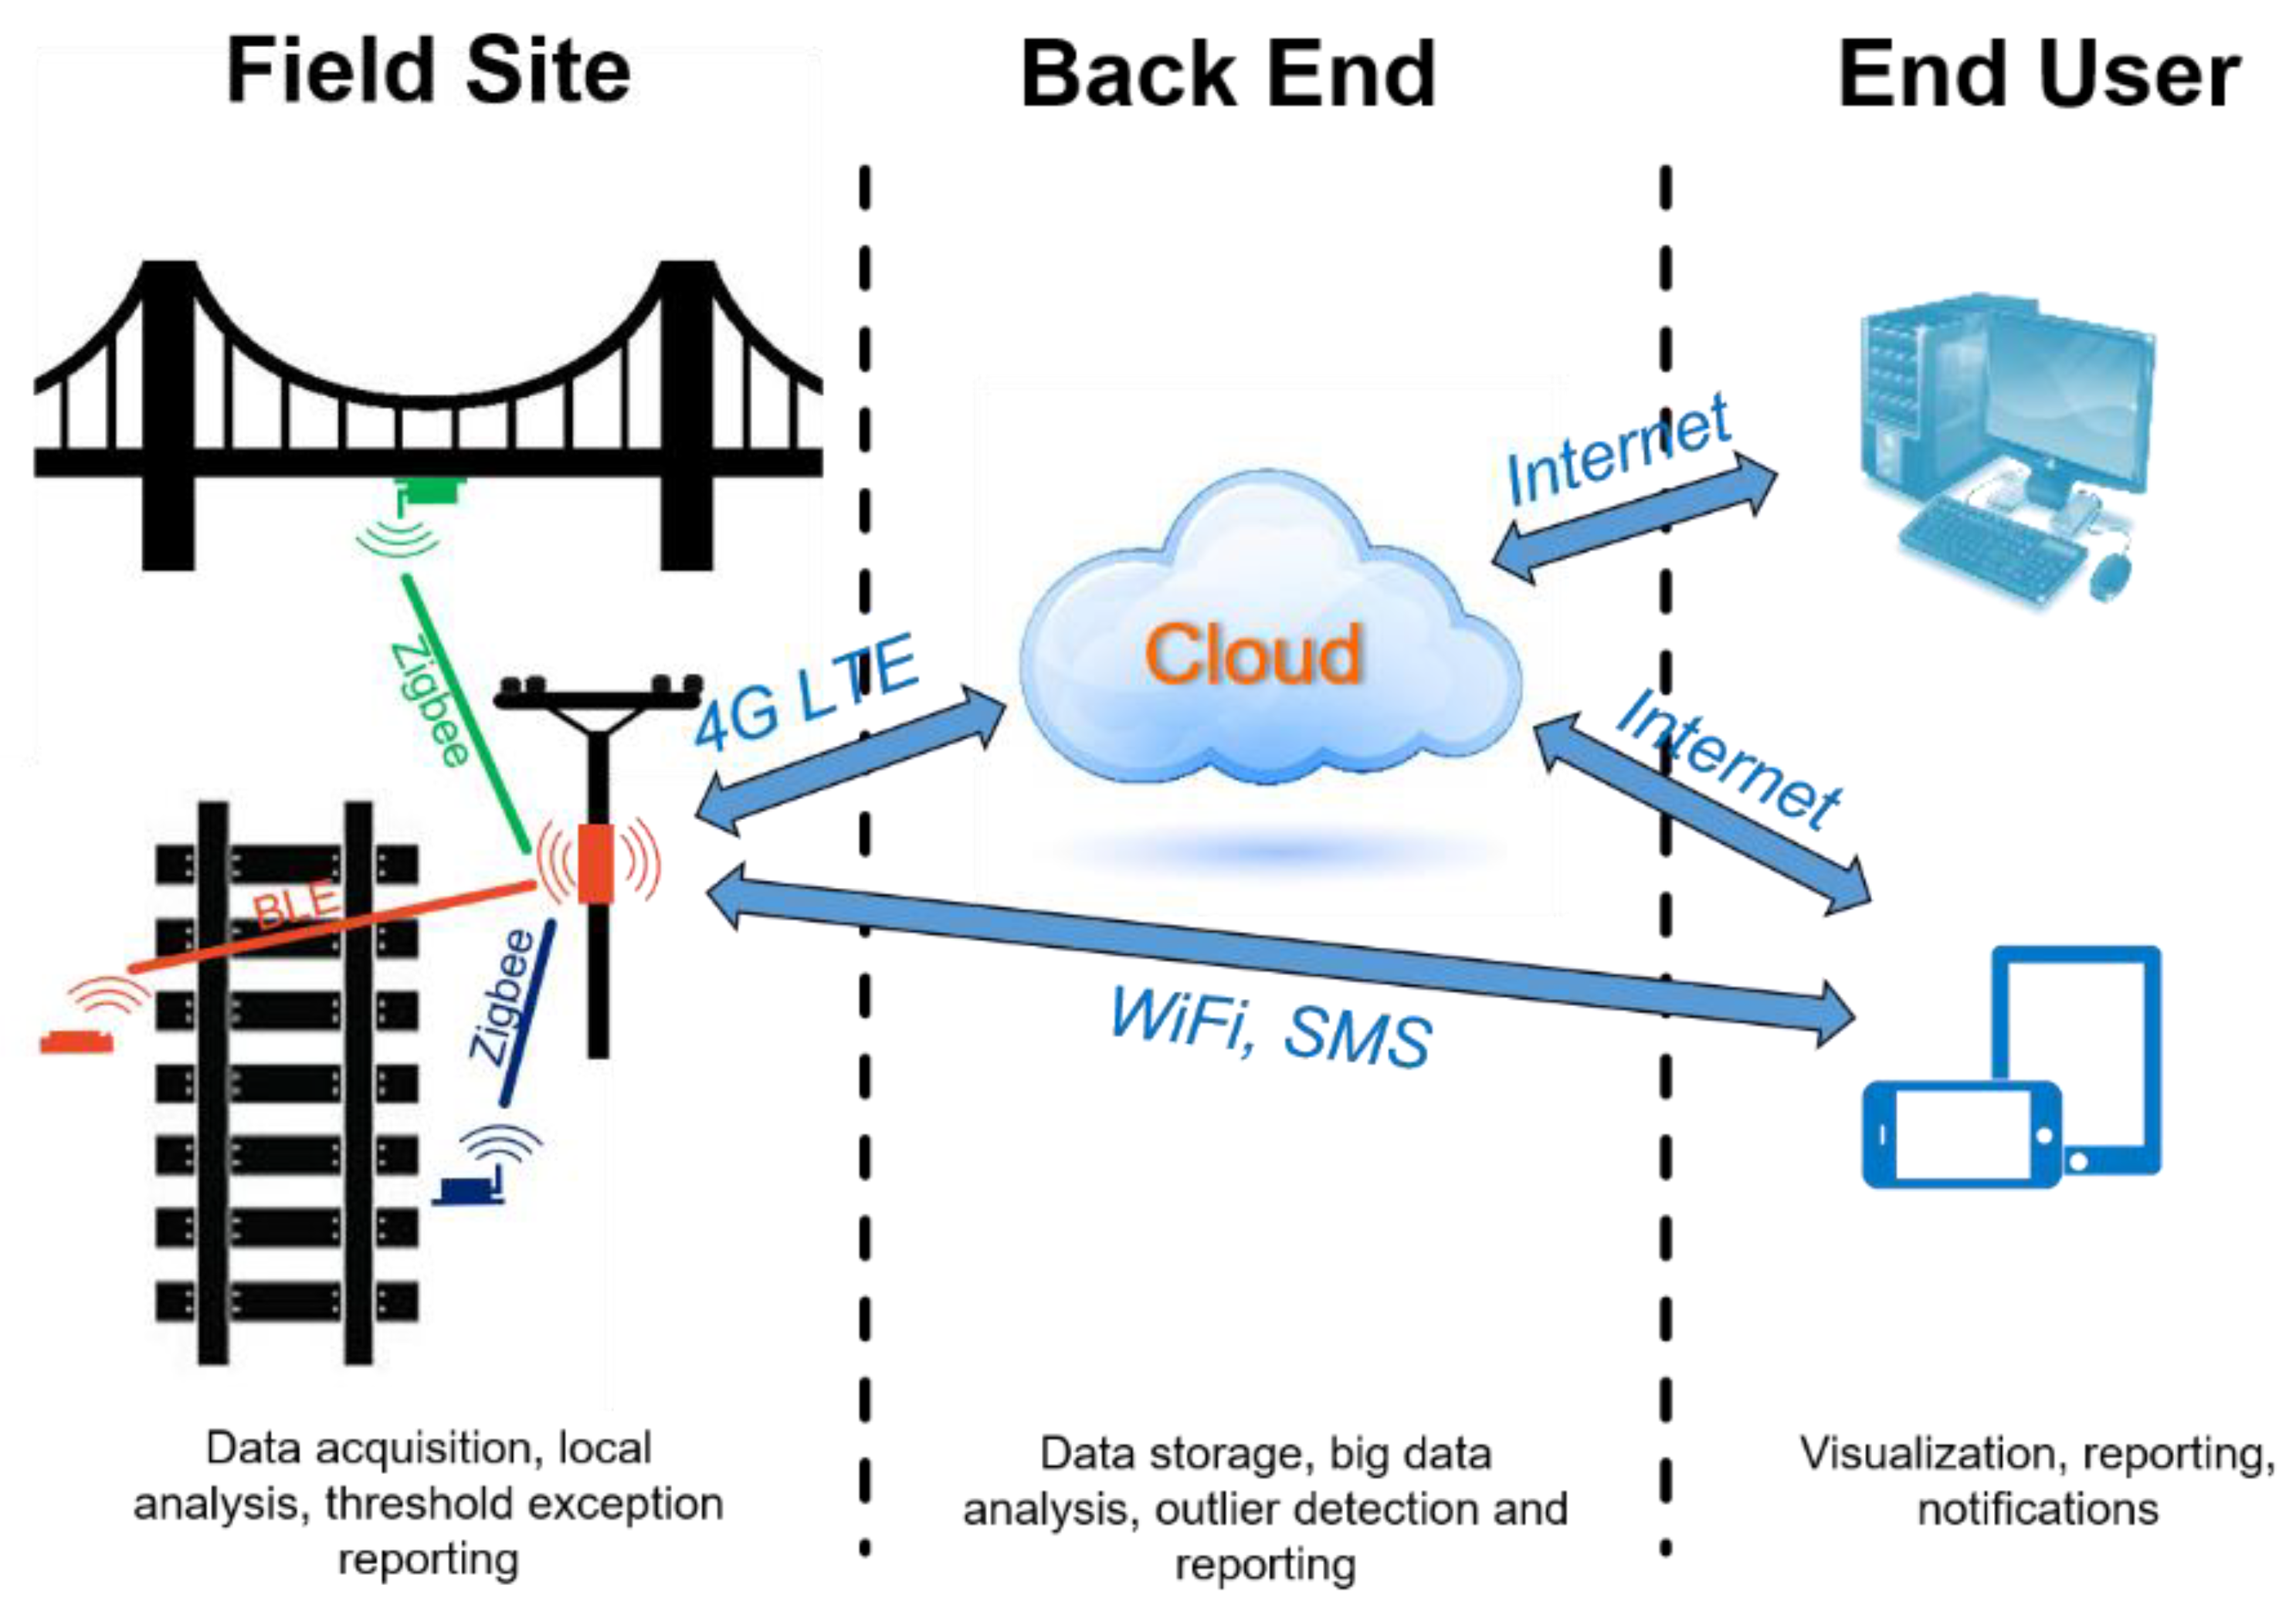
The objective of this research project (hereafter referred to as “Smart Track”) was to create the framework and establish a conceptual design for a wayside smart sensor site capable of inspecting critical assets and providing exception reporting. The design is based on the understanding of current industry inspection and monitoring needs, an analysis of FRA track-caused accident data, and a state-of-the-art understanding of wireless communication technology. This objective was achieved through the proposed development of embedded methodology, using wireless, “smart” infrastructure technologies capable of autonomously transmitting “state-of-repair” exception reports. This serves the rail industry by both increasing safety and improving infrastructure reliability. A conceptualized Smart Track field site is shown in
Figure 1.
This conceptual design will help to facilitate the development and execution of future field experimentation by developing and refining a list of guiding questions through the available data and execution of an industry survey. Once guiding questions are identified, the required “smart” infrastructure to address each question will be determined. The conceptual design also included a technology readiness “gate review” considering instrumentation hardware, communication protocols, and data collection software. Relevant data from each “smart” infrastructure component were evaluated, and a means to integrate the data collection and the system communications were explored. Further, the research team developed a standardized communication protocol and data transfer methods through a standard gateway to ensure successful time synchronization when necessary.
2. Methodology
The efficient and effective implementation of smart monitoring technologies requires prioritization of track inspection needs. In this project, prioritization focused on improving safety and addressing state-of-good-repair needs described by rail industry experts. To address safety improvement, a risk-based analysis of U.S. track-caused accidents was conducted using FRA’s accident database.
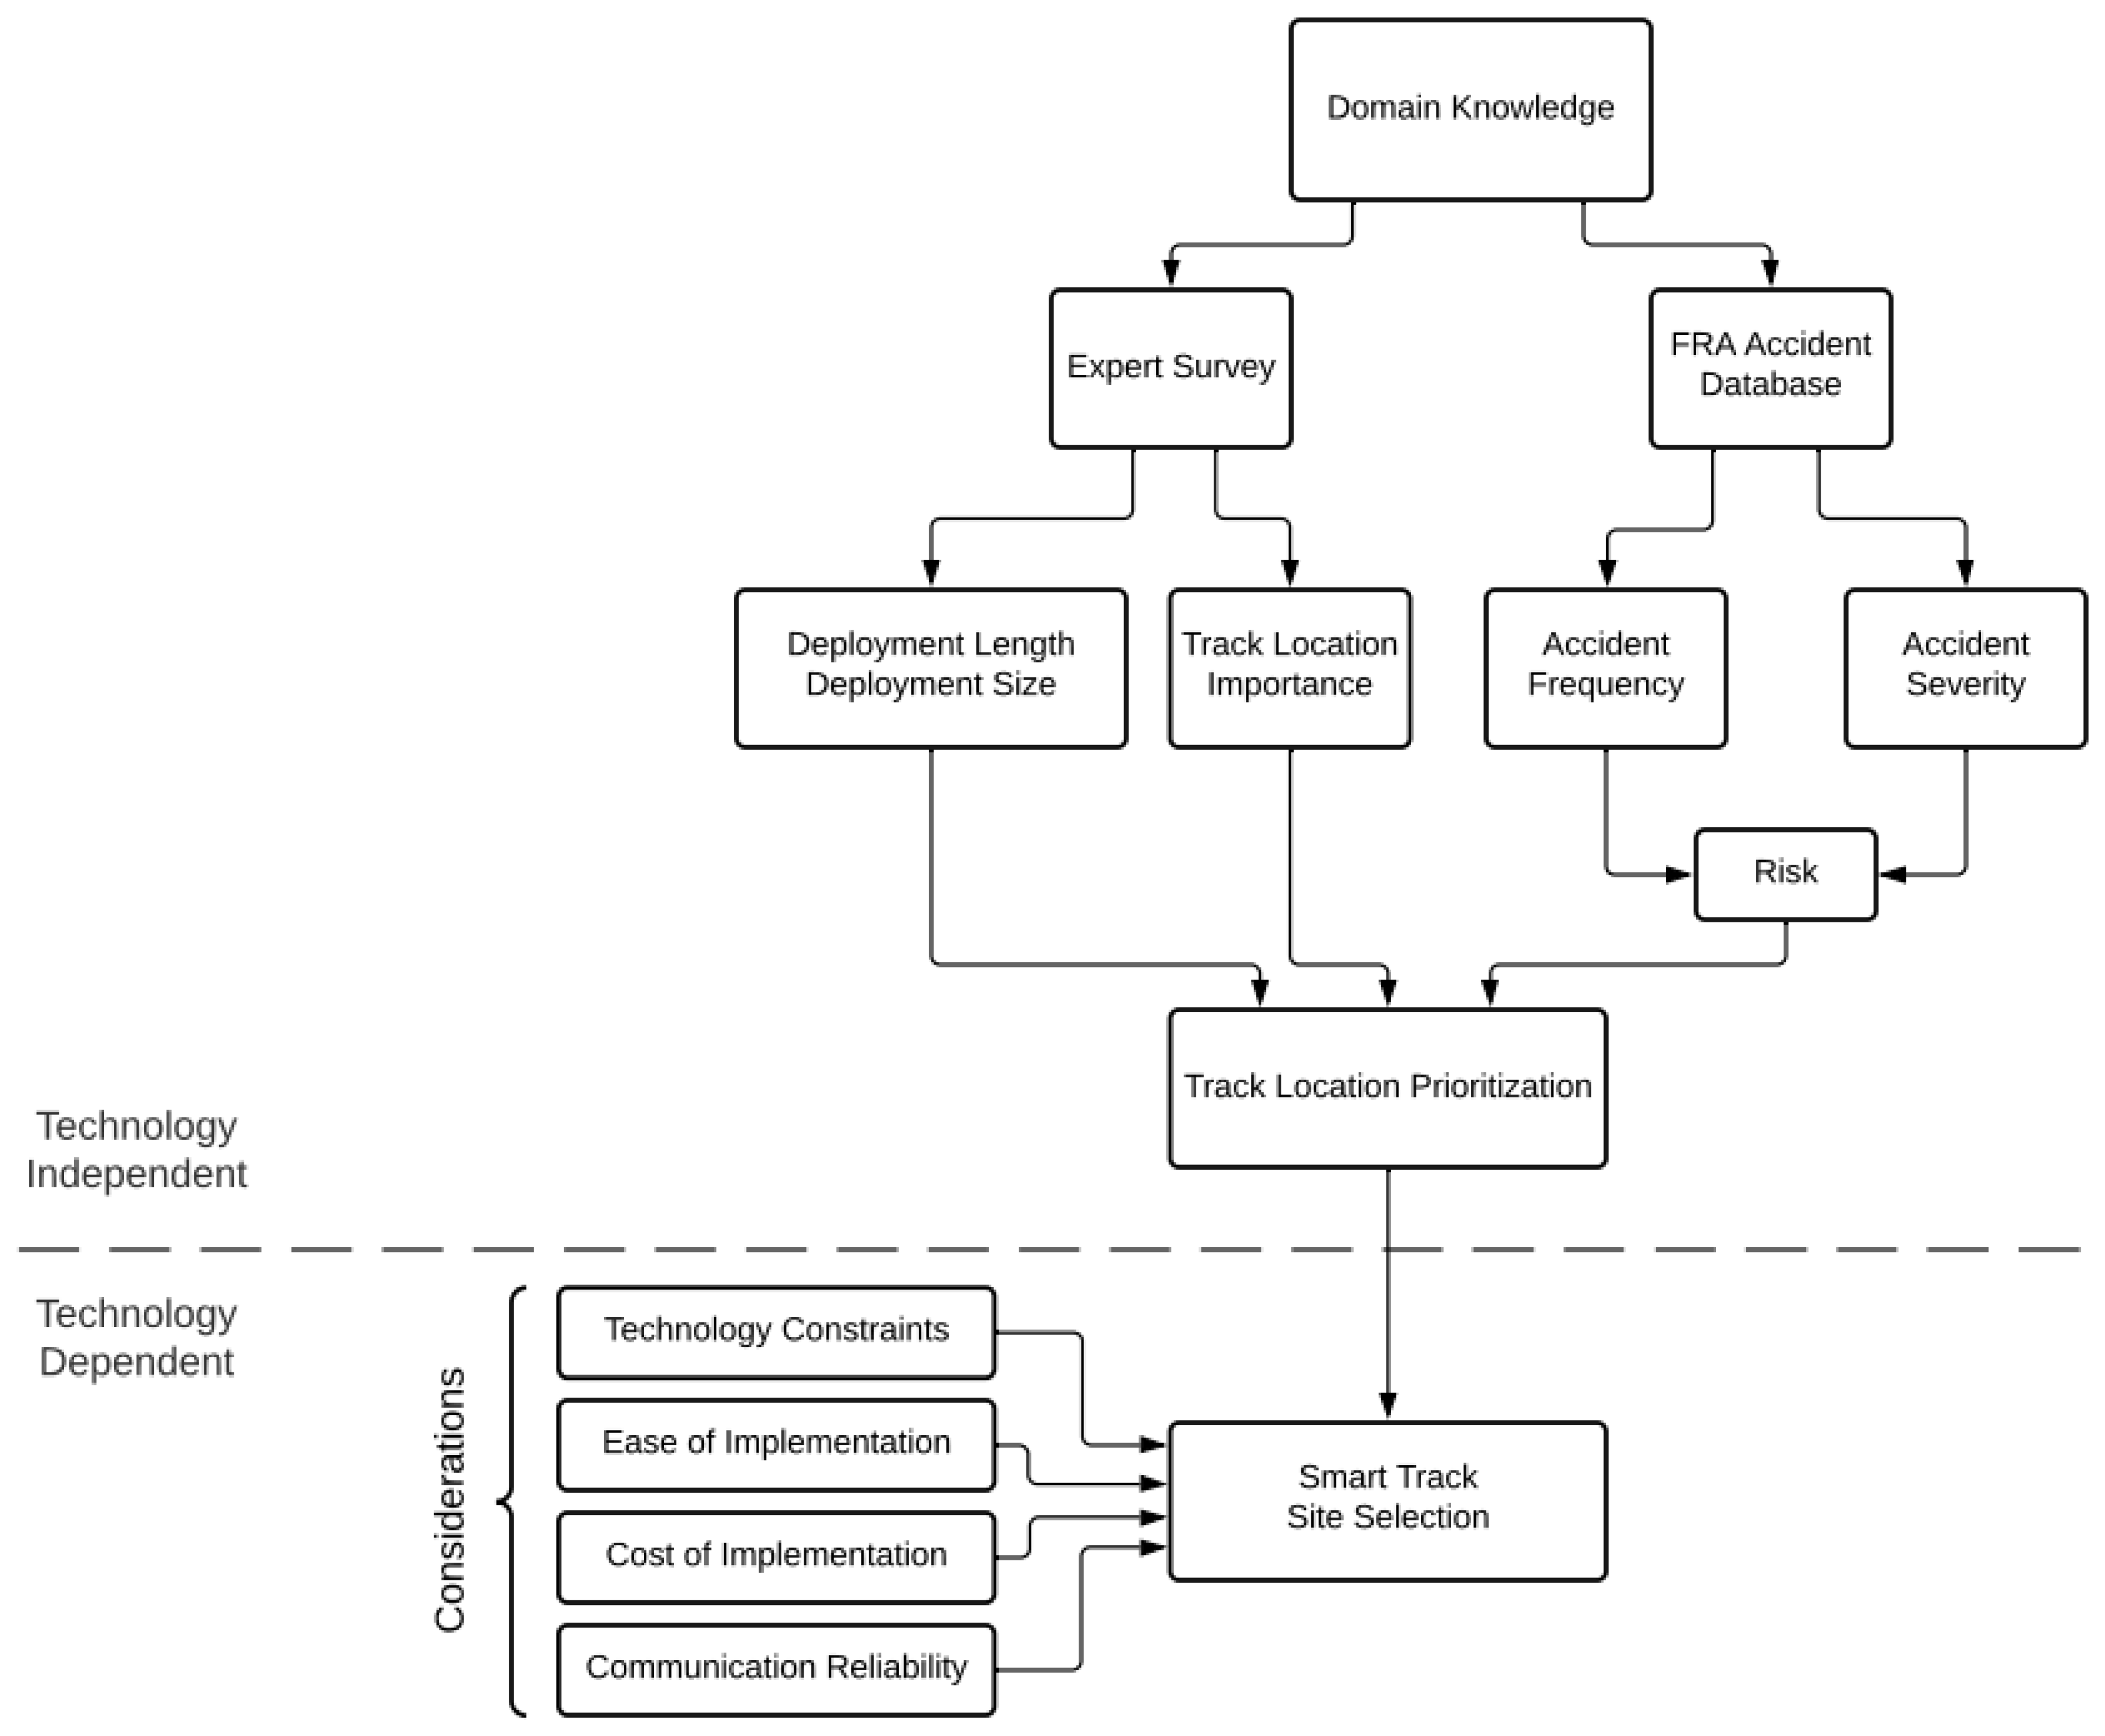
Figure 2 illustrates the methodology used in this study. The initial conceptualization of the scope of this study was developed based on prior experience and domain knowledge of the project team. This background knowledge provided the initial means to select questions for a survey of railway industry experts (
Section 4) and a review and distillation of FRA track-caused accident data (
Section 3). These combined efforts allowed the project team to prioritize locations within the track structure that are the best candidates for installation of Smart Track instrumentation.
The steps mentioned above were technology independent, and did not consider cost or communications limitations. Next, the project considered a variety of constraints that could cause a reprioritization of initial locations for instrumentation based on instrumentation technology readiness, communication systems’ availability and range and its effect on data latency, and deployment cost.
3. Analysis of Track-Caused Accident Data
In the U.S., the FRA requires railroads to report all rail equipment accidents or incidents that have material damage above a given monetary threshold (USD 10,700 for the calendar year 2020) [
12]. A review of FRA’s accident database was conducted considering track-caused accidents from mainlines and sidings from all U.S. railroads between 2000 and 2018. These locations have the highest tonnage and are where “smart” instrumentation is likely to be implemented to generate the greatest safety and economic benefits.
Two metrics were used to identify the most critical track conditions leading to accidents: frequency and severity. The frequency of accidents relates to their probability of occurrence, while the number of cars derailed is a proxy for the severity of each accident. Consequently, the quotient of the two provides an estimate of the average severity of each accident cause, a method that has seen widespread use in other rail applications [
13,
14,
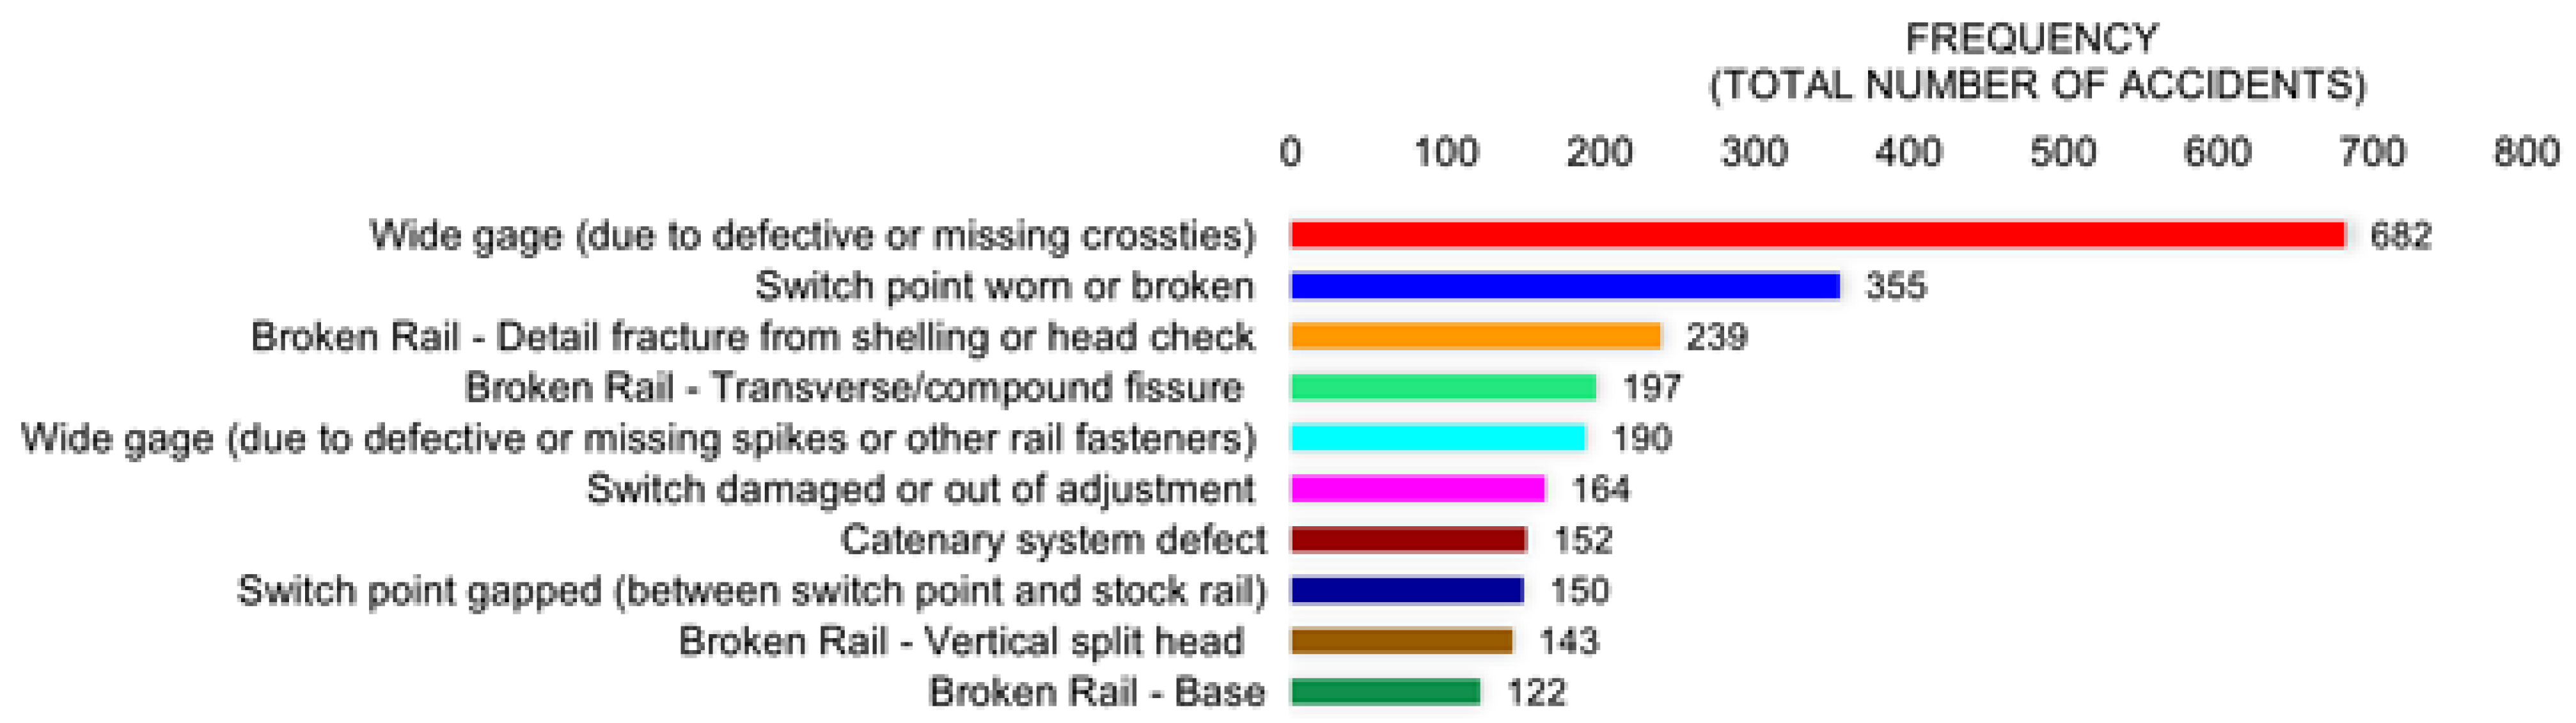
15]. Among the top five most frequent accident causes, wide gauge due to both defective/missing crossties (first) and fasteners (fifth) combined accounted for 22% of all accidents in the 18-year period evaluated and represented an average of 48 accidents per year (
Figure 3). Completing the list were accidents due to switch point wear and breakage (second) with 355 accidents, an average of 19 per year, broken rail due to both detail fracture from shelling or head check (third), and transverse/compound fissure (fourth) combining for 436 accidents, an average of 24 accidents per year.
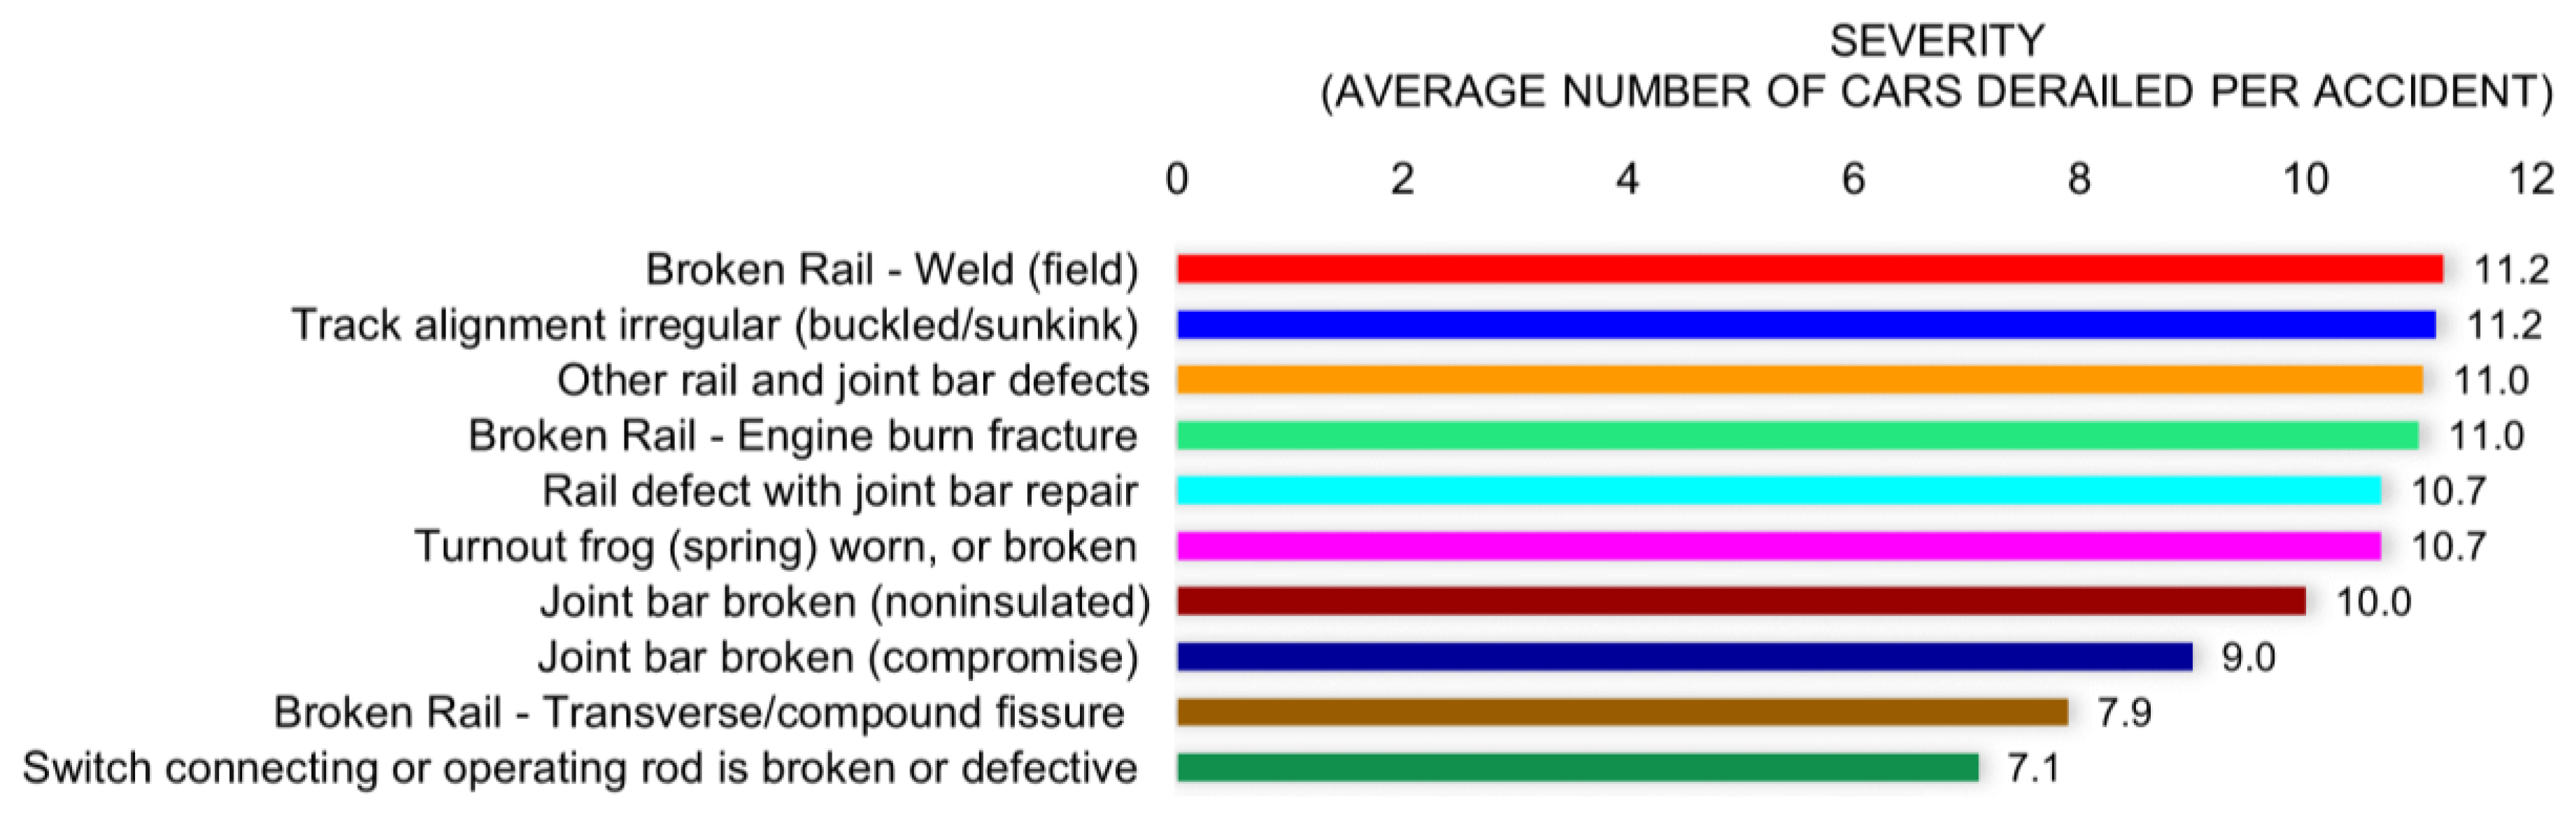
When considering the types of accidents with most severe consequences, the top five categories were (first) broken rail (field weld); (second) track buckling; (third) other rail and joint bar defects; (fourth) broken rail (engine burn fracture); and (fifth) rail defect with joint bar repair (
Figure 4). While it is generally intuitive that these accident causes can lead to severe derailments, this level of information is insufficient to provide practical guidance for track monitoring prioritization. Although some of the accidents could be considered severe, the rate of occurrence is low.
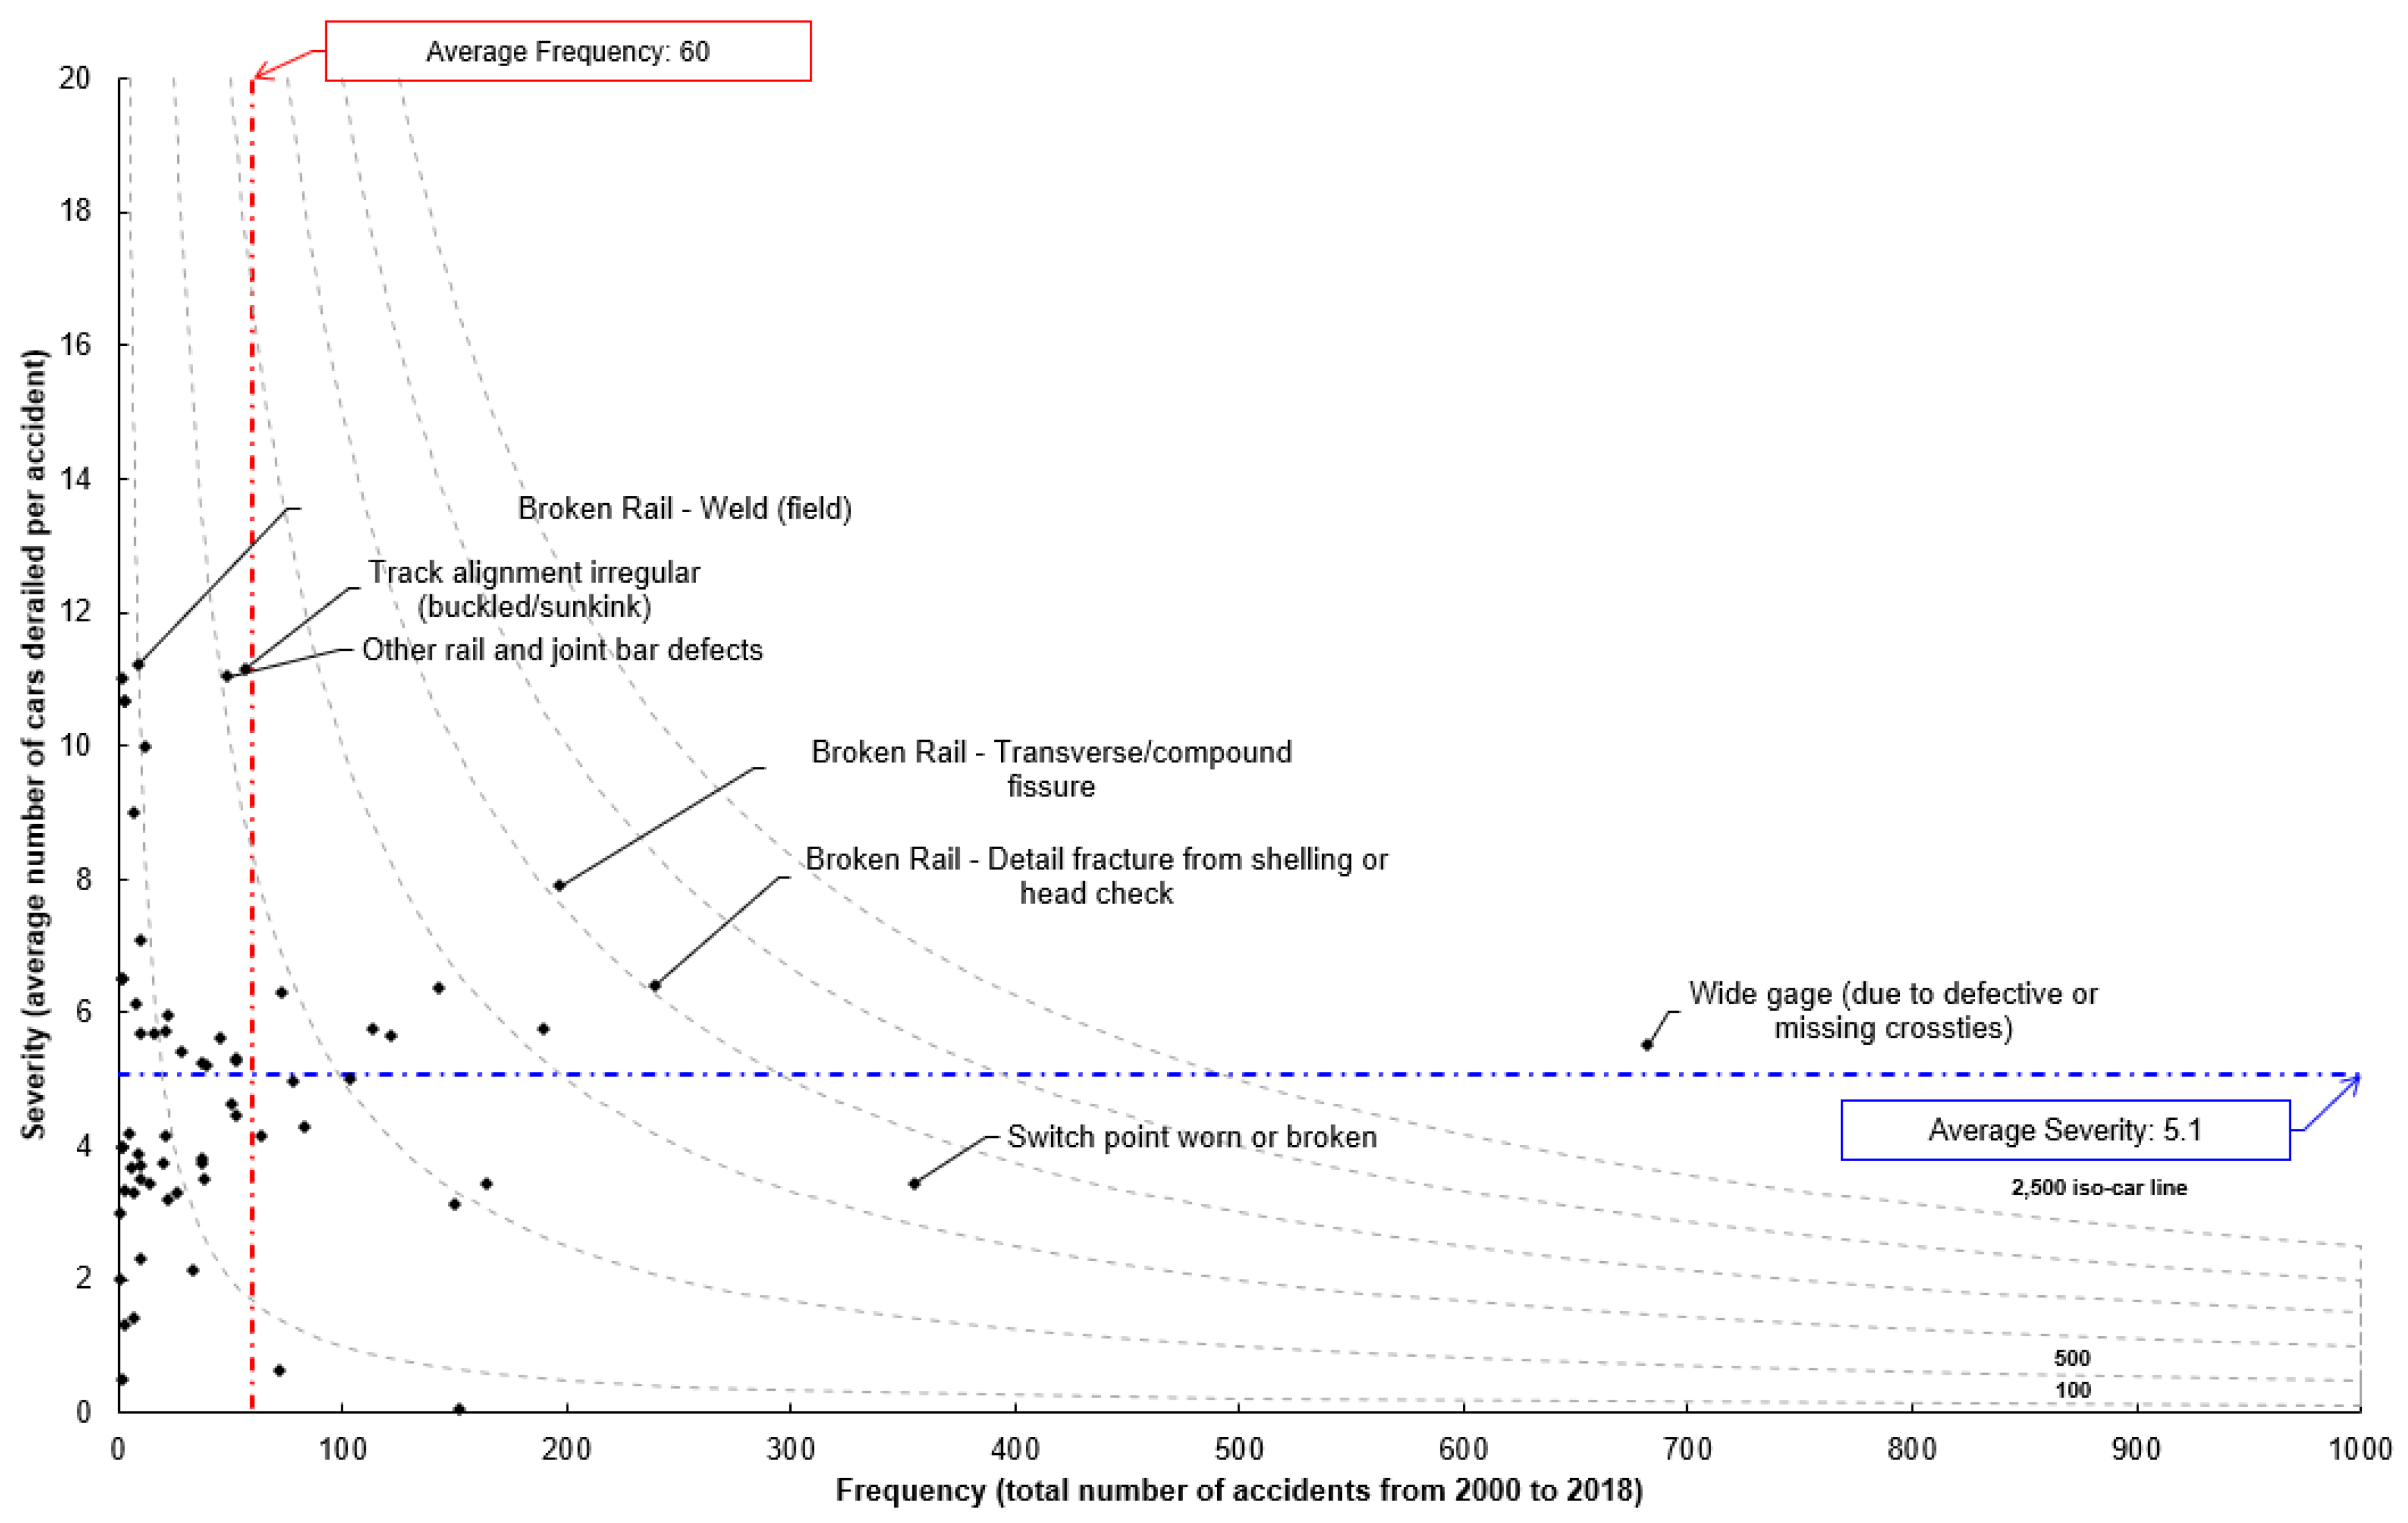
Hence, a more comprehensive analysis of these data that considers both frequency and severity is presented in
Figure 5. Dashed “iso-car” lines [
16] are used in
Figure 5 to represent constant risk (i.e., the total number of cars derailed) and provide a boundary for identifying accident causes with the highest overall risk. Based on this analysis and overall risk, the most relevant monitoring priorities are found to be the same as the top five items in the frequency ranking. Using this method, each applicable accident cause code can be related to a specific track location or component to determine the most critical sites for monitoring. For example, worn turnout frogs can easily be related to turnout locations. Another example is buckled track, which may be related to plug rail, open track, and/or recently disturbed track. The average frequency and average severity were calculated based on Equations (1) through (3):
Some types of accidents, such as wide gauge due to both defective/missing crossties, broken rail due to both detail fracture from shelling or head check, and broken rail due to transverse/compound fracture, are located above and to the right of both the average severity and average frequency lines (
Figure 5). These accidents were of greatest interest to our research team, given they represent accidents that occur with higher-than-average frequencies and result in an above-average number of cars derailed.
4. Industry Survey on Track Monitoring Priorities
A survey was developed and comprised nine questions, including six multiple-choice or scoring questions and three short-answer questions to further aid researchers in prioritizing instrumentation efforts. Its primary goal was to provide researchers with insights from crucial railroad industry stakeholders and experts as to the most relevant information for active (and proactive) maintenance decision-making. The survey was distributed to a wide range of rail industry professionals representing employees from Class I and regional railroads, suppliers of track infrastructure components, FRA staff, and others. In total, researchers received 50 individual responses from 33 unique organizations. Questions were developed based on general rail domain knowledge and prior communications with rail industry leadership tasked with designing and maintaining the track structure and its components. To be inclusive of other comments and ideas, at the end of the survey, we provided a section where respondents were able to add any other thoughts that were not included in the previous questions.
The first information needed for the development of an infrastructure monitoring plan was the identification of locations and components that are of greatest interest. Given fixed and operating costs associated with remote base stations, identifying areas more conducive to gathering relevant and actionable information is a fundamental step in prioritizing asset allocation. Furthermore, for each possible location, respondents were asked to score the importance of the size of deployment (i.e., focused, which means one installation per subdivision or mass, which means monitoring every component or every other component) and the period of monitoring (i.e., short- or long-term). Scores ranged from 1 to 5, representing low and high importance, respectively.
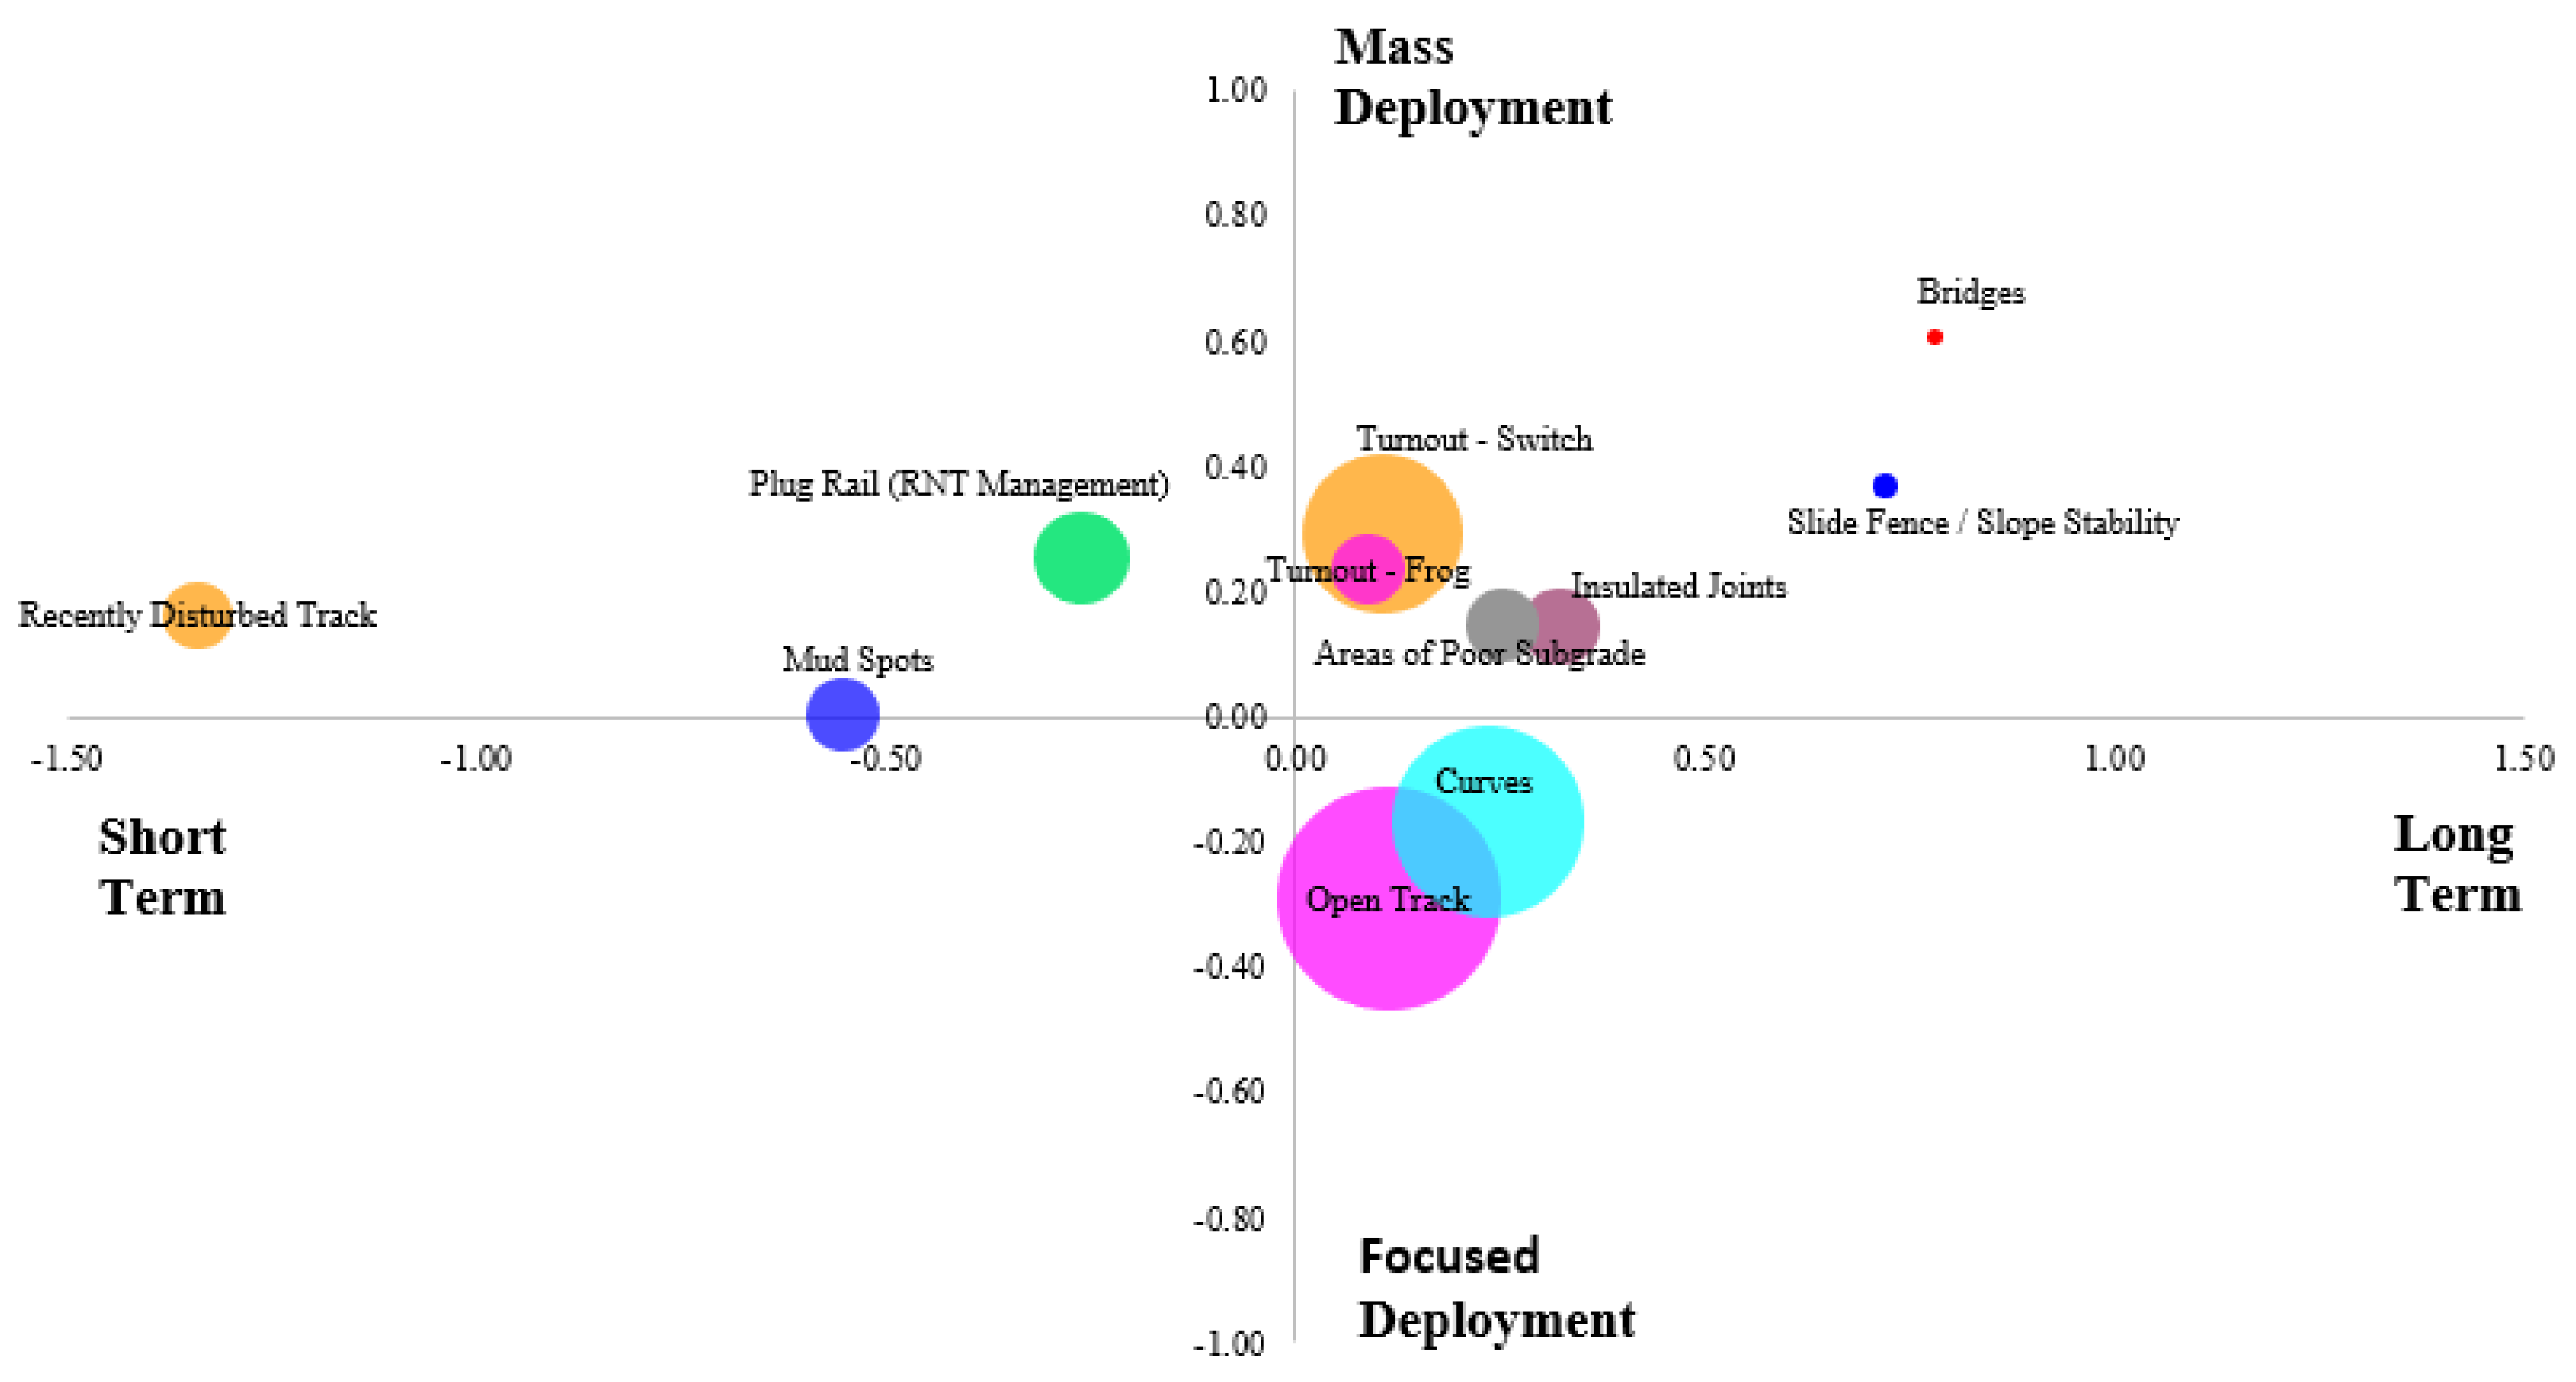
Next, the research team developed a method to combine survey results with FRA track-caused accident rates for various locations and components.
Figure 6 shows a normalized bubble chart in which the size of each bubble indicates the risk associated with each location (i.e., severity times frequency). At the same time, the x and y axes represent desired length and size of deployment, respectively. This graph was created to provide a holistic representation as to the relevance of investigating each track location and how the industry believes this study should be deployed. Its ultimate goal was to create a simple way to visualize the combined output from both the survey results and analysis of FRA accident data.
Next, questions were developed to identify the relative level of interest in monitoring specific components using wireless sensor technologies. These questions did not specify the size or length of deployment. Rail, special trackwork, and bridge superstructure received the highest average scores and emerged as the top three candidates for wireless monitoring.
Finally, respondents were also asked about the most valuable information that could be collected in each of the given elements of the track structure. To ensure the significance of the specific conclusions obtained in this section, results were analyzed holistically, by company type, and by area of expertise of the respondent (i.e., structures, substructure, and track) (
Table 1). This analysis demonstrated minor differences between the overall results and the experts’ responses.
Survey Conclusions
After evaluating all survey responses—both objective and open-ended—the following conclusions can be drawn:
No significant variability in responses were observed across company type;
When considering responses by specific areas of expertise, small differences were observed compared to the overall responses;
Rail, special trackwork, and bridge superstructure were the components that respondents were most interested in monitoring;
In terms of size of deployment, turnout switches and frogs, and plug rails were preferred choices for mass deployments while curves and track substructure were the commonly suggested for focused deployment;
Fouling/moisture, crosstie stresses/support, deflections, and rail loads were of greatest interest for use in maintenance decision making.
The survey also provided valuable insights as to what types of measurements are desired at each location. A summary is provided below, by component:
Bridges and approaches: rail loads, deflection, vertical displacements, and impact loads;
Special trackwork: impact loads;
Rail: lateral displacement, longitudinal loads, and displacements;
Substructure: fouling and deflection;
Crossties: support condition and stresses.
5. Proposed Wireless Communication Architecture and Instrumentation Requirements
Providing end-to-end wireless connectivity for a Smart Track field site encompassing numerous and diverse sensors is nontrivial. Due to the breadth of sensor modalities that can be included in a potential deployment and their significant variability in the data transport requirements, no single wireless technology is expected to cover the full range of functionality required for interconnecting these sensors. The limited power availability (e.g., rechargeable batteries, solar panels) and the resulting need to use energy-efficient communication methods, which typically feature lower bandwidth, places additional constraints on selecting of optimal communication technologies in this setting.
Before making specific recommendations on the choice of wireless technologies and communication protocols, we first assess the different types of sensors that can be employed to answer the relevant questions about the condition of the monitored track, substructure, and bridge structures. Based on the industry survey and prior track and structure monitoring experience, the following metrics have been identified as being of interest for each infrastructure component:
Rail: Lateral displacement, longitudinal load;
Crosstie and support: Bending, deflection;
Ballast and substructure: Particle movement, layer modulus, shear wave velocity, moisture content, fouling;
Bridge deck and support: Mid-span deflection, impact loads, lateral displacement;
Special trackwork: Impact loading, settlement.
Collecting such a diverse set of measurements requires making use of several distinct sensor types. Sensors include different forms of accelerometers and strain gauges, as well as more specialized sensor devices. The list of sensors considered in this project include:
Concrete strain gauges: For concrete crosstie bending moment instrumentation, typically between one and five sensors are installed per instrumented crosstie, with sampling rates up to 1 kHz [
17];
Rail-mounted strain gauges: For rail load instrumentation, up to six sensors can be expected to be installed per field site, with sampling rates up to 2 kHz;
Accelerometers (crosstie): A small number of high-precision accelerometers are used for impact monitoring instrumentation, with sampling rates up to 2 kHz;
Potentiometers: A small number of potentiometers can be installed for direct measurement of displacements, with sampling rates up to 500 Hz;
Smart Rocks: For measuring several ballast properties, wireless Smart Rock sensors can be embedded throughout the ballast layer, sampling at up to 500 Hz;
Bender elements: For shear wave measurement instrumentation, 6–12 bender elements are embedded in the ballast and sub-ballast layers, with sampling rates ranging up to 80 kHz;
Moisture probe: For moisture content measurement; up to 4 sensors can be installed, with a sampling rate of 10 Hz;
Accelerometers (bridge): For lateral displacement and impact monitoring, 3–6 triaxial accelerometers need to be installed for a typical bridge, sampling at up to 100 Hz.
For most sensor types, data measurement occurs in an event-driven fashion when a train passes the monitored site. Typical measurement durations range from 1–10 min, depending on the length and speed of the train. Additionally, some sensors (e.g., bender elements), require baseline measurements in the quiescent state. Combining this information with the typical sampling rates and numbers of sensors per field site, we can estimate both the specific bandwidth needs for each sensor type (for communication within the field site) and the aggregate bandwidth needs of the field site (for field site to cloud communication).
Table 2 summarizes the key properties and requirements of the proposed instrumentation types. The table highlights the importance of edge computing to reduce the volume of data generated at the source, which dramatically improves latency and energy efficiency. For example, sending a fast Fourier transform (FFT) of the acceleration measurement from a passing train instead of the time history can reduce the volume of data to be transmitted by almost two orders of magnitude. Another aspect to note is that the relatively high sampling rates required to preclude the use of many wireless sensors and IoT platforms not explicitly designed for high fidelity data acquisition.
6. Wireless Communications Architecture Overview
The key to creating an efficient and versatile communications architecture that can support a variety of instrumentation combinations for the Smart Track field site is to treat sensor bandwidth requirement as the minimum suitability criterion for choosing a set of candidate wireless technologies for that sensor type [
18]. Subsequently, selecting a candidate among these based on energy efficiency and versatility (i.e., capability to support multiple sensor types using a single communications technology) is possible. For most sensor types, low-power wireless technologies intended specifically for embedded devices (i.e., Bluetooth low energy (BLE) and IEEE 802.15.4) satisfy these requirements. Both radios are also relatively energy-efficient, with similar power consumption in both transmitting and receiving modes.
The much higher sampling rates of the bender element field sensors translate into similarly high bandwidth requirements [
19]. Transmitting that much data using relatively low-bandwidth 802.15.4 or BLE radios offset the benefit of energy efficiency, as the relatively low power drawn by the radio becomes overwhelmed by the power needed to keep the wireless nodes powered on for the much longer duration needed to transmit the sensor data. For this reason, Wi-Fi becomes the more power-efficient option for this sensor type, with 802.15.4 and BLE remaining as feasible less-efficient fallbacks. Additionally, the more complex sensing functionality of the bender elements requires a more powerful processor than is typically available on low-power embedded devices used in most wireless sensors. Combined, these factors call for a custom wireless data acquisition (DAQ) platform that can provide the suitable sensing functionality for the bender elements and incorporate Wi-Fi and/or 802.15.4 radios.
When it comes to versatility, two of the identified sensor types already have complete wireless sensing implementations: Smart Rocks [
20], which use BLE for communication, and bridge monitoring systems (based on Xnode Smart Sensors), which use 802.15.4 radios [
21,
22]. The remainder of the sensors is analog devices, requiring a wireless DAQ module to provide wireless connectivity. The Xnode Smart Sensor platform can also be used as a 5-channel wireless DAQ, with up to three strain sensor channels and two analog sensor channels available per node. Thus, the 802.15.4-based wireless sensor platform can cover the bulk of the communication needs within the field site, excluding Smart Rocks and bender element sensors.
The aggregate bandwidth requirements of all the sensors within the field site determine the choice of the communication technology for connecting the field site with the cloud. Cellular communication provides the most versatile option within the cellular coverage area. Specifically, 4G LTE currently offers the best balance of bandwidth and coverage within the continental U.S. A low-power cellular modem can provide the interconnect between wireless sensor devices within the smart track field site and the cloud backend that provides the data management and user interface functionality.
Figure 7 is a schematic view of the proposed end-to-end wireless communication architecture.
The sensors within the field site are interconnected via energy-efficient BLE and 802.15.4 radios, while a 4G LTE cellular modem provides remote access connectivity for the field site. A scalable cloud-based data management system provides data collection, categorization, analysis, and a Web-based user interface. Optionally, direct communication between handheld mobile devices (e.g., smartphones and tablets) and the field site can be supported to provide users physically present at the field site with direct access to the information. The following sections elaborate on the specific design choices for each component of the Smart Track monitoring system.
7. Field Site Communication Architecture
The following wireless communication solutions are proposed for each of the sensor types that were considered in this study:
Strain gauges, accelerometers (track), and potentiometers: These are traditional analog sensors that are widely used for a variety of monitoring applications. Some wireless smart sensor (WSS) platforms, e.g., the Xnode Smart Sensor, feature the capability to connect such analog sensors, turning the WSS node into a small wireless data acquisition (DAQ) device. A hardened breakout box facilitates this integration and allows for external housing circuitry that may be required by some sensors, e.g., Wheatstone bridges for load measurements. Once integrated with a WSS node, the analog sensors can be treated the same as the WSS node’s integral sensors concerning to time synchronization and data transmission;
Smart Rocks: These sensors comprise a wireless network of several distributed sensors, using Bluetooth low energy for communication with the Smart Rock gateway. Two options exist for integrating Smart Rocks, and similar wireless sensors, into the Smart Track field site. First, a Bluetooth radio can be added to the field site’s gateway, and the functionality of the Smart Rock gateway can be replicated on that platform. This alternative currently requires a significant development effort. The second option is to keep the Smart Rock gateway and its functionality while interconnecting it with the WSS gateway using a wired serial connection (USB, UART). The two gateways would need to be physically co-located. This is the proposed choice for first pilot implementation due to the considerably lower technical risk and development effort;
Bender elements: Bender elements require additional, relatively complex data acquisition functionality to perform sensing. This involves first using a signal generator to drive a signal through the BE frame, then sample the resulting output signals at a high frequency using filters, amplifiers, and an oscilloscope. To be compatible with the vision of a portable Smart Track field site, this data acquisition hardware must be replaced with a more compact wireless DAQ node, which implements the required functionality. The capability of small, low-power single-board computers such as Raspberry Pi to implement similar functionality has been demonstrated. The wireless DAQ must be developed to meet the specific requirements of the BE sensors, including signal quality and sampling rate;
Accelerometers (bridge): WSS-based bridge acceleration and displacement measurement systems using IEEE 802.15.4 radios for communication have been previously developed and deployed successfully [
23]. Integrating such WSS monitoring solutions into the Smart Track field site is straightforward. The deployed sensors connect wirelessly to the WSS gateway, performing the necessary time synchronization and data acquisition functions over the typical radio;
Moisture probe: These sensors measure the volumetric water content and bulk electrical conductivity of the subgrade. They employ an electromagnetic wave that is transmitted along with a set of metallic conducting rods (or waveguides). Further development on the communication side of this sensor is needed. A wireless device would better fit the vision of the Smart Track field site.
8. Site to Cloud Communication
The next element in the data-to-user pipeline is to extract the data from the Smart Track field site and send it to a remote data repository for storage and processing purposes. Due to the remote location of many railway track assets a long-range communication method for this data retrieval process is necessary. As discussed, the 4G LTE technology and infrastructure are readily available for this purpose.
A commercial low-power 4G LTE cellular modem (e.g., Sierra Wireless HL7588 LTE-CAT4) can be integrated with an existing WSS platform such as the Xnode Smart Sensor to provide cellular connectivity. The modem connects to the WSS via a UART serial bridge and GPIO pins for control, while being powered by the WSS’s battery. This modem enables 4G LTE connectivity from major network providers, 3G fallback, 50 Mbps upload speed, and 150 Mbps download speed, and firmware over-the-air reprogramming.
These solutions allow for energy-efficient remote data uploading. Assuming no solar panel to provide renewable power, a 2% duty cycling scheme for data uploading can provide over 50 days of connectivity on a single 10,000 mAh lithium-ion battery. With lower duty cycles, and correspondingly longer data access latencies, operational life can be extended up to 1 year [
5]. The addition of solar panels can extend operational life to several years, currently limited primarily by the degradation of lithium-ion batteries.
In addition to remote connectivity, a cellular modem can also provide auxiliary functionality, such as time synchronization [
24]. Using the cellular network and the Internet, various tasks requiring precise timing (i.e., second-accuracy precision) and scheduled data uploading can be realized. The network timekeeping task reads the time provided by the network, adjusts the clock of the gateway node, and propagates the timestamp to all the WSSs in the network by rebroadcasting the timestamp data.
9. Cloud-Based Data Management and User Interface
While a 4G LTE network provides the means to extract data from the field site, the final component of the data-to-user pipeline is to manage and visualize data at the front-end. A cloud-based server with efficient data aggregation, management for timely storage and queries, and providing processed data to assist the engineers with decision making can make a significant contribution to making the information collected by the Smart Track field site accessible to railroad personnel. We proposed a data architecture and connectivity among its subcomponents based on prior experience of developing a data management framework for monitoring railway bridges [
18]. This server would actively wait for data from the sensor network delivered through a message queuing telemetry transport (MQTT) data broker. Once the data are collected by this broker, an MQTT client, which subscribes to the relevant subset of the data, processes and decodes the message, and subsequently stores its contents into respective databases for further analysis. Finally, the processed data are presented and ready to be queried at the front-end of the web-based user interface.
A web interface granting ubiquitous access to the data is crucial to support direct access to the field site data and any assessment results. This platform can be implemented via a webserver hosted using the micro web framework Flask written in Python. This webserver has direct access to the MySQL and InfluxDB databases by using the MySQL connector and InfluxDB library. Thus, users can interact with the data by querying on the web by selecting a row in the database table. In response to the queries, the time series record can be presented in graph and map format, showing both time-history and location data. In addition to the monitoring data, the network condition, containing voltage and current measurements, can also be presented so that the engineers with access to the webserver can check for the last known state of the network. The web server can be hosted using the widely used Apache server framework.
10. Conclusion and Future Work
As discussed, a list of guiding questions was developed at the onset of the project to provide guidance to the prioritization efforts. Based on the results of the analysis of FRA accident data and the industry survey, the proposed instrumentation types on
Table 2, a revised list of guiding questions is summarized and presented in
Table 3. This table is organized by location within the track structure, proposed guiding questions, specific measurements desired/needed, and expected output.
Likewise, based on project findings and building on
Table 3, a summary of required attributes of the most common forms of instrumentation and their associated costs are provided in
Table 4. The price per unit column indicates the fixed cost of each instrument and its installation cost for each type of measurement. The priority column provides the relative urgency of deployment of a given form of instrumentation at each specific track location-based a qualitative assessment of the analysis of FRA accident data and the industry survey, with 1 being the highest priority. Additionally, the method of sensor communication, its current developmental status and technology readiness level (TRL), and future needs (i.e., gap analysis) are included in
Table 5 for each of the types of instrumentation considered in this study. The predominant need is to develop wireless capability for many of the forms of field instrumentation that have been demonstrated via past and existing wired deployments.
Table 2 and
Table 5 were created to be the main form to analyze sensors’ requirements and specifications, whereas the main purpose of
Table 3 and
Table 4 was to identify each track location specificities.
Based on the needs identified in the industry survey and the resulting forms of instrumentation that are desired (and summarized above), this study has identified IEEE 802.15.4 as the wireless technology best suited for intra-site communication and 4G LTE cellular as the preferred means for field-to-cloud communication. The notable advantages of IEEE 802.15.4 include a good balance of energy efficiency, communication range, and available bandwidth. 4G LTE stands out as the most broadly available currently, among the cheapest, and best supported by third-party communications service providers. Alternate technologies (Wi-Fi, Bluetooth, satellite, mobile base station) would generally only be considered when the above solutions are not an option.
The proposed conceptual design of wireless monitoring can change the way the railway industry approaches maintenance prioritization and procedures and can improve the capability of predicting failure of track infrastructure components, directly enhancing the safety of railway operations. Furthermore, a better understanding of the current stress states of the infrastructure can assist decision-makers in allocating their capital better assertively and reducing overall spending resulting in more sustainable utilization of money.
Author Contributions
Conceptualization, J.R.E., K.A.M., I.G.B., A.d.O.L., B.F.S.J., E.T., and M.S.D.; methodology, J.R.E., B.F.S.J., E.T., M.S.D., and A.d.O.L.; data collection, A.d.O.L., J.R.E., I.G.B., and K.A.M.; data processing, A.d.O.L. and I.G.B.; writing—original draft preparation, I.G.B., A.d.O.L., J.R.E., B.F.S.J., E.T., and K.A.M.; writing—review and editing, I.G.B., A.d.O.L., J.R.E., and K.A.M.; supervision, J.R.E., B.F.S.J., E.T., M.S.D., and A.d.O.L. All authors have read and agreed to the published version of the manuscript.
Funding
This research was funded by United States Department of Transportation (USDOT) Federal Railroad Administration (FRA), grant number DOT/FRA/ORD-693JJ6-20-C-000003 and the APC was funded by MDPI Organization (invited paper).
Institutional Review Board Statement
Not applicable.
Informed Consent Statement
Not applicable.
Data Availability Statement
Data are available from the corresponding author upon request. In the future, data will be publicly accessible on the FRA website in the form of a published technical report.
Conflicts of Interest
The authors declare no conflict of interest.
References
- Stratman, B.; Liu, Y.; Mahadevan, S. Structural Health Monitoring of Railroad Wheels Using Wheel Impact Load Detectors. J. Fail. Anal. Prev. 2007, 7, 218–225. [Google Scholar] [CrossRef]
- Stone, D.; Kalay, S.; Tajaddini, A. Statistical Behaviour of Wheel Impact Load Detectors to Various Wheel Defects. Non-Serials 1992, 9–13. [Google Scholar] [CrossRef]
- Mishra, D.; Qian, Y.; Kazmee, H.; Tutumluer, E. Investigation of Geogrid-Reinforced Railroad Ballast Behavior Using Large-Scale Triaxial Testing and Discrete Element Modeling. Transp. Res. Rec. J. Transp. Res. Board 2014, 2462, 98–108. [Google Scholar] [CrossRef] [Green Version]
- Sussmann, T.; Thompson, H.; Stark, T.; Wilk, S.; Ho, C. Use of seismic surface wave testing to assess track substructure condition. Constr. Build. Mater. 2017, 155, 1250–1255. [Google Scholar] [CrossRef]
- Spencer, B.; Hoang, T.; Mechitov, K. Energy-Efficient Autonomous Framework for Monitoring Railroad Bridges in the USA Using Wireless Smart Sensors. In Bridge Maintenance, Safety, Management, Life-Cycle Sustainability and Innovations; CRC Press: Boca Raton, FL, USA, 2021; pp. 91–99. [Google Scholar]
- Stark, T.D.; Wilk, S.T. Root cause of differential movement at bridge transition zones. Proc. Inst. Mech. Eng. Part F J. Rail Rapid Transit 2016, 230, 1257–1269. [Google Scholar] [CrossRef]
- Tutumluer, E.; Stark, T.D.; Mishra, D.; Hyslip, J.P. Investigation and Mitigation of Differential Movement at Railway Transitions for US High Speed Passenger Rail and Joint Passenger/Freight Corridors. In Proceedings of the 2012 Joint Rail Conference, American Society of Mechanical Engineers, Philadelphia, PA, USA, 17–19 April 2012; pp. 75–84. [Google Scholar]
- Bischoff, R.; Meyer, J.; Enochsson, O.; Feltrin, G.; Elfgren, L. Event-Based Strain Monitoring on a Railway Bridge with a Wireless Sensor Network. In Proceedings of the 4th International Conference on Structural Health Monitoring of Intelligent Infrastructure, Zurich, Switzerland, 22–24 July 2009. [Google Scholar]
- Chen, J.; Díaz, M.; Rubio, B.; Troya, J.M. RAISE: Railway Infrastructure Health Monitoring Using Wireless Sensor Networks. In Proceedings of the International Conference on Sensor Systems and Software, Lucca, Italy, 11–12 June 2013; pp. 143–157. [Google Scholar]
- Jeong, S.; Hou, R.; Lynch, J.P.; Sohn, H.; Law, K.H. A scalable cloud-based cyberinfrastructure platform for bridge monitoring. Struct. Infrastruct. Eng. 2019, 15, 82–102. [Google Scholar] [CrossRef]
- Liu, Y.; Voigt, T.; Wirstrom, N.; Hoglund, J. EcoVibe: On-Demand Sensing for Railway Bridge Structural Health Monitoring. IEEE Internet Things J. 2018, 6, 1068–1078. [Google Scholar] [CrossRef]
- Liu, X.; Saat, M.R.; Barkan, C.P.L. Analysis of Causes of Major Train Derailment and Their Effect on Accident Rates. Transp. Res. Rec. J. Transp. Res. Board 2012, 2289, 154–163. [Google Scholar] [CrossRef]
- Liu, X.; Saat, M.R.; Qin, X.; Barkan, C.P. Analysis of U.S. Freight-Train Derailment Severity Using Zero-Truncated Negative Binomial Regression and Quantile Regression. Accid. Anal. Prev. 2013, 59, 87–93. [Google Scholar] [CrossRef]
- Lin, C.-Y.; Saat, M.R.; Barkan, C.P. Quantitative Causal Analysis of Mainline Passenger Train Accidents in the United States. Proc. Inst. Mech. Eng. Part F J. Rail Rapid Transit 2019, 234, 869–884. [Google Scholar] [CrossRef]
- Barkan, C.P.L.; Dick, C.T.; Anderson, R. Railroad Derailment Factors Affecting Hazardous Materials Transportation Risk. Transp. Res. Rec. J. Transp. Res. Board 2003, 1825, 64–74. [Google Scholar] [CrossRef]
- Wang, B.Z.; Barkan, C.P.L.; Saat, M.R. Quantitative Analysis of Changes in Freight Train Derailment Causes and Rates. J. Transp. Eng. Part A Syst. 2020, 146, 04020127. [Google Scholar] [CrossRef]
- Edwards, J.R.; Liang, Y.; Bastos, J.C.; Dersch, M.S. Development of a parametric model for the prediction of concrete railway crosstie service bending moments. Proc. Inst. Mech. Eng. Part F J. Rail Rapid Transit 2019, 234, 1253–1264. [Google Scholar] [CrossRef]
- Hoang, T.; Fu, Y.; Mechitov, K.; Sánchez, F.G.; Kim, J.R.; Zhang, D.; Spencer, B.F., Jr. Autonomous end-to-end wireless monitoring system for railroad bridges. Adv. Bridg. Eng. 2020, 1, 1–27. [Google Scholar] [CrossRef]
- Kang, M.; Qamhia, I.I.A.; Tutumluer, E.; Hong, W.-T.; Tingle, J.S. Bender Element Field Sensor for the Measurement of Pavement Base and Subbase Stiffness Characteristics. Transp. Res. Rec. J. Transp. Res. Board 2021. [Google Scholar] [CrossRef]
- Liu, S.; Huang, H.; Qiu, T.; Gao, L. Comparison of Laboratory Testing Using SmartRock and Discrete Element Modeling of Ballast Particle Movement. J. Mater. Civ. Eng. 2017, 29. [Google Scholar] [CrossRef]
- Fu, Y.; Mechitov, K.; Hoang, T.; Kim, J.R.; Lee, D.H.; Spencer, B.F. Development and full-scale validation of high-fidelity data acquisition on a next-generation wireless smart sensor platform. Adv. Struct. Eng. 2019, 22, 3512–3533. [Google Scholar] [CrossRef]
- Spencer, B.; Park, J.-W.; Mechitov, K.; Jo, H.; Agha, G. Next Generation Wireless Smart Sensors toward Sustainable Civil Infrastructure. Procedia Eng. 2017, 171, 5–13. [Google Scholar] [CrossRef]
- Fu, Y.; Hoang, T.; Mechitov, K.; Kim, J.R.; Zhang, D.; Spencer, J.B.F. Sudden Event Monitoring of Civil Infrastructure Using Demand-Based Wireless Smart Sensors. Sensors 2018, 18, 4480. [Google Scholar] [CrossRef] [Green Version]
- NimbeLink. Skywire LTE CAT4 HL7588 Embedded Cellular Modem Datasheet. Available online: https://nimbelink.com/Documentation/Skywire/4G_LTE_Cat_4/30087_NL-SW-LTE-S7588_Datasheet.pdf (accessed on 1 September 2020).
| Publisher’s Note: MDPI stays neutral with regard to jurisdictional claims in published maps and institutional affiliations. |
© 2021 by the authors. Licensee MDPI, Basel, Switzerland. This article is an open access article distributed under the terms and conditions of the Creative Commons Attribution (CC BY) license (https://creativecommons.org/licenses/by/4.0/).


 ,
, 


