Systematic Review

The Urban Rooftop Photovoltaic Potential Determination

by
Elham Fakhraian
1,
Marc Alier
2,*,
Francesc Valls Dalmau
3,
Alireza Nameni
1 and
Maria José Casañ Guerrero
2,*
1
Institute of Sustainability, Universitat Politècnica de Catalunya, 08034 Barcelona, Spain
2
Department of Services and Information Systems Engineering (ESSI), Universitat Politècnica de Catalunya, 08034 Barcelona, Spain
3
Department of Architectural Representation, Universitat Politècnica de Catalunya, 08028 Barcelona, Spain
*
Authors to whom correspondence should be addressed.
Sustainability 2021, 13(13), 7447; https://doi.org/10.3390/su13137447
Submission received: 31 May 2021 / Revised: 22 June 2021 / Accepted: 28 June 2021 / Published: 2 July 2021
(This article belongs to the Special Issue Advances in Clean and Sustainable Energy Research)

Abstract

:
Urban areas can be considered high-potential energy producers alongside their notable portion of energy consumption. Solar energy is the most promising sustainable energy in which urban environments can produce electricity by using rooftop-mounted photovoltaic systems. While the precise knowledge of electricity production from solar energy resources as well as the needed parameters to define the optimal locations require an adequate study, effective guidelines for optimal installation of solar photovoltaics remain a challenge. This paper aims to make a complete systematic review and states the vital steps with their data resources to find the urban rooftop PV potential. Organizing the methodologies is another novelty of this paper to create a complete global basis for future studies and improve a more detailed degree in this particular field.

1. Introduction

At present, the population accommodated in urban environments consists of more than 50% of the world’s population. Due to the rise of urban area migration, this fraction is estimated to reach 70% by 2050. This leads to urban energy consumption increase to 75% of global energy demand estimated by 2030 [1]. Moreover, due to the rise of the energy crisis and environmental degradation concerns [1], determining the renewable energy potential has become an essential aspect in energy policies and regulation developments [2]. Recently, in most of the energy efficient housing schemes, it is considered that a building should have the same amount of electrical energy production as its annual electrical energy requirement which is called a net-zero energy building [3].
Urban areas can be considered high-potential energy producers alongside their significant share of energy consumption [1]. Urban building rooftops provide promising locations for solar photovoltaic installations [4] and can contribute effectively to make nearly net-zero energy buildings [3]. Rooftop solar photovoltaics can be considered an effective solution for urban energy management to solve urban energy requirements and environmental problems [1].
Optimal photovoltaic (PV) installation research has started to make progress mostly in developed European and American counties [1], however, an efficient methodology for determining rooftop solar photovoltaic potential remains a challenge [4].
With the vast technology development in recent years, there are several attempts conducted to determine the urban solar photovoltaic potential. The study scope is one of the important aspects of rooftop photovoltaics potential estimation [5]. Applying the same techniques for rooftop photovoltaics potential detection is frequently not possible at local, regional, or continental scales, caused by the lack of data diversity in some regions, the high cost of accessing the data sources, and time-consuming procedures. Therefore, there is also a lack of urban solar energy production potential maps on global scales for future unified urban energy planning [1].
This study aims to review the various methodologies available for determining the urban rooftop PV potential and states the best available methods to create a complete global basis for future research. The novelty of this paper is to have a complete systematic review on the development of determining the urban rooftop PV potential by taking into account the majority of high impact attempts since 2010. This paper is confidentially the first paper that considers all the essential aspects of determining the urban rooftop PV potential as a whole package. It states the vital pathway by presenting the sub-potentials step by step along with their data resources to find the urban rooftop PV potential. Organizing the methodologies based on their approaches is another novelty of this paper. This paper also aims to present the past decade high impact attempts for determining the urban rooftop PV potential presented in the Scopus® search engine.
The structure of the presented paper is as follows: Section 2 is divided into two sub-sections. The first sub-section introduces different sub-potentials and their essential factors as well as data sources. The second sub-section illustrates the different methodologies and their approaches for determining the urban rooftop PV potential and their practical contribution. Section 3 shows the results of the systematic review. Section 4 presents a discussion on the results to form a better outlook for future studies and applications. Section 5 states the conclusion.

2. Materials and Methods

One of the essential steps of determining the urban PV potential is defining the data sources and their availability in addition to the methodology selection. First different sub-potentials and their essential factors, as well as data sources, are introduced. Then, methodologies and their approaches for determining the urban rooftop PV potential are illustrated.

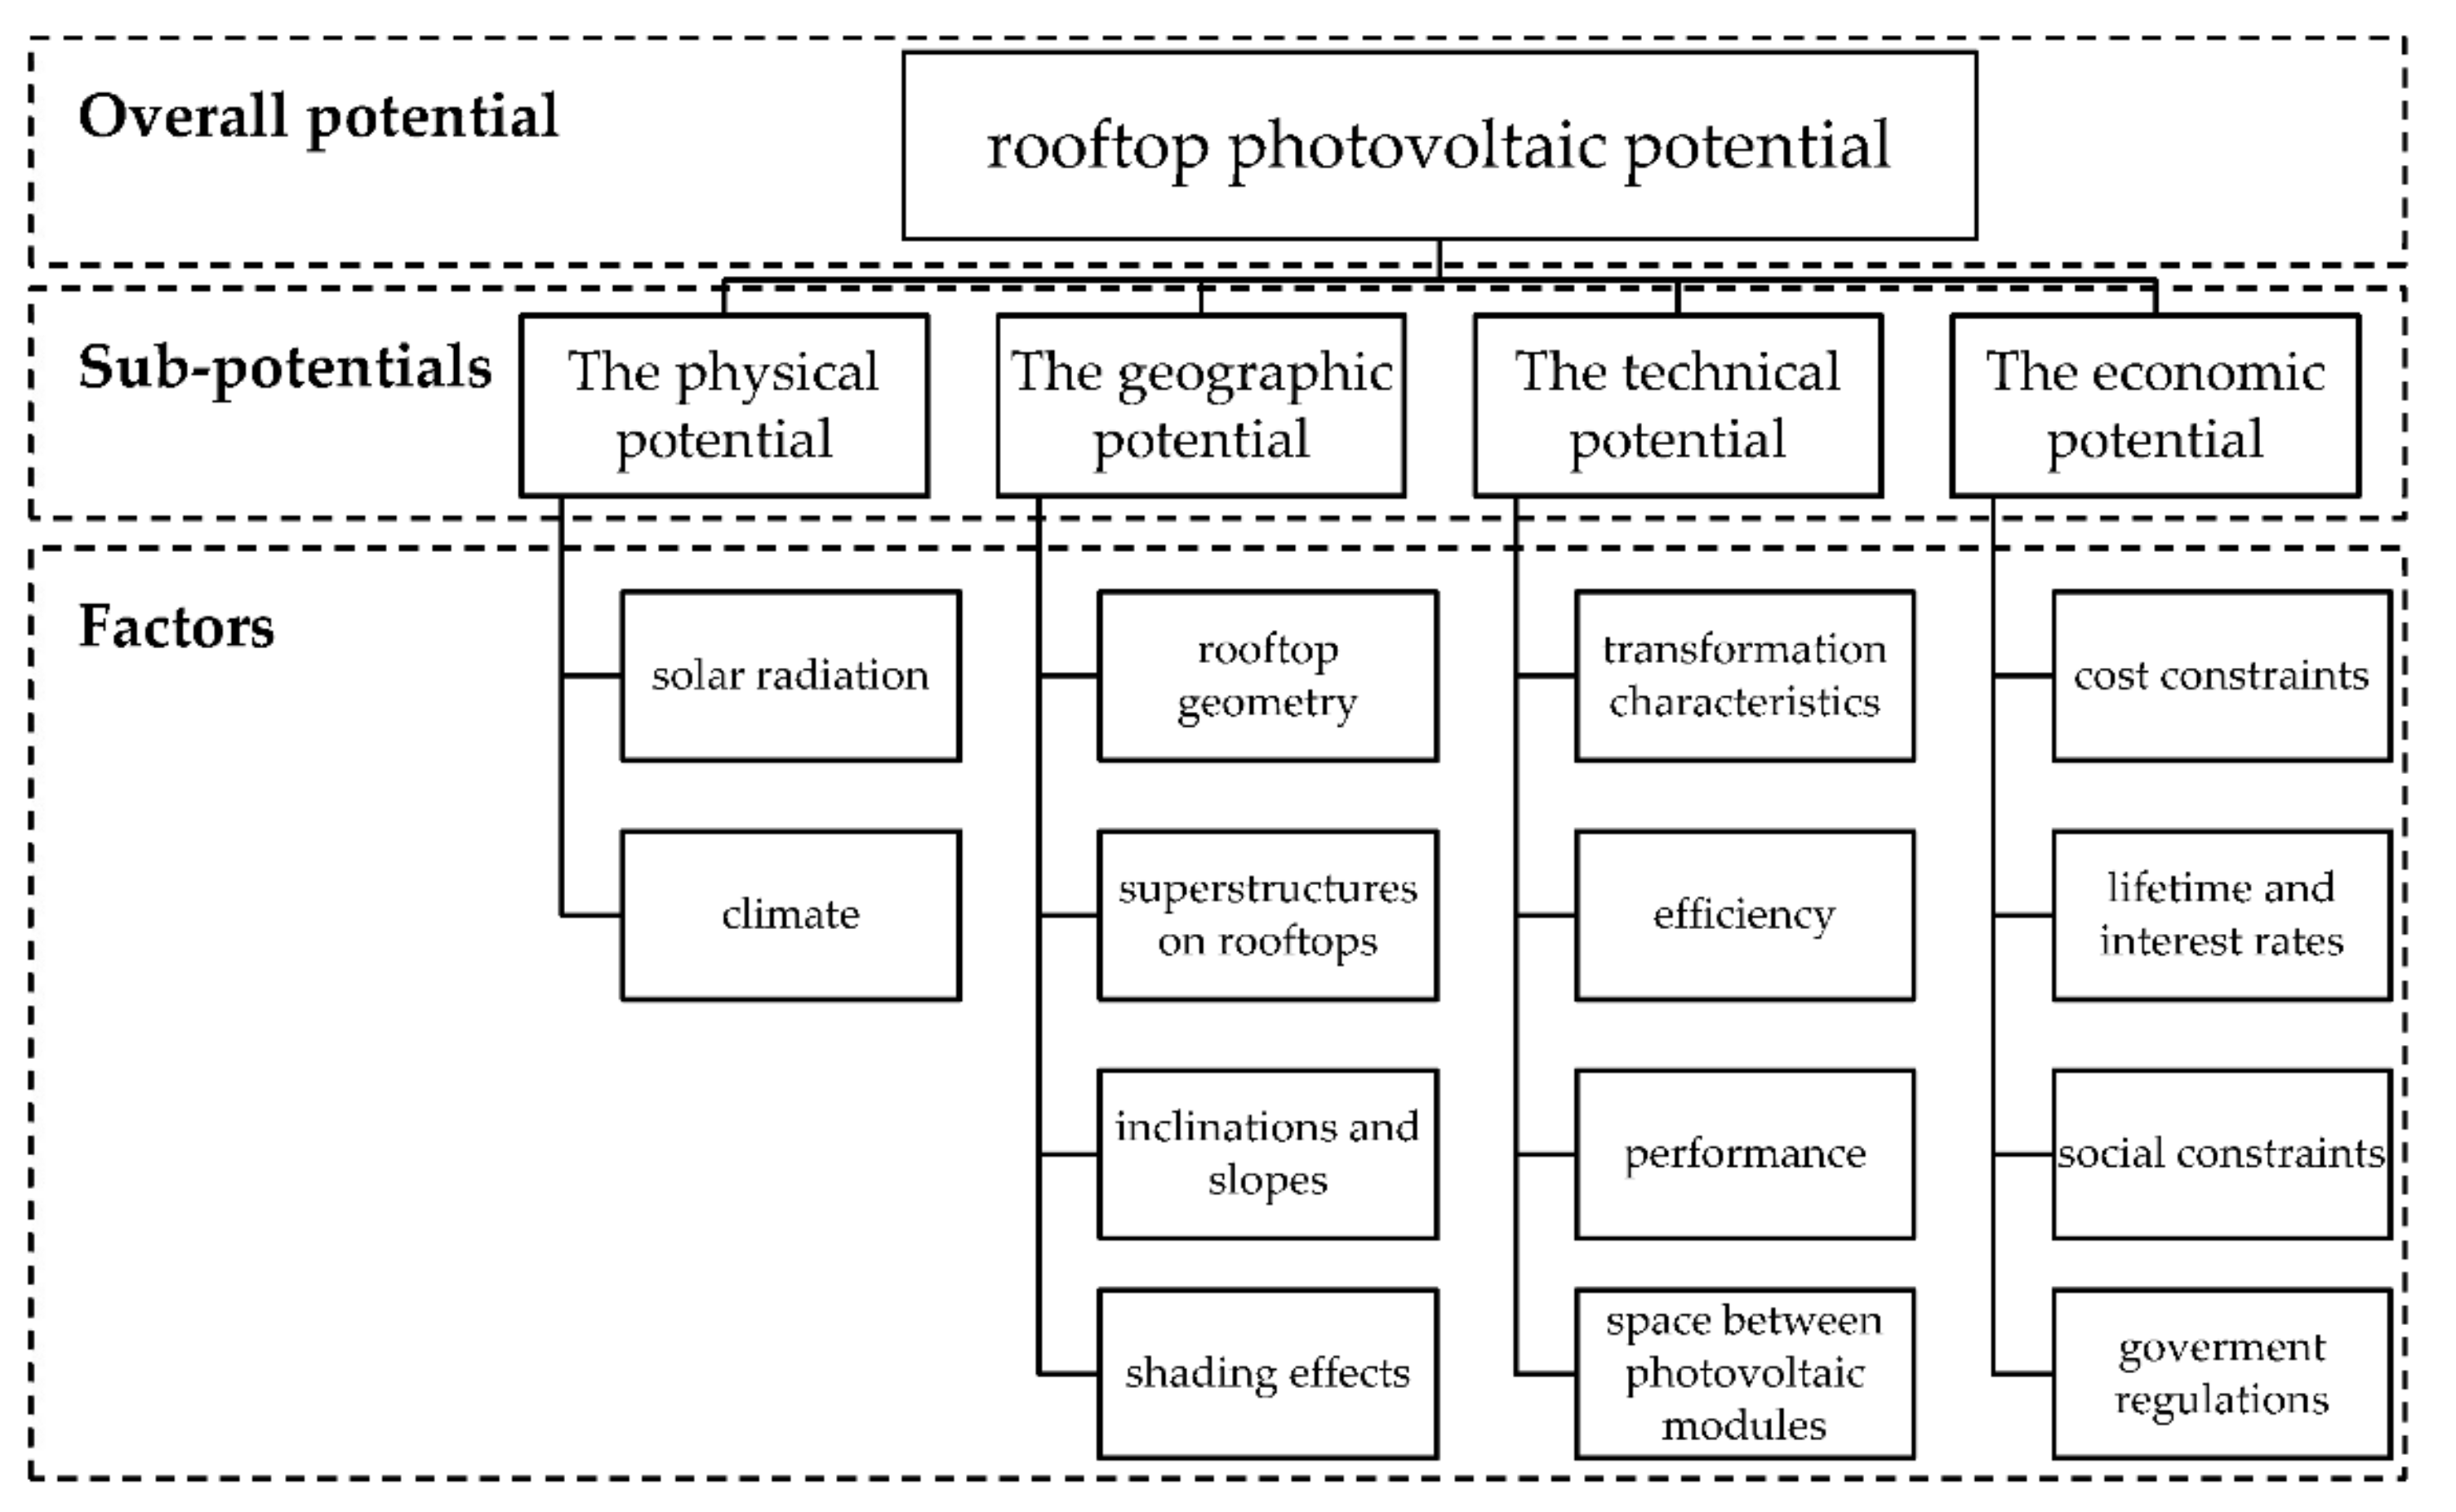
2.1. Sub-Potentials and Their Essential Factors

The dramatic development of technology in recent years has led to several attempts for urban solar photovoltaic potential determination. While factor selections strongly depend on the project scales and data availability, four different sub-potentials must be evaluated generally to determine rooftop photovoltaic overall potential. These sub-potentials are shown in Figure 1 and described as follows.

2.1.1. Physical Potential

This sub-potential presents the resource’s maximum energy limit which in this study is the sun’s total energy received by the urban areas [2,6]. Most of the considered factors for solar radiation estimation are related to meteorological data e.g., the monthly radiation, monthly clearness index [2]. Meteorological data can be obtained from ground-based meteorological stations [7], satellite observations [8], or different solar models by calculating the needed data from other available data sources [7]. Satellite data is preferable to measurement station data due to the better spatial coverage, increased resolution, and low missing data ratio (<1%) [8,9].

2.1.2. Geographic (Urban) Potential

This sub-potential states the impact of the built environment and the location constraints [6,9] which is usually determined by excluding reserved zones such as roads, beaches, rivers and lakes, and protected areas such as National Parks. However, these exclusion criteria are meaningless in determining the available roof area for photovoltaic installations [2]. Instead, the geographical potential expresses attempts to find suitable rooftops to install photovoltaics considering the essential factors such as the rooftop geometry, other buildings and trees shading effects, superstructures located on rooftops, rooftops inclinations, and rooftops slopes [6,9]. Regarding the methodology, project scale, and data availability in the study area, different data can be used for detecting the suitable rooftop photovoltaic potential. These data can be obtained from a variety of data sources such as statistical institutions data which present the number of buildings and the population in the urban areas [2], statistical construction data [10], Corine Land Cover data which present the urban land use, cadastral data [2], LiDAR data [4,6], GIS data [2,11] which can be modified using ArcGIS tools [6,12,13,14,15], and Google satellite images [1] or digital urban maps obtained from Google EarthTM [10].

2.1.3. The Technical (Electricity Generation) Potential

The maximum electricity production by transforming the solar energy received by the available roof area into electrical energy considering the technical characteristics [7,9] of the solar photovoltaic technology such as the efficiency and the performance [6] is the third sub-potential. The performance ratio is the difference between standard test conditions performance and the actual output of the system [16] which occurs due to the deviation from standard test conditions, and the losses of panel mismatch [6], dirt and accumulated dust particles [17], cables and inverters [6,18]. So, it is required to have an appropriate energy management strategy to improve system performance [19].
In addition to the technical characteristics of photovoltaics, the space needed between photovoltaic modules to avoid shadowing is another important aspect of determining the technical potential [2].

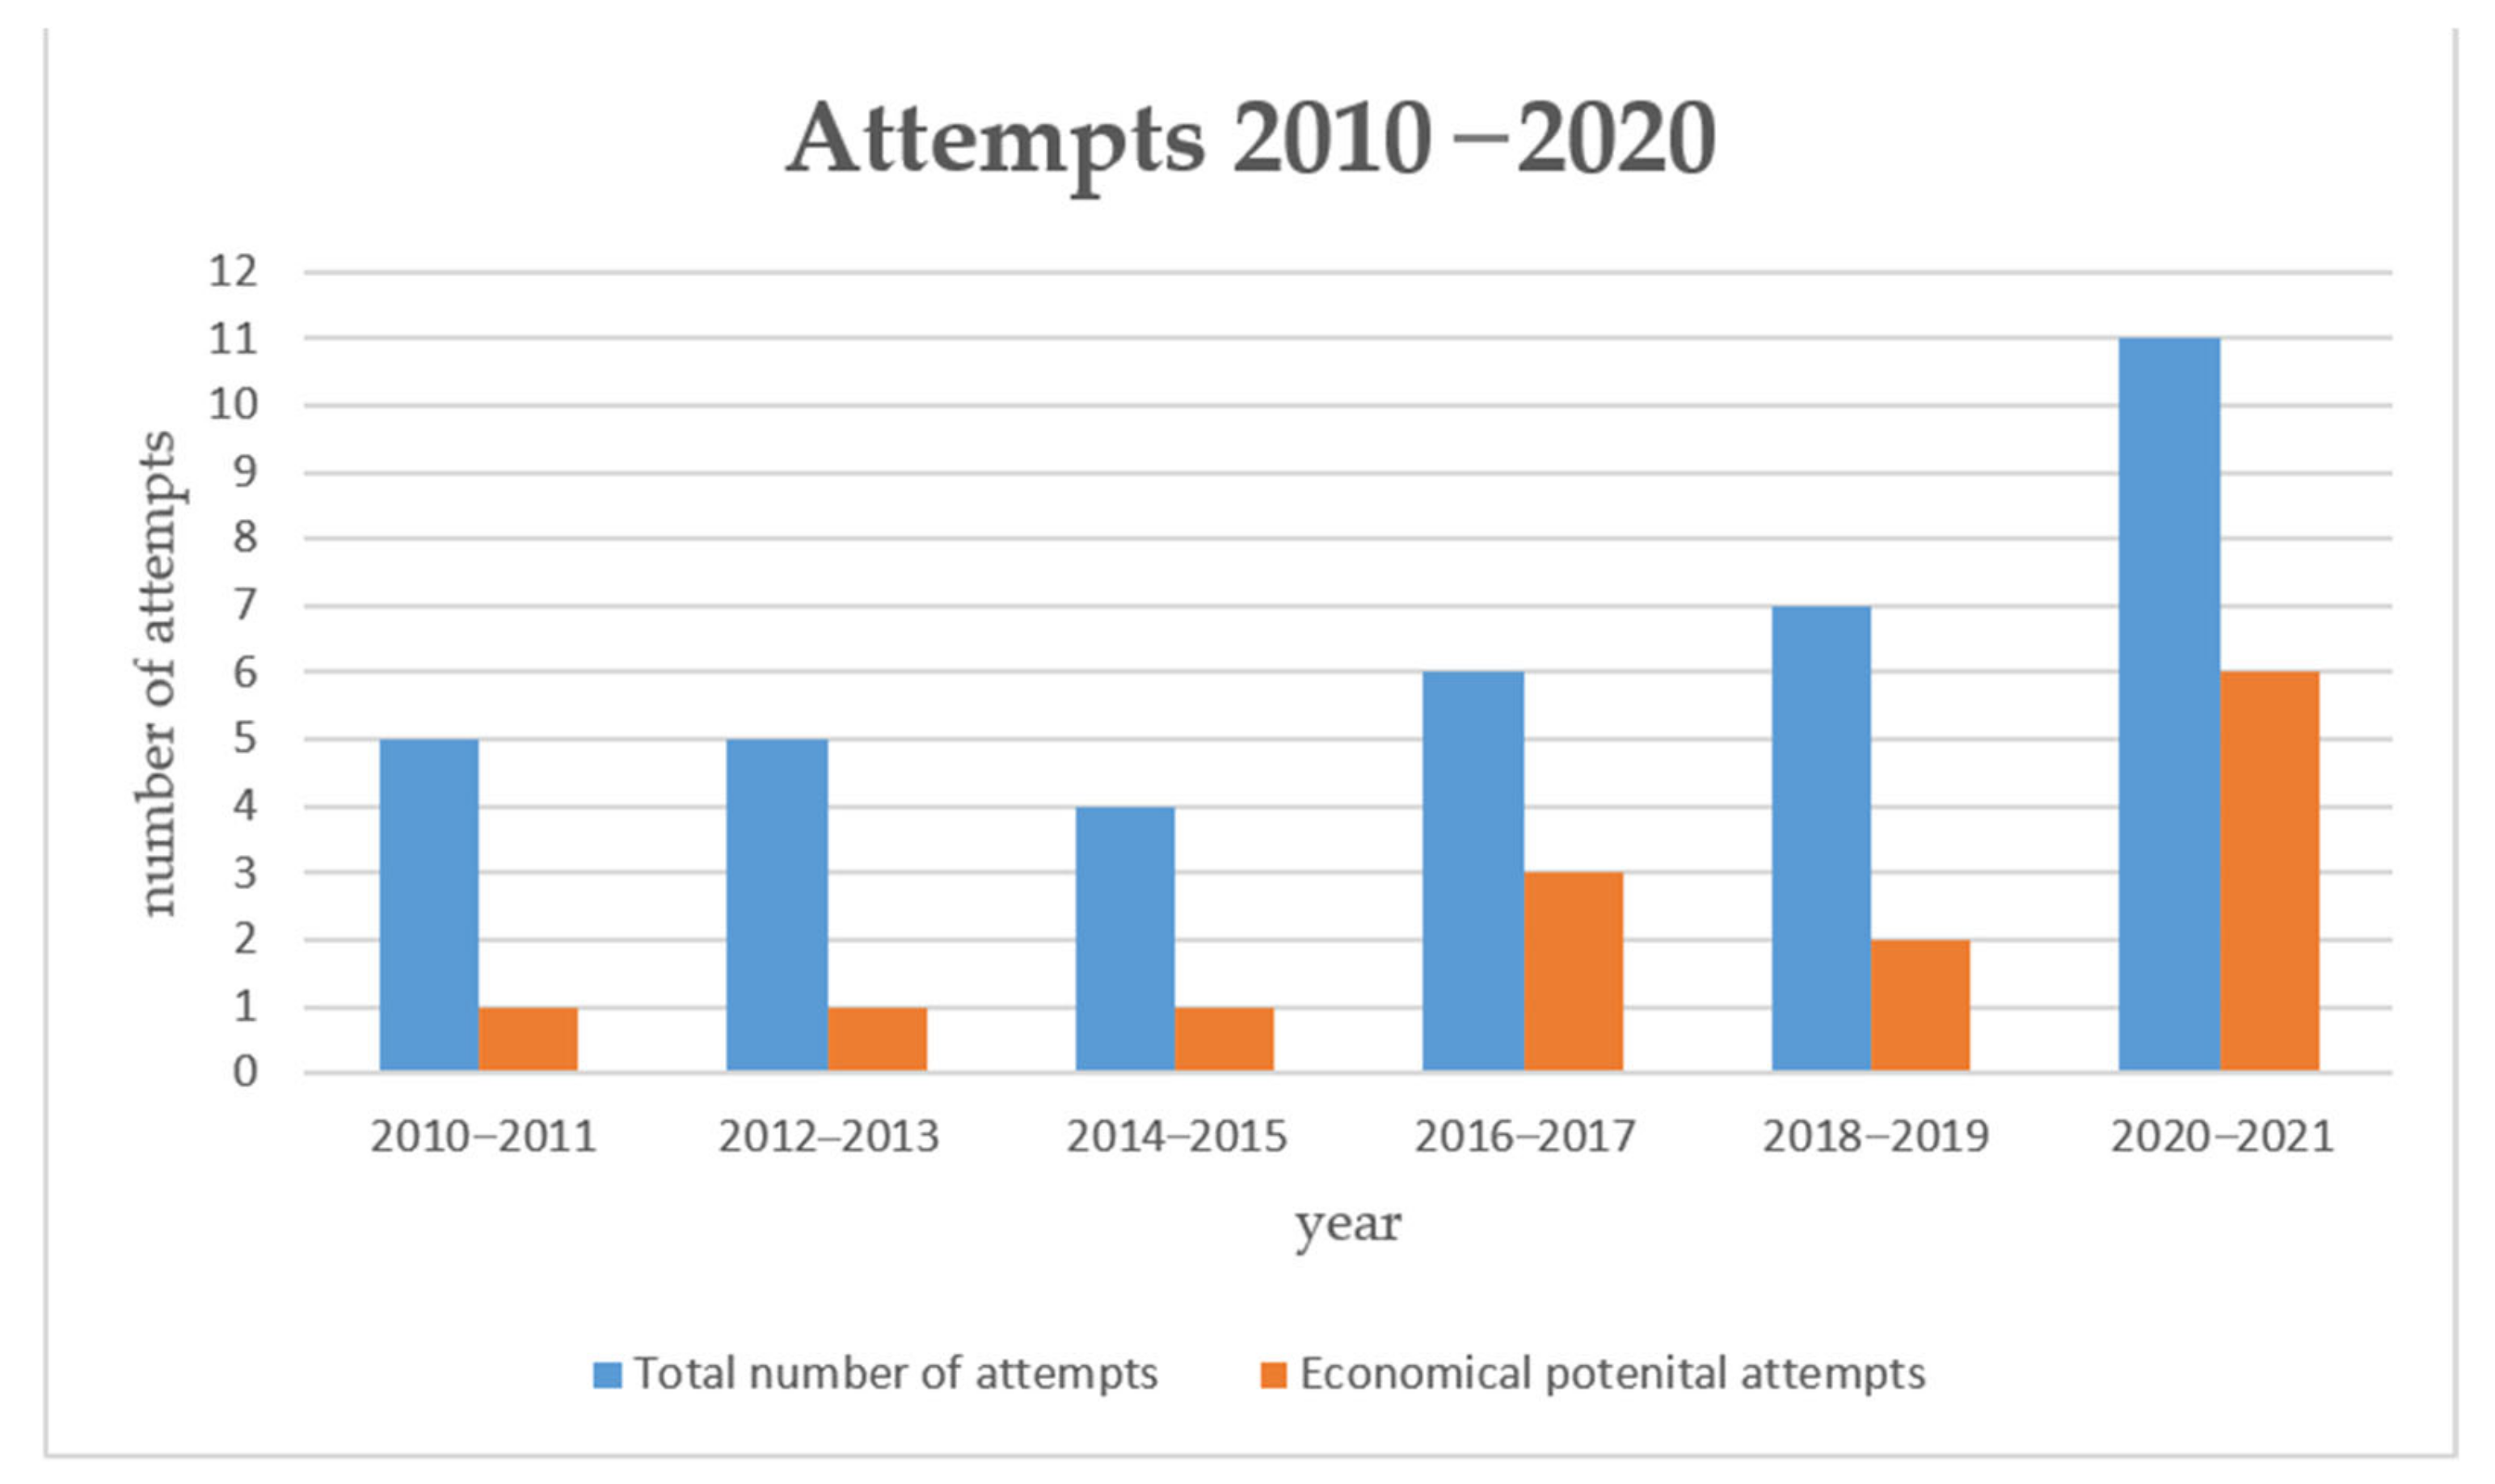
2.1.4. The Economic Potential

For a complete realistic potential assessment, the rooftop photovoltaic installation’s economic attractiveness under current market conditions must be investigated [20] by taking into account economical parameters such as installation costs, maintenance costs, installation lifetime, interest rate [11], operational cost [9], as well as cost constraints, societal constraints, and government regulations [21]. Due to the complexity of analysis conditions, such as uncertainly of the decision-making environment, projects interactions factors, as well as the need of maximizing the benefit and installed capacity [22], economic potential is frequently considered beyond the study scope and referred to future investigations [7]. However, building owners will only consider investing in rooftop photovoltaic installations when these facilities are economically justifiable [20]. In recent years, some individual framework analyses developed to assess economic potential [22], and economic criteria such as resource, risk factor, and engineering feasibility were established based on rooftop photovoltaic projects [23]. There are also some suggestions for economic factor involvements, such as the development of a techno-economic potential by maximizing the technical potential by taking into account economic factors [9].

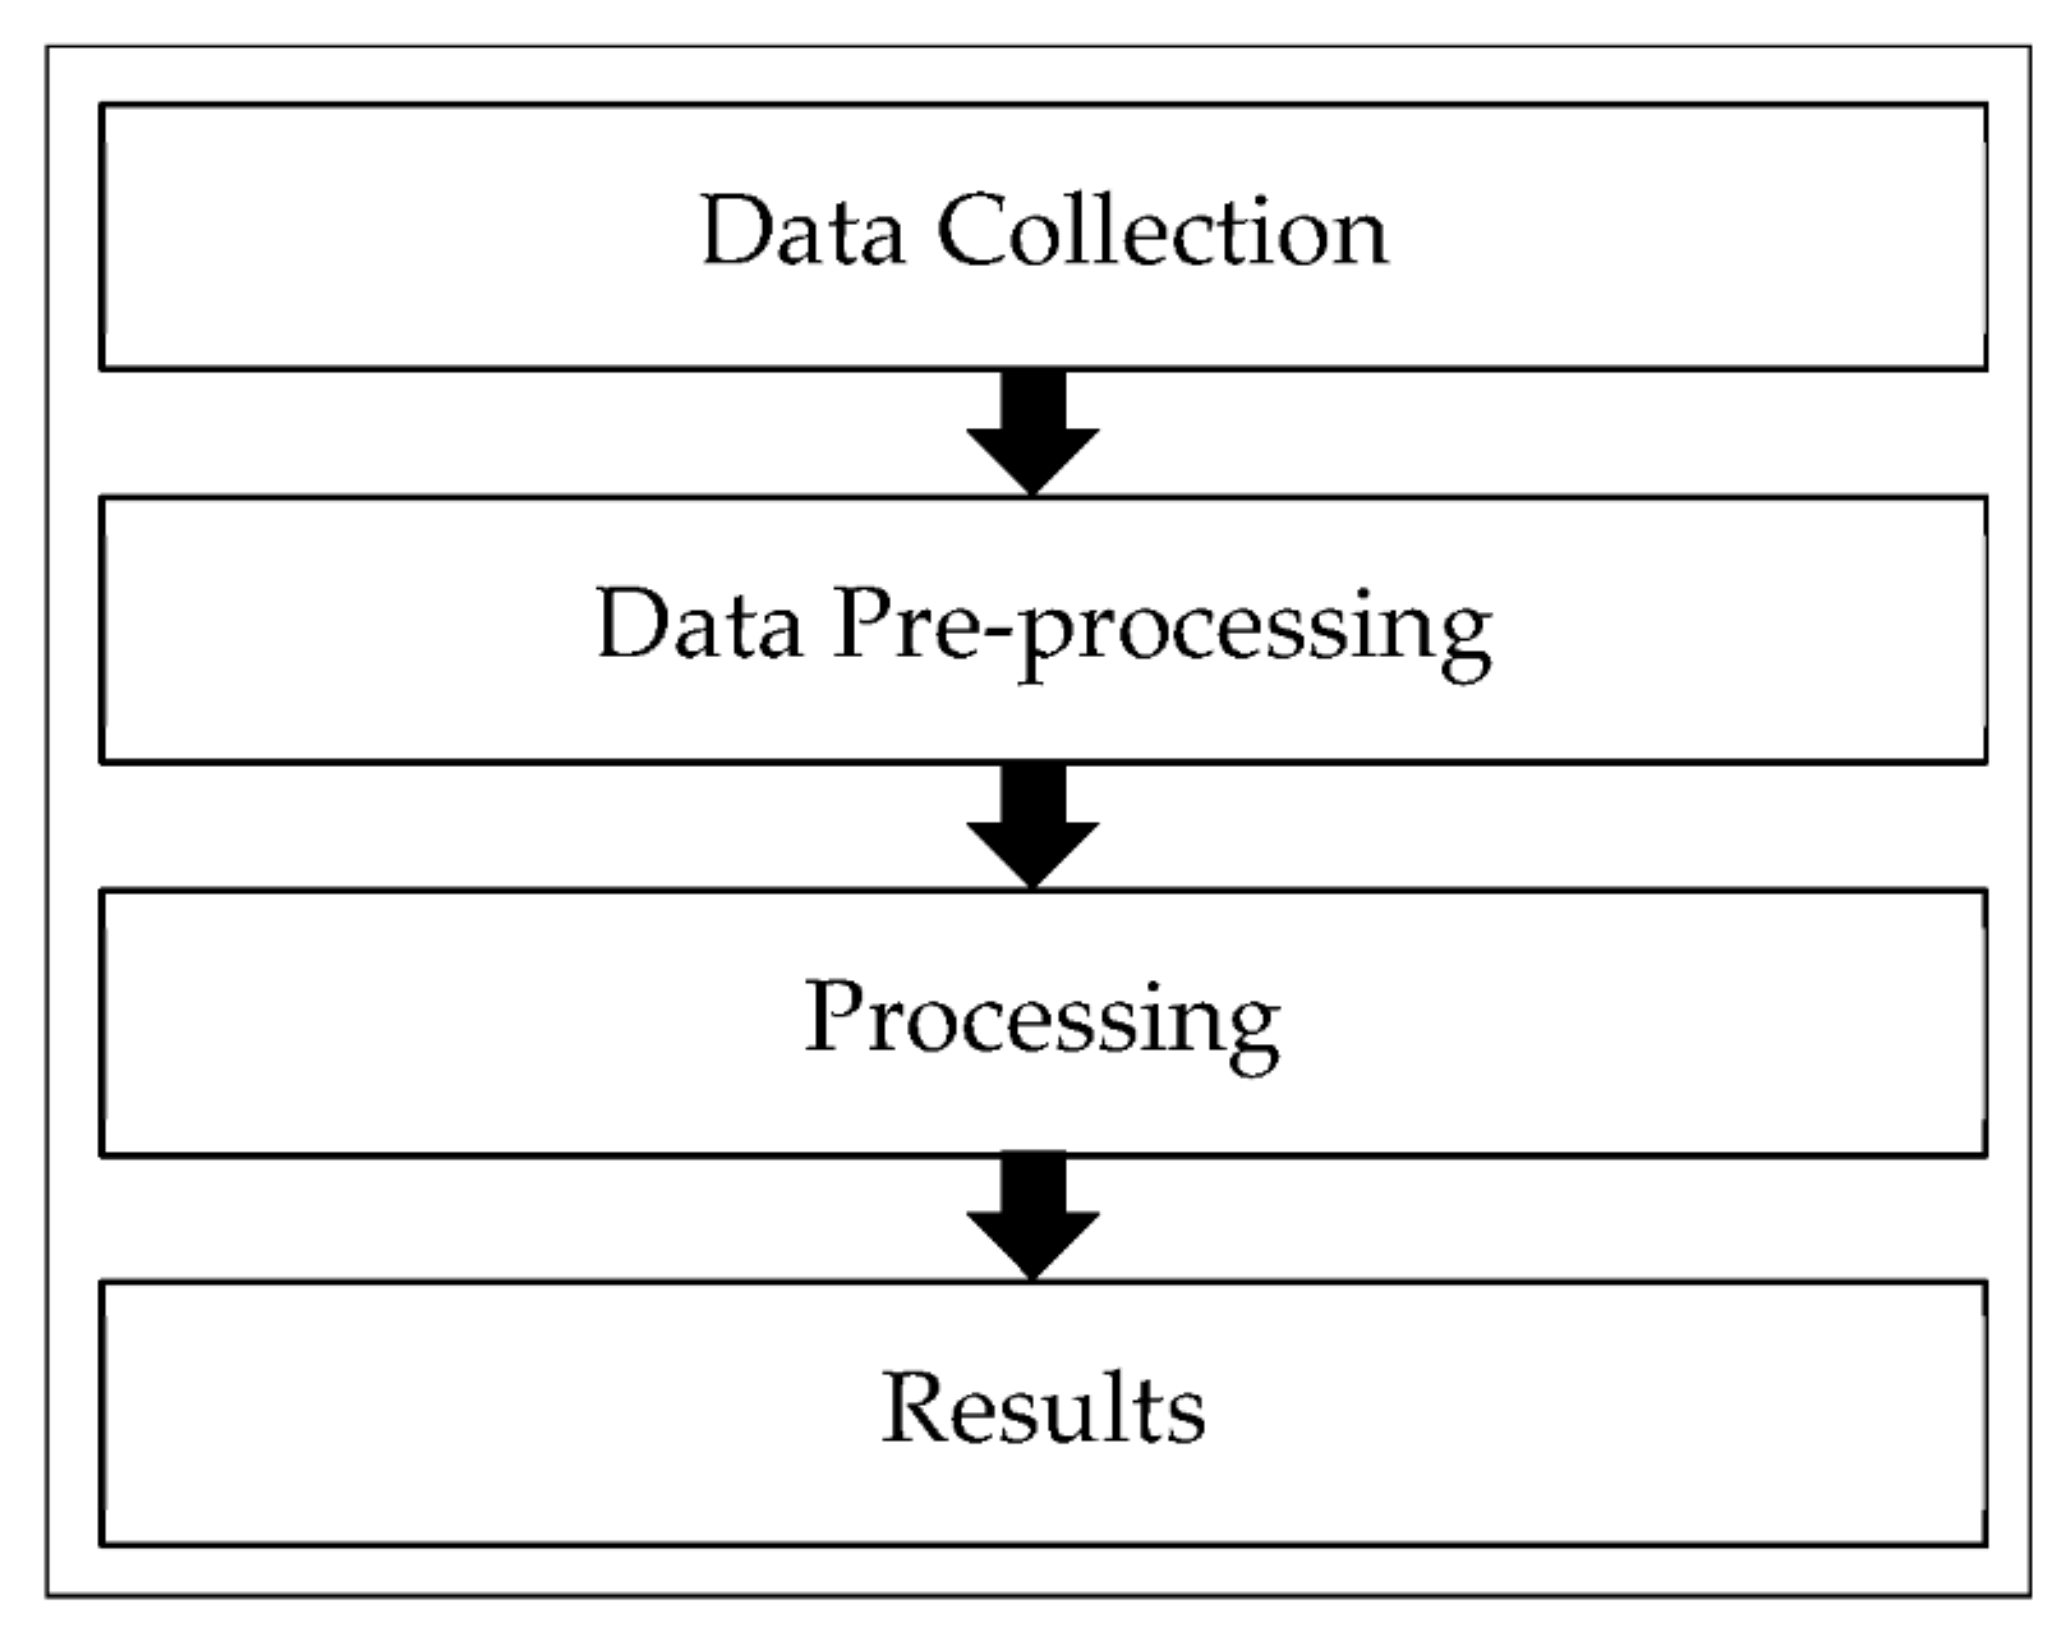
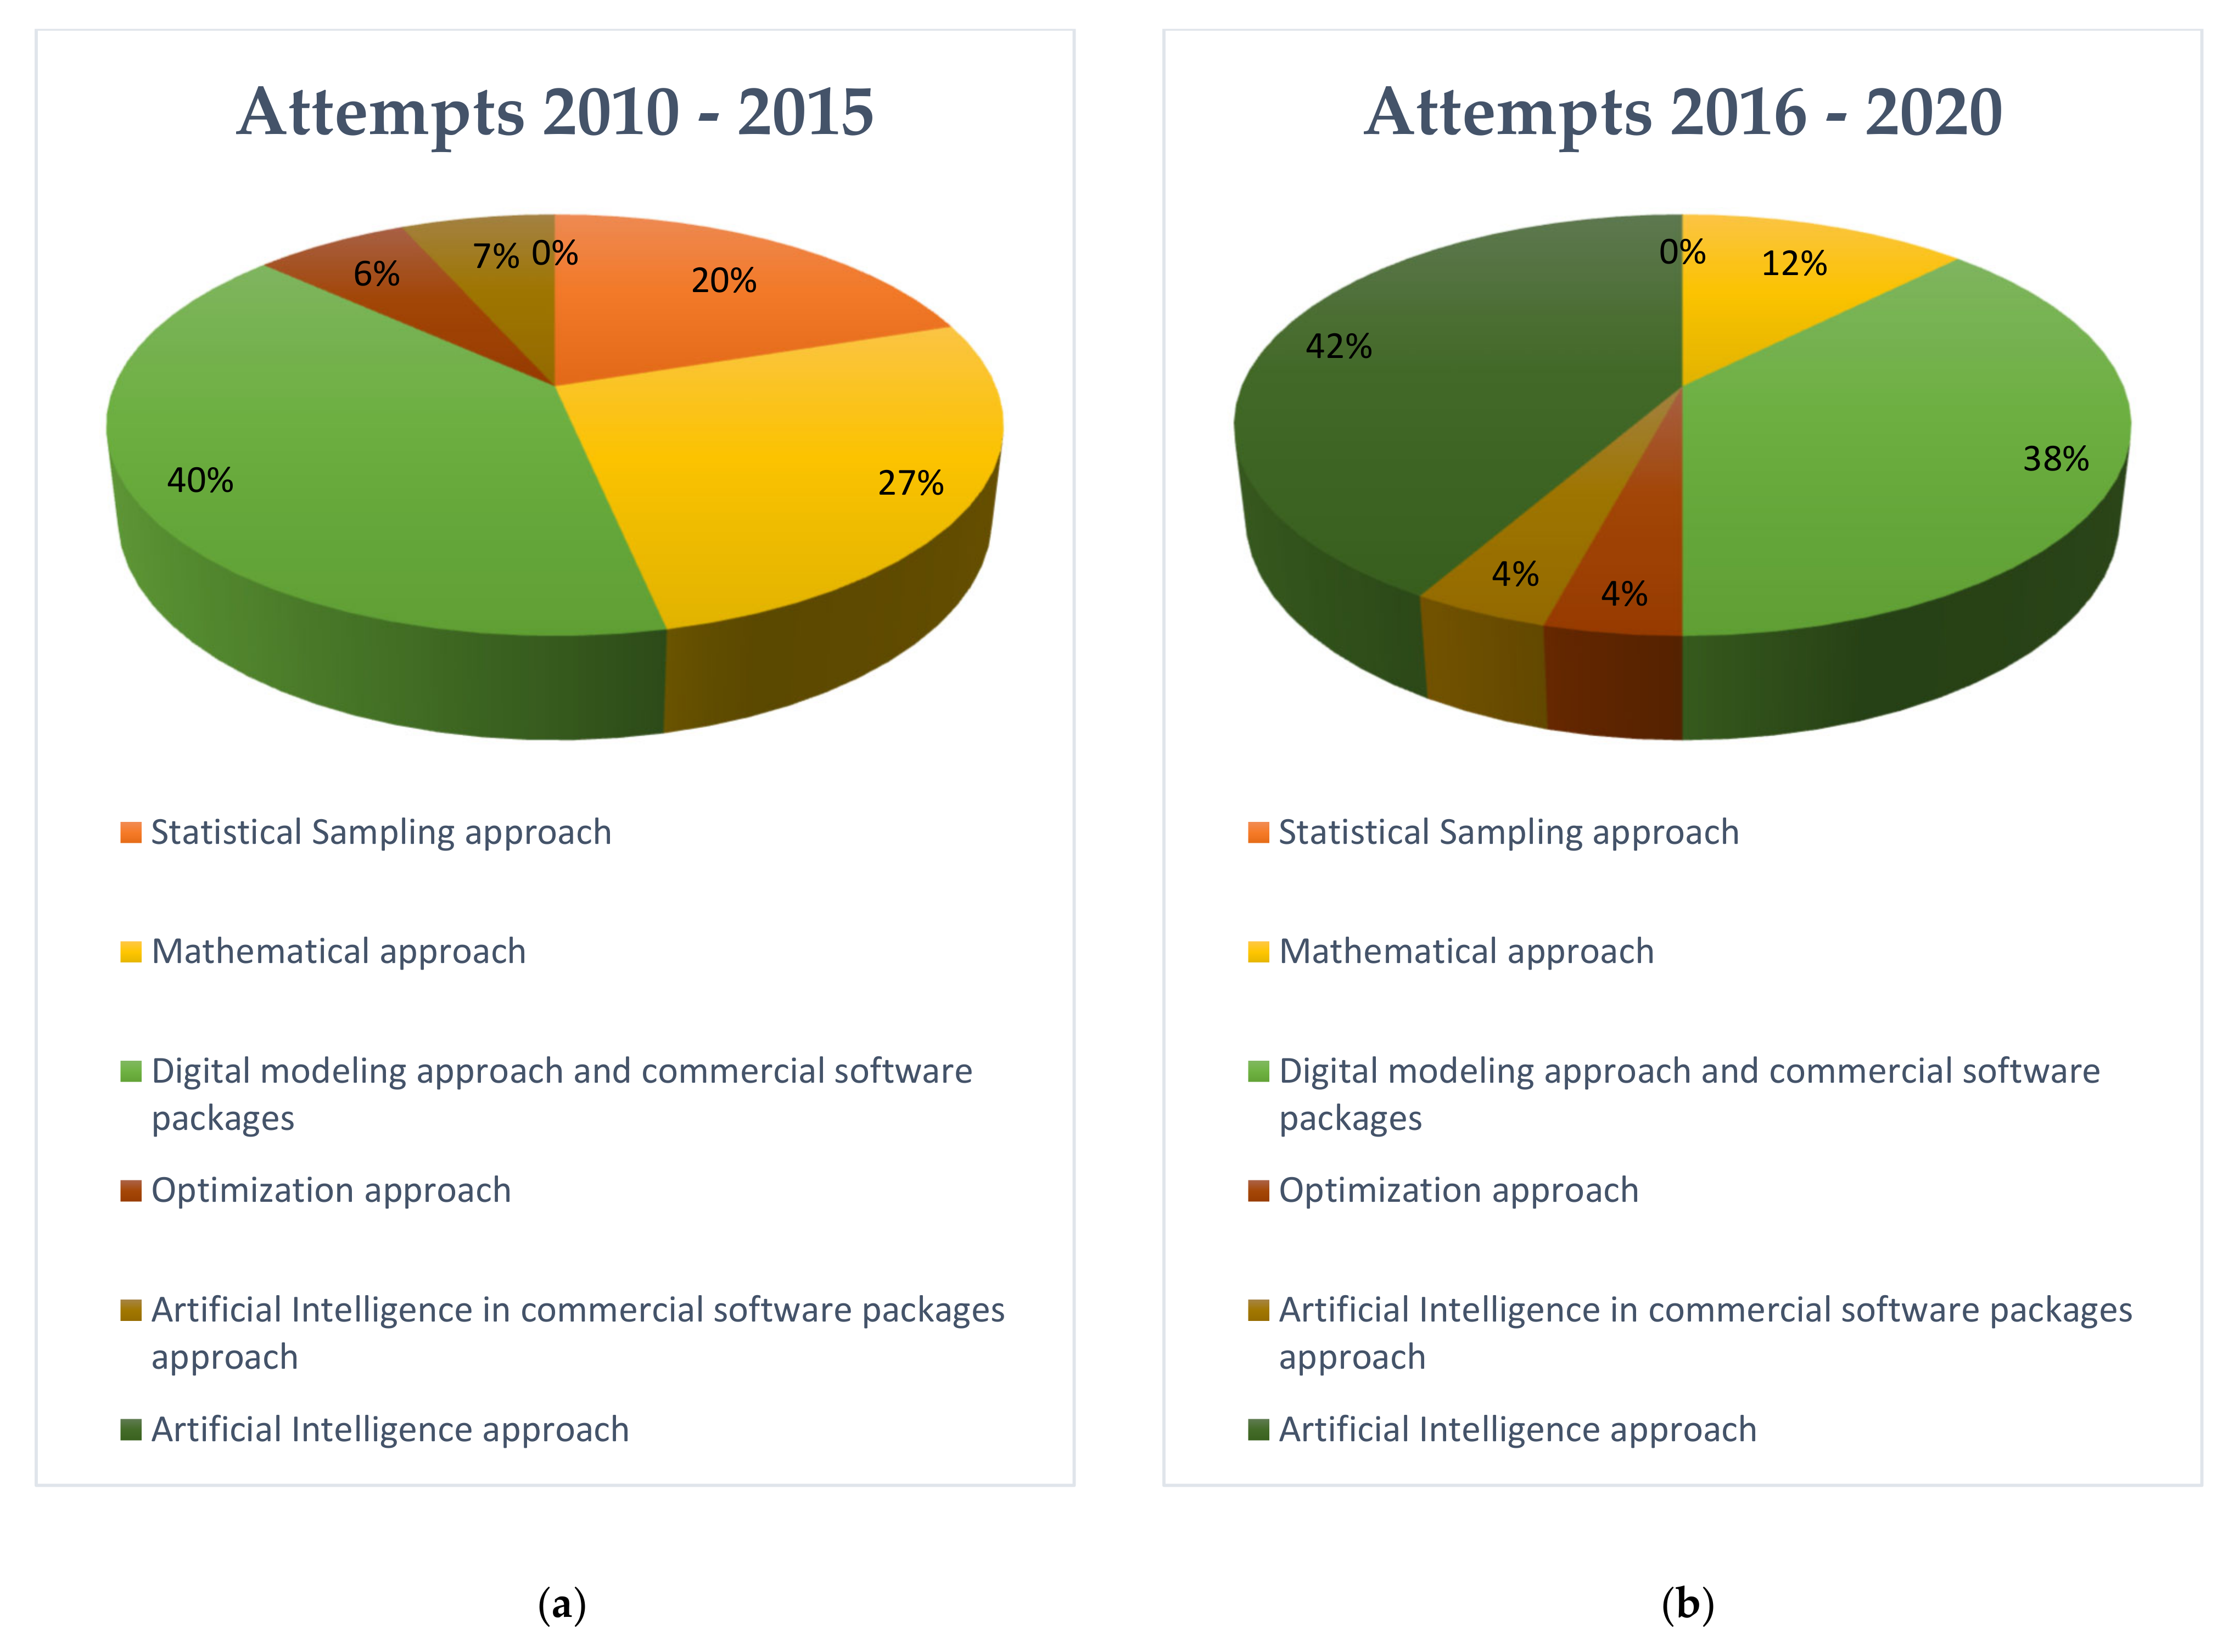
2.2. Methodologies and Their Approaches

There are a vast variety of urban solar photovoltaic potential determining attempts in recent years, using the same procedure presented in Figure 2. The first step is data collection which strongly depends on the data availability and the selected approach, followed by preparing and extracting the needed data in the pre-processing step. Different algorithms are used to prepare the data. Processing is the next step in which different approaches are used to determine the rooftop photovoltaic potential which leads to presenting the result in the final step.
As mentioned in Section 2.1, four different sub-potentials must be determined which leads to overall potential estimation. There are different models and algorithms for detecting the sub-potential, and each attempt has a central point which this study aims to present the novelty points of each methodology. So, the tools and approaches used to build the database and determine solar photovoltaic potential can be classified as follow.

2.2.1. Statistical Sampling Approach

The roof-integrated photovoltaic systems potential estimation for Spain’s urban areas was done based on a statistically representative stratified-sample of vector GIS maps, and data such as land uses and building densities. The central point of the methodology is a stratified statistical sampling based on the definition of representative building typologies. The mean available photovoltaic installation area was calculated with a 95% confidence level and ±32% error [2]. This method was also used as a basis to quantify the amount of thermal and electrical energy by the installation of solar hot water systems and photovoltaic systems in Spain to produce a quantitative picture of the possible limitations of roof-top solar energy [11]. The energy capacity of the grid-connected photovoltaic on building rooftops was also determined with a stratified sampling technique using statistical construction data, and Google Earth TM digital urban maps exported and scaled with the AutoCAD® software application. The mean roof area was determined with the 95% confidence level and the sample error margin of 10% by taking into account data such as building type, orientation, roof tilt angle, location, shading. The maximum residential rooftop photovoltaic potential in Andalusia (Spain) was calculated for two different roof types, namely flat roofs and pitched roofs which could satisfy the energy demand portion of 78.89%, which presents a dramatic reduction of external energy dependence to only 21.02% [10]. Table 1 presents a summary of attempt for this approach. With the development of advanced technologies in recent years, the use of this approach seems to be fading. This is due to the dramatic increase of computation facilities for human aiding purposes. One of the vital data to find rooftop photovoltaic potential are meteorological data, and due to the obvious usage of this data, it is not mentioned in any summary of attempt tables. Statistical data also represent the data obtained statistically such as population, building density, national dataset, census information, and municipalities dataset. Worth mentioning, error rates depend on methodology, data accuracy, and validation method.

2.2.2. Mathematical Approach

Photovoltaic solar potential over Piedmont (north-west of Italy) was estimated by using data such as Publicly Available Joint Research Center of the European Commission raster maps (used for solar radiation estimation) and the Numerical Technical Regional map (used for geographical-cadastral analysis) which was analyzed by ArcGIS and processed in MATLAB®. Worth mentioning is that roof type topology is assumed to be double-pitched with an angle of 20° and only one of two pitches is considered for module installation. The roof surface is determined by calculating all coefficients such as roof type, feature, solar-thermal. The shadowing effect of tall buildings is assumed as a coefficient of 0.46 due to the lack of 3D city modeling. In the case of energy production, three different scenarios with different technologies were measured that may reach 6.9 TWh/year in a region at the best scenario [24]. According to the previous methodology, a new algorithm based on aerial georeferenced images (ortho-image) was developed in MATLAB® to determine the available roof area of Turin. The proposed algorithm was able to calculate roof availability, shadows, pitch brightness, and angle of the installations by using data such as geographical metadata of Turin and Orthoimagery (ortho-image) data in MATLAB® code. A mean accuracy error of 10% on overall results was stated. In comparison with previous work, the available roof area of Turin can be 41% higher. Result in the photovoltaic potential increase from 508 to 719 GWh/year [25].
The development potential of rooftop photovoltaic technologies along with their environmental benefit was investigated in Hong Kong. The ground floor was transferred into the gross roof area, and solar sustainability and architectural sustainability were calculated to determine photovoltaic rooftop space potential. The rooftops installation capacity potential for photovoltaic systems and annual energy output were estimated as 5.97 GW and 5981 GWh respectively with an error rate of 10–15%. Encompassing 14.2% of the total used electricity of Hong Kong. Additionally, approximately 3,732,000 t/y of greenhouse gas emissions reduction was estimated [26].
Residential solar rooftop potential was presented in Riyadh (Saudi Arabia), to assess the cost-efficiency, by combining two different methodological approaches, namely standard Leverage cost of electricity approach, and nightlight intensity methodology. It analyzes Riyadh’s metropolitan areas to identify household clusters and urban zones’ nightlight intensity. Solar photovoltaic rooftop generated electricity cost was determined based on the technology cost and Riyadh’s irradiation conditions. The results showed that rooftop solar PV cannot compete with electricity from the grid due to the current residential electricity prices. Even assuming aggressive reductions in the investment cost of solar technology, photovoltaic solar rooftop installations were not encouraging [27].
An evaluation of the potential contribution of rooftop PV to the future electricity mix in Spain carried out using ArcGIS and the national geographical database, considered five sustainable scenarios, each comprising different shares of centralized renewables, rooftop PV, and storage. The storage capacity was determined for each generation scenario, and the cost-effective portfolio combination was obtained. The results stated that a sustainable electricity system at a lower cost than current wholesale market prices, providing up to nearly 45% of the demand, is possible for Spain [28].
Mumbai (India) rooftop photovoltaic potential was estimated by a methodology that uses GIS image analysis and high-granularity land public data to predict the value of building footprint area ratio. After simulating effective sunshine hours in PVSyst, the installed capacity, the capacity factor of photovoltaic panels, and daily and annual production were studied. Results presented a potential of 2190 MW which concluded that photovoltaic systems can provide 12.8–20% and 19.7–31.1% of daily demand with median and high-efficiency panels, respectively, as well as 31–60% of morning peak demand [29]. The same methodology was also used as the based estimation. To expand the methodology for other cities of India, extrapolation factors were identified and modeled with the help of mathematical models and micro-level simulations in the PVSyst. Due to the lack of high-resolution urban building data, the focus is mainly on developing a workable estimation instead of an accurate one. After illustrating the methodology to 13 Indian cities with an overall population of 79 million, the total photovoltaic potential of these cities estimated about 17.8 GWp [30]. An overview of the approach’s attempts is presented in Table 2.

2.2.3. Digital Modeling Approach and Commercial Software Packages

A combination between Urban topography of LiDAR data and pyranometer measurements of solar irradiances was proposed and completed by a digital elevation model, Heuristic vegetation shadowing, and multi-resolution shadowing model in Maribor (Slovenia). This methodology implemented the roof surfaces rating based on their solar potential and sustainability for photovoltaic systems installation. After analyzing different influential factors, a comparison was made between the proposed method results and actual measurements showing a correlation agreement of 97.4% [31].
An estimation of photovoltaic potential in Lisbon (Portugal) was conducted by using LiDAR data, population distribution estimation, Building of a Digital Terrain Model, Digital Surface Model, aerial digital photography, and ArcGIS solar analyst extension tool. The result stated that the rooftop potential of 538 identified buildings was about 11.5 GWh. This amount can supply 48% of local energy demand according to an average consumption of 4.71 MWh for each person. It is noted that by choosing the photovoltaic location carefully, 10% of the available area can collect 13% of available energy [15].
By using GIS and LiDAR data, a multi-criteria approach for rooftop photovoltaic potential estimating in Lethbridge (Canada) was developed, also for determining economic attractiveness, an economic assessment by utilizing market prices was conducted which determined economically feasibility of 96% of available rooftops. It is achieved the photovoltaic energy production of about 301 GWh with a total uncertainty of 9.5%, which can cover 38% of electricity demand [7].
A methodology for calculating the building roofs and facades’ economic potential for photovoltaic installation in Karlsruhe (Germany) was proposed. To simulate solar irradiation, the validated lighting simulation tool radiance was applied to a 3D city model. It is concluded that facades almost have a triple area in comparison with roofs, however, they only receive 41% of total irradiation due to their non-optimal inclination and orientation. The results indicated that photovoltaic installation on facades had 13% of the economic potential. A detailed constant reduction factor was suggested for future studies to fulfill the lack of reliable information on the suitability of building facades [20].
Extraction algorithms combined with PV system simulations were proposed to determine rooftop photovoltaic potential in Stuttgart (Germany) by using geoinformation systems and a 3D model. Some steps of roof surfaces and orientations extraction in the methodology was a semi-automated process based on LiDAR data. Photovoltaic own consumption was also studied on a building with available electricity consumption data which represent 25% of annual electricity consumption for the studied building. The results showed the ratio of photovoltaic consumption and total electricity consumption of the district is 17%, and the ratio of total PV energy production and the total electricity consumption was 35% [32].
A methodology for determining photovoltaic potential at the regional and urban scale of Ludwigsburg (Germany) was developed by using CityGML geometry description and 3D models for simulations, analyses, and visualization on the SimStadt platform. Emission assessment, economic and technical potential, as well as two different efficiency scenarios of photovoltaic, wafer-based silicon modules and thin-film modules, were investigated. It was concluded that by using all available roof space, 77% of the region’s energy demand could be covered [33].
A method was developed that predicts a photovoltaic potential of over 17,000 rooftops for Cambridge (USA) based on the combination of 3D models, GIS, and LiDAR with the Daysim irradiation simulation engine, hourly rooftop temperature, and typical meteorological climate data annually. The outcome can combine by online mapping and financial modules such as energy-saving, carbon saving, installation cost, financial payback, module placement, and system size to interest the potential building owners to install photovoltaic panels on buildings. The result of simulating noted that annually predicted energy production was 3.6% and 5.3% less than actual measured energy production in the student center and the residential zone, respectively [34].
Residential rooftop solar potential was detected in Erie County (USA) by using remote sensing data and land use data such as LiDAR data, Microsoft Building Footprint Data, and National Hydrography Data. Results presented a relative solar potential distribution among socio-demographic groups and urbanization contexts which indicates that low-income population had relatively low access to rooftop solar as well as limited access to potential community solar sites in their neighborhoods [35].
A digital surface model containing the topography, buildings, and trees of Auckland (New Zealand) was developed by using LiDAR data. In order to calculate roof area annually solar radiation, a solar radiation tool in ArcGIS was used with the model by taking into account latitude, date, time, climate condition, orientation, and slope as well as shading of nearby buildings and trees. For policy insights, census data such as household income and average number of residents were used to obtain financial potential as well as electricity demand of neighborhood, but there is still a need of developing a model for individual houses, as well as market models for adding low-income customers in solar electricity generation [36].
Due to the high impact of the shadowing factor on determining available roof area, an estimation method was proposed for the photovoltaic system in Seoul (South Korea) to analyze building shadowing by using Hillshade analysis, and rooftop area estimation was 4,903,079 m2 [37]. As concluded in the previous method, shadows play an essential role in determining the photovoltaic potential of rooftops, so a methodology for estimating rooftop solar potential was proposed with improvements such as considering localized characteristics of rooftop on macro-scale, and changing sun location annually. While the methodology followed hierarchical steps, the main attention was on geographical potential as the previous methodology which was conducted by collecting and preparing data, building shadow analysis, and finally estimating rooftop area. It was concluded that in the whole year of the Gangnam district of Seoul, the photovoltaic potential at noon varied from 79,117 to 147,222 MWh, while physical and technical potentials were 9,287,982 and 1,130,371 MWh, respectively [38].
A quick-scan yield prediction method was used to determine rooftop photovoltaic potential and tested in Eindhoven (Netherlands) by reconstructing virtual 3D roof segments using aerial imagery and developing a fitting algorithm to automatically fit the photovoltaic modules on rooftops. Aerial imagery, weather, GIS, and LIDAR data are used as quick-scan method inputs data. Commercial software packages of Solar Monkey, photovoltaic geographical information system, and the simplified skyline-based approach developed in photovoltaic material and devices were used to calculate the annual rooftop potential. Results presented relative standard deviations of 7.2%, 9.1%, and 7.5%, respectively, for mentioned approaches [39].
A comparison of rooftop solar energy potential estimation by Unmanned Aerial Systems (UAS) and LiDAR data was carried out. ArcGIS solar analysis toolbox was used to determine the rooftop solar radiation values. Results indicated that Higher Resolution UAS data was a better match, and 36% improvement for aggregate irradiation estimation by using digital orthophotos from UAS compared to LiDAR [40].
Additionally, a nonlinear PV potential estimation by using LiDAR data and digital terrain model was presented in Maribor (Slovenia) where PV modules and nonlinear efficiency characteristics of the solar inverter are estimated by modeled functions by considering different influential factors such as topography, vegetation, and shadowing which had a key role in the accuracy of the proposed method. The results of a comparison between constant and nonlinear efficiency characteristics of solar inverters and PV module types showed that largest difference detected during summer [14].
Rooftop solar system energy potential and economic performance of Khalifa City and Zayed City (Abu Dhabi) were estimated by adopting a geographic information system-based method using digital building shape data provided by the Abu Dhabi government. The number of buildings, their types, and the rooftop area of each building were calculated by Esri ArcGIS software. The result indicated that the capacity estimated in Khalifa City would cover 11 to 20% of the annual electricity building’s demand, however, the levelized cost of electricity was economically infeasible leading to a policy suggestion for the government [41]. Table 3 illustrates a summary of the approach’s attempts.

2.2.4. Optimization Approach

A generated electricity estimator of a photovoltaic system in the northern, southern, and central parts of South Korea was developed. The results of sensitivity analysis on impact factors by using an energy system, GIS, and genetic algorithm, showed 1.12, 1.37, and 1.62-fold differences in annual electricity generation based on the regional factor, the slope, and the azimuth of the installed panel, respectively [42].
Rooftop photovoltaic systems’ cost-optimal economic potential was calculated in Austria, based on neighborhood energy communities. The photovoltaic system’s profitability was determined by an optimization model. Then, an algorithm allocated buildings to settlement patterns. Finally, the cost-optimal economic rooftop PV potential on a large scale was estimated by upscaling. Different sensitivity analyses were also conducted by taking into account the electricity prices, distribution grid tariff structures, and photovoltaic system cost. The results stated that the demand photovoltaic capacity would meet the Austrian 2030 policy goal of a 100% renewable electricity generation [43]. A summary of attempts for this approach is presented in Table 4. This approach tries to optimize the sub-potential overlaps that other approaches tend to find. However, due to the complexity of this approach and the recent development of more user-friendly advanced technologies, it seems there are not many attempts in this field.

2.2.5. Artificial Intelligence in Commercial Software Packages Approach

The rooftop solar photovoltaic potential in Ontario (Canada) was determined by five essential steps. Alongside GIS data, census data, municipalities roof print data, Digital Raster Acquisition Project-East, population, population density, and land area were used. The Feature Analysis extraction tool in ArcGIS was applied for obtaining roof areas with a 95% confidence level and an error of 15% on each data point of population. A more accurate energy modeling by considering an analysis in structures shading and orientation was suggested to increase the accuracy [44].
A merging national datasets methodology was developed to estimate rooftop solar potential, rooftop photovoltaic systems distribution, and socioeconomic and demographic characteristics for four US cities namely Riverside-California, San Bernardino-California, Washington-DC, and Chicago-Illinois. The National Renewable Energy Lab’s Rooftop Energy Potential of Low-Income Communities in America (provides residential rooftop solar potential estimation), Stanford University’s DeepSolar (estimates the installed residential PV systems), and the United States Census Bureau’s American Community Survey (estimates of socioeconomic, demographic, and housing characteristics) were the publicly available data sources. Geographic information systems software was used to map the total rooftop potential distributions, low and moderate-income market share, and total rooftop penetration for visual comparison. Four regression models were also developed to explore the relationships between solar penetration and area-level socioeconomic and demographic characteristics [45]. Table 5 illustrates an overview of attempts for this approach.

2.2.6. Artificial Intelligence Approach

A computational data-based machine learning methodology with geographic information systems was used to estimate rooftop photovoltaic potentials for 1901 out of 2477 Switzerland’s communes. The supervised learning Support Vector Machine algorithm was used while six-fold cross-validation was used for detecting the optimal model parameters and the root-mean-square error evaluates the model’s performance and the accuracy estimation. The total number of input data was 1901 communes, 42 points with available roof characteristics were the labeled data for testing and training. Further, 75% of the data were devoted to training, and 25% for testing. In addition, 1859 communes had unknown roof characteristics and must be predicted. This method estimated the monthly global solar radiation and the geographical potential such as available roof area, roof slope, and shadowing effects on the roofs using LiDAR data, different land uses from the CORINE land cover data in vector polygon format, population density, and building residential typology. The results stated average value of 81% of each building’s total ground floor area was equal to the photovoltaic installation’s available roof area, and the estimated energy production amount was 28% of Switzerland’s electricity consumption [6]. Different types of building rooftop shapes can also affect the overall rooftop photovoltaic solar energy potential. The rooftop shapes of 10,085 buildings in Geneva (Switzerland) based on receiving solar energy potential and photovoltaic installations useful area were classified with a machine learning approach using support vector machine classification, by accounting six different types of roof shapes, flat and shed, gable, hip, gambrel and mansard, cross/corner gable and hip, and complex roofs. The combination of MATLAB® and solar radiation analysis tools in geographic information system, as well as LIDAR data, were also used. It was concluded that the lowest PV potential was for hip roofs, while the highest PV potential was for the flat and shed roofs. The useful roof area and the building footprint ratio was close to one for most of the roof shapes, and due to the availability of footprint areas, they can be used as approximate substitutes to assess useful roof areas for PVs [4]. A combination of geographic information systems, solar models, and random forests machine learning algorithm was presented to estimate the potential for rooftop PV solar energy in Switzerland using Digital Orthophoto Map and LiDAR data. Random forest model was trained to predict the unknown locations’ variables. The uncertainty of the estimations measured by provided prediction intervals for the different estimated variables. The result estimated 25.3% energy production of the total electricity demand [21].
A data mining approach combining machine learning and geographic information systems was applied to 9.6 million rooftops in Switzerland to address the lack of high-resolution data and the uncertainties related to existing processing methods. Each step’s uncertainties were estimated and combined to quantify the final photovoltaic potential uncertainty. The results stated that the available roof area for photovoltaic installation was 55% of the total Swiss roof surface which could meet more than 40% of Switzerland’s annual electricity demand. For direct validation, using image segmentation techniques such as convolutional neural networks to high-resolution aerial imagery for objects detection and already installed photovoltaic panels was suggested [9]. For instance, a supervised machine learning method based on convolutional neural networks was developed to use pixel-wise image segmentation on the Swiss high-resolution aerial photos for detecting the rooftop solar panels and to determine their sizes. Results indicated that accuracy of about 94% for a pixel-level set of solar panels was obtained [46].
Image segmentation with U-Net, a deep learning technology, was developed for detecting the solar photovoltaic potential of Wuhan’s (China) urban rooftops using a large range of open-source satellite imagery. Google Earth® satellite map was used to calculate the 2D information for the building rooftop areas. The annual radiation available per unit area was obtained from the estimated area and global horizontal irradiation in Wuhan. Finally, the overall potential was calculated with an error of 9.51% considering the polycrystalline silicon as photovoltaic panels [1].
Image recognition and machine learning approaches were used to analyze a combination of publicly available geographical building data and aerial images to determine the rooftop photovoltaic potential of Freiburg (Germany). All building sizes and exact locations were determined, and the orthographic aerial image was obtained. Image processing algorithms were applied for detecting the roof’s ridgeline and orientations and a normal distribution function was used to estimate the roof’s tilt due to the lack of height in single perspective aerial images. The fitted photovoltaic module numbers on detected roof areas were estimated by an algorithm that incrementally iterated over the usable area to fit as many photovoltaics as possible. An existed algorithm was also used to calculate the sun’s position. It is stated that the efficiency of the modules and the inverter system was simulated as a function of ambient temperature, irradiance, and load factor. Finally, an economic analysis was conducted by the levelized costs of electricity. It is declared that an existing CNN algorithm was also proposed to detect roofs that were already equipped with photovoltaic installations. According to the validation with a 3D city model, algorithms for irradiance simulation show an accuracy of about 70% for roof azimuth estimation, and an accuracy of about 90% for detecting existing solar installations [47].
To address challenges of policy and electricity system planning level of EU, a geospatial methodology using spatial information to determine photovoltaic systems available rooftop area was developed. It combined statistical and satellite-based data sources with machine learning to assess technical potential across the EU considering the cost of electricity of which results showed a potential production of 680 TWh annually equal to 24.4% of energy demand [48].
The rooftop solar technical potential was determined in Hanoi (Vietnam) from the energy supply perspective using high-resolution remote sensing images technology, geographic information system, and high-resolution satellite image analysis technology, combining with artificial intelligence algorithms. The method consists of identifying and classifying rooftops (segmentation and classification), determining the suitable rooftop’s surface area for photovoltaic installation, and evaluating each rooftop and each local area’s overall potential. The annual operation data were collected from a rooftop photovoltaic power station in Hanoi for efficiency evaluation in real working conditions. It was stated that the difference between theoretical data and actual data was due to the loss factors of dust, climatic conditions, the utility grid-connected inverter’s operating conditions. The results indicate that the rooftop solar power electricity values vary in each district in Hanoi. Additionally, for the investment efficiency evaluation, the payback in actual operations was about a year longer than the theoretical calculation. Finally, the total generated electricity of rooftop solar power was estimated at 37,591,481 MWh [49].
Based on obtaining rooftop features from remote sensing images, an approach to predict photovoltaic potential was developed in Beijing (China) to simulate monthly and annually rooftop solar radiation. These rooftop features included 2D outlines rooftop extracted from remote sensing data of Google maps with a precision of 87% by object-oriented classification method and building patches were reconfigured using Hough transformation. Later, 3D rooftop parameters were obtained from the digital surface model of the satellite and were calculated for five different types of rooftops, namely, flat, shed, hipped, gable, and mansard. Finally, after calculating non-shadowed area and angle correction factor, a rooftop photovoltaic potential of 63.78 GWh was measured [50]. Table 6 shows a summary of the attempt for this approach.

3. Results

Several attempts and various methods for urban solar photovoltaic potential determination were conducted due to the dramatic development of technology in recent years and mostly followed the same path shown in Figure 3. Studies first tend to find the sun’s total energy received by the urban areas (physical potential), followed by detecting suitable rooftops to install photovoltaics (geographical potential). The next step was calculating the maximum electricity production (technical potential) followed by assessing the rooftop photovoltaic installation’s economic attractiveness (economic potential). Finally, determining the overall rooftop photovoltaic potential by finding and integrating each step’s suitable points based on the previous steps. This pathway is called the hierarchical methodology for rooftop photovoltaic potential determination.
A comparison is made in Figure 4 between the methods’ exploitation in years 2010–2015 and 2016–2020. The major fraction of the attempts in 2010–2015 was devoted to digital modeling approaches and their related commercial software packages. Mathematical approaches had second place in the majority of the attempts in 2010–2015, followed by the statistical sampling approach.
The significant share of the attempts in 2016–2020 was for the artificial intelligence approach. Digital modeling approaches and their related commercial software packages had the second major share of the attempts in 2016–2020, followed by mathematical approaches.
One of the important points to conclude from this comparison is that the use of the statistical sampling approach was dramatically reduced from 20% in 2010–2015 attempts to 0% in 2016–2020 attempts. This is due to the dramatic increase of computation facilities for human aiding purposes.
Another important point to discuss is that with the advanced development of technology in recent years, the artificial intelligence approach had a dramatic increase from 0% in 2010–2015 attempts to 42% in 2016–2020 attempts. However, digital modeling approaches and their related commercial software packages had a slight decrease from 40% to 38% while mathematical approaches had fallen from 27% to 12% in 2010–2015 and 2016–2020 attempts, respectively.
Figure 5 states an increasing number of studies investigated the rooftop photovoltaic potential to generate energy in cities during the years 2010 till 2020. This increment is mainly due to technological developments and the need for precise knowledge of solar energy resources electricity production. Moreover, due to the rise of the energy crisis and environmental degradation concerns, determining the renewable energy potential has become an essential aspect in energy policies and regulatory developments.
Another point to mention in Figure 5 is that the number of attempts considering the economic sub-potential is also growing, especially in recent years. This increase is because of the fact that building owners will only consider investing in rooftop photovoltaic installations when these facilities are economically justifiable. So, with the development of technology in recent years, studies have more tendency to consider economic sub-potential in their rooftop photovoltaic potential assessment.

4. Discussion

Urban environments can be considered as high-potential electricity producers using rooftop-mounted photovoltaic systems. There is an increasing number of studies investigated the rooftop photovoltaic potential to generate energy i cities.
The aim of this study is to present a complete systematic review on determining the urban rooftop PV potential by taking into account the majority of high impact attempts since 2010. This paper states the pathway and data resources to find the urban rooftop PV potential and organizes the methodologies based on their approaches.
For the suitability study of roofs to install PV systems, different factors, and parameters are considered such as solar radiation, rooftop geometry, rooftop inclination and slope, shadows, technical energy transformation characteristic, and economical attractiveness, which each one has a different level of importance. The priority of selecting the factors and parameters strongly depends on the project scale, location, and data availability. For instance, some projects tended to neglect the complexity of calculating some parameters due to their situation and using the same technique is frequently not possible for determining the PV potential of a house, a city, or a country in different locations around the world.
With the development of technology and improvement in data accessibility, there are attempts to fulfill this gap by advanced modeling as well as artificial intelligence as discussed in Section 2.2. In recent years, the use of the artificial Intelligence approach is growing as can be concluded from Figure 4. Moreover, the development of GIS applications and remote sensing data such as LIDAR have become useful tools with promising results. However, the lack of data diversity in some regions, the high cost of accessing the data sources, and time-consuming procedures, have made this progress bounded, which led to the lack of urban solar energy production potential maps on global scales. In this sense, web-based free access data such as free satellite images from Google has become an opportunity to carry out actions.
This study suggests the development of a uniform accurate multi-factor artificial intelligence approach that uses uniform high-resolution open source data such as web-based free access data to determine urban rooftop’s photovoltaic potential map on a global scale. So, when there is a tendency to create more sustainable cities, this service may help to integrate the solar potential into the design and planning of smart cities.

5. Conclusions

This paper aims to make a complete systematic review for introducing sub-potentials and their essential factors alongside their common data sources. Moreover, it illustrates different methods to determine urban rooftop photovoltaic potential in order to create a complete global basis for future studies and applications. Methods of urban solar photovoltaic potential determination frequently tend to find the physical potential, geographical potential, technical potential, and economical potential. These steps are called the hierarchical methodology as shown in Figure 3. However, determining urban rooftop’s photovoltaic potential map on a global scale with a uniform accurate multi-factor method with high-resolution open data sources remains a challenge.

Author Contributions

Conceptualization and methodology, E.F. and M.A.; writing—original draft preparation, E.F. and A.N.; writing—review and editing, M.J.C.G.; supervision, M.A.; feedback, F.V.D. All authors have read and agreed to the published version of the manuscript.

Funding

This research received no external funding.

Institutional Review Board Statement

Not applicable.

Informed Consent Statement

Not applicable.

Data Availability Statement

Not applicable.

Conflicts of Interest

The authors declare no conflict of interest.

References

  1. Huang, Z.; Mendis, T.; Xu, S. Urban solar utilization potential mapping via deep learning technology: A case study of Wuhan, China. Appl. Energy 2019, 250, 283–291. [Google Scholar] [CrossRef]
  2. Izquierdo, S.; Rodrigues, M.; Fueyo, N. A method for estimating the geographical distribution of the available roof surface area for large-scale photovoltaic energy-potential evaluations. Sol. Energy 2008, 82, 929–939. [Google Scholar] [CrossRef]
  3. Sharma, P.; Kolhe, M.; Sharma, A. Economic performance assessment of building integrated photovoltaic system with battery energy storage under grid constraints. Renew. Energy 2020, 145, 1901–1909. [Google Scholar] [CrossRef]
  4. Mohajeri, N.; Assouline, D.; Guiboud, B.; Bill, A.; Gudmundsson, A.; Scartezzini, J.-L. A city-scale roof shape classification using machine learning for solar energy applications. Renew. Energy 2018, 121, 81–93. [Google Scholar] [CrossRef]
  5. Schallenberg-Rodríguez, J. Photovoltaic techno-economical potential on roofs in regions and islands: The case of the Canary Islands. Methodological review and methodology proposal. Renew. Sustain. Energy Rev. 2013, 20, 219–239. [Google Scholar] [CrossRef]
  6. Assouline, D.; Mohajeri, N.; Scartezzini, J.-L. Quantifying rooftop photovoltaic solar energy potential: A machine learning approach. Sol. Energy 2017, 141, 278–296. [Google Scholar] [CrossRef]
  7. Kouhestani, F.M.; Byrne, J.; Johnson, D.; Spencer, L.; Hazendonk, P.; Brown, B. Evaluating solar energy technical and economic potential on rooftops in an urban setting: The city of Lethbridge, Canada. Int. J. Energy Environ. Eng. 2019, 10, 13–32. [Google Scholar] [CrossRef] [Green Version]
  8. Ineichen, P. Long Term Satellite Global, Beam and Diffuse Irradiance Validation. Energy Procedia 2014, 48, 1586–1596. [Google Scholar] [CrossRef]
  9. Walch, A.; Castello, R.; Mohajeri, N.; Scartezzini, J.-L. Big data mining for the estimation of hourly rooftop photovoltaic potential and its uncertainty. Appl. Energy 2020, 262, 114404. [Google Scholar] [CrossRef]
  10. Ordóñez, J.; Jadraque, E.; Alegre, J.; Martínez, G. Analysis of the photovoltaic solar energy capacity of residential rooftops in Andalusia (Spain). Renew. Sustain. Energy Rev. 2010, 14, 2122–2130. [Google Scholar] [CrossRef]
  11. Izquierdo, S.; Montañés, C.; Dopazo, C.; Fueyo, N. Roof-top solar energy potential under performance-based building energy codes: The case of Spain. Sol. Energy 2011, 85, 208–213. [Google Scholar] [CrossRef]
  12. Gooding, J.; Crook, R.; Tomlin, A. Modelling of roof geometries from low-resolution LiDAR data for city-scale solar energy applications using a neighbouring buildings method. Appl. Energy 2015, 148, 93–104. [Google Scholar] [CrossRef] [Green Version]
  13. Verso, A.; Martin, A.; Amador, J.; Dominguez, J. GIS-based method to evaluate the photovoltaic potential in the urban environments: The particular case of Miraflores de la Sierra. Sol. Energy 2015, 117, 236–245. [Google Scholar] [CrossRef]
  14. Lukač, N.; Seme, S.; Žlaus, D.; Štumberger, G.; Žalik, B. Buildings roofs photovoltaic potential assessment based on LiDAR (Light Detection and Ranging) data. Energy 2014, 66, 598–609. [Google Scholar] [CrossRef]
  15. Brito, M.; Gomes, N.; Santos, T.; Tenedório, J. Photovoltaic potential in a Lisbon suburb using LiDAR data. Sol. Energy 2012, 86, 283–288. [Google Scholar] [CrossRef]
  16. Defaix, P.; van Sark, W.; Worrell, E.; de Visser, E. Technical potential for photovoltaics on buildings in the EU-27. Sol. Energy 2012, 86, 2644–2653. [Google Scholar] [CrossRef] [Green Version]
  17. Dastoori, K.; Al-Shabaan, G.; Kolhe, M.; Thompson, D.; Makin, B. Impact of accumulated dust particles’ charge on the photovoltaic module performance. J. Electrost. 2016, 79, 20–24. [Google Scholar] [CrossRef]
  18. Talka, I.; Kolhe, M.; Hyttinen, J. Impact of wind speed on ventilation performance within a container installed with photovoltaic inverter. Renew. Energy 2017, 113, 1480–1489. [Google Scholar] [CrossRef]
  19. Sharma, A.; Kolhe, M.; Konara, K.; Ulltveit-Moe, N.; Muddineni, K.; Mudgal, A.; Garud, S. Performance assessment of institutional photovoltaic based energy system for operating as a micro-grid. Sustain. Energy Technol. Assess. 2020, 37, 100563. [Google Scholar] [CrossRef]
  20. Fath, K.; Stengel, J.; Sprenger, W.; Wilson, H.R.; Schultmann, F.; Kuhn, T.E. A method for predicting the economic potential of (building-integrated) photovoltaics in urban areas based on hourly Radiance simulations. Sol. Energy 2015, 116, 357–370. [Google Scholar] [CrossRef]
  21. Assouline, D.; Mohajeri, N.; Scartezzini, J.-L. Large-scale rooftop solar photovoltaic technical potential estimation using Random Forests. Appl. Energy 2018, 217, 189–211. [Google Scholar] [CrossRef]
  22. Wu, Y.; Xu, C.; Ke, Y.; Chen, K.; Sun, X. An intuitionistic fuzzy multi-criteria framework for large-scale rooftop PV project portfolio selection: Case study in Zhejiang, China. Energy 2018, 143, 295–309. [Google Scholar] [CrossRef]
  23. Wu, Y.; Wang, J.; Ji, S.; Song, Z.; Ke, Y. Optimal investment selection of industrial and commercial rooftop distributed PV project based on combination weights and cloud-TODIM model from SMEs’ perspectives. J. Clean. Prod. 2019, 234, 534–548. [Google Scholar] [CrossRef]
  24. Bergamasco, L.; Asinari, P. Scalable methodology for the photovoltaic solar energy potential assessment based on available roof surface area: Application to Piedmont Region (Italy). Sol. Energy 2011, 85, 1041–1055. [Google Scholar] [CrossRef] [Green Version]
  25. Bergamasco, L.; Asinari, P. Scalable methodology for the photovoltaic solar energy potential assessment based on available roof surface area: Further improvements by ortho-image analysis and application to Turin (Italy). Sol. Energy 2011, 85, 2741–2756. [Google Scholar] [CrossRef] [Green Version]
  26. Peng, J.; Lu, L. Investigation on the development potential of rooftop PV system in Hong Kong and its environmental benefits. Renew. Sustain. Energy Rev. 2013, 27, 149–162. [Google Scholar] [CrossRef]
  27. Lopez-Ruiz, H.G.; Blazquez, J.; Vittorio, M. Assessing residential solar rooftop potential in Saudi Arabia using nighttime satellite images: A study for the city of Riyadh. Energy Policy 2020, 140, 111399. [Google Scholar] [CrossRef]
  28. Gomez-Exposito, A.; Arcos-Vargas, A.; Gutierrez-Garcia, F. On the potential contribution of rooftop PV to a sustainable electricity mix: The case of Spain. Renew. Sustain. Energy Rev. 2020, 132, 110074. [Google Scholar] [CrossRef]
  29. Singh, R.; Banerjee, R. Estimation of rooftop solar photovoltaic potential of a city. Sol. Energy 2015, 115, 589–602. [Google Scholar] [CrossRef]
  30. Singh, R. Approximate rooftop solar PV potential of Indian cities for high-level renewable power scenario planning. Sustain. Energy Technol. Assess. 2020, 42, 100850. [Google Scholar] [CrossRef]
  31. Lukač, N.; Žlaus, D.; Seme, S.; Žalik, B.; Štumberger, G. Rating of roofs’ surfaces regarding their solar potential and suitability for PV systems, based on LiDAR data. Appl. Energy 2013, 102, 803–812. [Google Scholar] [CrossRef]
  32. Strzalka, A.; Alam, N.; Duminil, E.; Coors, V.; Eicker, U. Large scale integration of photovoltaics in cities. Appl. Energy 2012, 93, 413–421. [Google Scholar] [CrossRef]
  33. Rodríguez, L.R.; Duminil, E.; Ramos, J.S.; Eicker, U. Assessment of the photovoltaic potential at urban level based on 3D city models: A case study and new methodological approach. Sol. Energy 2017, 146, 264–275. [Google Scholar] [CrossRef]
  34. Jakubiec, J.A.; Reinhart, C.F. A method for predicting city-wide electricity gains from photovoltaic panels based on LiDAR and GIS data combined with hourly Daysim simulations. Sol. Energy 2013, 93, 127–143. [Google Scholar] [CrossRef]
  35. Schunder, T.; Yin, D.; Bagchi-Sen, S.; Rajan, K. A spatial analysis of the development potential of rooftop and community solar energy. Remote. Sens. Appl. Soc. Environ. 2020, 19, 100355. [Google Scholar] [CrossRef]
  36. Suomalainen, K.; Wang, V.; Sharp, B. Rooftop solar potential based on LiDAR data: Bottom-up assessment at neighbourhood level. Renew. Energy 2017, 111, 463–475. [Google Scholar] [CrossRef]
  37. Hong, T.; Lee, M.; Koo, C.; Kim, J.; Jeong, K. Estimation of the Available Rooftop Area for Installing the Rooftop Solar Photovoltaic (PV) System by Analyzing the Building Shadow Using Hillshade Analysis. Energy Procedia 2016, 88, 408–413. [Google Scholar] [CrossRef] [Green Version]
  38. Hong, T.; Lee, M.; Koo, C.; Jeong, K.; Kim, J. Development of a method for estimating the rooftop solar photovoltaic (PV) potential by analyzing the available rooftop area using Hillshade analysis. Appl. Energy 2017, 194, 320–332. [Google Scholar] [CrossRef]
  39. De Vries, T.N.; Bronkhorst, J.; Vermeer, M.; Donker, J.C.; Briels, S.A.; Ziar, H.; Zeman, M.; Isabella, O. A quick-scan method to assess photovoltaic rooftop potential based on aerial imagery and LiDAR. Sol. Energy 2020, 209, 96–107. [Google Scholar] [CrossRef]
  40. Nelson, J.R.; Grubesic, T.H. The use of LiDAR versus unmanned aerial systems (UAS) to assess rooftop solar energy potential. Sustain. Cities Soc. 2020, 61, 102353. [Google Scholar] [CrossRef]
  41. Alhammami, H.; An, H. Techno-economic analysis and policy implications for promoting residential rooftop solar photovoltaics in Abu Dhabi, UAE. Renew. Energy 2020, 167, 359–368. [Google Scholar] [CrossRef]
  42. Hong, T.; Koo, C.; Park, J.; Park, H.S. A GIS (geographic information system)-based optimization model for estimating the electricity generation of the rooftop PV (photovoltaic) system. Energy 2014, 65, 190–199. [Google Scholar] [CrossRef]
  43. Fina, B.; Auer, H.; Friedl, W. Cost-optimal economic potential of shared rooftop PV in energy communities: Evidence from Austria. Renew. Energy 2020, 152, 217–228. [Google Scholar] [CrossRef]
  44. Wiginton, L.; Nguyen, H.; Pearce, J. Quantifying rooftop solar photovoltaic potential for regional renewable energy policy. Comput. Environ. Urban Syst. 2010, 34, 345–357. [Google Scholar] [CrossRef] [Green Version]
  45. Reames, T.G. Distributional disparities in residential rooftop solar potential and penetration in four cities in the United States. Energy Res. Soc. Sci. 2020, 69, 101612. [Google Scholar] [CrossRef]
  46. Castello, R.; Roquette, S.; Esguerra, M.; Guerra, A.; Scartezzini, J.-L. Deep learning in the built environment: Automatic detection of rooftop solar panels using Convolutional Neural Networks. J. Phys. Conf. Ser. 2019, 1343, 012034. [Google Scholar] [CrossRef]
  47. Mainzer, K.; Killinger, S.; McKenna, R.; Fichtner, W. Assessment of rooftop photovoltaic potentials at the urban level using publicly available geodata and image recognition techniques. Sol. Energy 2017, 155, 561–573. [Google Scholar] [CrossRef] [Green Version]
  48. Bódis, K.; Kougias, I.; Jäger-Waldau, A.; Taylor, N.; Szabó, S. A high-resolution geospatial assessment of the rooftop solar photovoltaic potential in the European Union. Renew. Sustain. Energy Rev. 2019, 114. [Google Scholar] [CrossRef]
  49. Phap, V.M.; Huong, N.T.T.; Hanh, P.T.; Van Duy, P.; Van Binh, D. Assessment of rooftop solar power technical potential in Hanoi city, Vietnam. J. Build. Eng. 2020, 32, 101528. [Google Scholar] [CrossRef]
  50. Song, X.; Huang, Y.; Zhao, C.; Liu, Y.; Lu, Y.; Chang, Y.; Yang, J. An Approach for Estimating Solar Photovoltaic Potential Based on Rooftop Retrieval from Remote Sensing Images. Energies 2018, 11, 3172. [Google Scholar] [CrossRef] [Green Version]
Figure 1. Sub-potentials and their essential factors for rooftop photovoltaic potential determination.
Sustainability 13 07447 g001
Figure 2. Steps for detecting rooftop photovoltaic potential.
Sustainability 13 07447 g002
Figure 3. The hierarchical methodology.
Sustainability 13 07447 g003
Figure 4. (a) Rooftop photovoltaic attempts during 2010–2015; (b) Rooftop photovoltaic attempts during 2016–2020.
Sustainability 13 07447 g004
Figure 5. Rooftop photovoltaic attempts during 2010–2020.
Sustainability 13 07447 g005
Table 1. Statistical sampling approaches.
RefDataLocationLocation Area
(km2)
Roof Area
(km2)
Annual Generated ElectricityDemand Coverage (%)Error (%)Year
[2]GIS
Statistical
Spain505,990571 322008
[10]Google Earth
Statistical
Andalusia (Spain)87,597265.529.73 GWh78.89102010
Table 2. Mathematical approaches.
RefToolsDataLocationLocation Area
(km2)
Roof Area
(km2)
Annual Generated ElectricityDemand Coverage (%)Error
(%)
Year
[24]MATLAB and GIS SoftwareGIS
Statistical
Piedmont (Italy)25,000436900 GWh28.161.72011
[25]Ortho-image analysisGeoreferenced imagesTurin (Italy) 858 GWh 102011
[26]estimate rooftop from ground floor areaStatistical
on-site information
Hong Kong 545981 GWh14.2152013
[27]Nightlight intensity Statistical
Nighttime satellite images
Riyadh
(Saudi Arabia)
185,000 rooftop0.7 TWh 2020
[28]Interpolation algorithm with Matlab
ArcGIS—PVGIS
National geographical—CartographicalSpain505,9901134291 TWh45 2020
[29]GIS image analysis
micro–macro synthesis
Statistical
Google earth
Mumbai
(India)
458.27 2190 MW2019.42015
[30]mathematical model micro-level simulations in PVSystStatistical—land-use and building stock13 Indian cities 17.8 GWp 2020
Table 3. Digital modeling approach and commercial software packages.
RefToolsDataLocationLocation Area
(km2)
Roof Area
(km2)
Annual Generated ElectricityDemand Coverage (%)Error
(%)
Year
[31]Rating rooftops
Digital elevation model
LiDAR
geospatial
Maribor
(Slovenia)
1 2.62013
[15]ArcGIS solar analyst extension toolLIDAR
Statistical
Lisbon
(Portugal)
538 rooftop11.5 GWh48 2012
[7]digital surface model
digital elevation model
ArcGIS
LiDAR—GISLethbridge (Canada)124.32.733011 GWh38 2019
[20]3D city model
ArcGIS
Radiance Software
Real Estate Office 3D modelKarlsruhe (Germany)173 930 GWh 2015
[32]modular simulation INSEL model
3D model
LIDARStuttgart
(Germany)
1.5 35 2012
[33]INSEL model
3D model
SimStadt platform
CityGMLLudwigsburg (Germany)70022.261318 GWh77 2017
[34]3D model
Daysim simulation
GIS—LiDARCambridge (USA) 4881.3 kWh 5.32013
[35]Normalized Digital Surface Model
Digital Terrain Model
Digital Surface Model
LiDAR
Statistical
Erie County (USA)271 2020
[36]Digital surface model
ArcGIS
LiDAR
statistical
Auckland
(New Zealand)
1364 kWh/m2 2017
[37]Hillshade tool
Polygon to Raster tool ArcGIS
Building elevation
Statistical
Gangnam-Seoul
(South Korea)
4.903 2016
[38]Hillshade tool from ArcGISBuilding elevation
Statistical
Gangnam-Seoul
(South Korea)
4.9641,130,371 MWh150 2017
[39]quick-scan yield predictionAerial imagery
GIS-LIDAR
Eindhoven (Netherlands)145 rooftop145 rooftop1070 kWh/kWp 2020
[40]Digital elevation modelUAS-LIDARPhoenix (U.S)0.2650.0275089 GWh 2020
[14]nonlinear efficiency characteristics modelLIDARMaribor
(Slovenia)
0.5 122014
[41]GIS-based method
Esri ArcGIS software
Urban Planning and Municipalities building-shape data Khalifa—Zayed
(Abu Dhabi)
23
(Khalifa)
2
(Khalifa)
206 GWh
(Khalifa)
20 (Khalifa) 2020
Table 4. Optimization approaches.
RefTools DataLocation Location Area
(km2)
Roof Area
(km2)
Annual Generated ElectricityDemand Coverage (%)Error
(%)
Year
[42]GIS-based optimization modelStatistical
on-site information
Seoul
Busan-Daejeon
(South Korea)
275.33 kWh per panel (busan) 2014
[43]Optimization modelstatisticalAustria 10 GWp100 2020
Table 5. Artificial intelligence in commercial software packages approaches.
RefToolsDataLocationLocation Area
(km2)
Roof Area
(km2)
Annual Generated ElectricityDemand Coverage (%)Error
(%)
Year
[44]Feature analyst extraction in ArcGISGIS
Statistical
Part of Ontario (Canada)48,000256909 GWh5152010
[45]DeepSolar
GIS software
National datasets
Statistical
4 US cities 395,387 roof 2020
Table 6. Artificial intelligence approaches.
RefToolsDataLocationLocation Area
(km2)
Roof Area
(km2)
Annual Generated ElectricityDemand Coverage (%)Error
(%)
Year
[6]Supervised learning
Support Vector Machine algorithm
LiDAR
CORINE Land Cover
Statistical
Switzerland 1901
communes
32817.86 TWh28 2017
[4]Support Vector Machine classification
MATLAB
Solar radiation GIS
LIDARGeneva
(Switzerland)
66,811
roof
2018
[21]Machine Learning
Random Forest model
LiDAR
Digital
Orthophoto
Switzerland41,28525216.29 TWh25.3 2017
[9]Data mining
Machine Learning
LiDAR
statistical
Switzerland9,600,000 rooftops26724 TWh40 2019
[1]U-Net
Deep learning
Google EarthWuhan (China)961 17.3 TWh 9.512019
[47]Image recognition
Machine learning
Geographical building
Aerial images
Freiburg (Germany) 49,573 building524 GWh 2017
[48]Machine learningStatistical
Satellite
EU 680 TWh24.4 2019
[49]Artificial intelligenceStatistical
Satellite image
Hanoi
(Vietnam)
3359139.437,591 GWh 2020
[50]Segmentation
Hough transformation
Satellite imageBeijing (China) 0.67863.78 GWh 2018
Publisher’s Note: MDPI stays neutral with regard to jurisdictional claims in published maps and institutional affiliations.

