Article

Experimental and Informational Modeling Study of Sustainable Self-Compacting Geopolymer Concrete

by
Iman Faridmehr
1,
Moncef L. Nehdi
2,*,
Ghasan Fahim Huseien
3,
Mohammad Hajmohammadian Baghban
4,
Abdul Rahman Mohd Sam
3 and
Hassan Amer Algaifi
5
1
Institute of Architecture and Construction, South Ural State University, 454080 Chelyabinsk, Russia
2
Department of Civil and Environmental Engineering, Western University, London, ON N6G 5L1, Canada
3
UTM Construction Research Centre, Institute for Smart Infrastructure and Innovative Construction, School of Civil Engineering, Faculty of Engineering, Universiti Teknologi Malaysia, Johor 81310, Malaysia
4
Department of Manufacturing and Civil Engineering, Norwegian University of Science and Technology (NTNU), 2815 Gjøvik, Norway
5
Faculty of Civil Engineering and Built Environment, Universiti Tun Hussein Onn Malaysia, Johor 86400, Malaysia
*
Author to whom correspondence should be addressed.
Sustainability 2021, 13(13), 7444; https://doi.org/10.3390/su13137444
Submission received: 31 May 2021 / Revised: 17 June 2021 / Accepted: 28 June 2021 / Published: 2 July 2021
(This article belongs to the Special Issue Sustainability and Green Construction)

Abstract

:
Self-compacting concrete (SCC) became a strong candidate for various construction applications owing to its excellent workability, low labor demand, and enhanced finish-ability, and because it provides a solution to the problem of mechanical vibration and related noise pollution in urban settings. However, the production of Portland cement (PC) as a primary constituent of SCC is energy-intensive, contributing to about 7% of global carbon dioxide (CO2) emissions. Conversely, the use of alternative geopolymer binders (GBs) in concrete can significantly reduce the energy consumption and CO2 emissions. In addition, using GBs in SCC can produce unique sustainable concrete with unparallel engineering properties. In this outlook, this work investigated the development of some eco-efficient self-compacting geopolymer concretes (SCGCs) obtained by incorporating different dosages of fly ash (FA) and ground blast furnace slag (GBFS). The structural, morphological, and mechanical traits of these SCGCs were examined via non-destructive tests like X-ray diffraction (XRD) and scanning electron microscopy (SEM). The workability and mechanical properties of six SCGC mixtures were examined using various measurements, and the obtained results were analyzed and discussed. Furthermore, an optimized hybrid artificial neural network (ANN) coupled with a metaheuristic Bat optimization algorithm was developed to estimate the compressive strength (CS) of these SCGCs. The results demonstrated that it is possible to achieve appropriate workability and mechanical strength through 50% partial replacement of GBFS with FA in the SCGC precursor binder. It is established that the proposed Bat-ANN model can offer an effective intelligent method for estimating the mechanical properties of various SCGC mixtures with superior reliability and accuracy via preventing the need for laborious, costly, and time-consuming laboratory trial batches that are responsible for substantial materials wastage.

1. Introduction

Currently, to address the lack of skilled labor and problems of poor consolidation and finish quality of concrete construction, self-compacting concrete (SCC) technology has emerged and become the mainstream. SCCs have exceptional flowability, pass through rebar, and consolidate under their weight without segregation or bleeding [1,2,3,4]. Apart from their self-compacting ability, SCCs have a high filling and passing ability as well as appropriate segregation resistance, making them ideal for various applications in the construction industries, including precast concrete, repair works, and underwater construction. Nevertheless, traditional SCC requires a high amount of binder to achieve its exceptional engineering properties. The use of Portland cement (PC) as the primary binder in SCC remains a major concern because of the elevated levels of carbon dioxide (CO2) emissions and embodied energy (EE) associated with its production. Cement production constitutes approximately 7% of the global CO2 emissions [5,6,7]. If the cement industries were considered as a country, it would indeed rank third after China and the USA in terms of total CO2 emissions. To overcome this problem, substantial efforts have been dedicated to developing novel construction materials using sustainable alternative binders with less-harmful environmental footprints.
Over the last several decades, there has been increasing research into and production of geopolymer binders (GBs) as an environmentally friendly alternative to the conventional PC. Since the CO2 emissions and high energy consumption of PC production are eliminated, GBs have emerged as a sustainable alternative [8]. Generally, GBs are produced from aluminosilicate precursors, often consisting of recycled byproducts and waste materials activated by alkaline solutions to yield geopolymer concrete (GC) [9,10]. GC has been characterized by its excellent durability and mechanical performance compared to that of traditional Portland cement concrete (PCC) [11,12,13]. Uses of GBs have recently been explored to enhance the sustainability of SCC. In the remainder of this paper, SCCs produced with GC are referred as self-compacting geopolymer concrete (SCGCs). They can be considered as pioneering construction materials with exceptional performance and sustainability features.
Worldwide, enormous amounts of industrial by-products like GBFS from steel manufacturing and FA from coal fired power-generation plants) are produced annually. The cost and environmental impact associated with the disposal of these redundant byproducts can be avoided by using them as binders in SCGC production. Meanwhile, the geopolymer technology has demonstrated robust capacity in completely extirpating PC from the process of producing concrete. Several preliminary studies on SCGCs have been conducted which received considerable attention. This technology can be applied toward the containment of hazardous waste, refractories, ceramics, and fire-resistant construction materials [14]. Nevertheless, the most attractive strategy for SCGCs in the construction industry is the total replacement of the PC binder in concrete [15]. The properties of SCGCs are largely related to their source materials, generally industrial wastes and byproducts that, unlike normal cement, do not require stringent quality control procedures.
Previously, diverse sources of industrial by-products have been used for making GCs. However, FA- and GBFS-based SCGCs became advantageous because of their rapid rate of strength gain, enhanced resistance to sulphate and acid attacks, superior resistance to fire, low permeability, low creep and drying shrinkage strains, and very good bond to reinforcing steel. GBFS contains adequate amounts of aluminum, silicon, and calcium oxide, making it an appropriate precursor for producing SCGC mixtures. In GCs or mortars, using GBFS as a binder can increase the compressive strength (CS) owing to better structuring of poorly arranged microstructures, micro-filling of voids, twin creations during calcium silicate hydrate (C-S-H) gel formation, and the existence of extremely polymerized units of alkali activation [16,17,18]. Nonetheless, the large CO2 emission and EE during the production stage along with the poor durability to H2SO4 exposure and rapid setting time limit the consumption of GBFS in SCGCs. FA incorporation lowers the levels of Ca and constitutes one of the best industrial by-products to produce alkali-activated concrete for several reasons, including its wide availability in many countries, high contents of SiO2 and Al2O3, and low cost and energy requirements [19,20,21]. Likewise, FA-incorporated GCs give reliable flexibility to heat curing for long-term and short-term in the environment [18,22,23]. However, the main problem for the extensive application of FA in GCs is related to its reduced strength development upon curing at room temperature and the requirement for high-molarity (Up to 10 M) sodium hydroxide (NaOH, hereafter called NH) and alkaline activator solutions. Therefore, in GCs the benefits of using FA alone as a precursor are very limited.
Most of the earlier research has focused primarily on the behavior of alkali-activated slag pastes and mortar mixtures, and only some recent studies were performed on SCGCs. Various studies confirmed that many factors influence the characteristics (fresh as well as hardened) of the SCGCs. These include the mixture design methods [1]; chemical and physical properties of the precursor wastes used as a binder; the alkaline activator solution compositions [24]; the molarity of NH [25]; the ratios of NH to sodium silicate [26]; water and superplasticizer levels [27]; as well as the contents, types, and sizes of the fine and coarse aggregates. Several investigations have been carried out to determine the properties of SCGCs made with GBFS as a sole precursor. Nevertheless, few studies have looked at the mechanical, structural, and morphological properties of the SCGCs incorporated with FA as partial replacement for GBFS.
An all-inclusive overview of the existing literature showed that the latent uses of FA as partial replacement for GBFS to develop eco-friendly SCGCs have not yet been explored. From another perspective, the production of various cement-free SCCs is very attractive since it significantly minimizes CO2 emissions and the cost and labor associated with the extraction of raw materials. Accordingly, the present study is expected to contribute to the state-of-the-art of knowledge through the implementation and standardization of the industrial-scale manufacturing approaches of low-carbon-footprint SCGCs in the foreseeable future. This is particularly significant in the geographic locations having an abundance of volcanic ash and East Asian countries with extensive FA production.
Considering the abovementioned facts, the current study aims to produce SCGCs incorporated with FA and GBFS at various proportions and examine their synergistic effects. For instance, FA increases the setting time of the mixture, while GBFS mitigates the slow strength development of FA. Therefore, an experimental program was conducted on the control specimens made using 100% GBFS and mixture designs incorporated with FA and GBFS at different proportions. The structures and morphologies of the alkali-activated SCGCs were first explored using diverse non-destructive tests including XRD and SEM. Subsequently, the workability and mechanical properties of six SCGC mixtures were examined using a series of tests. Additionally, an optimized hybrid artificial neural network (ANN) coupled with a metaheuristic Bat optimization algorithm (Bat-ANN) was developed to estimate the CS of SCGC mixtures. The proposed informational model will ultimately enable the design of SCGCs with targeted mechanical properties based on locally available industrial by-products. This will help to attain appropriate engineering properties while saving the labor, cost, and materials wastage associated with numerous trial batches.

2. Experimental Program

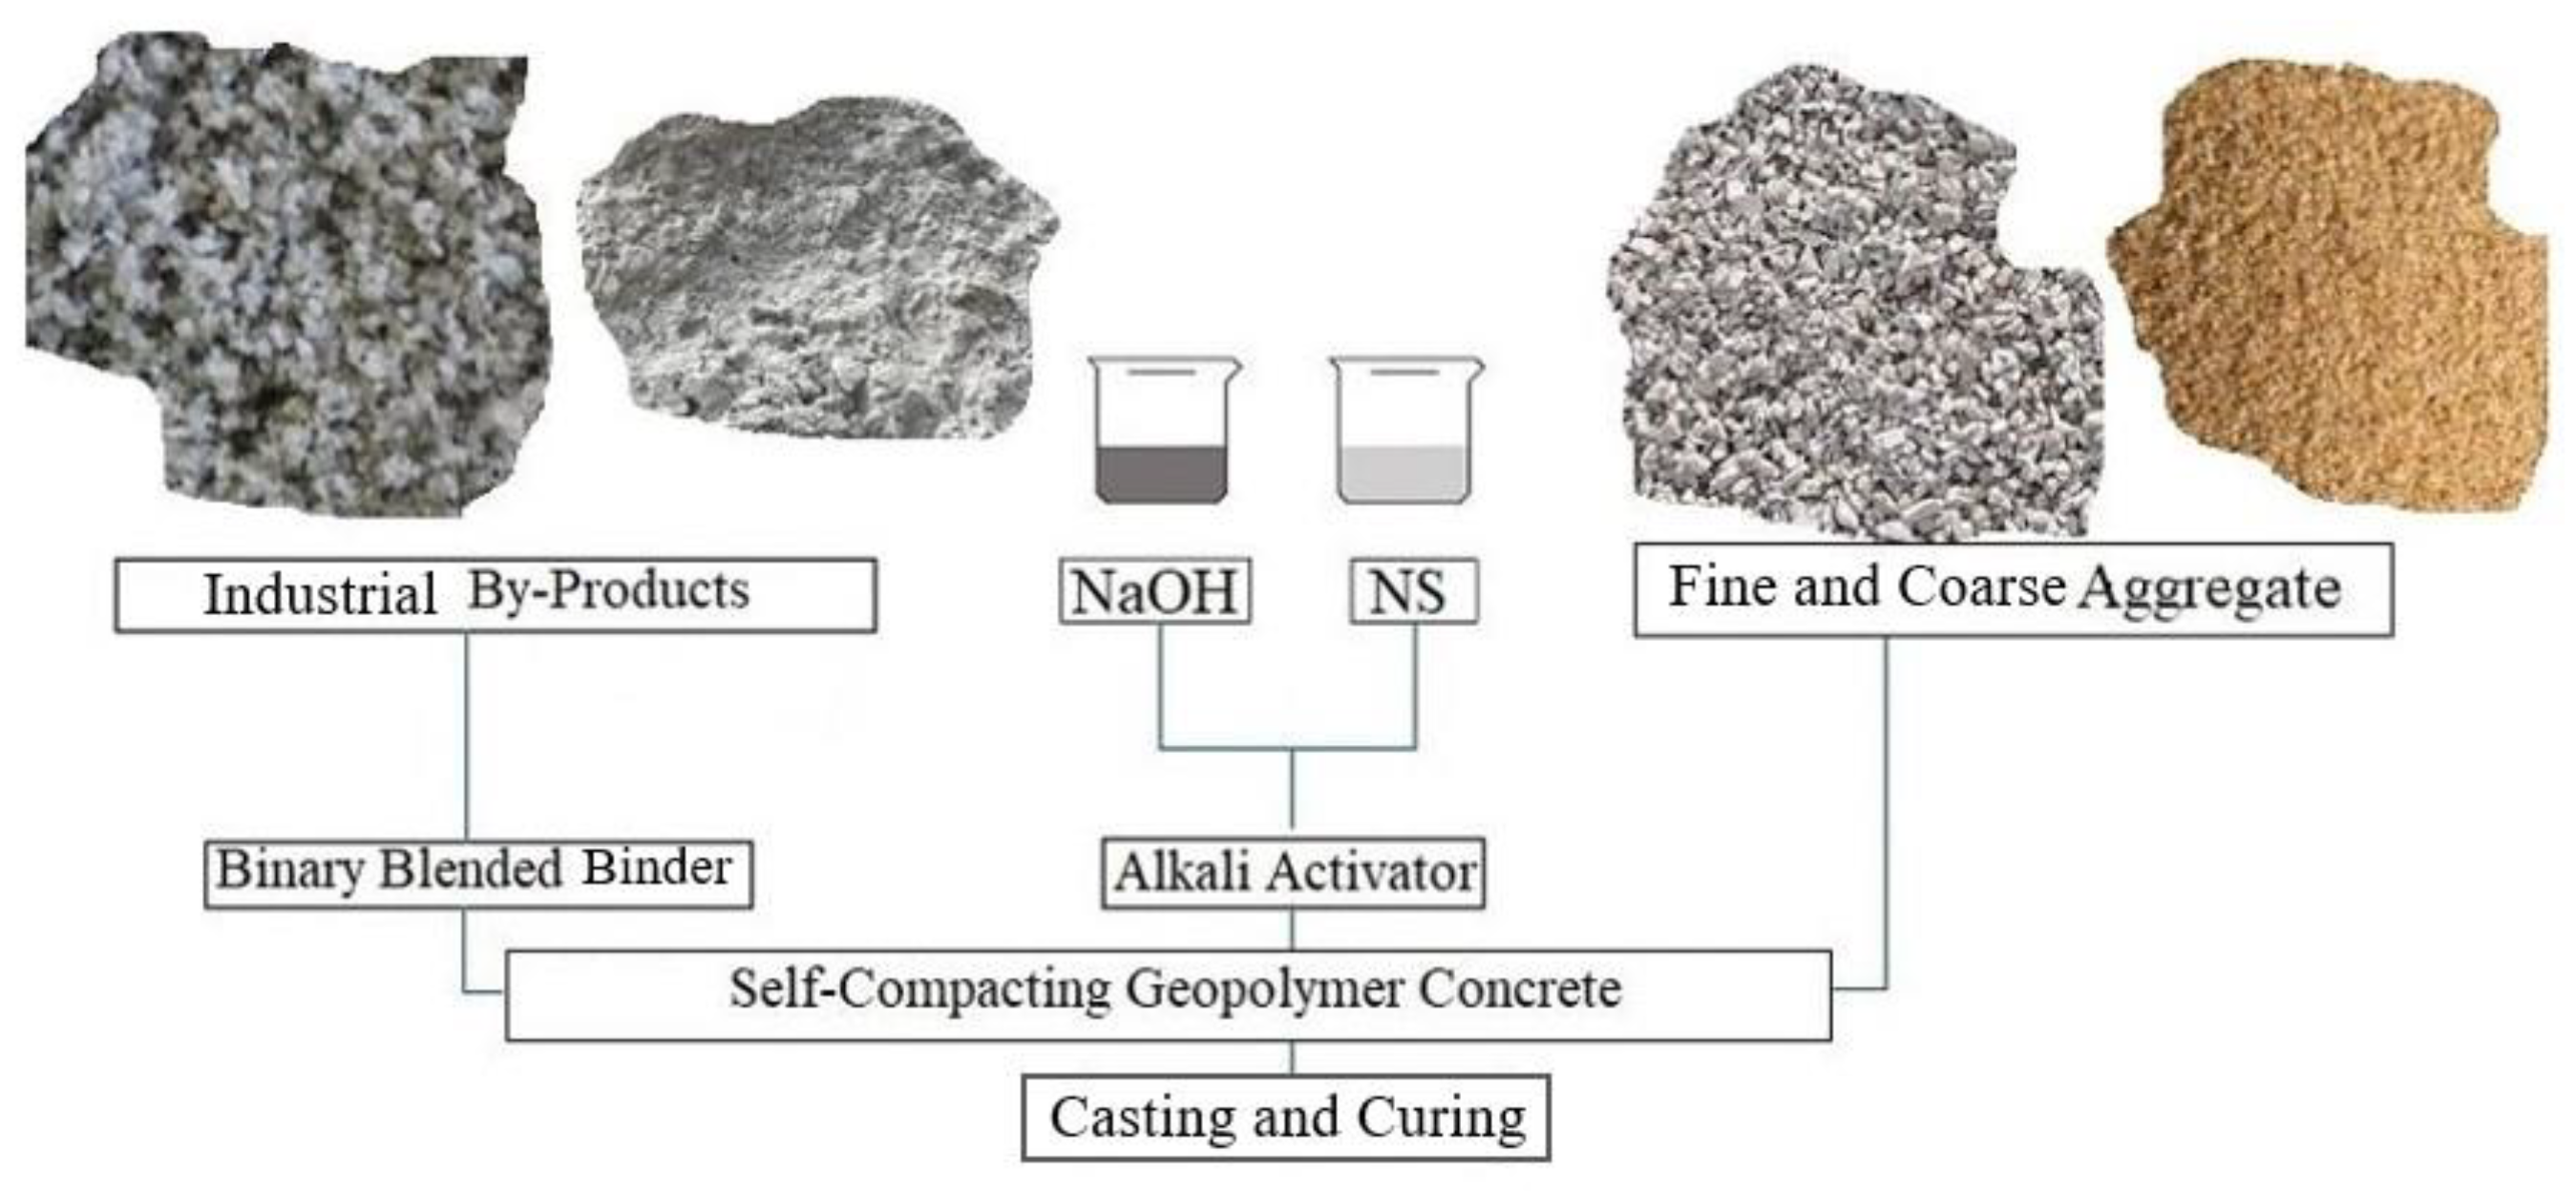
2.1. Materials Characterization

For production of the SCGC mixtures, GBFS and FA were prepared. Locally sourced pure GBFS was supplied by North Malaysian iron production companies, and was used as raw material to design the GBs. ASTM-C618 [28] recommendations were followed to combine the GBFS powder with PC to attain the desired pozzolanic properties. X-ray fluorescence (XRF) spectroscopy was used to identify the chemical composition of the raw materials. Data obtained from the XRF (Table 1) showed that primary elements including CaO ≈ 52%, SiO2 ≈ 31%, Al2O3 ≈ 12%, and MgO ≈ 5% were present in the GBFS-based designed mixtures in off-white color. On average, the GBFS showed 12.8 µm particle size, 2.9 specific gravity, and 13.6 m2/g BET surface area. The used FA was retrieved from a South Malaysian power station and had grey color, with pozzolanic properties characteristic of low-calcium class F FA. It contained four primary chemical constituents, namely 57.2% SiO2, 28.8% Al2O3, 5.2% CaO, and 3.7% Fe2O3 by total weight, respectively. The FA had a median particle size of 10 µm, a specific gravity of 2.2, and BET surface area of 18.1 m2/g. The particle size distributions for FA and GBFS are depicted in Figure 1, wherein their sizes were below 45 µm, meeting the requirement that at least 66% of particles must be 45 µm in size [29].
The XRD profiles of the precursor byproduct binders including GBFS and FA are shown in Figure 2. The XRD patterns for FA revealed intense diffraction peaks in the range of 15.9 and 29.8° corresponding to quartz (SiO2) and Al2O3.2SiO2 or mullite (2Al2O3 SiO2) crystalline grains. Conversely, no sharp peaks were evident in the GBFS diffractogram, and the structure was largely glassy. GBFS contained a high amount of reactive SiO2 and Ca in the amorphous phase, contributing vitally to the geo-polymerization process of SCGCs, enabling high performance. Nonetheless, to address the low levels of Al2O3 (10.49 wt.%), the GBFS was partially replaced by FA. For producing the SCGCs, Malaysian river sand as fine aggregate was employed. This river sand had a fineness modulus of 2.88, water absorption of 1.13%, and specific gravity of 2.56. Moreover, crushed granite stone with maximum particle size of 10 mm, specific gravity of 2.62, and water absorption of 0.43% was obtained from the quarry in Johor (South Malaysia) and used as coarse aggregate.
The 2 M NH solution was prepared by dissolving high-purity (98%) NH pellet in tap water, which was cooled down for 24 h and then mixed with sodium silicate (NS) in order to provide the alkaline activator solution with a SiO2/Na2O proportion of 1.2. The ratio of NS to NH was maintained constant at 0.75 for all alkaline activator solutions. Moreover, the analytical-grade NS solution contained 55.80% H2O, 29.5% silica, and 14.7% sodium oxide by total mass. In the current study, the overall Na2O, SiO2, and H2O were selected at 10.53 wt.%, 12.64 wt.%, and 76.8 wt.%, respectively. In the previous research, these parameters were correspondingly selected to be 20.75 wt.%, 21.07 wt.%, and 58.2 wt.% for a mixture with 14 M NH and NS to NH ratios of 2.5 [30]. The alkaline solution prepared and tailored for this study with the proposed content of Na2O, SiO2, and H2O has environmentally friendly characteristics as well as low cost.

2.2. Mixture Design and Specimen Preparation
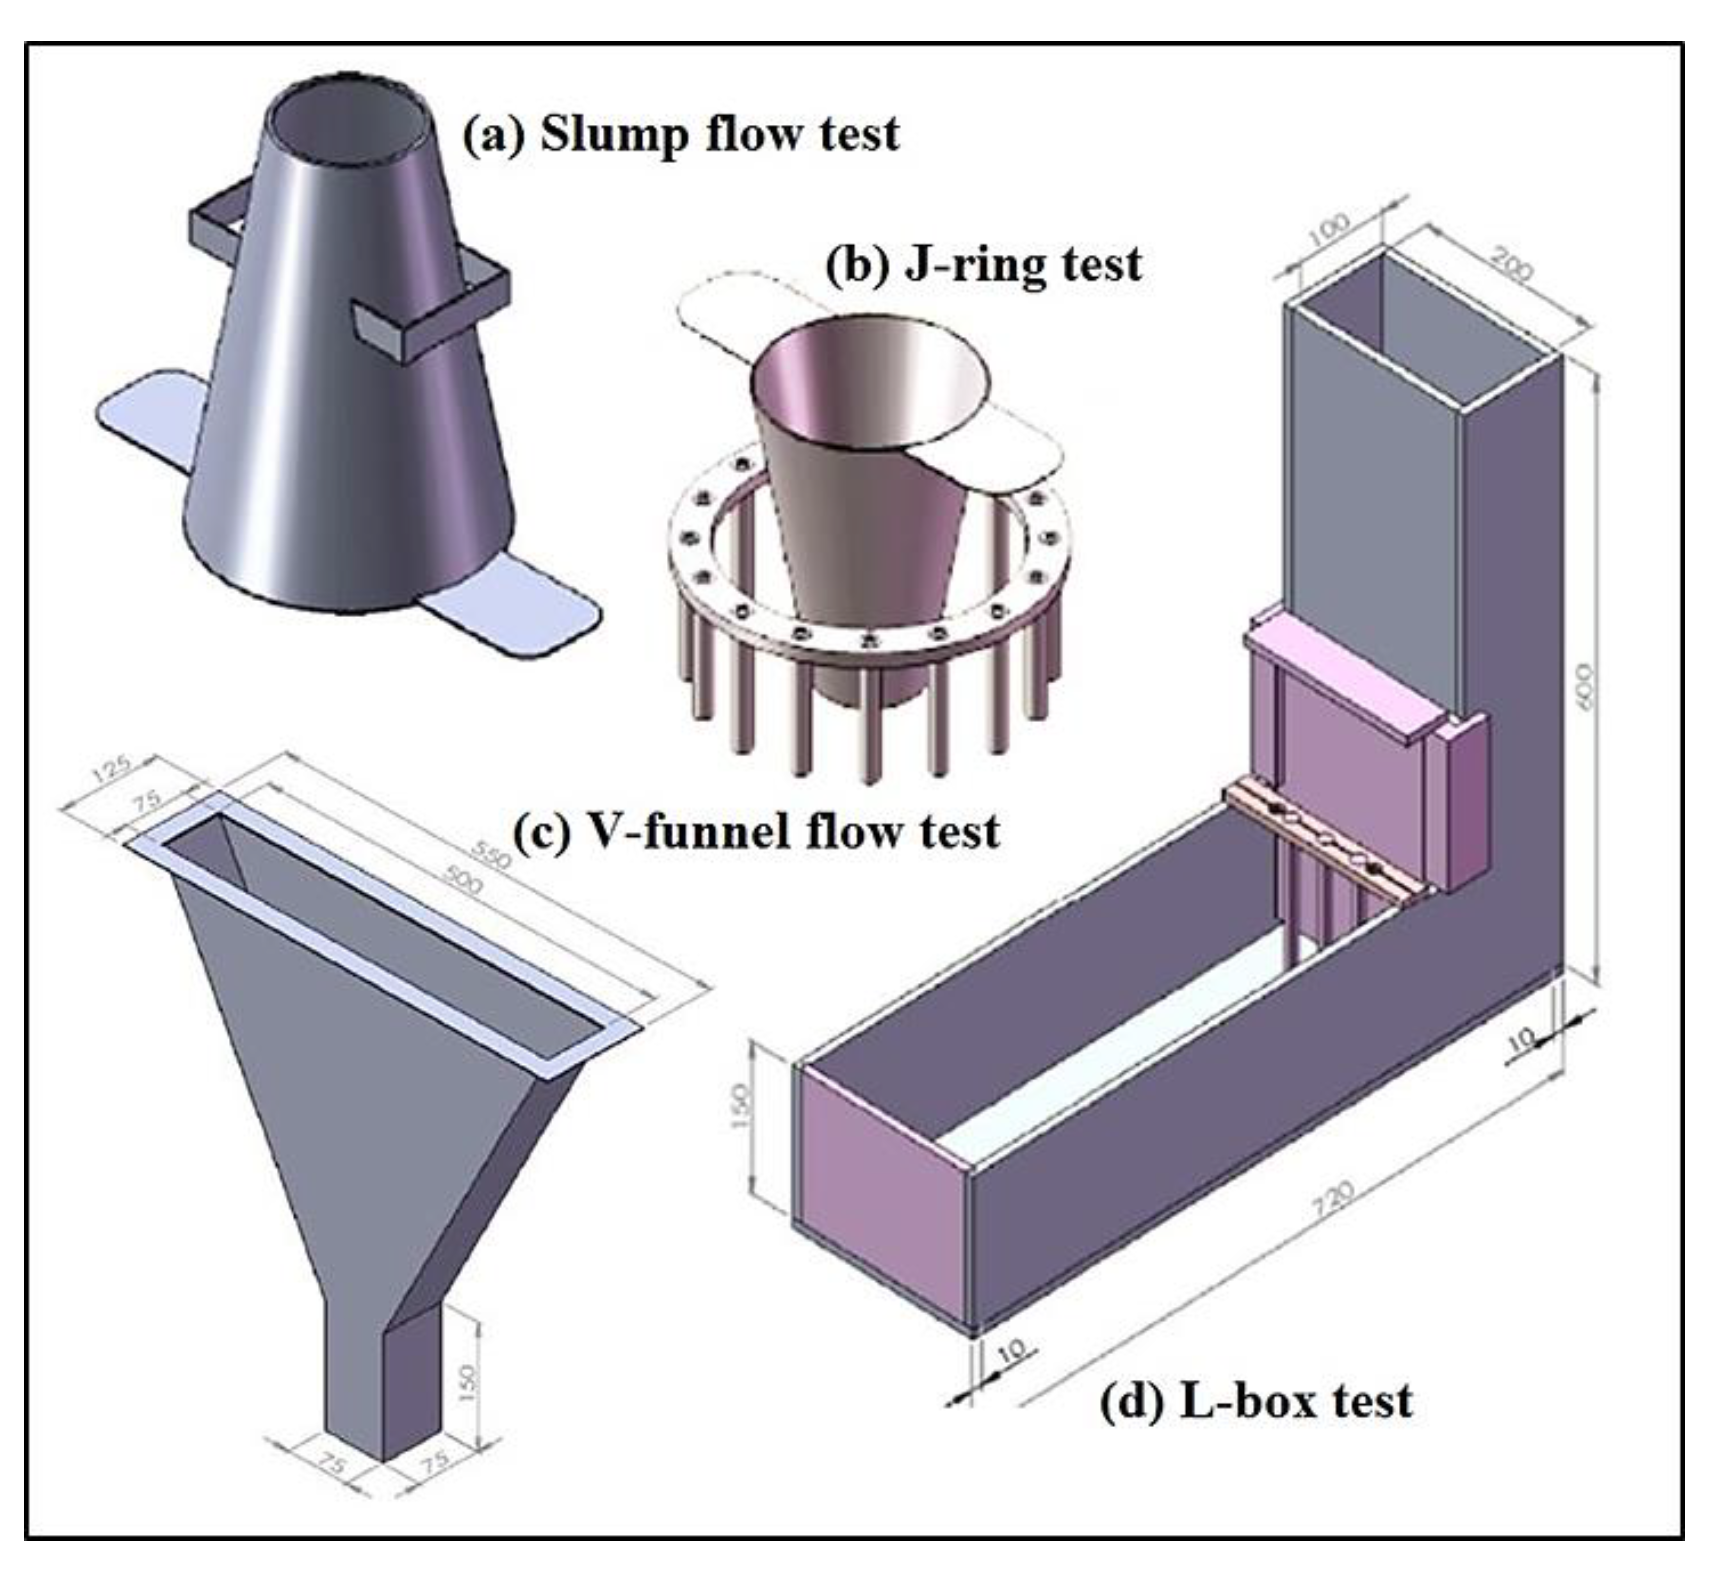
Different FA percentages (0, 30%, 40%, 50%, 60%, and 70% of the overall binder) were used as partial replacement for GBFS in the SCGC mixtures as shown in Table 2. The purpose of varying the FA dosages was to achieve most adequate performance of the binary-mixed precursor for SCGCs. The mixture with no FA addition (i.e., 100% GBFS mixture) was designated for control specimens. The content of the precursor binder in all FA–GBFS binary mixtures was maintained constant at 484 kg/m3. The binder-to-alkaline activator solution (B/S) and the sodium silicate-to-sodium hydroxide (NS/NH) ratios were both maintained constant at 0.5 and 0.75, respectively. Additionally, the molarity ratio of NH (M) and SiO2/Na2O modulus was kept constant at 2 and 1.2, respectively. In the prepared mixtures, a fixed 484 kg/m3 amount of river sand was incorporated in the mixture, along with 756 kg/m3 of crushed gravel and 185.9 L/m3 of water.
A total of six SCGC mixtures were prepared, in which FA was used (at dosages of 0, 30%, 40%, 50%, 60%, and 70%) to partially replace GBFS by total binder mass. To prepare the solution of NH with molarity of 2 M, 98% pure NH pellet was dissolved in tap water and cooled down at 24 ± 3 °C to cool for 24 h. Subsequently, to produce the alkaline activator solutions, the sodium silicate and sodium hydroxide were mixed into the final solution and left to rest for 24 h before use. The crushed gravel and river sand were then mechanically premixed for 2 min. Thereafter, the two alternative binders were added (GBFS and/or FA). The mixture was then mixed for another 2 min. Lastly, the proposed alkaline activated mixture was supplemented in the solution and stirred for an additional 3 min since it usually takes longer to mix self-compacting concretes than conventional ones. Since the high-content FA mixture increased the water demand, the maximum amount of FA added to the SCGCs was limited to 70%. Upon completing the casting process, the obtained specimens were subjected to curing for one day at 27 ± 1.5 °C (75% relative humidity). Lastly, these cured specimens were de-molded and kept at similar conditions for testing and analysis. Figure 3 illustrates the typical procedure to obtain alkali-activated SCGCs using FA and GBFS as precursor binder materials.
In compliance with the specified guidelines for self-compacting concrete (EFNARC) [31], once the mixing process was completed, the new properties of synthetic concrete were assessed straight away. Such properties include the resistance to aggregation, as well as capacity to fill and pass. Accordingly, in this study, slump flow, J-ring, T50, L-box, and V-funnel tests were carried out on all six alkali-activated SCGCs. Figure 4 presents the experimental tests concerned in this research for evaluating the fresh properties of alkali-activated SCGCs.

2.3. Test Program

Segregation resistance refers to concrete’s ability to remain in the same state throughout the placement setting without any separation of aggregates from the surrounding mortar. It also captured both static and dynamic stability features. The resistance to segregation of the various mixtures was tested in this study by implementing a V-shaped funnel filled with concrete (volume of 0.01 m3) that was not tapped or compacted. Subsequently, a trap door located at the bottom of the funnel was opened to enable the concrete to flow out, and the flow time was then recorded. The funnel flow time should be between 6 and 12 s, according to relevant standards. The slump flow test evaluated the flowability with no obstacles wherein the mean base diameter of the concrete at the end of the test was measured. This calculated the capability of the concrete to morph under its own weight against the resistance of the surface without other obstacles. Due to the gelatinous quality of SCGCs, the measurement of the slump flow was taken after the concrete settled when visible movement was stopped. The measurement of the mixtures’ filling capacity assessed any shape changes caused by the weighting, impacting the flow time. Thus, slump flow tests were performed to assess the flow capacity. The lengths concerning the T50 slump flow of the concretes were obtained up to a flow diameter of 500 mm. The T50 time is a secondary indication of flow, and a lower time indicates greater flowability. Moreover, J-ring tests were carried out using four unique J-rings. In the field of concrete production, passing ability and spreading ability are two distinct features. The latter refers to the mixture’s ability to pass through a restricted space and reinforcing rebar. Typically, the passing ability of concrete is enhanced through increased filling capacity. Thus, L-box tests were performed to evaluate the passing and filling capacity of the newly prepared alkali-activated SCGC mixtures. In this process, the blocking proportion (H2/H1) was estimated. ASTM-D455 [32] guidelines were considered to determine the proposed mixes’ plastic viscosities. This test method specifies a procedure for determining the kinematic viscosity (ν) of the liquid products, both transparent and opaque. This was obtained by measuring the time for a volume of liquid to flow under gravity through a calibrated glass capillary viscometer.
To determine the early and concluding setting time of the obtained SCGC eco-efficient mixtures, the provisions of ASTM-C191 [33] were followed. The initial setting time referred to the period between mixing binders in which plasticity was partially lost. Alternatively, the final setting time referred to the length of time needed for the concrete to harden to withstand a recommended pressure. A needle with a 1.13 mm diameter was inserted through the center of the cylindrical GC mold to assess these values. The time required between the start of the process and penetration of the needle to 25 and 1 mm from the end of the mold was considered as the initial and final setting time, respectively.
Cubic specimens with dimensions 100 mm ×100 mm ×100 mm, cylindrical specimens with dimensions 100 mm × 200 mm, and beam specimens with dimensions 100 mm × 100 mm × 500 mm were prepared for compressive strength, splitting tensile strength, and flexural strength testing, respectively. To test the compressive strengths (CSs), splitting tensile strengths (TSs), and flexural strengths (FSs) of the new mixtures, ASTM-C109 [34], ASTM-C496 [35], and ASTM-C78 [36] stipulations were followed, respectively. The mean values recorded for 3 identical samples were reported. The CS of specimens was measured using a universal testing machine (UTM, NL Scientific, Klang, Malaysia) at a constant loading rate (2.5 kN/s). Owing to the test machine’s inherent structures, the values of CSs and densities were recorded based on the assigned weights and facets of the specimens. The concrete specimens made with different dosages of FA were tested after 1, 3, 7, 28, 56, and 90 days. Three specimens were tested to evaluate the CS, TS, and FS at the curing age of 1, 3, 7, 28, 56, and 90 days. The mechanical properties of the FA-modified concrete were then compared to those of the control specimen (100% GBFS binder). Moreover, pieces of the concrete retrieved from specimens cured for 28 days were used to explore the microstructure of the newly prepared SCGCs.
X-ray diffractometer (XRD, Rigaku, Singapore) and scanning electron microscope (SEM, Hitachi, Ibaraki, Japan) were deployed to evaluate GBs incorporated with various industrial by-products. In this test, three samples incorporated with different dosages of FA (30%, 50%, and 70%) were selected to explore the effect of FA on the performance of the developed concretes. For each sample, two XRD patterns were recorded to verify the repeatability of the obtained results. The XRD analyses were performed to determine the crystallinity, preferable lattice orientation, crystal structures/lattice parameters, and phases of the samples. In this study, XRD patterns of the powders of geopolymer paste were recorded in the angular region of 5–60 degrees with resolution of 0.02 degree. The obtained XRD data were analyzed using MDI Jade and Match software of version 6.5 and 3.10.2.173, respectively to confirm the amorphous characteristics of the mixes. In addition, SEM images were recorded to evaluate the samples’ morphologies and microstructures. The operating conditions consisted of the electron beam energy of 20 keV, beam current of 726 pA, and count time of 10 s with 3500 counts per second.

3. Results and Discussion

3.1. Fresh Properties

To determine the passing capacity of various mixtures, L-box measurement was carried out as depicted in Table 3. The results confirmed that with the increase of FA dosage from 0 to 50% in the proposed SCGC mixtures, the L-box blocking ratio was increased from 0.78 to 0.92, respectively. However, increase of FA to 60% and 70% reduced the ratio to 0.84 and 0.80, respectively. All the mixtures incorporated with 30% to 70% FA as partial replacement for GBFS achieved EFNARC criteria for the L-box ratio (0.80 to 1.0). The mixture made with 50% FA showed the highest L-box blocking ratio of 0.92. Although the control mixture’s blocking ratio (0.78) was not in line with the EFNARC specifications, a majority of the SCGC mixtures containing FA could satisfy the standard.
The V-funnel measurement was conducted to determine the segregation resistance of the proposed SCGC mixtures. With the increase of FA dosage from 0 to 50%, the V-funnel time was decreased from 14 s to 8.5 s, respectively. However, the V-funnel time was increased when the FA level was increased beyond 60%. Among the designed SCGCs, the mixtures made with 40%, 50%, and 60% of FA accomplished the desirable attributes of the self-compaction concretes with V-funnel time between 6 and 12 s.
To measure the filling ability of the proposed SCGC mixtures, slump flow, T50 flow, and J-ring tests were conducted. The filling ability of the concretes was highly influenced by the FA content used as partial replacement of GBFS in mixes. For the slump flow test (Figure 5), increase of FA contents from 0 to 70% produced corresponding slump flow values of 560 to 630 mm. In accordance with EFNARC, the SCGC mixes were made by incorporating FA of 40% to 60% and categorized as class-2 slump flow (650 mm to 800 mm), making them appropriate for diverse applied purposes like the construction of columns and walls. Identical trends were noticeable in the T50 flow test results, wherein the mixtures prepared with 40%–60% FA as GBFS replacement achieved the standard requirements (2–5 s).
The results of the J-ring test showed that the filling ability was enhanced with the inclusion of FA as partial GBFS replacement. The J-ring readings were decreased from 12 mm to 6 mm with the corresponding increase of GBFS replacement level by FA from 0 to 50%. However, increase of FA content to 50% negatively affected the filling ability of the SCGC mixtures, and the readings were increased to 7.5 and 10.5 mm for 60% and 70% of FA content, respectively. The SCGC mixtures containing 30% to 60% FA achieved the standard requirements for producing self-compacting concrete (0–10 mm).
The newly developed mixtures exhibited improved workability owing to the lower water adsorption and chemical reaction rates of the FA. The improved workability of the mixtures incorporating 40% and 50% FA can also be ascribed to the high level of FA spherical particles, which are smoother compared to the angular GBFS particles. The combined three key factors in SCGC mixtures made with 40% and 50% FA (specific surface area, particle shape, and chemical reaction rate) are features that allow the production of eco-friendly SCGCs with tailored self-compacting rheological features. Nonetheless, SCGC mixtures containing very high FA levels may have reduced workability due to the increased importance of the counter-effect of the high water adsorption and porous structure of the FA particles fraction [37]. Felekoglu et al. [38] previously found that binders with low FA levels had effective blocking ratios (good filling capacity), making them very beneficial for self-compacting concretes. Current findings are in line with those of the existing literature, which has investigated self-compaction concretes made from metakaolin and GBFS [39,40].
The properties of the newly developed eco-efficient SCGC mixtures made with different partial replacement levels of FA (40%, 50%, and 60%) for GBFS generally fulfilled the recommended standard requirements for fresh characteristics with respect to their flowability, resistance to segregation, ability of filling, and passing capacity. The large amount of FA and GBFS mainly impacted the plastic viscosities of the mixes. Moreover, when FA content was increased from 0 to 50%, the plastic viscosities were reduced from 91 to 63 centipoise (cP). In contrast, the plastic viscosities of the specimens were increased from 79 to 86 cP when the FA levels reached 60% and 70% (Table 3). This rise in the plastic viscosity of the mixtures at high GBFS and FA levels was likely due to their chemical compositions and changes in their physical properties. Diamantonis et al. [41] pointed out that a high FA content can induce a substantial increase of the plastic viscosity. This is because its pores absorb water but play little role in enhancing the flowability. Nath and Sarker [42] demonstrated that the use of GBFS in the GBs could speed up the chemical reactions, increasing the viscosities of the specimens thereby causing strong resistance to the flow and poor flowability. GBFS is considered as a pozzolanic material due to its cementitious properties which can impact the hydration and cause the paste to be more adhesive and less flowable.
Table 3 indicates a slight increase in the setting time with the increase of FA content, which may have been due to the effect of the lower calcium content elongating the setting time. In other words, a reduction of the Ca content and a lower chemical reactivity of the binder with the host matrix was responsible for the time elongation [42,43]. Nevertheless, once the FA levels were increased from 0 to 70%, the setting rate was declined. This finding agrees with the existing literature [44,45], which revealed that the setting of geopolymer FA concretes was slower than that of mixtures using pure GBFS binders (less than 11 min) at ambient temperature. It is important to note that as the FA level was increased, the SiO2 and Al2O3 levels in the new matrix also increased. In turn, this caused a decrease in the chemical reaction rate for the process that produces N, C-(A)-S-H gel. This finding is in line with the fact that mixtures with higher GBFS contents have faster setting times [46,47]. Researchers have suggested that the inclusion of FA in the binder can cause the setting time of GBFS-based SCGCs to decrease at room temperature.

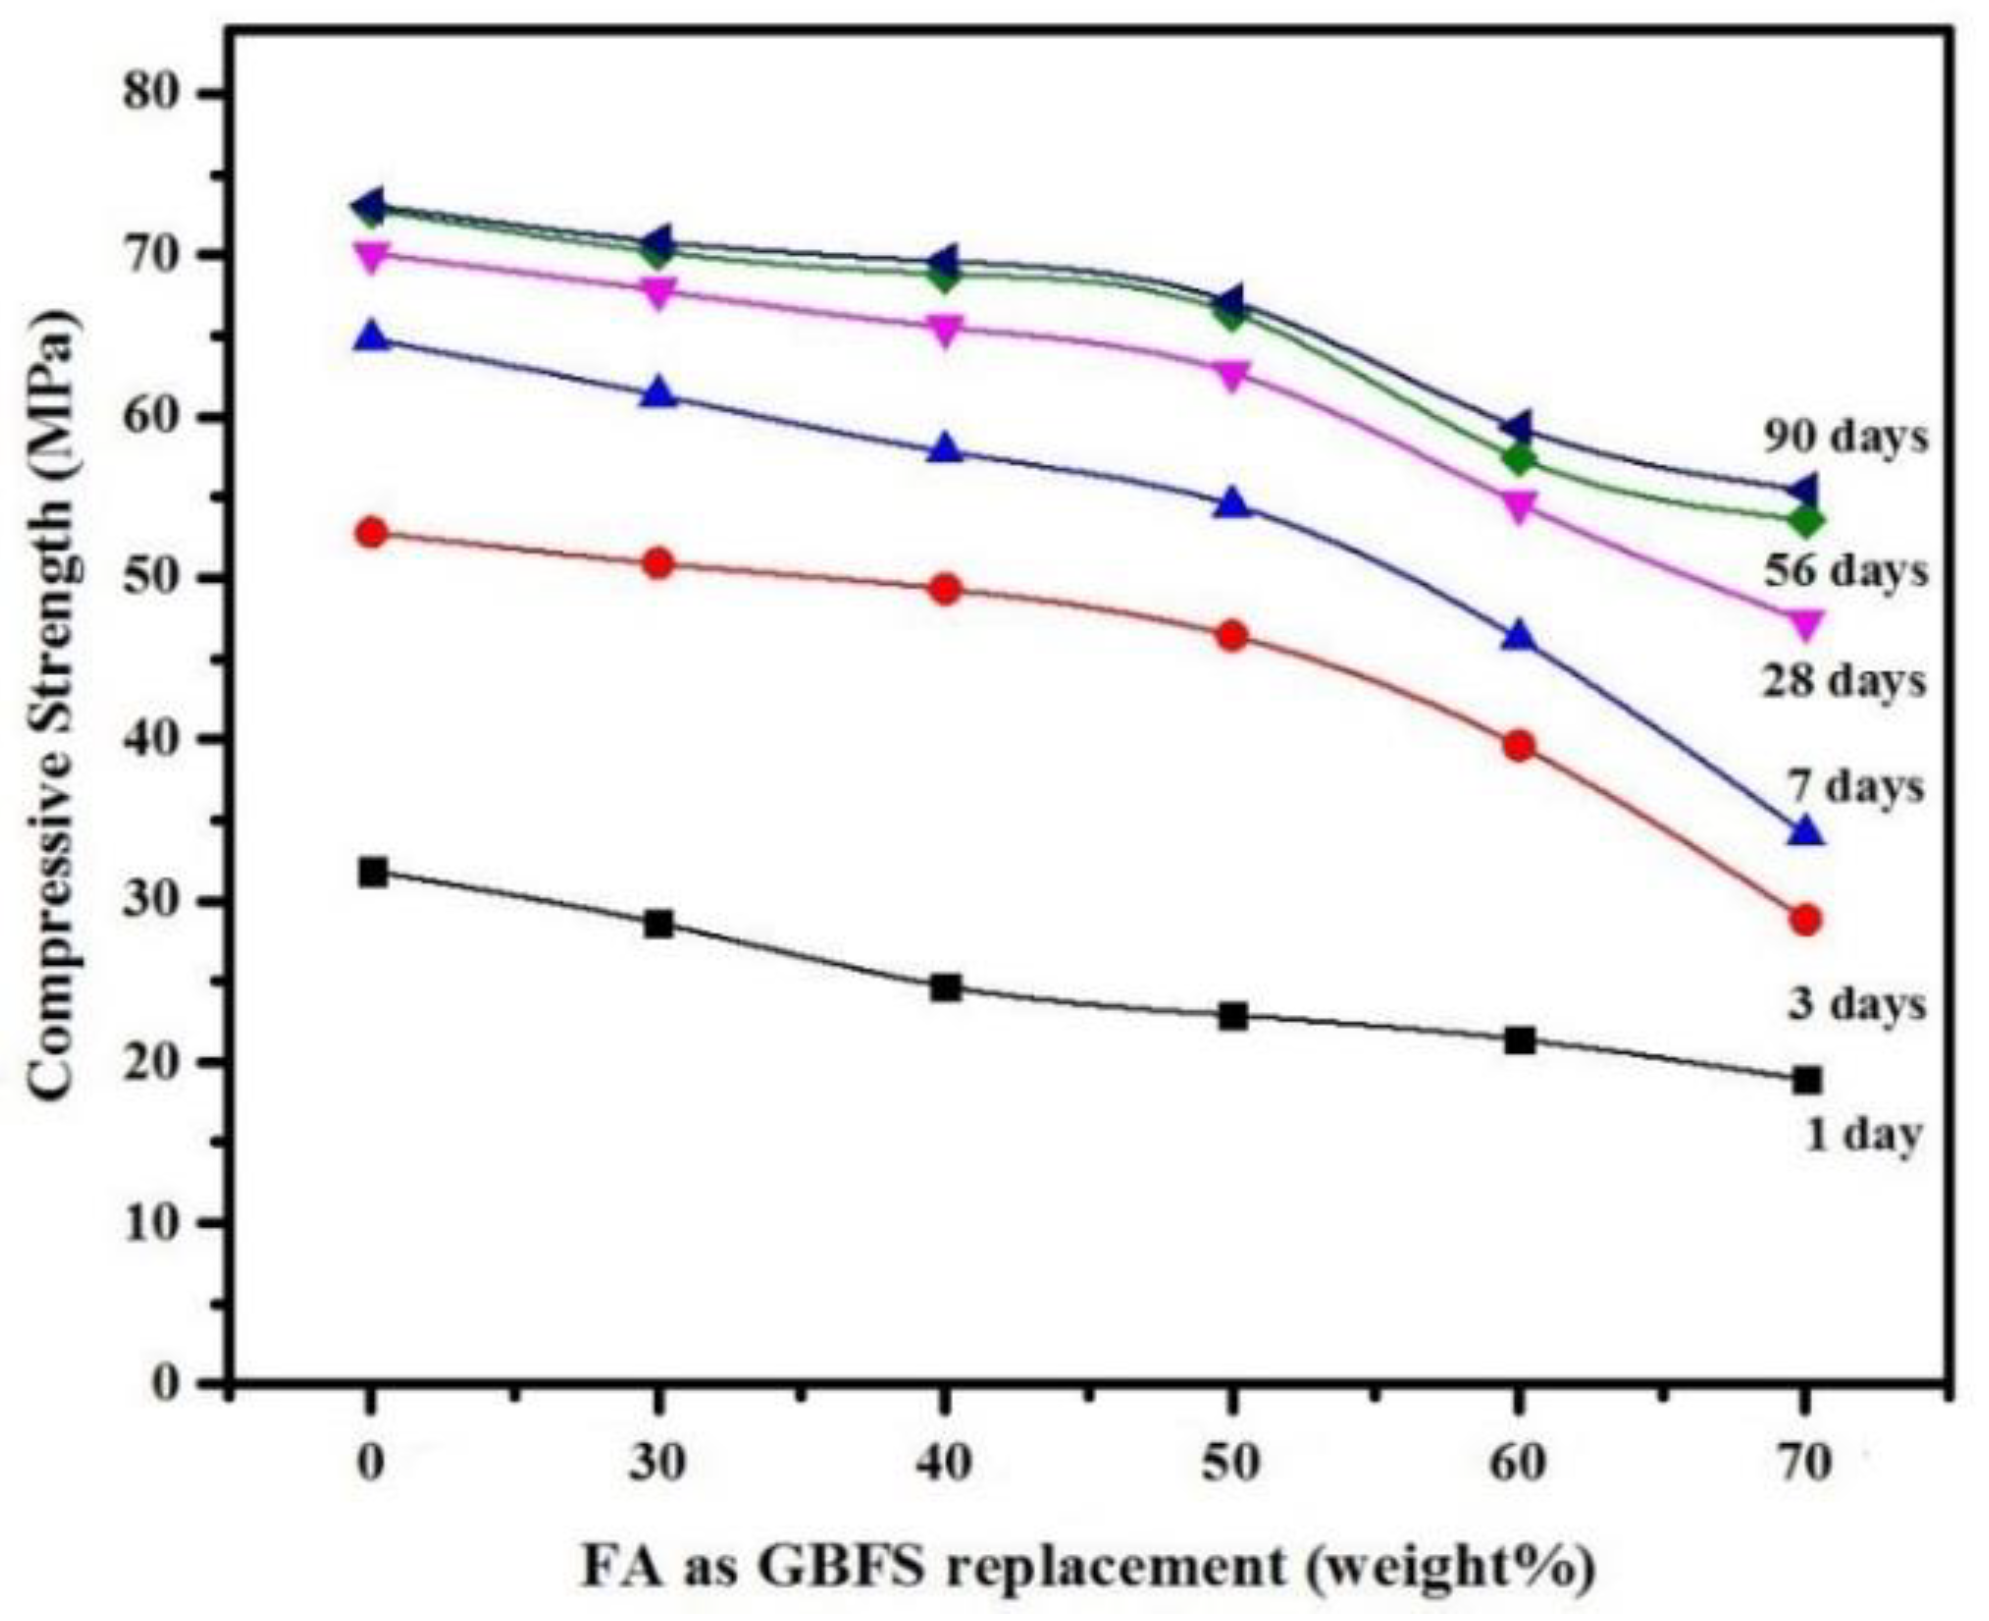
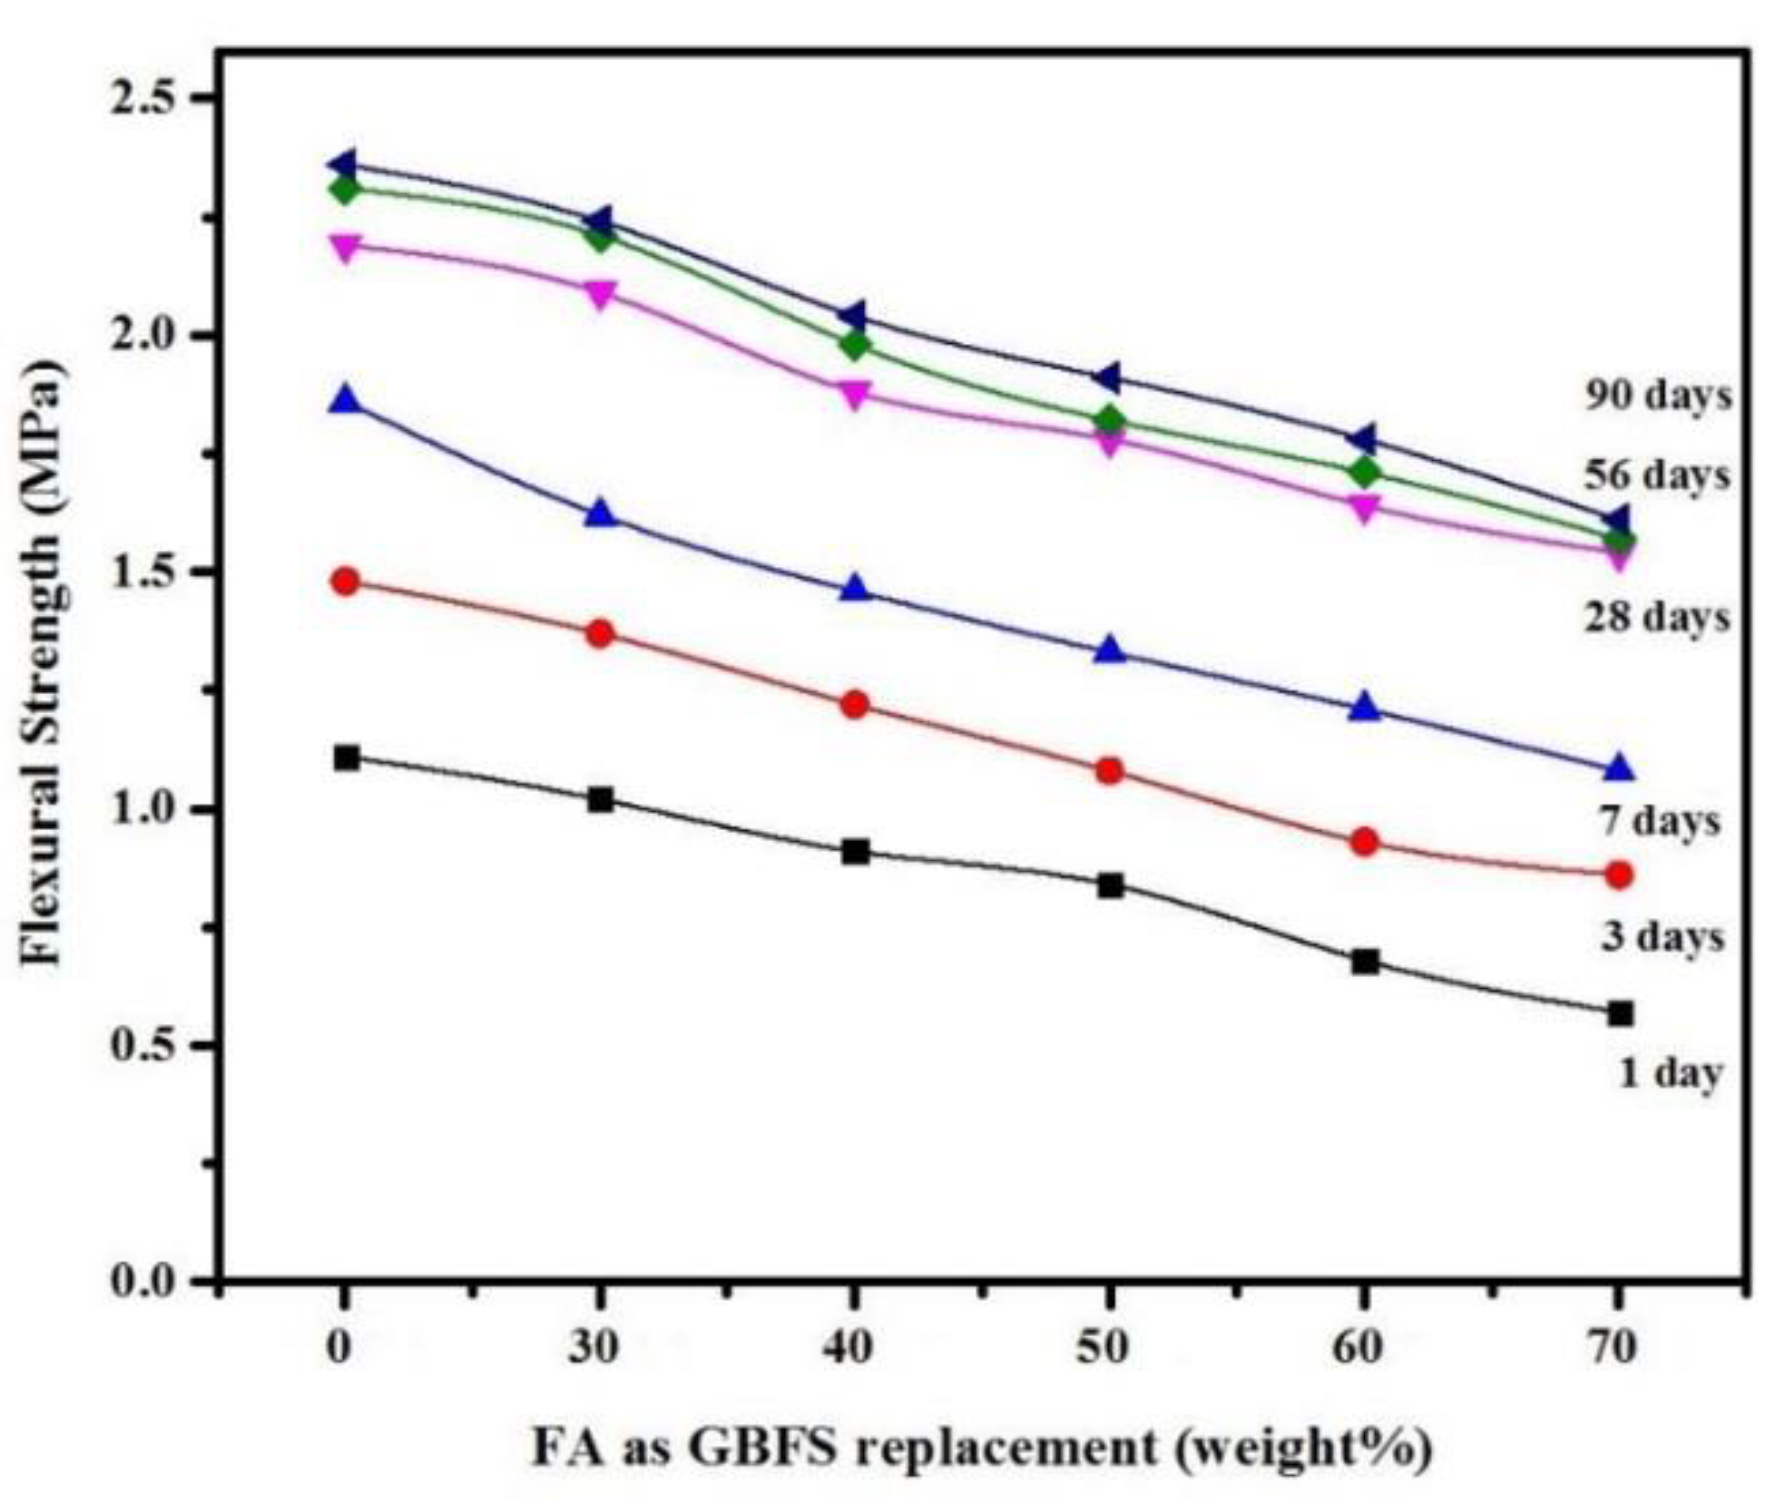
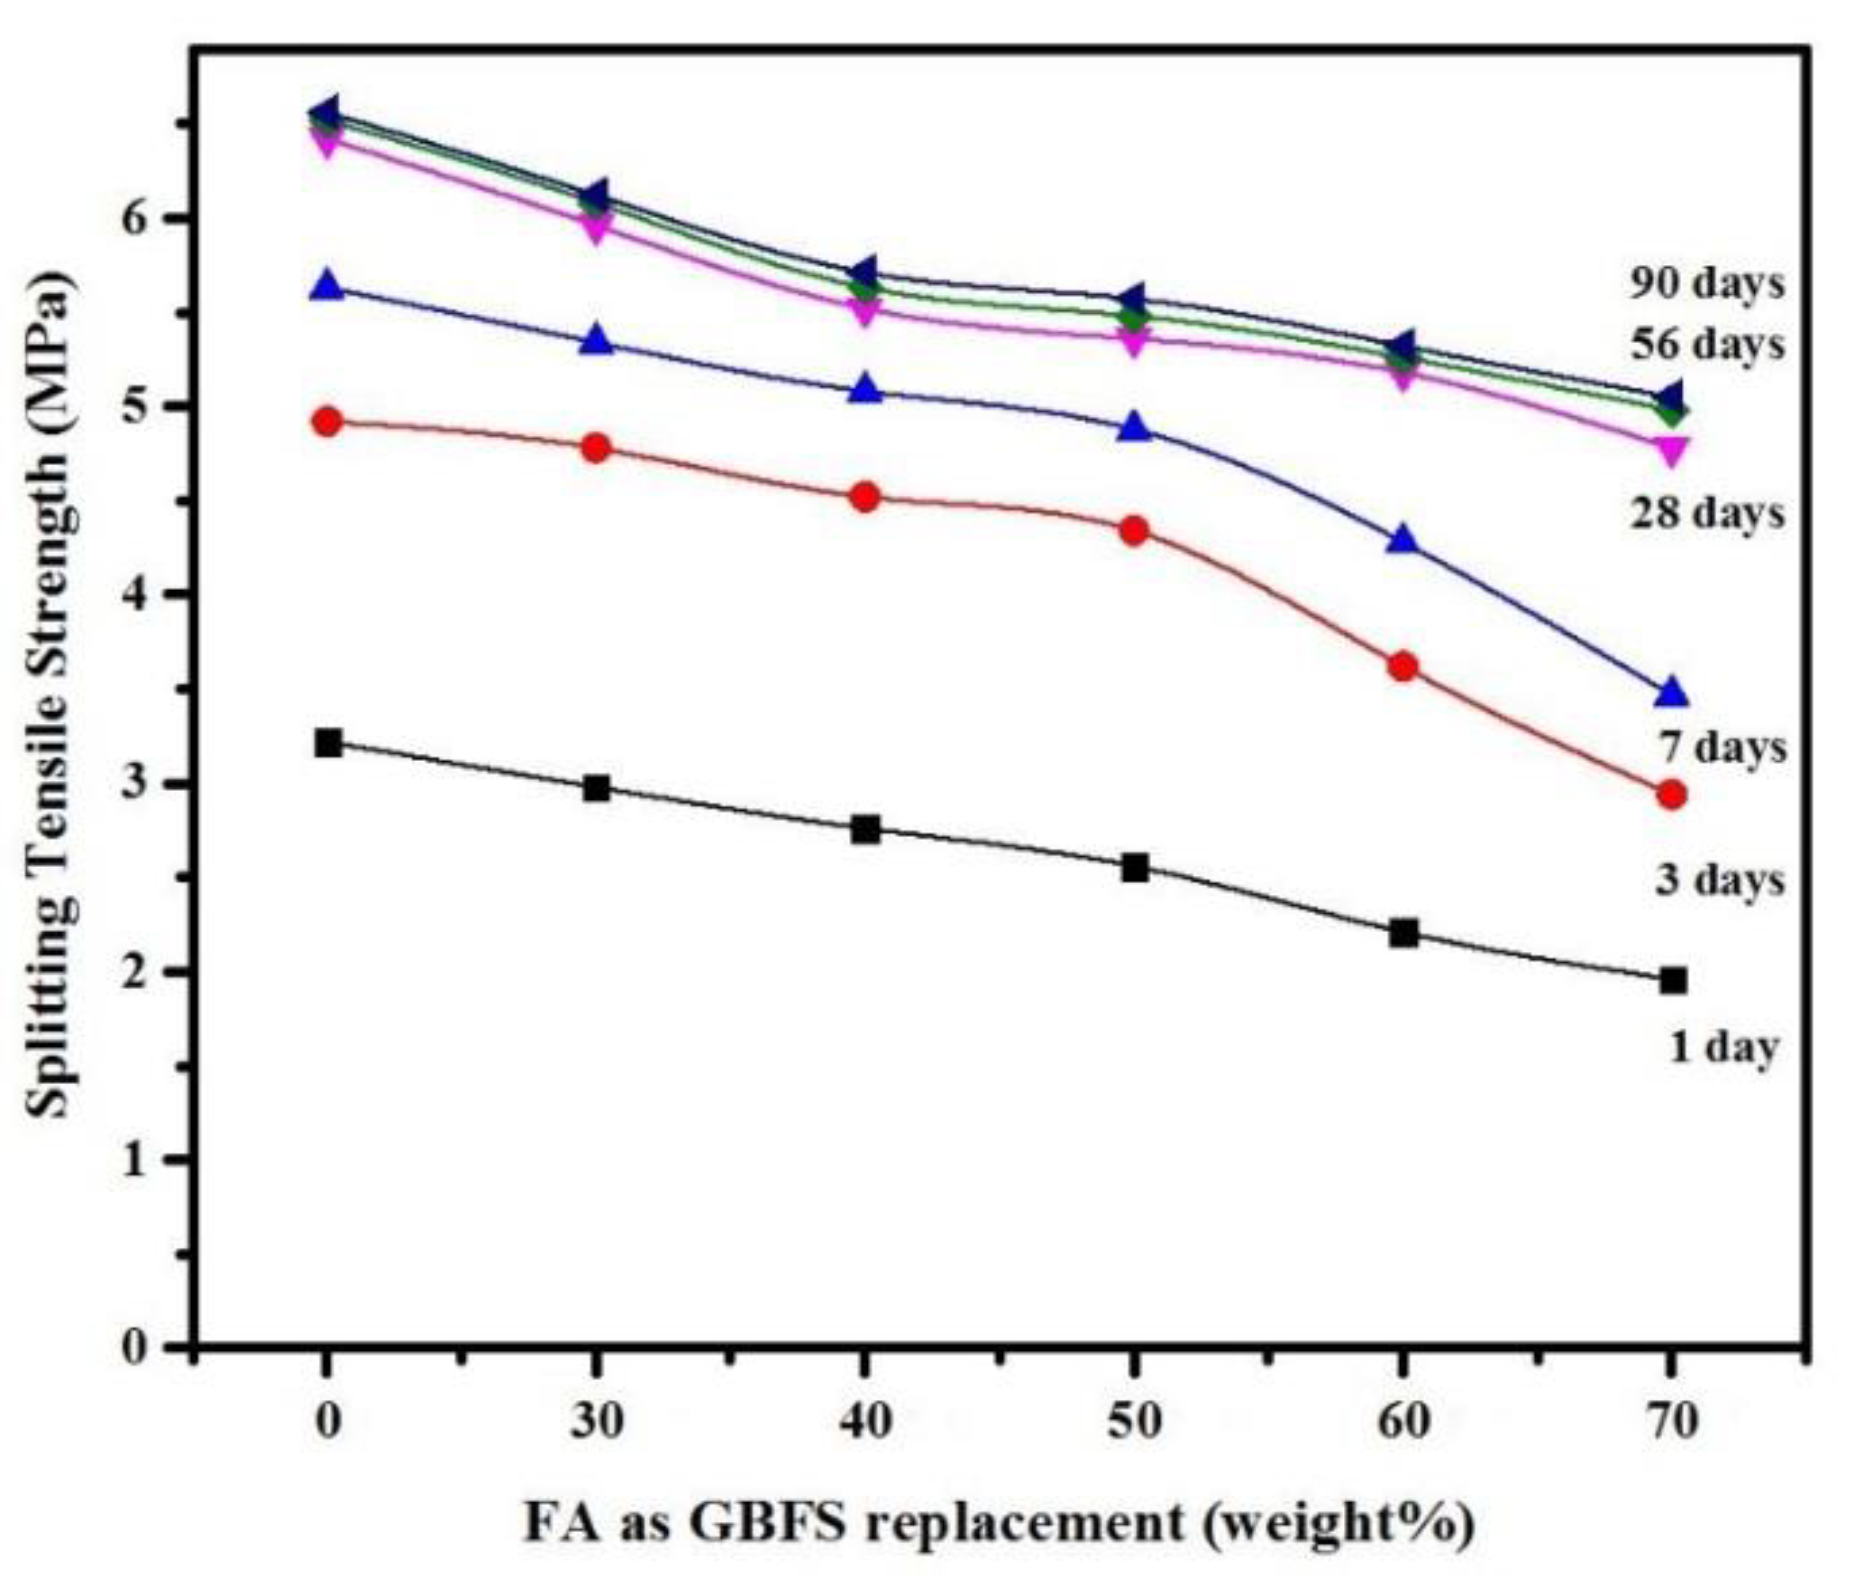
3.2. Mechanical Properties

Figure 6 depicts the CS values of all SCGC mixtures investigated in this study. The mixes were examined after 1, 3, 7, 28, 56, and 90 days of curing. As expected, the CS of the SCGC mixtures was increased when the curing ages were increased. At one day of curing, the control specimens yielded a CS of 31.8 MPa. With the increase of FA contents from 30% to 70%, the corresponding CS of the sample cured for 1 day was decreased from 28.6 to 18.9 MPa. The CS of all mixes after 28 days was above 45 MPa, indicating their effectiveness as structural concrete for most construction projects.
Figure 7 presents the FSs of the SCGC mixtures with regards to the FA used to partially replace GBFS. The data shows that the FA content and curing time both impacted the FS values, which decreased as the FA level was increased. After 28 days of curing, the specimen incorporating 70% FA achieved an average FS value of 1.54 MPa, while the control specimen attained an FS value of 2.19 MPa. The effect of different FA dosages on the TSs of specimens after curing for 1, 3, 7, 28, 56, and 90 days is presented in Figure 8. The results confirmed an inverse relationship between TS and the FA content. Additionally, the FA inclusion negatively impacted both the early and late age development of TS. For instance, the TS of the concrete cured at 28 days and incorporated with 70% FA was approximately 25.6% lower than the control specimen.
Overall, by increasing the FA content from 0 (control specimen made with 100% GBFS binder), the values of CS, FS, and TS for the 28 days-cured specimen were decreased by 48%, 42%, and 34%, respectively. This revelation was ascribed to the increase of SiO2 and decrease of CaO in the alkali-activated SCGCs, causing a reduction in the hydration process. Moreover, reduced GBFS content could lower the CaO/SiO2 ratio, which eventually caused a lowering of the dense C-(A)-S-H gel production in the matrix containing high levels of FA [43,48]. Conversely, an increase of the GBFS content led to an improvement in the microstructures of the alkali-activated SCGCs. The results indicated that the CS value of the mixture made with high FA content (MS6) after 28 days of curing was 47.3 MPa, which is well beyond the minimum CS required for the structural OPC-based concrete.
The CS, FS, and TS failure patterns of specimens for mixture MS2 (30% FA replacement of GBFS) are depicted in Figure 9. The results indicated the development of many cracks on the exposed surfaces of the specimens, with minor damage at the bottom and top of specimens which were better confined with the test machine platens. Generally, specimens with high volume FA content displayed distributed cracks with a brittle failure (showing a zigzag shape). Conversely, the control specimen exhibited a cleavage cracking pattern. This failure pattern in the slag-based GC could result from the occurrence of high cohesive forces due to the expansion of a larger amount of reaction compounds than for FA-based GBs. The different kinds of failure patterns observed are further explained in BS EN 12390-3 [49].

3.3. Structure and Morphology Analyses

Figure 10 shows the XRD results of the obtained SCGCs containing different FA levels after 28 days of curing. The pattern shows multiple sharp diffraction peaks caused by the formation of different amounts of crystallites. However, the general process of conducting structural analyses was challenging because there were strong overlaps among various crystalline peaks. According to the XRD results, crystalline peaks were identified for SiO2, C-S-H, and 3Al2O32SiO2 or 2Al2O3SiO2 phases. The FA contents used in the SCGCs seemed to directly impact the intensities of these peaks. There were clear peaks corresponding to the crystalline quartz and mullite phases initiated by the parent FA. In addition, when the FA level was increased from 50% to 70%, the quartz peak intensities were also increased. This was most likely because the product was generated from the reactions between remaining glassy FA and GBFS. According to Kumar et al. [46], the hydration reactions only cause new products to form if there are reactive or refractory glasses present in the FA.
Moreover, a broad halo was revealed at approximately 10 degrees, indicating the presence of hydrotalcite (Mg6Al2CO3OH16.4H2O) with short-range order (poor crystallinity or amorphous phases) [50]. The C-S-H, CaCO3, and mullite peaks occurred in the range of 28–50 degrees. Likewise, there was an increase in the crystalline peak intensities once the FA content was increased. The C-S-H crystalline peak was replaced by the quartz and mullite peaks when the FA level in the matrix was increased from 30% to 50%. Additionally, the XRD peak of quartz replaced the mullite peak at 16 degrees in the 50% FA sample. As more nepheline crystallites (Na3KAl4Si4O16) formed, peaks at approximately 24 and 33.8 degrees occurred. Calcium, silicate, and aluminum further impacted the CS values as well as the production of C-S-H and C-A-S-H gels of the alkali-activated SCGCs. Additionally, a decrease in CS values was evident, most likely due to the reduction in C-(A)-S-H gel formed in the SCGCs.
Figure 11 depicts the SEM images of some selected SCGC mixtures obtained using various levels of FA as partial replacement for GBFS. The morphology of the control specimen (without FA) and SCGC mix (with 30% FA) are shown in Figure 11a,b respectively. The 30% FA-activated mix revealed fewer microcracks, micropores, and non-reactive particles than those obtained with 50% and 70% FA. This caused the samples with more than 30% FA content to have lower CS values. In addition, samples with low FA levels showed expanded C-(A)-S-H gel across the entire sample surface, producing a smoother solid texture. There was less spreading of C-S-H and C-A-S-H gel inside the concrete network of the samples containing higher FA levels, which allowed the creation of more fragile textures than the mixes containing lower levels of FA (30%). This in turn resulted in lower CS values for SCGC mixtures than for the pure GBFS control sample. Meanwhile, by increasing the FA dosage to 70%, the number of cracks, the number of pores, and the general unevenness were increased.
The existing literature on GCs [51,52,53] indicates that with the increase of FA levels, the amount of non-reacted SiO2 in the concrete can increase. Ultimately, this can make the mixture more porous with a less-dense morphology. Thus, it can be concluded that higher FA levels (corresponding to a decline in GBFS content) reduce the production of C-(A)-S-H gels and create more partially reacted (mullite) and non-reacted particles (quartz). The control specimen was denser than the other specimens. Nevertheless, some microcracks and pores were evident in these samples which were produced due to the hydration of CaO, Al2O3, and SiO2.

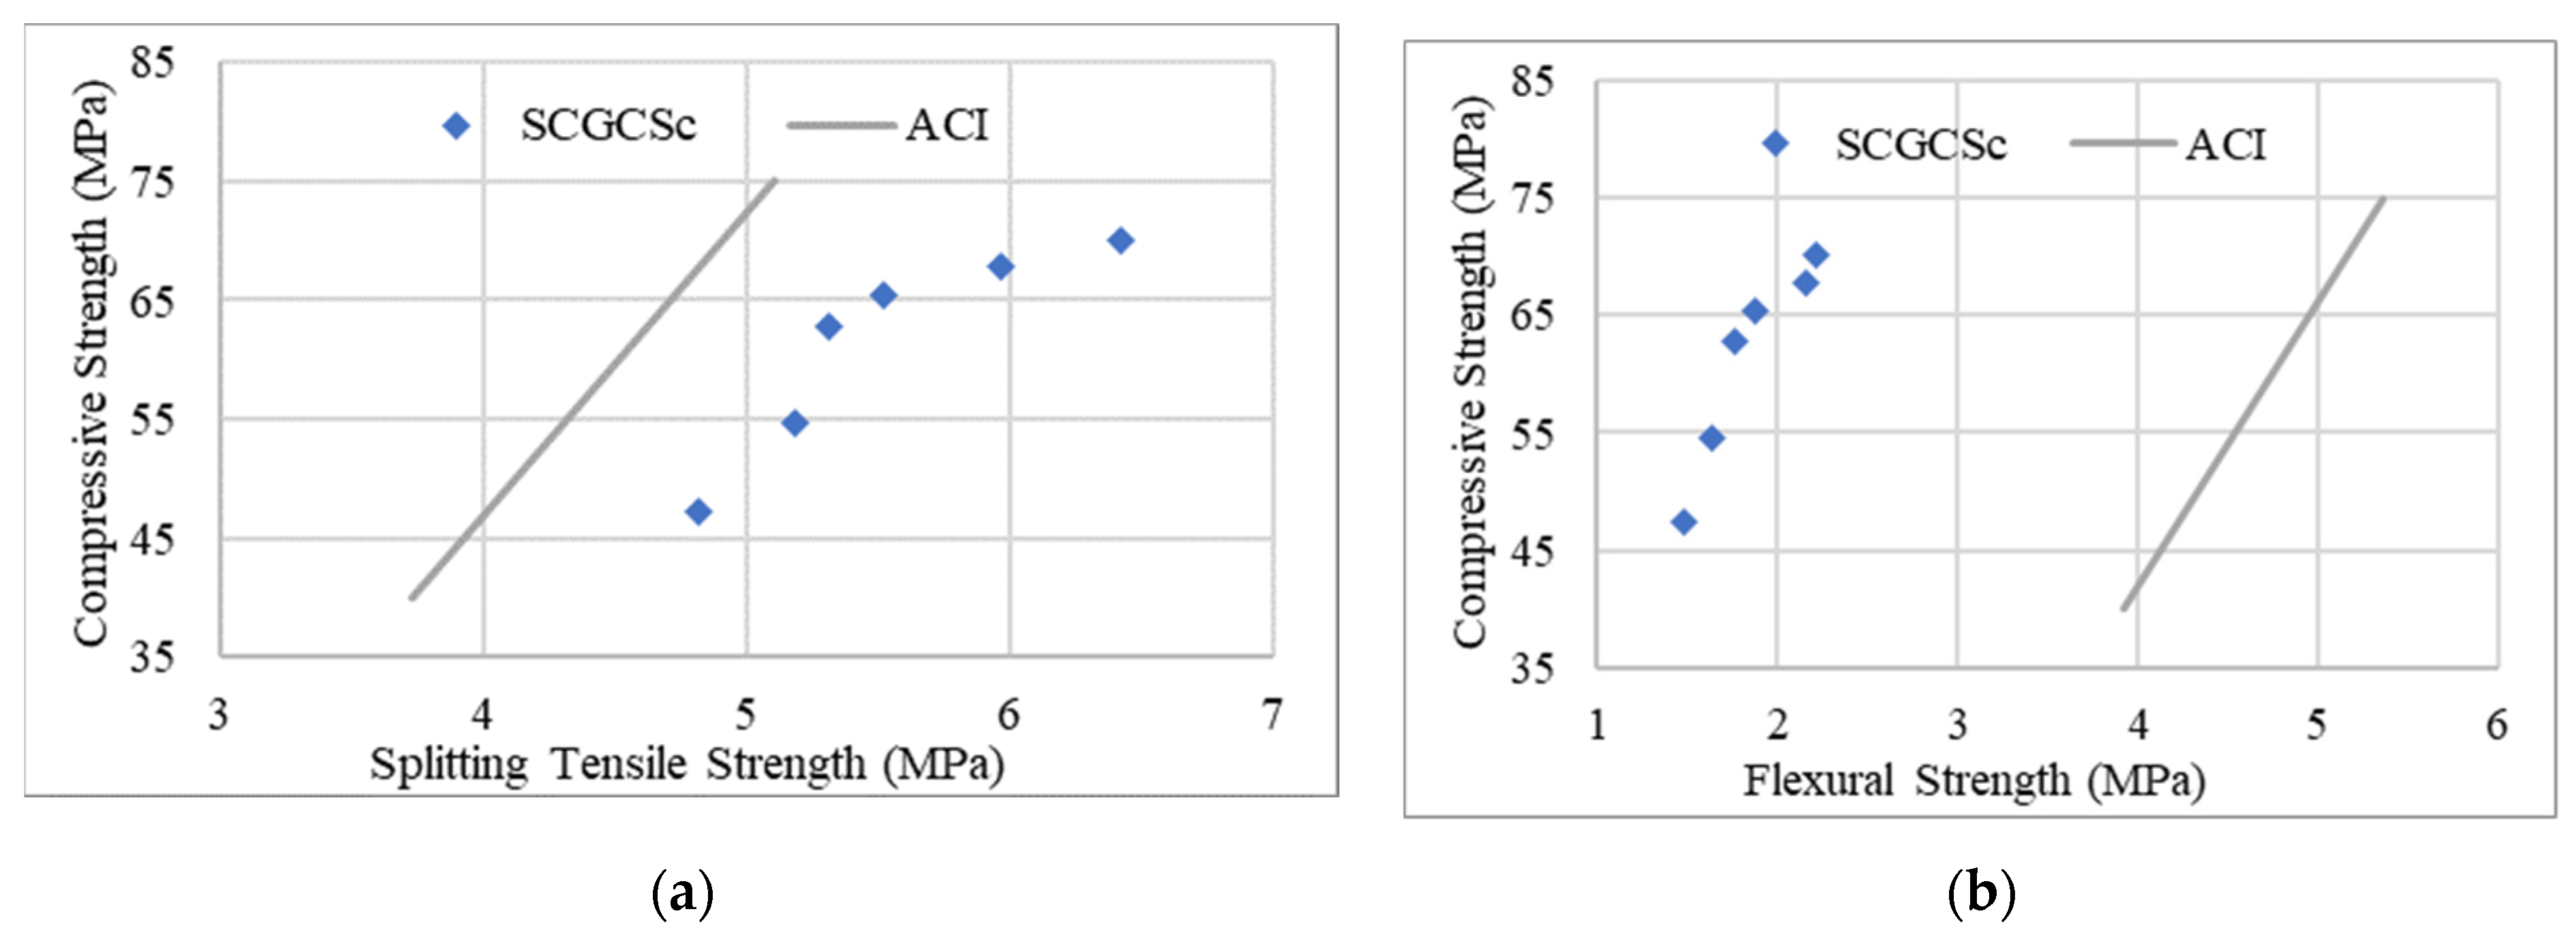
4. Strengths and UPV Correlation of SCGCs

The CS is the most important mechanical property of concrete, and the most specified for construction materials. Moreover, TS and FS are of primary importance and CS is often used to estimate these properties. For instance, ACI 318-14 [54] proposes the following relationships between CS, TS, and FS for conventional concretes:
TS = 0.59 CS 0.5
FS = 0.62 CS 0.5
Figure 12 presents the correlation between CS, TS, and FS of the proposed SCGCs. The accuracy of the ACI relationships for the alkali-activated SCGCs was investigated at the age of 28 days. The ACI relationships of the proposed mixes did not correctly estimate the correlation among various mechanical properties.
The non-destructive ultrasonic pulse velocity (UPV) test has been used by many researchers to estimate the CS value of concrete. The UPV test can appraise the positions of defects and cracks, and well as the homogeneity and dynamic elastic moduli of concrete. Nevertheless, it is extensively applied to evaluate concrete’s CS in prevailing and fresh construction on-site. The most straightforward and commonly used relationship between the CS of concrete and UPV is presented in the following form:
CS = Ae BV
where V is the pulse velocity (km/s), and A and B are constants. Using the form of Equation (3), several researchers proposed an empirical equation to correlate CS with UPV [55,56]. Nash’t et al. [57] tested 161 cubic concrete specimens (150 mm × 150 mm × 150 mm) and evaluated the influence of curing conditions on the CS (in MPa) and UPV (in km/s) correlation for curing ages ranged from 7–138 days). The following relationship was proposed based on the results:
CS = 1.19 e 0.715 V
Considering the CS and UPV of all studied mixture designs in this study, as shown in Table 4, it was revealed that Equation 4 resulted in a conservative estimation for SCGCs. Since the binder plays an important role in the development of CS for SCGC mixtures, this study proposes a new regression equation to estimate the CS of SCGCs using the ratio of aggregate to binder and the pulse velocity of the hardened concrete, as expressed in the equation below and depicted in Figure 13.
CS   = 85.59 3.578   Aggregate GBFS + 0.271   Aggregate FA 0.77   UPV

5. Development of Informational Model to Estimate the CS of SCGCs

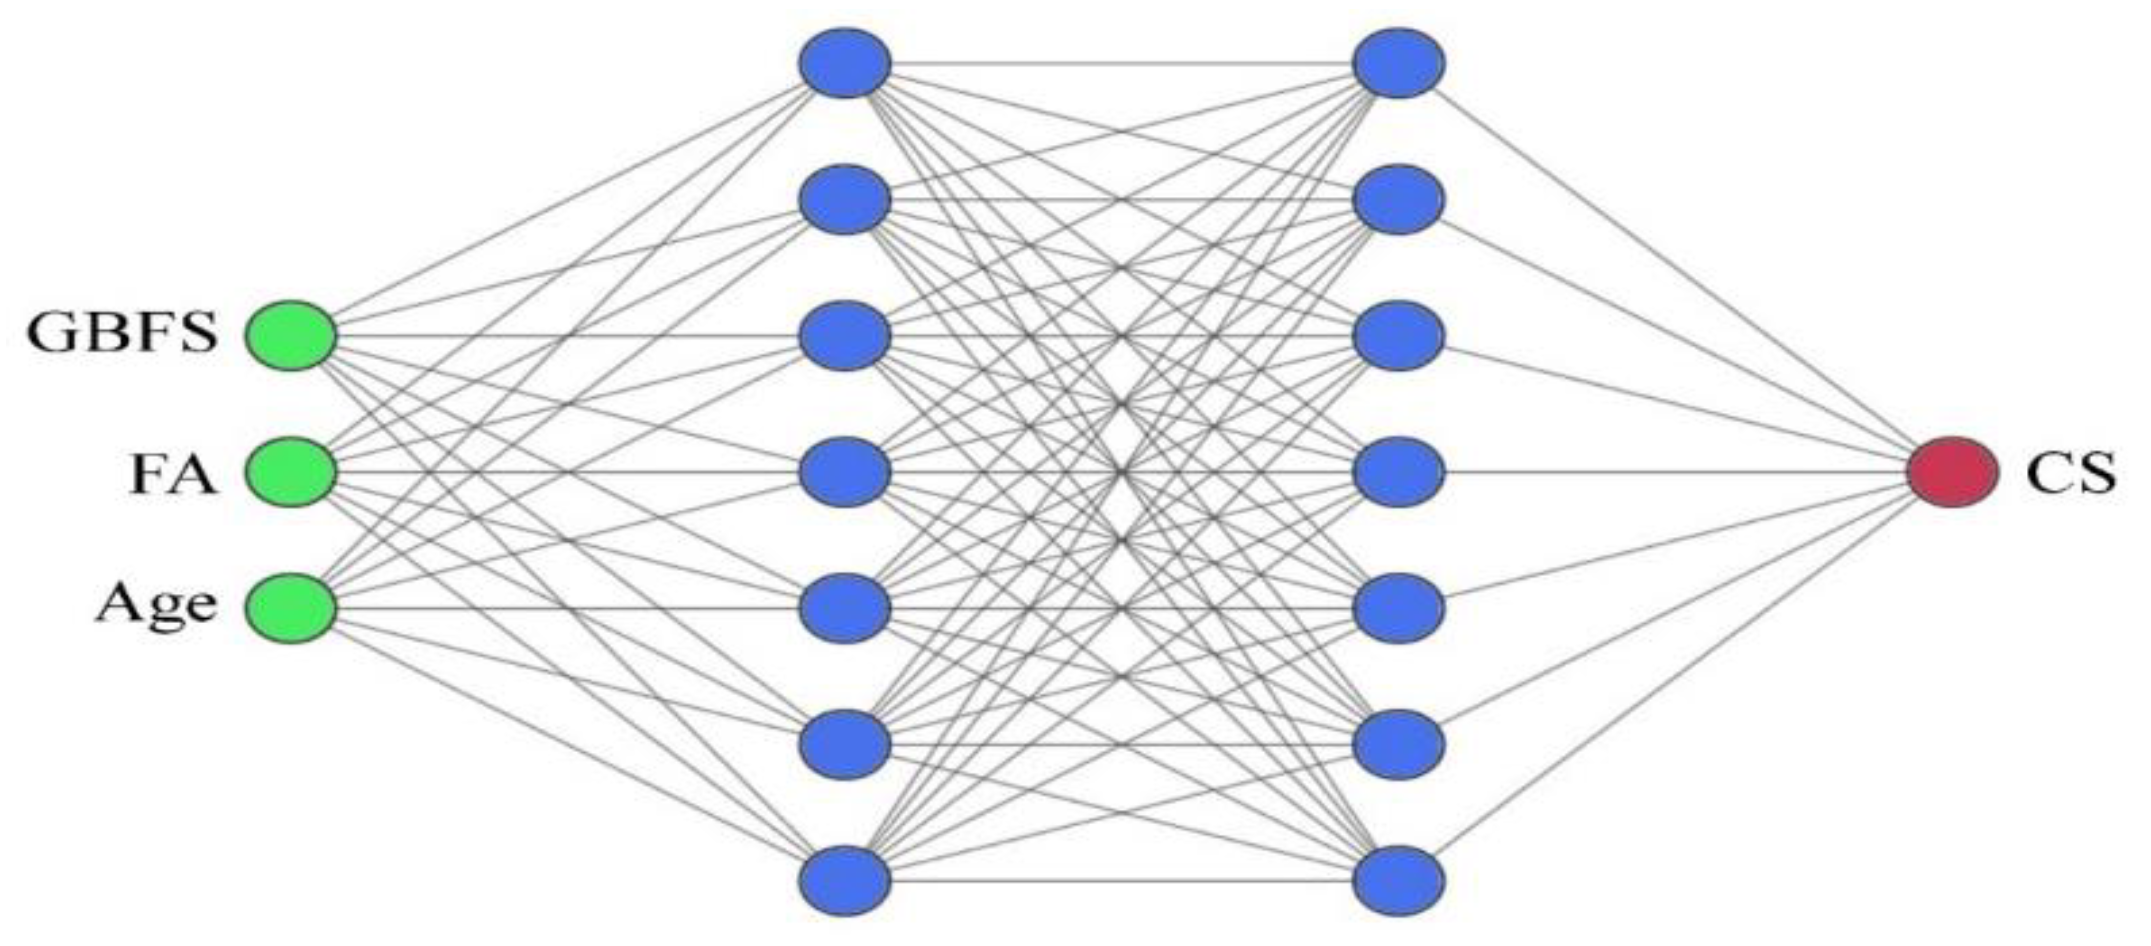
5.1. Feed-Forward ANN and Bat Optimization Algorithm

The feed-forward artificial neural network (ANN) was the first and simplest type of ANN devised. In this network, the information moves in only one direction: forward from the input nodes, through the hidden nodes (if any), and to the output nodes. There are no loops or cycles in this network. The multilayer feed-forward network provides a reliable feature for the ANN structure, and was therefore used in this research. The neurons in the hidden and output layers consist of three components: weights; biases; and an activation function that can be continuous, linear, or nonlinear. Once the architecture of a feed-forward ANN (number of layers, number of neurons in each layer, activation function for each layer) is selected, the weight and bias levels should be adjusted using training algorithms [58,59,60,61,62].
The Bat algorithm is a metaheuristic inspired by the echolocation behavior of bats [63]. Echolocation refers to a sophisticated navigation scheme based on hearing that is used by various animals for detecting the environmental objects using sound emission. During their navigation or hunting, they emit acoustic waves that propagate in the surrounding area, striking on different objects and then rebounding back to them, as depicted in Figure 14. Considering identical atmospheric air pressure, the emitted acoustic signal travels at a fixed speed. Therefore, the animal can estimate the exact distance from the surrounding object(s) measuring the time delay of the rebounded sound signal. Furthermore, the object(s) direction and shape can be distinguished by comparing the amplitude of the acoustic waves detected by each ear of the animal. This collected information is processed and synthesized in the animal’s brain, illustrating an informative mental image of their surrounding objects. Echolocation can be described using the frequencies, emission rates, and intensities of the pulses. The echolocation produced by bats while flying has a frequency range of 25 to 150 kHz, subjected to the proximity of the target. Sound waves with low frequency move farther than those with high frequency, providing distinctive and comprehensive information of the nearby objects. Pulse rates (defined as the number of pulses created in one second) are regulated by the bats in accordance with the distance of the targets. For example, once they follow a target, the pulse rate increases to a maximum of 200 pulses per second, whereas they decrease the rate range from 50 dB (quietest) to 120 dB (loudest) as they come closer to their prey.

5.2. Input and Output Parameters

Table 5 provides the parameters for the inputs and outputs along with their statistical distribution considered to train the informational model. The matrix analysis chart was developed to provide further information about input data characteristics as shown in Figure 15. In this matrix, the correlation between the input variables in the dataset and their correlation to an output parameter (CS) are investigated.

5.3. Topologies and Structure Development of the Feed-Forward ANN

In the present work, the FF-ANN model was considered where 70% of the input data was utilized for the training, while the remaining 30% was used for the network test. In addition, Levenberg–Marquardt learning rule and Tansig transfer function were used. To optimize the weights of the proposed ANN model, the Bat optimization algorithm was used as a new metaheuristic algorithms in construction material processing. Table 6 shows various characteristics of the Bat optimization when implemented in the FF-ANN.
To evaluate the adequacy of the proposed Bat-ANN model, the following statistical metrics were considered.
MAE = 1 n i = 1 n | P i O i |   Mean   Absolute   Error
MSE = 1 n i = 1 n ( P i O i ) 2   Mean   Squared   Error
RMSE = [ 1 n i = 1 n ( P i O i ) 2 ] 1 2   Root   Mean   Squared   Error
AAE = | i = 1 n ( O i P i ) O i | n   Average   Absolute   Error
EF = 1 i = 1 n ( P i O i ) 2 i = 1 n ( O ¯ i O i ) 2   Model   Efficiency
VAF = [ 1 var ( O i P i ) var ( O i ) ]   Variance   Account   Factor
where Oi is the experimentally observed value and Pi is the predicted value. After examining different potential network topologies, the following structure (Figure 16) provided optimum results for the above-mentioned statistical metrics.

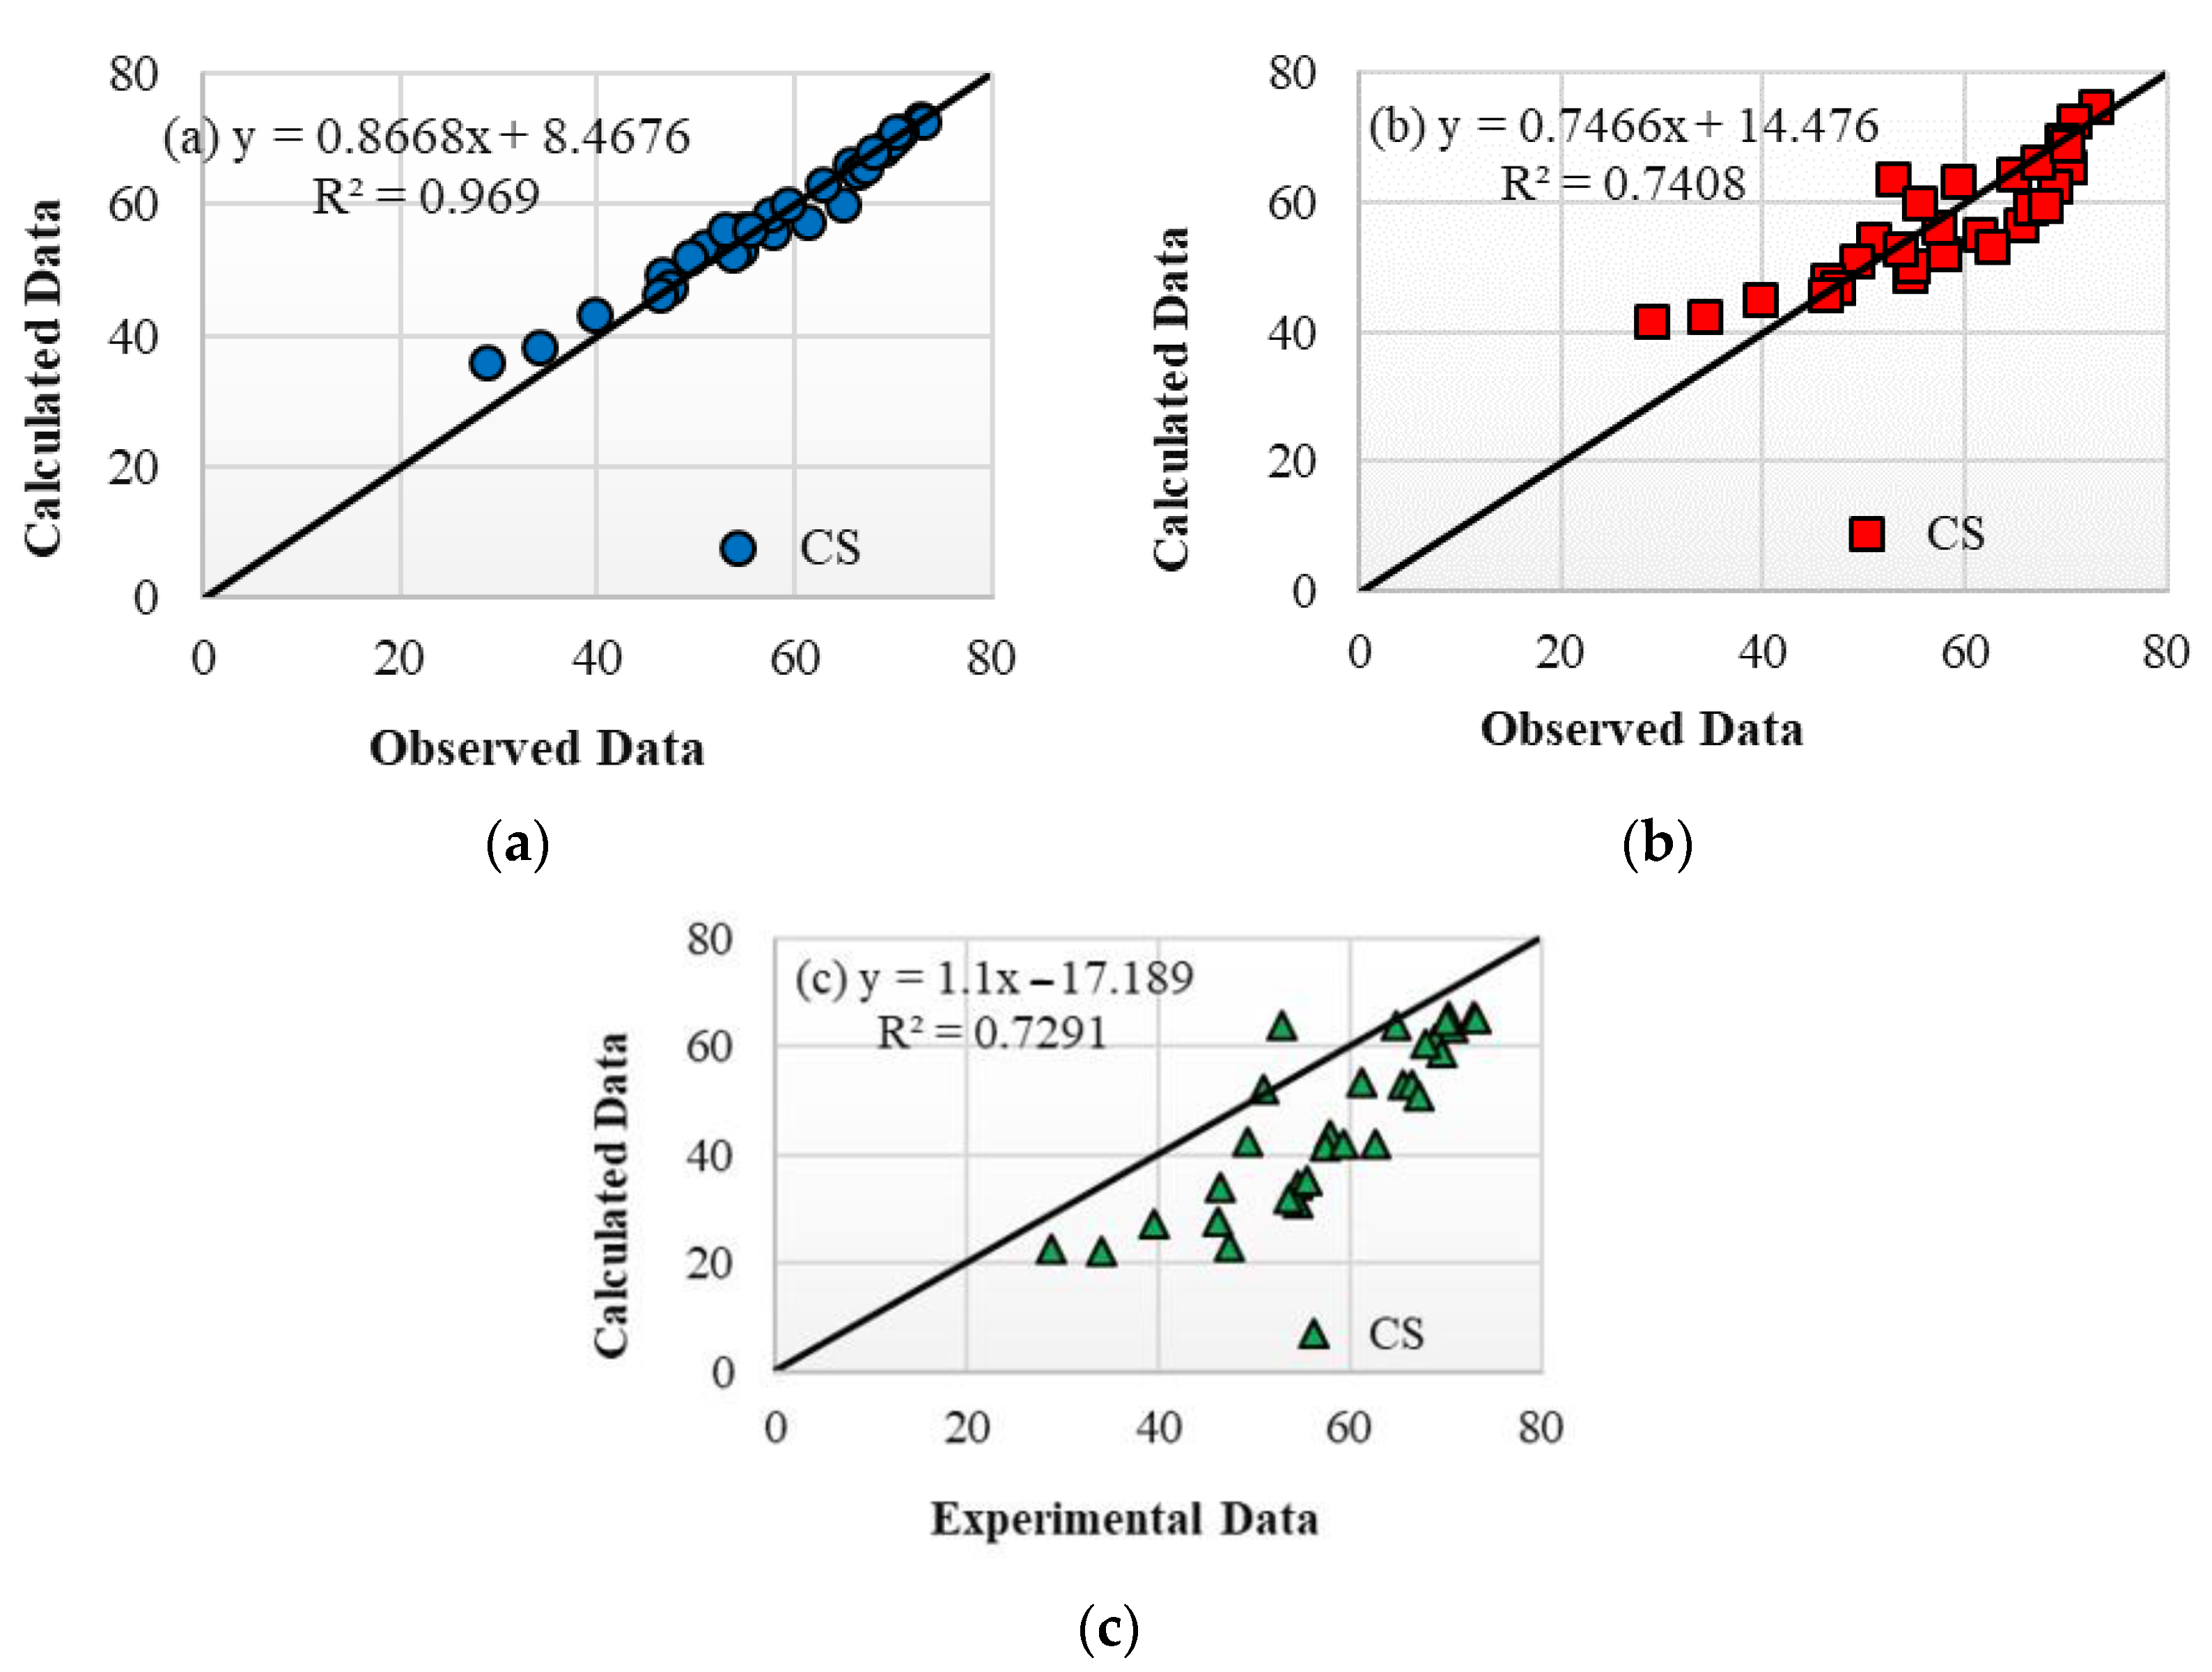
5.4. Bat-ANN Model Validation

To validate the proposed Bat-ANN model, a multiple linear regression (MLR) model and a genetic algorithm combined with an ANN (GA-ANN) were also developed in this study. In the MLR model, two or more independent variables have a major effect on the dependent variable as given by the following equation.
y = f ( x 1 , x 2 , ) y = a 0 + a 1 x 1 + a 2 x 2 +
where y is a dependent variable; x1, x2, … are independent variables; and a1, a2, … are equation coefficients. The following equation shows the most suitable coefficients for the MLR model to estimate the CS of SCGC mixtures:
CS   = 32.18 + 0.0638   GBFS   + 0.2109   Age   0.001   FA
For the second evaluation, a genetic algorithm combined with an ANN (GA-ANN) was developed. Table 7 presents the characteristics of the algorithm. Table 8 shows the statistical metrics resulting from all three informational models. The results demonstrate the reliability of the proposed Bat-ANN optimization model compared to the MLR and GA-ANN models. The results of the Bat optimization, GA-ANN, and MLR models are also depicted in Figure 17 for the output parameter of CS.
Another visual measure that can be considered for comparing the performance of the Bat optimization model against the other informational models is the Taylor diagram (Figure 18). This diagram depicts a graphical illustration of each investigated model’s adequacy based on the root-mean-square-centered difference, the correlation coefficient, and the standard deviation. The results indicate that the closest prediction of CS to the point representing the actual experimental results is the Bat-ANN model proposed in this study. The GA-ANN model resulted in higher values of the root-mean-square-centered difference and standard deviation, indicating a rather lower accuracy of the model in estimating the experimental data compared to the MLR.
Table 9 shows the ultimate weight and bias for both hidden layers obtained using the Bat-ANN model. Weight and bias values of various ANN layers were used to determine and predict the CSs of the proposed SCGCs. Furthermore, these final weights and bias values can be used to design new SCGC mixtures with targeted mechanical properties.

6. Conclusions

This paper evaluated the impacts of different FA contents as partial substitution for GBFS on the structural, morphological, and mechanical (fresh and hardened) properties of some newly developed SCGCs. Furthermore, an optimized hybrid artificial neural network (ANN) coupled with a metaheuristic Bat optimization algorithm was developed to estimate the compressive strength (CS) of SCGC mixtures. The following conclusions were drawn from the results of mechanical, structural, and morphological properties:
  • The results confirmed that partial replacement of GBFS with up to 50% FA as a precursor binder in SCGCs yielded excellent workability and mechanical properties, meeting the EFNARC criteria for SCC.
  • SCGC mixtures made either with high volume of FA or GBFS resulted in high plastic viscosity values. For instance, the plastic viscosity of the mixture was increased from 79 to 86 cP with the increase of FA dosage from 60% to 70%. This increase in the plastic viscosity of mixtures made with high GBFS and FA levels was likely due to their chemical compositions and physical properties.
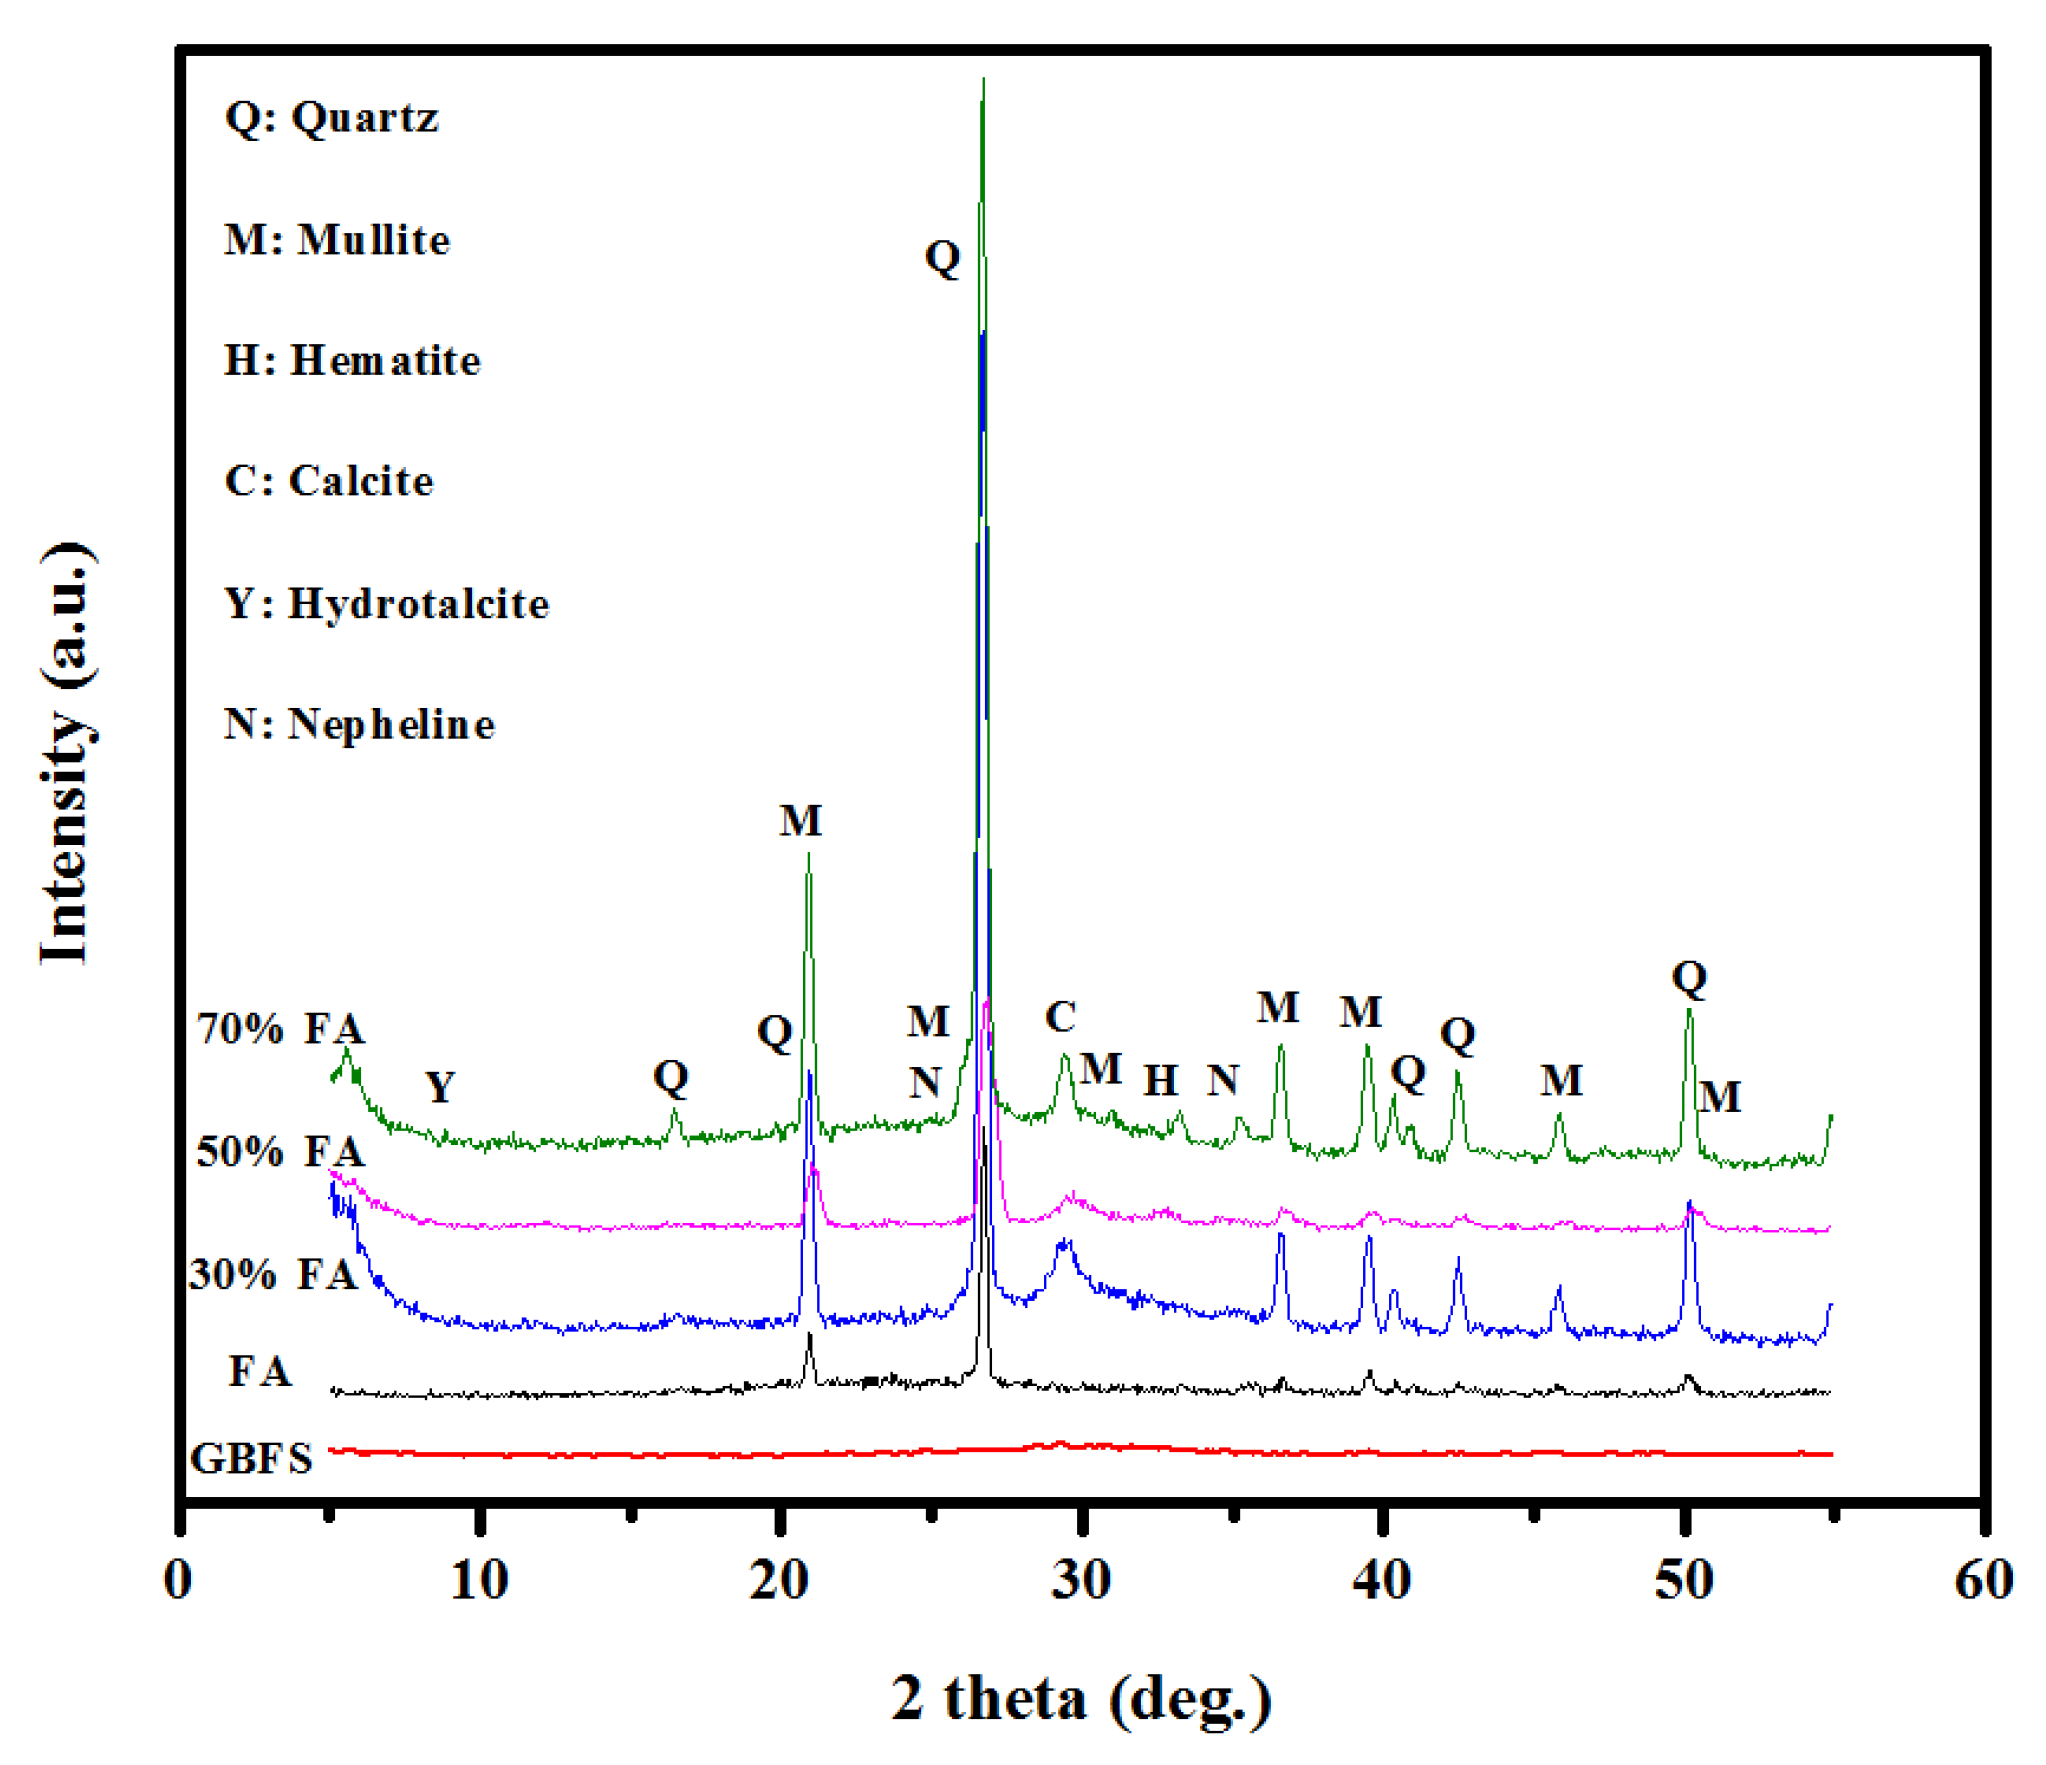
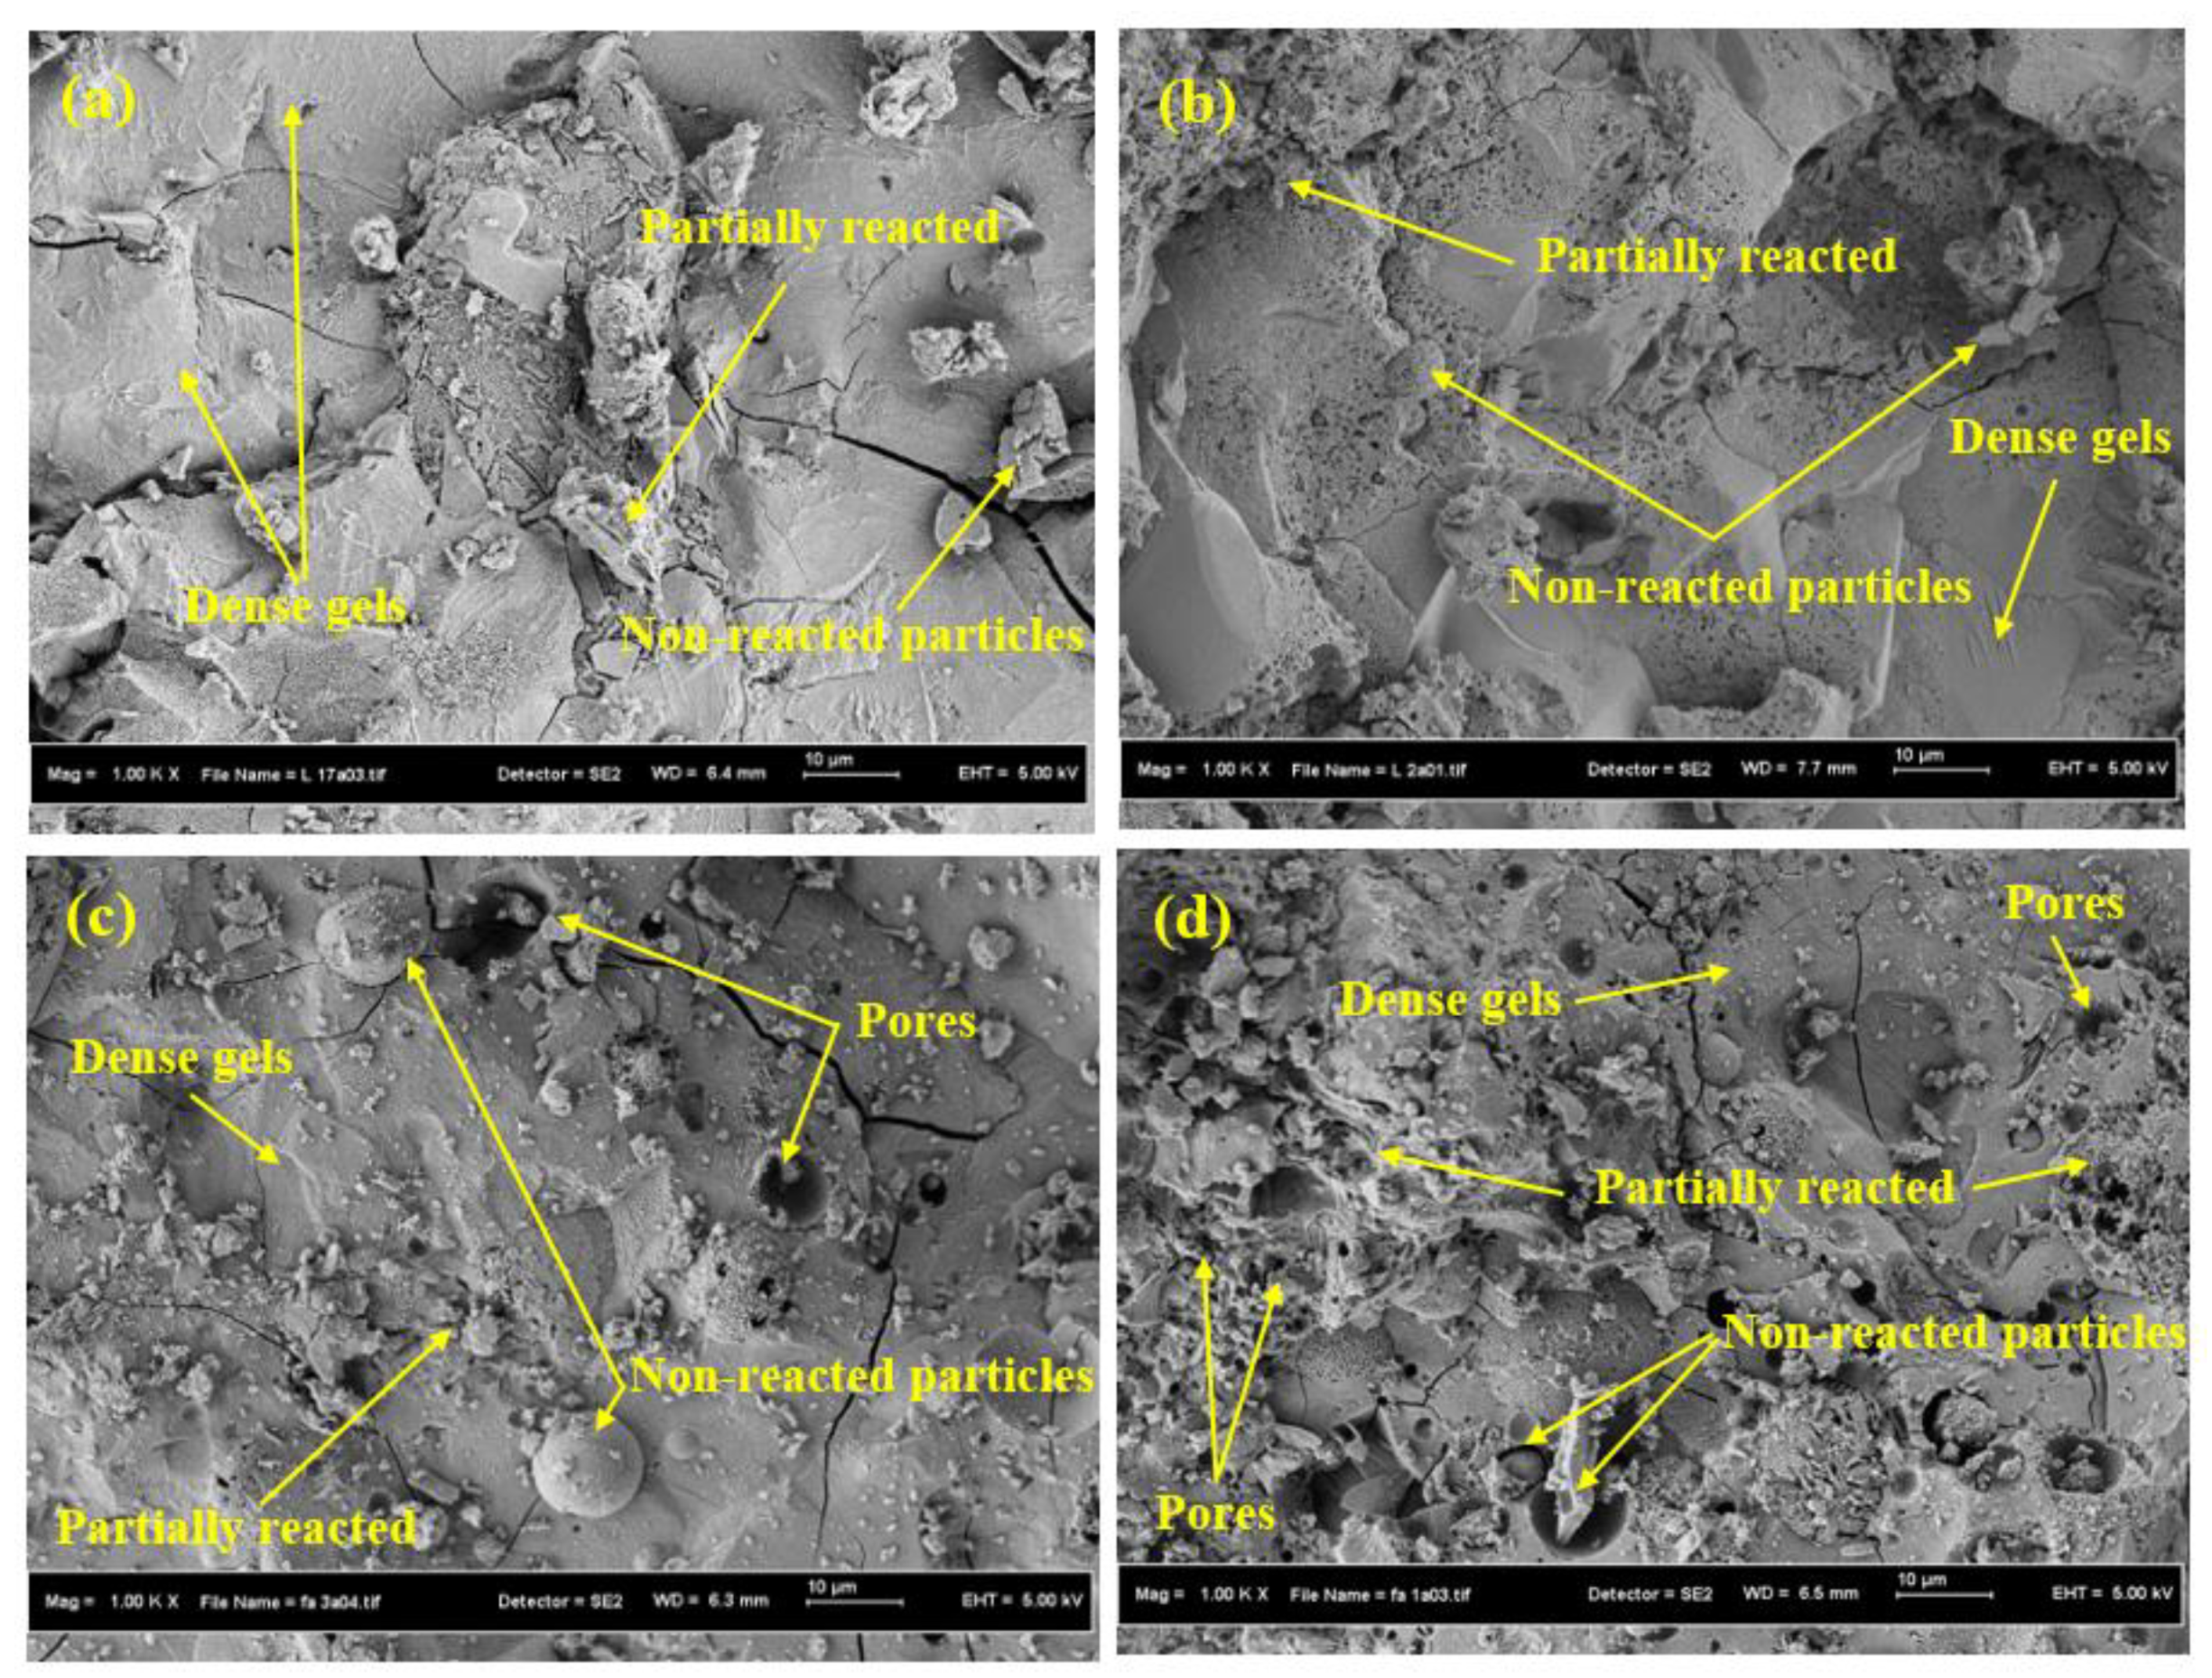
  • The results of microstructural analysis of SCGCs including XRD and SEM showed an improvement in the number of non-reacted particles, cracks, and pores when the FA content was increased as partial substitution for GBFS. This in turn enhanced the porosity and reduced the density as well as the C,N-(A)-S-H gel.
  • SCGC mixtures prepared with up to 50% of FA partial replacement for GBFS can mitigate the disposal cost and environmental footprint of such by-products. Consequently, carbon dioxide emissions can be reduced from the cement production, while eliminating the high energy and natural resource intake in the building sector and contributing to improved development and sustainability.
  • The results confirmed that the proposed informational Bat-ANN model attained the most reliable and robust predictive results for estimating the CS of SCGC mixtures, as confirmed by various statistical metrics revealing its superior accuracy compared to other informational models. Accordingly, such an informational model can reduce the need for costly, time-consuming, and material wasteful trial batches in the laboratory.
  • Aside from the positive environmental impacts, the developed SCGCs also offered a superior product in terms of mechanical properties, which is of great interest to concrete manufacturers. This alternative material for OPC-based self-compacting concrete has far-reaching suitability and may serve to fulfill sustainability goals for companies in the business of ecological construction, especially in precast concrete making.

Author Contributions

Conceptualization: I.F., M.L.N., G.F.H., and H.A.A.; methodology: G.F.H. and H.A.A.; software: H.A.A. and I.F.; formal analysis: G.F.H., H.A.A., I.F., and M.L.N.; data curation: G.F.H.; visualization: H.A.A., I.F., and G.F.H.; writing—original draft preparation: G.F.H. and H.A.A.; writing—review and editing, M.L.N., I.F., and M.H.B.; supervision: A.R.M.S. and M.H.B. All authors have read and agreed to the published version of the manuscript.

Funding

This publication was supported by Universiti Teknologi Malaysia’s Centre of Excellence grants Q.J130000.2409.04G50 and HIR 7.2.

Institutional Review Board Statement

Not applicable.

Informed Consent Statement

Not applicable.

Data Availability Statement

Data is contained within the article.

Conflicts of Interest

The authors declare that they have no known competing financial interests or personal relationships that could have appeared to influence the work reported in this paper.

Abbreviations

SCCSelf-Compacting Concrete
SCGCSelf-compacting geopolymer concrete
GBGeopolymer binder
CSCompressive strength
TSSplitting tensile strength
FSFlexural strength
FAFly ash
GBFSGround blast furnace slag
XRFX-ray fluorescence
XRDX-ray diffraction
SEMScanning electron microscopy
ANNArtificial neural network

References

  1. Long, G.; Gao, Y.; Xie, Y. Designing more sustainable and greener self-compacting concrete. Constr. Build. Mater. 2015, 84, 301–306. [Google Scholar] [CrossRef]
  2. Domone, P. Self-compacting concrete: An analysis of 11 years of case studies. Cem. Concr. Compos. 2006, 28, 197–208. [Google Scholar] [CrossRef]
  3. Huseien, G.F.; Mirza, J.; Ismail, M. Effects of high volume ceramic binders on flexural strength of self-compacting geopolymer concrete. Adv. Sci. Lett. 2018, 24, 4097–4101. [Google Scholar] [CrossRef]
  4. Gülşan, M.E.; Alzeebaree, R.; Rasheed, A.A.; Niş, A.; Kurtoğlu, A.E. Development of fly ash/slag based self-compacting geopolymer concrete using nano-silica and steel fiber. Constr. Build. Mater. 2019, 211, 271–283. [Google Scholar] [CrossRef]
  5. Faridmehr, I.; Nehdi, M.L.; Nikoo, M.; Huseien, G.F.; Ozbakkaloglu, T. Life-Cycle Assessment of Alkali-Activated Materials Incorporating Industrial Byproducts. Materials 2021, 14, 2401. [Google Scholar] [CrossRef]
  6. Samadi, M.; Shah, K.W.; Huseien, G.F.; Lim, N.H.A.S. Influence of glass silica waste nano powder on the mechanical and microstructure properties of alkali-activated mortars. Nanomaterials 2020, 10, 324. [Google Scholar] [CrossRef] [Green Version]
  7. Gupta, P.K.; Khaudhair, Z.A.; Ahuja, A.K. A new method for proportioning recycled concrete. Struct. Concr. 2016, 17, 677–687. [Google Scholar] [CrossRef]
  8. Sivakrishna, A.; Adesina, A.; Awoyera, P.; Kumar, K.R. Green concrete: A review of recent developments. Mater. Today Proc. 2020, 27, 54–58. [Google Scholar] [CrossRef]
  9. Awoyera, P.; Adesina, A.; Sivakrishna, A.; Gobinath, R.; Kumar, K.R.; Srinivas, A. Alkali activated binders: Challenges and opportunities. Mater. Today Proc. 2020, 27, 40–43. [Google Scholar] [CrossRef]
  10. Adesina, A. Performance of fibre reinforced alkali-activated composites—A review. Materialia 2020, 12, 100782. [Google Scholar] [CrossRef]
  11. Juenger, M.; Winnefeld, F.; Provis, J.L.; Ideker, J. Advances in alternative cementitious binders. Cem. Concr. Res. 2011, 41, 1232–1243. [Google Scholar] [CrossRef]
  12. Xu, H.; Provis, J.L.; van Deventer, J.S.; Krivenko, P.V. Characterization of aged slag concretes. ACI Mater. J. 2008, 105, 131. [Google Scholar]
  13. Awoyera, P.; Adesina, A. Durability properties of alkali activated slag composites: Short overview. Silicon 2020, 12, 987–996. [Google Scholar] [CrossRef]
  14. Hassan, A.; Arif, M.; Shariq, M. Use of geopolymer concrete for a cleaner and sustainable environment—A review of mechanical properties and microstructure. J. Clean. Prod. 2019, 223, 704–728. [Google Scholar] [CrossRef]
  15. Pasupathy, K.; Berndt, M.; Sanjayan, J.; Rajeev, P.; Cheema, D.S. Durability performance of precast fly ash–based geopolymer concrete under atmospheric exposure conditions. J. Mater. Civ. Eng. 2018, 30, 04018007. [Google Scholar] [CrossRef]
  16. Amer, I.; Kohail, M.; El-Feky, M.; Rashad, A.; Khalaf, M.A. Characterization of alkali-activated hybrid slag/cement concrete. Ain Shams Eng. J. 2021, 12, 135–144. [Google Scholar] [CrossRef]
  17. Huseien, G.F.; Sam, A.R.M.; Shah, K.W.; Budiea, A.; Mirza, J. Utilizing spend garnets as sand replacement in alkali-activated mortars containing fly ash and GBFS. Constr. Build. Mater. 2019, 225, 132–145. [Google Scholar] [CrossRef]
  18. Tzevelekou, T.; Lampropoulou, P.; Giannakopoulou, P.P.; Rogkala, A.; Koutsovitis, P.; Koukouzas, N.; Petrounias, P. Valorization of Slags Produced by Smelting of Metallurgical Dusts and Lateritic Ore Fines in Manufacturing of Slag Cements. Appl. Sci. 2020, 10, 4670. [Google Scholar] [CrossRef]
  19. Mehta, A.; Siddique, R.; Ozbakkaloglu, T.; Shaikh, F.U.A.; Belarbi, R. Fly ash and ground granulated blast furnace slag-based alkali-activated concrete: Mechanical, transport and microstructural properties. Constr. Build. Mater. 2020, 257, 119548. [Google Scholar] [CrossRef]
  20. Fang, G.; Ho, W.K.; Tu, W.; Zhang, M. Workability and mechanical properties of alkali-activated fly ash-slag concrete cured at ambient temperature. Constr. Build. Mater. 2018, 172, 476–487. [Google Scholar] [CrossRef]
  21. Xuequan, W.; Hong, Z.; Xinkai, H.; Husen, L. Study on steel slag and fly ash composite Portland cement. Cem. Concr. Res. 1999, 29, 1103–1106. [Google Scholar] [CrossRef]
  22. Embong, R.; Kusbiantoro, A.; Shafiq, N.; Nuruddin, M.F. Strength and microstructural properties of fly ash based geopolymer concrete containing high-calcium and water-absorptive aggregate. J. Clean. Prod. 2016, 112, 816–822. [Google Scholar] [CrossRef]
  23. Kubba, Z.; Huseien, G.F.; Sam, A.R.M.; Shah, K.W.; Asaad, M.A.; Ismail, M.; Tahir, M.M.; Mirza, J. Impact of curing temperatures and alkaline activators on compressive strength and porosity of ternary blended geopolymer mortars. Case Stud. Constr. Mater. 2018, 9, e00205. [Google Scholar] [CrossRef]
  24. Atiş, C.; Görür, E.; Karahan, O.; Bilim, C.; İlkentapar, S.; Luga, E. Very high strength (120 MPa) class F fly ash geopolymer mortar activated at different NaOH amount, heat curing temperature and heat curing duration. Constr. Build. Mater. 2015, 96, 673–678. [Google Scholar] [CrossRef]
  25. Leong, H.Y.; Ong, D.E.L.; Sanjayan, J.G.; Nazari, A. The effect of different Na2O and K2O ratios of alkali activator on compressive strength of fly ash based-geopolymer. Constr. Build. Mater. 2016, 106, 500–511. [Google Scholar] [CrossRef] [Green Version]
  26. Huseien, G.F.; Ismail, M.; Mirza, J. Influence of curing methods and sodium silicate content on compressive strength and microstructure of multi blend geopolymer mortars. Adv. Sci. Lett. 2018, 24, 4218–4222. [Google Scholar] [CrossRef]
  27. Safiuddin, M.; West, J.; Soudki, K. Flowing ability of the mortars formulated from self-compacting concretes incorporating rice husk ash. Constr. Build. Mater. 2011, 25, 973–978. [Google Scholar] [CrossRef]
  28. Standard, ASTM. C618-15 Standard Specification for Coal Fly Ash and Raw or Calcined Natural Pozzolan for Use in Concrete; ASTM International: West Conshohocken, PA, USA, 2015. [Google Scholar]
  29. ASTM. C-618 (1993) Standard Specification for Coal Fly Ash and Raw or Calcined Natural Pozzolan for Use as a Mineral Admixture in Concrete; Annual Book of ASTM Standards; ASTM: Philadelphia, PA, USA, 1999. [Google Scholar]
  30. Salih, M.A.; Farzadnia, N.; Ali, A.A.A.; Demirboga, R. Development of high strength alkali activated binder using palm oil fuel ash and GGBS at ambient temperature. Constr. Build. Mater. 2015, 93, 289–300. [Google Scholar] [CrossRef]
  31. EFNARC. Specification and Guidelines for Self-Compacting Concrete; European Federation of Specialist Construction Chemicals and Concrete System: Gamberley, UK, 2002. [Google Scholar]
  32. ASTM International. ASTM D445-12: Standard Test Method for Kinematic Viscosity of Transparent and Opaque Liquids (and Calculation of Dynamic Viscosity); ASTM International: West Conshohocken, PA, USA, 2012. [Google Scholar]
  33. ASTM. Standard Test Methods for Time of Setting of Hydraulic Cement by Vicat Needle. 2008. Available online: https://standards.globalspec.com/std/562203/astm-c191 (accessed on 30 May 2021).
  34. Standard, A. C109/C109M-16a Standard Test Method for Compressive Strength of Hydraulic Cement Mortars (using 2-in. or [50-mm] Cube Specimens); Committee C-1 on Cement, Ed.; ASTM International: West Conshohocken, PA, USA, 2013. [Google Scholar]
  35. ASTM. Standard Test Method for Splitting Tensile Strength of Cylindrical Concrete Specimens. 2011. Available online: https://www.astm.org/Standards/C496 (accessed on 30 May 2021).
  36. Concrete, A.I.C.C.o.; Aggregates, C. Standard Test Method for Flexural Strength of Concrete (using Simple Beam with Center-point Loading); ASTM international: West Conshohocken, PA, USA, 2010. [Google Scholar]
  37. Duan, P.; Yan, C.; Zhou, W.; Luo, W. Fresh properties, mechanical strength and microstructure of fly ash geopolymer paste reinforced with sawdust. Constr. Build. Mater. 2016, 111, 600–610. [Google Scholar] [CrossRef]
  38. Felekoğlu, B.; Türkel, S.; Baradan, B. Effect of water/cement ratio on the fresh and hardened properties of self-compacting concrete. Build. Environ. 2007, 42, 1795–1802. [Google Scholar] [CrossRef]
  39. Boukendakdji, O.; Kenai, S.; Kadri, E.; Rouis, F. Effect of slag on the rheology of fresh self-compacted concrete. Constr. Build. Mater. 2009, 23, 2593–2598. [Google Scholar] [CrossRef]
  40. Belaidi, A.; Azzouz, L.; Kadri, E.; Kenai, S. Effect of natural pozzolana and marble powder on the properties of self-compacting concrete. Constr. Build. Mater. 2012, 31, 251–257. [Google Scholar] [CrossRef]
  41. Diamantonis, N.; Marinos, I.; Katsiotis, M.; Sakellariou, A.; Papathanasiou, A.; Kaloidas, V.; Katsioti, M. Investigations about the influence of fine additives on the viscosity of cement paste for self-compacting concrete. Constr. Build. Mater. 2010, 24, 1518–1522. [Google Scholar] [CrossRef]
  42. Nath, P.; Sarker, P.K. Effect of GGBFS on setting, workability and early strength properties of fly ash geopolymer concrete cured in ambient condition. Constr. Build. Mater. 2014, 66, 163–171. [Google Scholar] [CrossRef] [Green Version]
  43. Yusuf, M.O.; Johari, M.A.M.; Ahmad, Z.A.; Maslehuddin, M. Evolution of alkaline activated ground blast furnace slag–ultrafine palm oil fuel ash based concrete. Mater. Des. 2014, 55, 387–393. [Google Scholar] [CrossRef]
  44. Nath, P.; Sarker, P.K.; Rangan, V.B. Early age properties of low-calcium fly ash geopolymer concrete suitable for ambient curing. Procedia Eng. 2015, 125, 601–607. [Google Scholar] [CrossRef] [Green Version]
  45. Vijai, K.; Kumutha, R.; Vishnuram, B. Effect of types of curing on strength of geopolymer concrete. Int. J. Phys. Sci. 2010, 5, 1419–1423. [Google Scholar]
  46. Kumar, S.; Kumar, R.; Mehrotra, S. Influence of granulated blast furnace slag on the reaction, structure and properties of fly ash based geopolymer. J. Mater. Sci. 2010, 45, 607–615. [Google Scholar] [CrossRef]
  47. Sugama, T.; Brothers, L.; Van de Putte, T. Acid-resistant cements for geothermal wells: Sodium silicate activated slag/fly ash blends. Adv. Cem. Res. 2005, 17, 65–75. [Google Scholar] [CrossRef]
  48. Puligilla, S.; Mondal, P. Role of slag in microstructural development and hardening of fly ash-slag geopolymer. Cem. Concr. Res. 2013, 43, 70–80. [Google Scholar] [CrossRef]
  49. British Standard. Testing hardened concrete. Compressive Strength Test Specim. BS EN 2009, 1, 12390-3. [Google Scholar]
  50. Mozgawa, W.; Deja, J. Spectroscopic studies of alkaline activated slag geopolymers. J. Mol. Struct. 2009, 924, 434–441. [Google Scholar] [CrossRef]
  51. Huseien, G.F.; Sam, A.R.M.; Shah, K.W.; Asaad, M.A.; Tahir, M.M.; Mirza, J. Properties of ceramic tile waste based alkali-activated mortars incorporating GBFS and fly ash. Constr. Build. Mater. 2019, 214, 355–368. [Google Scholar] [CrossRef]
  52. Mohammadhosseini, H.; Lim, N.H.A.S.; Tahir, M.M.; Alyousef, R.; Alabduljabbar, H.; Samadi, M. Enhanced performance of green mortar comprising high volume of ceramic waste in aggressive environments. Constr. Build. Mater. 2019, 212, 607–617. [Google Scholar] [CrossRef]
  53. Huseien, G.F.; Sam, A.R.M.; Mirza, J.; Tahir, M.M.; Asaad, M.A.; Ismail, M.; Shah, K.W. Waste ceramic powder incorporated alkali activated mortars exposed to elevated Temperatures: Performance evaluation. Constr. Build. Mater. 2018, 187, 307–317. [Google Scholar] [CrossRef]
  54. American Concrete Institute. Building Code Requirements for Structural Concrete (ACI 318-14): An ACI Standard: Commentary on Building Code Requirements for Structural Concrete (ACI 318R-14), an ACI Report; American Concrete Institute: Farmington Hills, MI, USA, 2012. [Google Scholar]
  55. Demirboğa, R.; Türkmen, İ.; Karakoc, M.B. Relationship between ultrasonic velocity and compressive strength for high-volume mineral-admixtured concrete. Cem. Concr. Res. 2004, 34, 2329–2336. [Google Scholar] [CrossRef]
  56. Bogas, J.A.; Gomes, M.G.; Gomes, A. Compressive strength evaluation of structural lightweight concrete by non-destructive ultrasonic pulse velocity method. Ultrasonics 2013, 53, 962–972. [Google Scholar] [CrossRef] [PubMed]
  57. Nash’t, I.H.; A’bour, S.H.; Sadoon, A.A. Finding an unified relationship between crushing strength of concrete and non-destructive tests. In Middle East Nondestructive Testing Conference & Exhibition; Citeseer: Manama, Bahrain, 2005. [Google Scholar]
  58. Kubat, M. Neural networks: A comprehensive foundation by Simon Haykin, Macmillan, 1994, ISBN 0-02-352781-7. Knowl. Eng. Rev. 1999, 13, 409–412. [Google Scholar] [CrossRef]
  59. Bishop, C.M. Pattern Recognition and Machine Learning; Springer: Berlin/Heidelberg, Germany, 2006. [Google Scholar]
  60. Awoyera, P.O.; Kirgiz, M.S.; Viloria, A.; Ovallos-Gazabon, D. Estimating strength properties of geopolymer self-compacting concrete using machine learning techniques. J. Mater. Res. Technol. 2020, 9, 9016–9028. [Google Scholar] [CrossRef]
  61. Najimi, M.; Ghafoori, N.; Nikoo, M. Modeling chloride penetration in self-consolidating concrete using artificial neural network combined with artificial bee colony algorithm. J. Build. Eng. 2019, 22, 216–226. [Google Scholar] [CrossRef]
  62. Sadowski, Ł.; Nikoo, M.; Shariq, M.; Joker, E.; Czarnecki, S. The nature-inspired metaheuristic method for predicting the creep strain of green concrete containing ground granulated blast furnace slag. Materials 2019, 12, 293. [Google Scholar] [CrossRef] [PubMed] [Green Version]
  63. Yang, X.S.; Gandomi, A.H. Bat algorithm: A novel approach for global engineering optimization. Eng. Comput. 2012. [Google Scholar] [CrossRef] [Green Version]
Figure 1. Particle size distribution of FA and GBFS.
Sustainability 13 07444 g001
Figure 2. XRD pattern of precursor raw materials including FA and GBFS.
Sustainability 13 07444 g002
Figure 3. SCGSs production steps.
Sustainability 13 07444 g003
Figure 4. Different rheological tests for fresh properties evaluation of SCGCs.
Sustainability 13 07444 g004
Figure 5. Slump flow test for measuring the filling ability of SCGCs.
Sustainability 13 07444 g005
Figure 6. Effect of FA content on CS development of SCGCs.
Sustainability 13 07444 g006
Figure 7. Effect of FA content on FS development of SCGCs.
Sustainability 13 07444 g007
Figure 8. Effect of FA content on TS development of SCGCs.
Sustainability 13 07444 g008
Figure 9. Failure patterns of SCGCs incorporated with 30% FA (a) CS, (b) TS, and (c) FS.
Sustainability 13 07444 g009
Figure 10. XRD patterns of the proposed alkali-activated SCGC mixtures.
Sustainability 13 07444 g010
Figure 11. SEM images of SCGCs incorporated with various FA levels as partial replacement of GBFS: (a) 0%, (b) 30%, (c) 50%, and (d) 70%.
Sustainability 13 07444 g011
Figure 12. Correlation between (a) CS and TS, and (b) CS and FS for SCGCs versus estimated values by ACI 318-14.
Sustainability 13 07444 g012
Figure 13. Comparison between experimental and regression model estimation of CS.
Sustainability 13 07444 g013
Figure 14. Schematic of how bats navigate and hunt using sound.
Sustainability 13 07444 g014
Figure 15. Scatterplot matrix of dataset with correlation.
Sustainability 13 07444 g015
Figure 16. FF-ANN with 3–7–7–1 structure.
Sustainability 13 07444 g016
Figure 17. Experimental versus predicted values of CS obtained from (a) Bat-ANN, (b) MLR, and (c) GA-ANN models.
Sustainability 13 07444 g017
Figure 18. Taylor diagram visualization of model performance in predicting the CS of SCGC mixtures.
Sustainability 13 07444 g018
Table 1. Chemical composition of FA- and GBFS-based geopolymer binder, mass%.
Constituent or PropertyFAGBFS
Silicon oxide (SiO2)57.2030.8
Aluminum oxide (Al2O3)28.810.9
Iron(III) oxide (Fe2O3)3.670.64
Calcium oxide (CaO)5.1651.8
Magnesium oxide (MgO)1.484.57
Potassium oxide (K2O)0.940.36
Sodium oxide (Na2O)0.080.45
Sulfur trioxide (SO3)0.100.06
Loss on ignition (LOI)0.120.22
Table 2. Compositions and labels for the various SCGCs with alkali activation.
Mix CodeBinders, kg/m3Aggregates, kg/m3Alkaline Solution, kg/m3Solution Modulus (Ms)
GBFSFAFineCoarse
MS14840
MS2338.8145.2
MS3290.4193.68447562421.2
MS4242242
MS5193.6290.4
MS6145.2338.8
Table 3. Fresh properties of the studied SCGCs.
Test (Unit)SCGCs Mixture CodeEFNARC Criteria
MS1MS2MS3MS4MS5MS6MinMax
Slump flow (mm)560640695720680630650800
T50 flow (s)6.05.54.03.54.55.525
V-funnel (s)1412.5108.510.513612
L-box ratio (H2/H1)0.780.800.860.920.840.800.801.0
J-ring (mm)1210867.510.5010
Plastic viscosity, cP918274637986--
Initial setting, min61620243238--
Final setting, min102836475866--
Acceptance criteriaNoNoNoYesYesNo--
Table 4. CS and UPV of all studied SCGC mixtures.
Mix DesignUPV (km/s)CS (MPa)
SCAAC14.870.1
SCAAC24.6467.8
SCAAC34.1265.5
SCAAC42.1262.7
SCAAC51.9254.6
SCAAC60.9147.3
Table 5. Statistical parameters for the inputs and outputs.
ParameterUnitTypeMAXMINAverageSTD
GBFS%Input484.0145.2282.3111.6
FA%Input338.80.0201.7111.6
AgeDays Input90.03.036.833.1
CSMPaOutput73.128.858.011.6
Table 6. Properties of the Bat optimization algorithm.
ParameterValueParameterValue
Population size100Max generations200
Loudness0.9Pulse rate0.5
Minimum frequency0Maximum frequency2
Alpha0.99Gamma0.01
Table 7. Characteristics of genetic algorithm combined with ANN (GA-ANN).
ParameterValueParameterValue
Max generations100Crossover (%)50
Recombination (%)15Crossover methodSingle point
Lower bound−1Selection mode1
Upper bound+1Population size150
Table 8. Statistical metrics resulting from the various informational models.
Model Name Bat-ANNMLR GA-ANN
Statistical indexMAE1.784.6112.20
MSE5.9833.72189.53
RMSE2.455.8113.77
AAE0.040.090.22
EF0.960.750.04
VAF967454
Table 9. Ultimate weight and biases of the optimum Bat-ANN model.
IWb1
0.32810.90400.6187 0.3616
0.51180.66890.7581 −1.0025
−0.0444−0.2850−0.2679 −0.1930
−0.77930.81970.5175 −0.8392
−0.0273−0.00391.1754 1.0871
−0.28920.4963−0.3293 −0.1229
−1.0426−0.8094−0.6969 0.2663
LW1b2
0.39320.6504−0.29830.81550.77350.51490.52640.3523
−0.88100.52940.27490.20580.3659−1.0303−0.77820.6929
0.18240.3343−0.5047−1.11570.9182−0.33910.25260.0045
0.3877−1.0380−0.0549−0.76660.9970−0.0396−0.29660.2352
0.4829−0.6795−0.17550.55961.1436−0.2803−0.67860.9843
0.32480.6792−0.50540.0690−0.43070.06360.3974−0.6749
−0.4096−0.40260.59770.36710.19250.6574−0.1048−0.7101
LW2b3
−0.07750.17931.12230.26300.69370.57230.5534−0.2355
IW: weight values for the input layer, LW1: weight values for the first hidden layer; LW2: weight values for the second hidden layer; b1: bias values for the first hidden layer; b2: bias values for the second hidden layer; b3: bias values for the output layer.
Publisher’s Note: MDPI stays neutral with regard to jurisdictional claims in published maps and institutional affiliations.

