Article

A Sustainable and Global Health Perspective of the Dietary Pattern of French Population during the 1998–2015 Period from INCA Surveys

1
INRAE, UNH, Unité de Nutrition Humaine, CRNH Auvergne, Université Clermont Auvergne, F-63000 Clermont-Ferrand, France
2
European Childhood Obesity Group, Clermont Auvergne University, EA 3533, Laboratory of the Metabolic Adaptations to Exercise under Physiological and Pathological Conditions (AME2P), CRNH Auvergne, 63178 Clermont-Ferrand, France
3
Service de Santé Publique, CHU de Clermont-Ferrand, Clermont-Ferrand, Université Clermont Auvergne, CNRS-UMR 6602, Institut Pascal, 63178 Clermont-Ferrand, France
*
Author to whom correspondence should be addressed.
Sustainability 2021, 13(13), 7433; https://doi.org/10.3390/su13137433
Submission received: 26 May 2021 / Revised: 20 June 2021 / Accepted: 29 June 2021 / Published: 2 July 2021
(This article belongs to the Special Issue Sustainable Food Byproduct Valorisation and Consumer Behaviour)

Abstract

:
In France, the evolution of dietary pattern relative to sustainability and global health remains insufficiently studied. The objective of this study was to assess dietary changes during 1998–2015 through three generic metrics potentially related to sustainability. Food consumption data were collected from three French National Individual Study of Food Consumption surveys (INCA) for children (0–17 years) and adults (18–79 years) representative of the French population. The consumed foods were converted into plant (metric 1) and non-ultra-processed (UPF, metric 2) calories, and analyzed in meeting dietary recommended intakes (metric 3). French children and adults consumed high levels of animal and UPF calories, and nutrient deficiencies were observed in adults from the 2015 survey, e.g., fiber, EPA, DHA, magnesium, retinol, and vitamin C. In children, UPF daily calories increased from 42.8 to 45.5% and decreased in adults from 39.2 to 35.0%. In children and adults, diet revegetation was observed. While the level of physical activity decreased, overweight, obesity and type 2 diabetes prevalence increased in French adults. The French dietary pattern is not sustainable for global health unless public health policy is reinforced, with at least a twofold decrease in animal and UPF calories and improved food diversity.

1. Introduction

Western countries, including France, have faced an important nutrition transition for the last seven decades, i.e., after the Second World War, nutrition began to be characterized by a progressive increase in animal and ultra-processed food (UPF) product consumption [1,2,3,4]. This transition is now at work in emerging countries such as Brazil [5], some Southeast Asian countries [6,7], and China [8] and is emerging in developing countries such as those in Africa [9]. Paralleling this transition, a dramatic increase in the prevalence of chronic diseases has been observed in Western countries, progressively replacing that of infectious diseases, but at a higher rate than in low- and middle-income countries [10,11,12]. Thus, in 2016–2017, worldwide deaths from noncommunicable diseases represented 72.3% of all deaths [12,13], for which the three main leading and combined triggering factors were malnutrition (both over- and undernutrition and/or nutritional deficiencies), environmental pollution, and physical inactivity [14]. Dietary risk factors alone would cause nearly 11 million premature deaths worldwide [15]. The increasing consumption of industrialized “empty” calories [16,17,18,19], reflecting a high level of UPF consumption [20], may also be accompanied by the appearance of deficiencies of fiber and micronutrients such as iron [21], iodine [22], magnesium [23], calcium [24], and vitamins B12 [25,26] and D [27]. Moreover, this typical Western diet has been repeatedly reported to be unsustainable for global health, compromising human health [28,29,30,31,32,33,34,35,36,37,38], in addition to environmental issues, animal well-being and biodiversity, socioeconomics, culinary traditions, and the disappearance of small farmers worldwide [39,40,41,42,43,44]. Furthermore, food systems overall contribute to 34% of total greenhouse gas emissions [45].
Previous works have been undertaken to identify quantifiable criteria or model future scenarios to optimize the links between diet and global health [46,47,48,49,50]. Based on published studies related to diets, human health, and food system sustainability, three inductive, generic, and interconnected dimensions were proposed to govern the diet–global health relationship worldwide, leading to the concept of the 3V index that includes the degree of food processing (Vrai/Real foods: 15% maximum UPF calories/day), the plant/animal product ratio (Végétal/Plant foods: 15% maximum animal calories/day), and food diversity (Varié/Varied foods) [40,51]. This generic index represents both qualitative and quantitative holistic metrics regarding human health and food system sustainability. Knowing the evolution of a dietary pattern in a specific population toward these three metrics, therefore, appears to be a simple and relevant tool for evaluating the global health potential of dietary habits over time.
The evolution of the French dietary pattern toward these three indicators remains to be evaluated. This might indeed provide relevant information for national public health strategy aiming at both reducing greenhouse gas emissions and the prevalence of chronic diseases while improving food system sustainability at Horizon 2050, as proposed by scenarios of the French foresight project, Agrimonde-Terra, which includes animal and UPF products as potential drivers [47].
Approximately every seven years, the French Agency for Food, Environmental and Occupational Health and Safety (ANSES) carries out a representative survey (i.e., survey: National Individual Study of Food Consumption (INCA)) of the dietary habits of French people in different age groups [52,53,54]. The three surveys were carried out in 1998–1999, 2006–2007, and 2014–2015 with open and available data regarding food consumption. The main objective of the present study was to evaluate the evolution of the health and sustainable potentials of the French dietary pattern during 1998–2015 based on the newly developed global health-related 3V index. Our second objective was to relate this evolution to overweight/obesity and type 2 diabetes prevalence during the same period. The main conclusion is that the French dietary pattern between 1998 and 2015 was not sustainable and protective against global health, with at least 35% daily animal and UPF calories, and some nutrient deficiencies.

2. Materials and Methods

2.1. Data and Study Population

2.1.1. Data Collection

Data for food consumption (g/day), overweight/obesity prevalence, and level of physical activity by age group were collected from the three INCA reports [55,56,57] (also available at https://www.anses.fr/fr/content/les-%C3%A9tudes-inca (accessed on 18 February 2021)). In 1998–1999, data for overweight/obesity prevalence were lacking in the INCA1 survey and were retrieved from other French national health sources [58,59]. The evolution of type 2 diabetes prevalence (%) in the overall French population (children and adults included) during the 1992–2019 period was assessed from Fosse-Edorh et al. [60], Fagot-Campagna et al. [61], ANAES (Agence nationale d’accréditation et d’évaluation en santé) [62], Fuentes et al. [63], and Santé Publique France [64].

2.1.2. Study Population

The INCA surveys followed a cross-sectional design. INCA populations were sampled to be representative of the French population, e.g., living in mainland France, and followed a multistage stratified random sampling method using the national census database [52,53,54]. Age groups differ between the three INCA surveys. In INCA1 (1998–1999), children are 3–14 years old (n = 1016) and adults 15–75 years old (n = 1423) [57]; in INCA2 (2006–2007), children are 3–17 years old (n = 1444) and adults 18–79 years old (n = 1918) [56]; in INCA3 (2014–2015), children are 1–10 (n = 1035) and 11–17 (n = 949) years old, and adults are 18–79 years old (n = 2121) [55].

2.2. Data Processing for the 3 V Index

The qualitative and quantitative aspects of the 3V index-based metrics have been previously thoroughly described [40,51]. To assess the evolution of plant/animal and non-UPF/UPF calorie consumption during the 1998–2015 period, INCA food categories (g/day) were converted into calories. Except for INCA1 (1998–1999), the calories consumed per day were given in INCA2 and INCA3 for each food category and age group. For INCA1, a median calorie content/100 g was calculated based on the French Ciqual database for each of the 32 INCA1 food categories (Supplementary Materials Table S1) [65]. For this analysis, all as-eaten foods were recorded. For example, in the INCA1 “mixed dishes” category, 145 eaten foods were reported for calorie content, and a median value of 141 kcal/100 g was calculated (Supplementary Materials Table S1). According to food products presented in the Ciqual database, the number of selected foods for each INCA1 category differs. For children in INCA3, the plant, animal, non-UPF, and UPF calorie percentages were averaged for the two age groups, i.e., 1–10 years and 11–17 years.

2.2.1. Metric 1: “Végétal” (Plant-Based Foods)

The percentages of animal and plant calories in each INCA survey and for each food category are presented in Supplementary Tables S1–S3. For combined products containing ingredients of both animal and plant origin, recipes were collected on a French website dedicated to more than 7000 recipes (https://www.marmiton.org/ (accessed on 20 March 2021)) for the preferred food products consumed by the French population. Overall, the three main recipes characteristic of each of the INCA categories were considered and converted into animal and plant calories. In the INCA3 survey, categories are sometimes a combination of previous categories of INCA1 and INCA2. For example, the INCA3 “pasta, rice, wheat, and other grains” category was a combination of the INCA2 “pasta”, “rice and durum or cracked wheat” and “other cereals” categories. In such cases, the number of recipes in INCA3 for a given category was the sum of INCA2 or INCA1 categories, explaining why there was a higher number of selected recipes, i.e., up to 13 (Supplementary Table S3).

2.2.2. Metric 2: “Vrai” (Non-UPF/Real Foods)

The percentage of UPF calories in the INCA1-3 surveys was assessed based on the Siga score according to the degree of processing [66]. First, the percentages of UPFs in each INCA food category were imputed from the UPF percentages in 127 Siga categories (n = 47,358 food products) that were matched with INCA categories (n = 32 categories for INCA1, n = 43 categories for INCA2, and n = 44 categories for INCA3 with the supplemental “infant milk and beverages” category compared to INCA2). However, UPF percentages by Siga category only concerned industrially labeled packaged foods and did not include fresh and bulk foods. Therefore, in a second analysis, we applied a weighting factor to percentages of UPF calories per INCA category based on the percentages of industrial foods consumed among either all foods or each category: (1) for INCA1 in 1998–1999 and INCA2 in 2006–2007, the percentages of consumed industrial foods were not provided in the reports and were therefore evaluated from expenses for industrial foods, i.e., 84% in 2000 and 83% in 2006, respectively [67]; (2) for INCA3 in 2014–2015, we based the weighting on the reported percentages among 12 food categories of homemade dishes, industrial foods, artisanal foods, fast foods and other purchasing places (main INCA3 report, n = 18,857 acts of consumption for the 0–17 age group and n = 15,393 acts of consumption for the 18–79 age group), and on reported consumption frequencies for homemade dishes, industrial foods, artisanal foods, collective catering, fast food and vending machine items for the 31 other food categories (INCA3 supplemental material entitled “Thesaurus/Descriptors”, n = 86,113 acts of consumption) [55].

2.2.3. Metric 3: “Varié” (Varied Foods)

The degree of food diversity was indirectly evaluated from two indicators: (1) the evolution of adequacy in meeting the DRI for free sugar (i.e., sugars from honey, added sugars, and fruit juices), fiber, EPA, DHA, salt, saturated fatty acids, minerals, trace elements and vitamins; (2) the evolution of calorie shares for 15 nutrient-dense food groups representative of food pyramids: bread and dry breadmaking; pasta, rice, and semolina; milk; ultra-fresh dairy; cheeses; eggs and derivatives; meats; poultry and game; fish, crustaceans and mollusks; vegetables (except potatoes); potatoes and their derivatives; legumes; fruits; nuts, seeds, and oleaginous fruits; and offal. The adequacy in meeting nutritional needs was only calculated for adults since, in the 0–17 age group, the DRI evolved from one year to the next. Finally, the adequacy in meeting the DRI in the INCA1 survey has been evaluated by Dubuisson et al. [54], although data are lacking for intake of free sugars, EPA, DHA, salt, magnesium, phosphorus, potassium, manganese, copper, zinc, selenium, iodine, retinol, vitamins B1–B6, vitamin B12, and vitamins D and E.

2.3. Data Analyses

The results were expressed as animal/plant and non-UPF/UPF calorie percentages by INCA food category and summed to obtain the overall plant and non-UPF calories consumed daily in each age group for the three INCA surveys. Nutritional needs were expressed as percentages of the DRI.

3. Results

Between 1998 and 2015, total calorie consumption in the adult population slightly decreased (by 7.5%), while remaining stable for children at approximately 1767 kcal/day (Table 1).

3.1. Adequacy Level in Meeting the 3 V Index

In children (0–17 years), while the level of daily plant calories (metric 1) increased from 55 to 61% between 1998 and 2015 (i.e., an increase of 11%), that of daily non-UPF calories (metric 2) decreased from 57 to 55% (i.e., a decrease of 4.7%) (Table 1). In adults, during the same period, daily plant calories increased from 61% to 65% (i.e., +7.6%), and non-UPFs increased from 61 to 68% (i.e., +6.9%) (Table 1).
Concerning adequacy in meeting the DRI, the percentages of free sugars and saturated fatty acids (as calories) were above the recommended 10% and 12% of total daily calories, respectively (Table 2). In 2015, salt consumption was 167% above the DRI of 5 g/day, and sodium consumption was also at least 156% above the DRI during the 1998–2015 period. Similarly, fiber consumption was 29, 42, and 34% below the DRI for the INCA1, INCA2, and INCA3 surveys, respectively. Concerning micronutrients, phosphorus, potassium, calcium, manganese, iron, selenium, copper, zinc, and vitamins B2, B3, B5, B6, B12, D (80% of vitamin D is supplied by sun exposure) and E met the DRI overall, while this was not the case for magnesium, iodine, retinol, and vitamins B1 and C.
Daily calories from food pyramid-based INCA categories decreased in children by ≈9% and remained stable in adults around 49% (Table 1). Therefore, in contrast to adults, children tended to consume fewer daily food pyramid-based INCA categories between 1998 and 2015 (i.e., −12%), mainly deriving from reduced daily consumption of bread and dry bread making, milk, meats, potatoes and derivatives, cheeses, poultry, and fruits (Table 3). In adults, there was both an increase in plant-derived food groups (e.g., pasta, rice, and semolina, fruits and vegetables) and a decrease in the animal-derived group (e.g., cheeses, meats, and milk) in some INCA categories (Table 3).

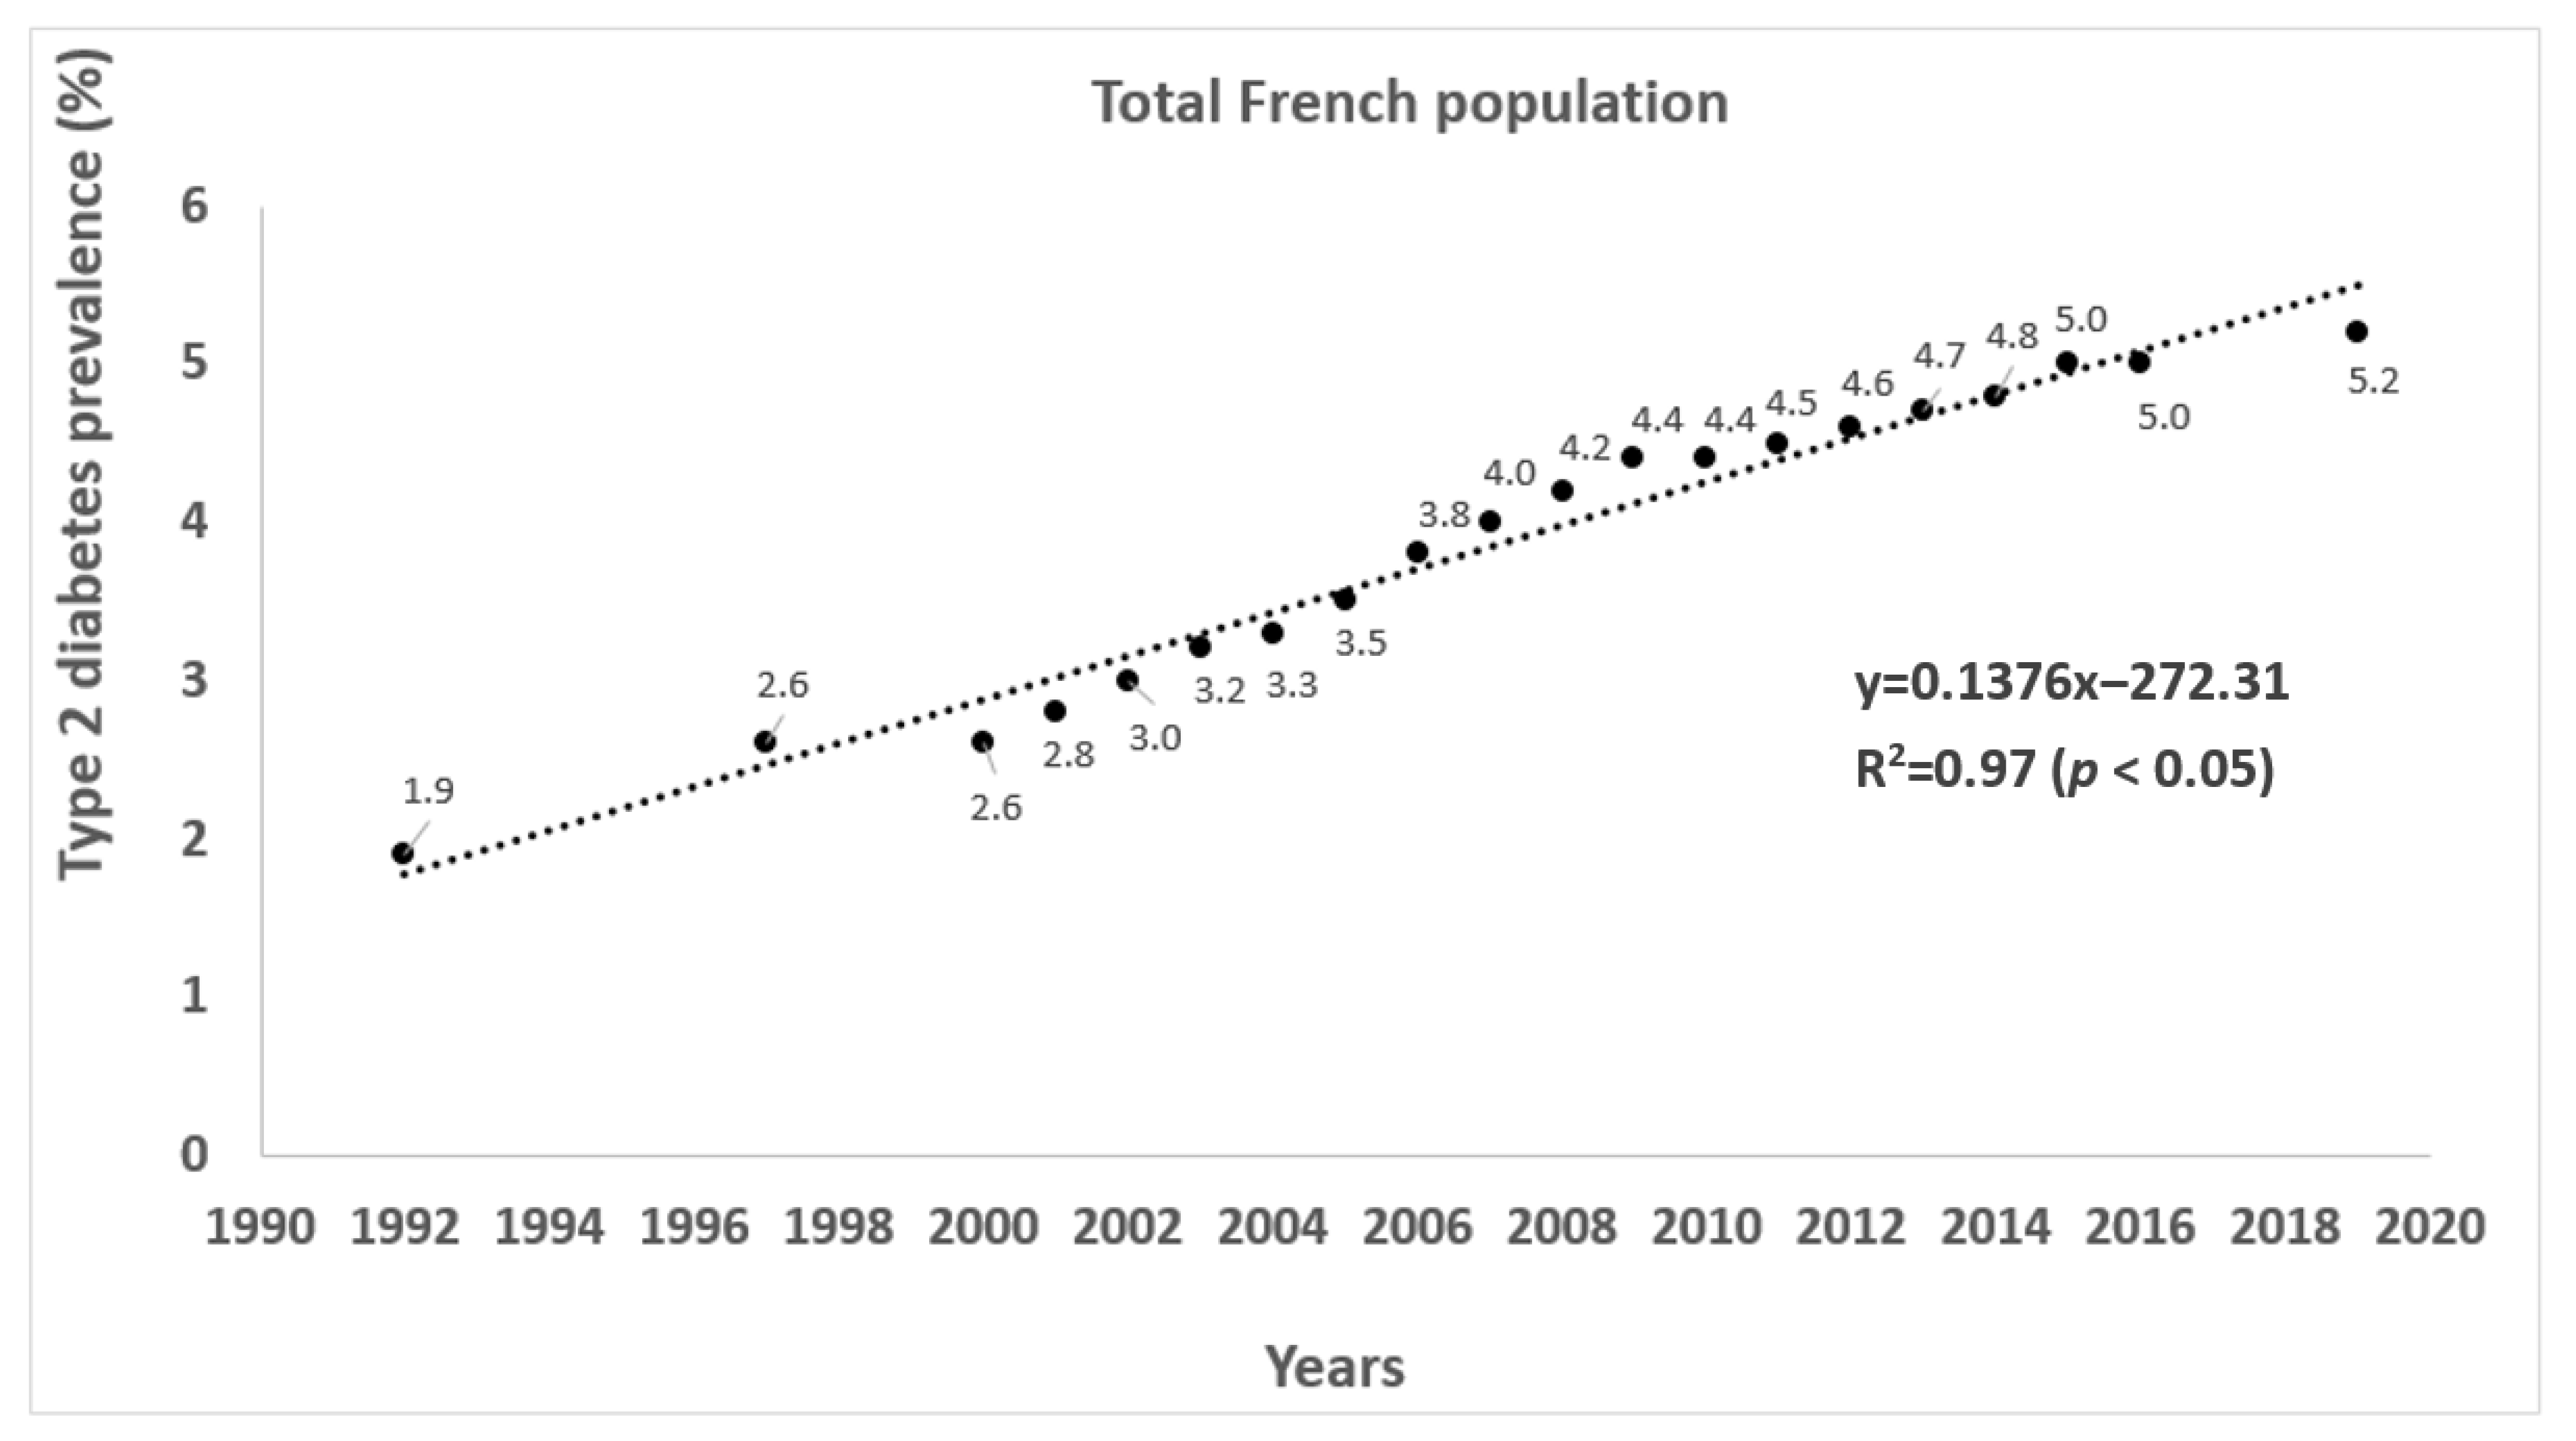
3.2. The Evolution of the Prevalence of Overweight, Obesity, Type 2 Diabetes, and Physical Activity

During 1998–2015, the prevalence of overweight increased in adults from 30 to 51% and was relatively stable for children around 14–17% (Table 1). Concomitantly, the following step of obesity prevalence remained stable in children at approximately 3–4%, whereas it almost doubled in adults from 9 to 17%. Importantly, the percentage of children and adults with a low level of physical activity increased between 2006 and 2015, i.e., from 20 to 38% (i.e., almost doubled) and from 25 to 37%, respectively, and the type 2 diabetes prevalence consistently and linearly increased during 1998–2015, i.e., from 2.6 to 5.0%, which corresponded to an increase of 92% (Figure 1). Finally, in adults between 1998 and 2015, plant and non-UPF calorie shares, a low level of physical activity (%), overweight, obesity, and type 2 diabetes prevalence all increased together. Among children, the non-UPF calorie percentage decreased, while obesity and overweight prevalence remained quite unchanged (Table 1).

4. Discussion

Between 1998 and 2015, daily total caloric consumption either decreased in adults or remained constant in children, which does not appear, at first view, to be in agreement with the regular increase in overweight, obesity, and type 2 diabetes prevalence in adults, suggesting that the quality, rather than the quantity, of calories may be involved. In this study, this has been addressed through the lens of the global health-based 3V index.

4.1. Adequacy in Meeting the 3V Index

The evolution of the French dietary pattern during 1998–2015 first showed progressive revegetation of the plate/meals in both children and adults. In children, the decrease in animal product consumption had already been emphasized in a comparison of the INCA1 and INCA2 surveys [53]. In both children and adults, animal calorie consumption is still above that recommended by the French National Program Nutrition and Health (PNNS), which corresponds to approximately 23–30% of daily calories [40]. For UPF calorie consumption in the last 2015 INCA survey, the level found in adults, i.e., 35%, was close to the data from the French cohort Nutrinet study, i.e., 35.9% UPF calories [68], and that recently found for the same INCA population as in our study, but using the NOVA classification, i.e., 30.6% [69].
Moreover, while children regularly increased their consumption of UPF calories between 1998 and 2015, adults decreased their consumption, especially in 2015, with an 11% lower intake than that of children. Such differences between children and adults were also observed in other countries, such as Canada (55 versus 47%) [70] and Brazil (46–47 versus 26%) [71,72,73]. Higher UPF consumption by children may result from aggressive and efficient targeting of food marketing, as already observed in Argentina [74] and Latin America, where UPF advertising, especially beverages, is poorly regulated [75]. In addition, a Swedish study reported that a “high proportion of UPF advertisements is concerning and is in sharp contrast to the Swedish dietary guidelines that recommend reduced consumption of such foods” (page 1) [76]. Furthermore, this suggests that many UPFs that are available in food markets target young children, probably leading parents to buy these foods to please their children. Despite the poor availability of data regarding the level of UPF purchases in French food markets specifically for children, it has been observed in Norway that, based on sales and barcode data, UPF represented 59% of purchases [77], and in Uruguay, the references to “homemade” and “natural foods” on the labels of UPFs (i.e., a false “health halo”) falsely increase the perception of healthfulness and thus purchase intention [78]. In the USA, it has also been observed that low-income households with children selected UPFs because of their familiarity and long shelf life, two attributes that mitigated the fear of wasting money on foods that may be rejected by children or spoil quickly [79].
Food diversity may be indirectly assessed by the adequacy in meeting the DRI and the calorie shares of fresh or minimally processed food groups that are more nutrient-dense than UPFs. In children, this percentage changed from 47% in 1999 to 42% in 2015, in agreement with the higher consumption of UPFs and more generally, industrial foods, as reported by the INCA3 report [55]. From these observations, it may be hypothesized that if children consume more plant-based foods, they are also probably more ultra-processed. Thus, in France, higher avoidance of animal-based foods was notably recently associated with higher consumption of plant-based UPFs, supplying 33.0%, 32.5%, 37.0%, and 39.5% of the calorie intake for meat eaters, pesco-vegetarians, vegetarians, and vegans, respectively [80]. Within the INCA surveys from 1998 to 2015, together with a relatively high level of low nutritional density UPF consumption, an insufficient DRI adequacy for salt, DHA, EPA, fiber, magnesium, and some vitamins might suggest an insufficient level of food diversity in the French adult population.

4.2. Association with Chronic Disease Prevalence

The high level of animal and UPF calorie consumption and a likely moderate level of food diversity, together with an important increase in low levels of physical activity, might explain the regular increase in overweight, obesity, and type 2 diabetes prevalence in the French adult population despite revegetation of the plate and a slight decrease in UPF consumption, which therefore remains insufficient to prevent these chronic metabolic dysregulations. Paradoxically, in French children, the significant increase in UPF consumption from 1998 to 2015 did not seem to have a significant impact on obesity and overweight prevalence, although there was an increase in the percentage of children with a low level of physical activity from 20 to 38% between 2006 and 2015. An explanation could be that chronic diseases usually appear in adulthood, which may explain why there is no increase in children as regards to overweight/obesity prevalence, indicating that an improvement in the quality of the diet during childhood could result in a decrease in the prevalence of obesity and type 2 diabetes in adults.
These observations in adults are not surprising with regard to previous data about UPF consumption and overweight/obesity prevalence, i.e., a significant association was identified between UPF intake and obesity with a UPF calorie share below those observed in this study [81]. In a previous ecological study in 19 European countries, each percentage point increase in the household availability of UPFs resulted in an increase of 0.25 percentage points in obesity prevalence [82]. In a Brazilian longitudinal study, weight gain and incident overweight or obesity linearly increased between 0.5 and 30% UPF calories and then plateaued [83]. The association between excess animal and UPF calorie consumption and overweight, obesity, and type 2 diabetes prevalence is rather problematic from a public health point of view because these first steps of metabolic dysregulations are well known to increase the risk of more severe chronic diseases such as cardiovascular diseases, and some malnutrition-related cancers [84].
Therefore, the question arises whether a sufficient level of physical activity might prevent the deleterious health impact of UPFs. Notably, in healthy, young Canadian men, it was reported that high-intensity interval training may protect against the effects of an exclusive 14-day fast food diet on the cardiometabolic profile (i.e., lipids, hepatic enzymes, glycated hemoglobin, glucose, insulin, hsC-reactive protein, and blood pressure) [85]. However, it remains unknown whether it is sufficient to prevent the occurrence of chronic disease in the long term when consuming large amounts of fast foods/UPFs. It appears that in American children (i.e., studies of the United States of America National School Lunch and School Breakfast Programs), school diet- and physical activity-related policies, when implemented together, may prevent or treat overweight or obesity [86]. In another cross-sectional Chinese study in adults, individuals with active physical activity levels and an unhealthy diet had a similar risk of a high TG/HDLC ratio to those with inactive physical activity levels and a healthy diet [87], suggesting that further long-term studies are necessary to confirm the benefits of physical exercise as reversing the unfavorable metabolic impacts of unhealthy foods, including UPFs.

4.3. Impact of the French Programme National Nutrition Santé

Since 2001, the French Ministry of Health has implemented the Programme National Nutrition Santé (PNNS), with the main objective of improving the overall health status of the French population, especially to reduce overweight and obesity prevalence, through the main determinant of nutrition [88]. It has been notably based on the promotion of physical activity (“eat–move”, “at least the equivalent of 30 min of brisk walking per day”), the promotion of fruit and vegetable consumption (“five fruits and vegetables per day”), and a reduction in salted, sweet and fatty product consumption. More recently, in the last PNNS4 (2019–2023), the use of a compositional score (“Nutri-score”) has been made mandatory while recommending reducing UPF consumption by 20% by 2023 [89]. At the same time, specific programs on knowledge and practices were applied in French schools (aged 6–18) but with variable intensity according to places and time. Although this study has not been intended to evaluate the impact of the French PNNS, the continuous increase in the prevalence of obesity and type 2 diabetes in adults between 1998 and 2015 indicates a need to strengthen public health policy for physical activity, and with a particular focus on the degree of processing of industrially packaged foods and a stronger reduction in animal-based foods to reach a more sustainable French diet.

4.4. Limitations of the Study

The main limitation of the study is the approximations made for the calculation of the UPF percentages, especially for the INCA1 and INCA2 surveys. The values were based on UPF percentages from Siga categories and applied to the INCA food category. Indeed, it is likely that UPF percentages by category have evolved during 1998–2015. However, in Western countries, it is assumed that UPF sales have sharply risen since the 1980’s to culminate in the 1990’s [90], suggesting that the level of UPF availability has remained quite stable thereafter, as confirmed by a reported compounding annual growth rate close to 0% in France between 2009 and 2019 [1]. The other approximation was the percentages of industrial foods consumed by French people in 2000 and 2006, which were based on expenses, not on the quantity consumed [67]. However, with industrial (energy-dense) foods being generally cheaper than fresh and/or raw foods, these values have been considered to represent the minimum percentage of consumed industrial foods. Taken together, these considerations suggest that the UPF share of French children and adults in 1998–1999 and 2006–2007 might have been slightly underestimated rather than overestimated. The second main limitation is related to the ecological nature of this study that only shows associations and/or correlations, not a causal relationship. However, it has been established that the three main common modifiable risk factors involved in the development of chronic diseases worldwide are unhealthy diet, physical inactivity, and tobacco use [14]. In this study, the first two factors have been considered, suggesting a relevant potential association with the observed increases of overweight/obesity and type 2 diabetes prevalence in France, even if not causality.

5. Conclusions

A high level of daily animal and UPF calorie shares, an insufficient level of food diversity, and an increased level of low physical activity constitute favorable grounds for the increased prevalence of metabolic dysregulations, as has been constantly observed in many Western countries. More generically, it seems that the more a population moves away from the 3V index, particularly if associated with a low level of physical activity, the more the overweight/obesity and type 2 diabetes prevalence increases. In addition, simply meeting the nutrient DRI does not appear sufficient for consuming a healthy diet; the quality of calories also matters. Indeed, while the French adult population slightly decreased its total daily calorie consumption, overweight, obesity, and type 2 diabetes prevalence importantly increased, suggesting that the quality of their calories worsened rather than the quantity. This quality, expressed in the 3V metrics by their origin (i.e., plant versus animal) and degree of processing (non-UPF versus UPF), appears to better explain the diet–health relationship.
Therefore, the French dietary pattern is far from being sustainable, with daily animal and UPF calorie consumption largely above the optimum thresholds of 15% [40], suggesting that French children and adults should decrease their daily animal and UPF calorie consumption by at least twofold in favor of mildly processed plant-based foods to meet healthier and more sustainable food systems.
As regards public health perspectives, to reach sustainable development goals at Horizon 2050, public information and sensitization to UPFs should be reinforced while reducing or suppressing “addictive” UPF-related advertising for children, developing a strong holistic education on global health from schools to universities, offering more local and sustainable programs for minimally processed plant-based food consumption, and taxing UPFs. A future research direction may be to quantify the potential environmental benefit of reducing in the diet animal and UPF calories from 35 to 15%, i.e., at least 20% less, in France.

Supplementary Materials

The following are available online at https://www.mdpi.com/article/10.3390/su13137433/s1, Supplementary Tables S1–S3: Median calorie content and percentages (total, plant, and/or animal) of INCA1–3 food categories based on the French Ciqual food database (accessed on 12 March 2021). NB: the percentage of plant and animal calories of mixed/combined INCA food categories are based on most consumed French food dishes (https://www.marmiton.org/ (accessed on 12 March 2021)).

Author Contributions

Conceptualization, A.F. and E.R.; methodology, A.F.; validation, A.F. and E.R.; formal analysis, A.F.; statistics, A.F. and L.G.; investigation, A.F. and E.R.; resources, A.F.; data curation, A.F.; writing—original draft preparation, A.F. and E.R.; writing—review and editing, A.F., D.T., L.G. and E.R.; visualization, A.F. and L.G.; supervision, A.F. and E.R.; project administration, A.F. All authors have read and agreed to the published version of the manuscript.

Funding

This research received no external funding.

Institutional Review Board Statement

Not applicable.

Informed Consent Statement

Not applicable.

Data Availability Statement

Publicly available datasets from INCA reports were analyzed in this study. These data can be found here: https://www.anses.fr/fr/content/les-%C3%A9tudes-inca (accessed on 20 March 2021). Data from Siga© relative to UPF percentages by INCA food category are available on reasonable request from the corresponding author due to privacy restrictions.

Conflicts of Interest

Since 2017, Anthony Fardet has been a member of the Siga scientific committee. Edmond Rock, David Thivel, and Laurent Gerbaud declare no conflict of interest.

Abbreviations

DHA: docosahexaenoic acid; EPA: eicosapentaenoic acid; INCA: National Individual Study of Food Consumption; UPFs: ultra-processed foods.

References

  1. Baker, P.; Machado, P.; Santos, T.; Sievert, K.; Backholer, K.; Hadjikakou, M.; Russell, C.; Huse, O.; Bell, C.; Scrinis, G.; et al. Ultra-processed foods and the nutrition transition: Global, regional and national trends, food systems transformations and political economy drivers. Obes. Rev. 2020, 21, e13126. [Google Scholar] [CrossRef]
  2. Gouel, C.; Guimbard, H. Nutrition Transition and the Structure of Global Food Demand. Am. J. Agric. Econ. 2018, 386, 2145–2191. [Google Scholar] [CrossRef] [Green Version]
  3. Popkin, B.M. Contemporary nutritional transition: Determinants of diet and its impact on body composition. Proc. Nutr. Soc. 2011, 70, 82–91. [Google Scholar] [CrossRef] [Green Version]
  4. Popkin, B.M. The nutrition transition: An overview of world patterns of change. Nutr. Rev. 2004, 62, S140–S143. [Google Scholar] [CrossRef] [PubMed]
  5. Conde, W.L.; Monteiro, C.A. Nutrition transition and double burden of undernutrition and excess of weight in Brazil. Am. J. Clin. Nutr. 2014, 100, 1617S–1622S. [Google Scholar] [CrossRef] [PubMed]
  6. Sievert, K.; Lawrence, M.; Naika, A.; Baker, P. Processed foods and nutrition transition in the Pacific: Regional trends, patterns and food system drivers. Nutrients 2019, 11, 1328. [Google Scholar] [CrossRef] [PubMed] [Green Version]
  7. Baker, P.; Friel, S. Processed foods and the nutrition transition: Evidence from Asia. Obes. Rev. 2014, 15, 564–577. [Google Scholar] [CrossRef] [Green Version]
  8. Du, S.; Lu, B.; Zhai, F.; Popkin, B.M. Chapter 11—The nutrition transition in China: A new stage of the Chinese diet. In The Nutrition Transition: Diet and Disease in the Developing World; Caballero, B., Popkin, B.C., Eds.; Academic Press: Cambridge, MA, USA, 2020. [Google Scholar]
  9. Reardon, T.; Tschirley, D.; Liverpool-Tasie, L.S.O.; Awokuse, T.; Fanzo, J.; Minten, B.; Vos, R.; Dolislager, M.; Sauer, C.; Dhar, R.; et al. The processed food revolution in African food systems and the double burden of malnutrition. Glob. Food Sec. 2021, 28, 100466. [Google Scholar] [CrossRef] [PubMed]
  10. Mercer, A. Infections, Chronic Disease, and the Epidemiological Transition: A New Perspective; Boydell & Brewer: Suffolk, UK, 2014. [Google Scholar]
  11. Remais, J.V.; Zeng, G.; Li, G.; Tian, L.; Engelgau, M.M. Convergence of non-communicable and infectious diseases in low- and middle-income countries. Int. J. Epidemiol. 2013, 42, 221–227. [Google Scholar] [CrossRef] [PubMed]
  12. Roth, G.A.; Abate, D.; Abate, K.H.; Abay, S.M.; Abbafati, C.; Abbasi, N.; Abbastabar, H.; Abd-Allah, L.; Abdela, J.; Abdelalim, A.; et al. Global, regional, and national age-sex-specific mortality for 282 causes of death in 195 countries and territories, 1980–2017: A systematic analysis for the Global Burden of Disease Study 2017. Lancet 2018, 392, 1736–1788. [Google Scholar] [CrossRef] [Green Version]
  13. Naghavi, M.; Abajobir, A.A.; Abbafati, C.; Abbas, K.M.; Abd-Allah, F.; Abera, S.F.; Aboyans, V.; Adetokunboh, O.; Arnlov, J.; Afshin, A.; et al. Global, regional, and national age-sex specific mortality for 264 causes of death, 1980–2016: A systematic analysis for the Global Burden of Disease Study 2016. Lancet 2017, 390, 1151–1210. [Google Scholar] [CrossRef] [Green Version]
  14. WHO. Facing the Facts #1: Chronic Diseases Are the Major Cause of Death and Disability Worldwide; WHO: Geneva, Switzerland, 2005. [Google Scholar]
  15. Afshin, A.; Sur, P.J.; Fay, K.A.; Cornaby, L.; Ferrara, G.; Salama, J.S.; Mullany, E.C.; Abate, K.H.; Abbafati, C.; Abebe, Z.; et al. Health effects of dietary risks in 195 countries, 1990–2017: A systematic analysis for the Global Burden of Disease Study 2017. Lancet 2019, 393, 1958–1972. [Google Scholar] [CrossRef] [Green Version]
  16. Poti, J.M.; Slining, M.M.; Popkin, B.M. Where Are Kids Getting Their Empty Calories? Stores, Schools, and Fast-Food Restaurants Each Played an Important Role in Empty Calorie Intake among US Children During 2009–2010. J. Acad. Nutr. Diet. 2014, 114, 908–917. [Google Scholar] [CrossRef] [PubMed] [Green Version]
  17. Kirkpatrick, S.I.; Reedy, J.; Krebs-Smith, S.M. Sources of dietary guidance-based food groups and empty calories among the US population in relation to income and race/ethnicity. FASEB J. 2013, 27, 232.1. [Google Scholar] [CrossRef]
  18. Slining, M.M.; Popkin, B.M. Trends in sources of empty calories for 2–18 year olds in the US: 1977–2008. FASEB J. 2012, 26. [Google Scholar] [CrossRef]
  19. Dixon, J. From the imperial to the empty calorie: How nutrition relations underpin food regime transitions. Agric. Hum. Val. 2009, 26, 321–333. [Google Scholar] [CrossRef]
  20. FAO; Monteiro, C.A.; Cannon, G.; Lawrence, M.; Louzada, M.L.d.C.; Machado, P.P. Ultra-Processed Foods, Diet Quality, and Health Using the NOVA Classification System; FAO: Rome, Italy, 2019. [Google Scholar]
  21. McLean, E.; Cogswell, M.; Egli, I.; Wojdyla, D.; de Benoist, B. Worldwide prevalence of anaemia, WHO Vitamin and Mineral Nutrition Information System, 1993–2005. Public Health Nutr. 2009, 12, 444–454. [Google Scholar] [CrossRef] [Green Version]
  22. Zimmermann, M.B.; Andersson, M. Update on iodine status worldwide. Curr. Opin. Endocrinol. Diabetes Obes. 2012, 19, 382–387. [Google Scholar] [CrossRef] [PubMed] [Green Version]
  23. Rosanoff, A.; Weaver, C.M.; Rude, R.K. Suboptimal magnesium status in the United States: Are the health consequences underestimated? Nutr. Rev. 2012, 70, 153–164. [Google Scholar] [CrossRef] [PubMed]
  24. Bailey, R.L.; Dodd, K.W.; Goldman, J.A.; Gahche, J.J.; Dwyer, J.T.; Moshfegh, A.J.; Sempos, C.T.; Picciano, M.F. Estimation of total usual calcium and vitamin D intakes in the United States. J. Nutr. 2010, 140, 817–822. [Google Scholar] [CrossRef] [Green Version]
  25. Pawlak, R.; Lester, S.E.; Babatunde, T. The prevalence of cobalamin deficiency among vegetarians assessed by serum vitamin B12: A review of literature. Eur. J. Clin. Nutr. 2014, 68, 541–548. [Google Scholar] [CrossRef] [PubMed] [Green Version]
  26. Andrès, E.; Loukili, N.H.; Noel, E.; Kaltenbach, G.; Abdelgheni, M.B.; Perrin, A.E.; Noblet-Dick, M.; Maloisel, F.; Schlienger, J.L.; Blicklé, J.F. Vitamin B12 (cobalamin) deficiency in elderly patients. CMAJ 2004, 171, 251–259. [Google Scholar] [CrossRef] [PubMed] [Green Version]
  27. Holick, M.F.; Chen, T.C. Vitamin D deficiency: A worldwide problem with health consequences. Am. J. Clin. Nutr. 2008, 87, 1080S–1086S. [Google Scholar] [CrossRef] [Green Version]
  28. García-Montero, C.; Fraile-Martínez, O.; Gómez-Lahoz, A.M.; Pekarek, L.; Castellanos, A.J.; Noguerales-Fraguas, F.; Coca, S.; Guijarro, L.G.; García-Honduvilla, N.; Asúnsolo, A.; et al. Nutritional components in Western diet versus Mediterranean diet at the gut microbiota–immune system interplay. Implications for health and disease. Nutrients 2021, 13, 699. [Google Scholar] [CrossRef] [PubMed]
  29. Kopp, W. How Western diet and lifestyle drive the pandemic of obesity and civilization diseases. Diabetes Metab. Syndr. Obes. 2019, 12, 2221–2236. [Google Scholar] [CrossRef] [Green Version]
  30. Zinöcker, M.K.; Lindseth, I.A. The Western diet-microbiome-host interaction and its role in metabolic disease. Nutrients 2018, 10, 365. [Google Scholar] [CrossRef] [PubMed] [Green Version]
  31. Shakersain, B.; Santoni, G.; Larsson, S.C.; Faxen-Irving, G.; Fastbom, J.; Fratiglioni, L.; Xu, W. Prudent diet may attenuate the adverse effects of Western diet on cognitive decline. Alzheimers Dement. 2016, 12, 100–109. [Google Scholar] [CrossRef] [Green Version]
  32. Manzel, A.; Muller, D.N.; Hafler, D.A.; Erdman, S.E.; Linker, R.A.; Kleinewietfeld, M. Role of “Western Diet” in Inflammatory Autoimmune Diseases. Curr. Allergy Asthma Rep. 2014, 14, 404. [Google Scholar] [CrossRef] [Green Version]
  33. Oddy, W.H.; Herbison, C.E.; Jacoby, P.; Ambrosini, G.L.; O’Sullivan, T.A.; Ayonrinde, O.T.; Olynyk, J.K.; Black, L.J.; Beilin, L.J.; Mori, T.A.; et al. The Western dietary pattern is prospectively associated with nonalcoholic fatty liver disease in adolescence. Am. J. Gastroenterol. 2013, 108, 778–785. [Google Scholar] [CrossRef] [PubMed] [Green Version]
  34. Carrera-Bastos, P.; Fontes-Villalba, M.; O’Keefe, J.H.; Lindeberg, S.; Cordain, L. The western diet and lifestyle and diseases of civilization. Res. Rep. Clin. Cardiol. 2011, 2011, 15–35. [Google Scholar] [CrossRef] [Green Version]
  35. Castello, A.; de Larrea, N.F.; Martin, V.; Davila-Batista, V.; Boldo, E.; Guevara, M.; Moreno, V.; Castano-Vinyals, G.; Gomez-Acebo, I.; Fernandez-Tardon, G.; et al. High adherence to the Western, Prudent, and Mediterranean dietary patterns and risk of gastric adenocarcinoma: MCC-Spain study. Gastric Cancer 2018, 21, 372–382. [Google Scholar] [CrossRef] [Green Version]
  36. Fabiani, R.; Minelli, L.; Bertarelli, G.; Bacci, S. A Western dietary pattern increases prostate cancer risk: A systematic review and meta-analysis. Nutrients 2016, 8, 626. [Google Scholar] [CrossRef] [PubMed]
  37. Li, T.; Qiu, Y.; Yang, H.S.; Li, M.Y.; Zhuang, X.J.; Zhang, S.H.; Feng, R.; Chen, B.L.; He, Y.; Zeng, Z.R.; et al. Systematic review and meta-analysis: Association of a pre-illness Western dietary pattern with the risk of developing inflammatory bowel disease. J. Digest. Dis. 2020, 21, 362–371. [Google Scholar] [CrossRef] [PubMed]
  38. Alizadeh, S.; Djafarian, K.; Alizadeh, M.; Shab-Bidar, S. The relation of healthy and Western dietary patterns to the risk of endometrial and ovarian cancers: A systematic review and meta-analysis. Int. J. Vitam. Nutr. Res. 2020, 90, 365–375. [Google Scholar] [CrossRef] [PubMed]
  39. Johnston, J.L.; Fanzo, J.C.; Cogill, B. Understanding Sustainable Diets: A Descriptive Analysis of the Determinants and Processes That Influence Diets and Their Impact on Health, Food Security, and Environmental Sustainability. Adv. Nutr. 2014, 5, 418–429. [Google Scholar] [CrossRef] [PubMed] [Green Version]
  40. Fardet, A.; Rock, E. How to protect both health and food system sustainability? A holistic ‘global health’-based approach via the 3V rule proposal. Public Health Nutr. 2020, 23, 3028–3044. [Google Scholar] [CrossRef]
  41. Tilman, D.; Clark, M. Global diets link environmental sustainability and human health. Nature 2014, 515, 518–522. [Google Scholar] [CrossRef]
  42. Fardet, A.; Rock, E. Ultra-processed foods and food system sustainability: What are the links? Sustainability 2020, 12, 6280. [Google Scholar] [CrossRef]
  43. FAO. The State of Food Security and Nutrition in the World 2020; FAO: Roma, Italy, 2020. [Google Scholar]
  44. FAO; WHO. Sustainable Healthy Diets: Guiding Principles; FAO: Roma, Italy, 2019. [Google Scholar]
  45. Crippa, M.; Solazzo, E.; Guizzardi, D.; Monforti-Ferrario, F.; Tubiello, F.N.; Leip, A. Food systems are responsible for a third of global anthropogenic GHG emissions. Nat. Food 2021, 2, 198–209. [Google Scholar] [CrossRef]
  46. Willett, W.; Rockström, J.; Loken, B.; Springmann, M.; Lang, T.; Vermeulen, S.; Garnett, T.; Tilman, D.; DeClerck, F.; Wood, A.; et al. Food in the Anthropocene: The EAT–Lancet Commission on healthy diets from sustainable food systems. Lancet 2019, 393, 2–8. [Google Scholar] [CrossRef]
  47. Mora, O.; Le Mouël, C.; de Lattre-Gasquet, M.; Donnars, C.; Dumas, P.; Réchauchère, O.; Brunelle, T.; Manceron, S.; Marajo-Petitzon, E.; Moreau, C.; et al. Exploring the future of land use and food security: A new set of global scenarios. PLoS ONE 2020, 15, e0235597. [Google Scholar] [CrossRef]
  48. Détang-Dessendre, C.; Guyomard, H.; Réquillart, V.; Soler, L.-G. Changing agricultural systems and food diets to prevent and mitigate global health shocks. Sustainability 2020, 12, 6462. [Google Scholar] [CrossRef]
  49. Aubert, P.-M.; Gardin, B.; Alliot, C. Vers une Transition Juste des Systèmes Alimentaires. Enjeux et Leviers Politiques Pour la France; IDDRI: Paris, France, 2021. [Google Scholar]
  50. Solagro. Afterres2050: Un Scénario Soutenable Pour L’agriculture et L’utilisation des Terres en France à L’horizon 2050; Solagro: Toulouse, France, 2014. [Google Scholar]
  51. Fardet, A.; Rock, E. Reductionist nutrition research has meaning only within the framework of holistic thinking. Adv. Nutr. 2018, 9, 655–670. [Google Scholar] [CrossRef]
  52. Dubuisson, C.; Dufour, A.; Carrillo, S.; Drouillet-Pinard, P.; Havard, S.; Volatier, J.L. The Third French Individual and National Food Consumption (INCA3) Survey 2014–2015: Method, design and participation rate in the framework of a European harmonization process. Public Health Nutr. 2019, 22, 584–600. [Google Scholar] [CrossRef]
  53. Lioret, S.; Dubuisson, C.; Dufour, A.; Touvier, M.; Calamassi-Tran, G.; Maire, B.; Volatier, J.L.; Lafay, L. Trends in food intake in French children from 1999 to 2007: Results from the INCA (étude Individuelle Nationale des Consommations Alimentaires) dietary surveys. Br. J. Nutr. 2010, 103, 585–601. [Google Scholar] [CrossRef] [PubMed] [Green Version]
  54. Dubuisson, C.; Lioret, S.; Touvier, M.; Dufour, A.; Calamassi-Tran, G.; Volatier, J.-L.; Lafay, L. Trends in food and nutritional intakes of French adults from 1999 to 2007: Results from the INCA surveys. Br. J. Nutr. 2009, 103, 1035–1048. [Google Scholar] [CrossRef] [Green Version]
  55. ANSES. Étude Individuelle Nationale des Consommations Alimentaires 3 (INCA 3); ANSES: Maison-Alfort, France, 2017.
  56. ANSES-Afssa. Étude Individuelle Nationale des Consommations Alimentaires 2 (INCA 2) (2006–2007); ANSES-Afssa: Maison-Alfort, France, 2009. [Google Scholar]
  57. Afssa; INPES. Étude Individuelle Nationale des Consommations Alimentaires 1 (INCA 1) (1998–1999); ANSES-Afssa: Maison-Alfort, France, 2000. [Google Scholar]
  58. Haute Autorité de Santé. Surpoids et Obésité de L’adulte: Prise en Charge Médicale de Premier Recours—Recommandations Pour la Pratique Clinique; Haute Autorité de Santé: Saint-Denis La Plaine, France, 2011. [Google Scholar]
  59. Haute Autorité de Santé. Surpoids et Obésité de L’enfant et de L’adolescent (Actualisation des Recommandations 2003)—Argumentaire Scientifique; HAS: Saint-Denis La Plaine, France, 2011; Volume 219. [Google Scholar]
  60. Fosse-Edorh, S.; Mandereau-Bruno, L.; Piffaretti, C. Le poids du Diabète en France en 2016. Synthèse Epidémiologique; Santé Publique France: Saint-Maurice, France, 2018. [Google Scholar]
  61. Fagot-Campagna, A.; Romon, I.; Fosse, S.; Roudier, C. Prévalence et Incidence du Diabète, et Mortalité Liée au Diabète en France—Synthèse Epidémiologique; Institut de Veille Sanitaire: Saint-Maurice, France, 2010. [Google Scholar]
  62. ANAES. Service évaluation des technologies et service évaluation économique. In Principes de Dépistage du Diabète de Type 2; ANAES: Saint-Denis La Plaine, France, 2003. [Google Scholar]
  63. Fuentes, S.; Mandereau-Bruno, L.; Regnault, N.; Bernillon, P.; Bonaldi, C.; Cosson, E.; Fosse-Edorh, S. Is the type 2 diabetes epidemic plateauing in France? A nationwide population-based study. Diabetes Metab. 2020, 46, 472–479. [Google Scholar] [CrossRef] [PubMed]
  64. Santé Publique France. Prévalence et Incidence du Diabète; Santé Publique France: Saint-Maurice, France, 2019. Available online: https://www.santepubliquefrance.fr/maladies-et-traumatismes/diabete/articles/prevalence-et-incidence-du-diabete (accessed on 30 June 2021).
  65. ANSES. Table CIQUAL. Composition Nutritionnelle des Aliments; ANSES: Maison-Alfort, France, 2017.
  66. Davidou, S.; Christodoulou, A.; Fardet, A.; Frank, K. The holistico-reductionist Siga classification according to degree of food processing: An evaluation of ultra-processed foods in French supermarkets. Food Func. 2020, 11, 2026–2039. [Google Scholar] [CrossRef] [PubMed]
  67. Herpin, N.; Verger, D. Consommation et Modes de vie en France. Une Approche Economique et Sociologique Sur un Demi-Siècle; La Découverte: Paris, France, 2008; p. 264. [Google Scholar]
  68. Julia, C.; Martinez, L.; Alles, B.; Touvier, M.; Hercberg, S.; Mejean, C.; Kesse-Guyot, E. Contribution of ultra-processed foods in the diet of adults from the French NutriNet-Sante study. Public Health Nutr. 2018, 21, 27–37. [Google Scholar] [CrossRef] [Green Version]
  69. Salomé, M.; Arrazat, L.; Wang, J.; Dufour, A.; Dubuisson, C.; Volatier, J.-L.; Huneau, J.-F.; Mariotti, F. Contrary to ultra-processed foods, the consumption of unprocessed or minimally processed foods is associated with favorable patterns of protein intake, diet quality and lower cardiometabolic risk in French adults (INCA3). Eur. J. Nutr. 2021. [Google Scholar] [CrossRef]
  70. Moubarac, J.-C.; Cannon, G. Ultra-Processed Foods in Canada: Consumption, Impact on Diet Quality and Policy Implications; Université de Montréal: Montréal, QC, Canada, 2017. [Google Scholar]
  71. Rauber, F.; Campagnolo, P.D.B.; Hoffman, D.J.; Vitolo, M.R. Consumption of ultra-processed food products and its effects on children’s lipid profiles: A longitudinal study. Nutr. Metab. Cardiovasc. Dis. 2015, 25, 116–122. [Google Scholar] [CrossRef] [PubMed]
  72. Canella, D.S.; Levy, R.B.; Martins, A.P.B.; Claro, R.M.; Moubarac, J.C.; Baraldi, L.G.; Cannon, G.; Monteiro, C.A. Ultra-processed food products and obesity in Brazilian households (2008–2009). PLoS ONE 2014, 9, e92752. [Google Scholar] [CrossRef] [PubMed] [Green Version]
  73. Sparrenberger, K.; Friedrich, R.R.; Schiffner, M.D.; Schuch, I.; Wagner, M.B. Ultra-processed food consumption in children from a Basic Health Unit. J. Pediatr. 2015, 91, 535–542. [Google Scholar] [CrossRef] [PubMed] [Green Version]
  74. Allemandi, L.; Castronuovo, L.; Tiscornia, M.V.; Ponce, M.; Schoj, V. Food advertising on Argentinean television: Are ultra-processed foods in the lead? Public Health Nutr. 2017, 21, 238–246. [Google Scholar] [CrossRef] [Green Version]
  75. Mallarino, C.; Gomez, L.F.; Gonzalez-Zapata, L.; Cadena, Y.; Parra, D.C. Advertising of ultra-processed foods and beverages: Children as a vulnerable population. Rev. Saude Publica 2013, 47, 1006–1010. [Google Scholar] [CrossRef] [Green Version]
  76. Fagerberg, P.; Langlet, B.; Oravsky, A.; Sandborg, J.; Löf, M.; Ioakimidis, I. Ultra-processed food advertisements dominate the food advertising landscape in two Stockholm areas with low vs. high socioeconomic status. Is it time for regulatory action? BMC Public Health 2019, 19, 1717. [Google Scholar] [CrossRef] [PubMed]
  77. Solberg, S.L.; Terragni, L.; Granheim, S.I. Ultra-processed food purchases in Norway: A quantitative study on a representative sample of food retailers. Public Health Nutr. 2016, 19, 1990–2001. [Google Scholar] [CrossRef] [Green Version]
  78. Devia, G.; Forli, S.; Vidal, L.; Rosa Curutchet, M.; Ares, G. References to home-made and natural foods on the labels of ultra-processed products increase healthfulness perception and purchase intention: Insights for policy making. Food Qual. Pref. 2020, 104110. [Google Scholar] [CrossRef]
  79. Moran, A.J.; Khandpur, N.; Polacsek, M.; Rimm, E.B. What factors influence ultra-processed food purchases and consumption in households with children? A comparison between participants and non-participants in the Supplemental Nutrition Assistance Program (SNAP). Appetite 2019, 134, 1–8. [Google Scholar] [CrossRef]
  80. Gehring, J.; Touvier, M.; Baudry, J.; Julia, C.; Buscail, C.; Srour, B.; Hercberg, S.; Péneau, S.; Kesse-Guyot, E.; Allès, B. Consumption of ultra-processed foods by pesco-vegetarians, vegetarians, and vegans: Associations with duration and age at diet initiation. J. Nutr. 2020, 151, 120–131. [Google Scholar] [CrossRef] [PubMed]
  81. Askari, M.; Heshmati, J.; Shahinfar, H.; Tripathi, N.; Daneshzad, E. Ultra-processed food and the risk of overweight and obesity: A systematic review and meta-analysis of observational studies. Int. J. Obes. 2020, 2080–2091. [Google Scholar] [CrossRef]
  82. Monteiro, C.A.; Moubarac, J.-C.; Levy, R.B.; Canella, D.S.; Louzada, M.L.d.C.; Cannon, G. Household availability of ultra-processed foods and obesity in nineteen European countries. Public Health Nutr. 2017, 21, 18–26. [Google Scholar] [CrossRef] [Green Version]
  83. Canhada, S.; Luft, V.C.; Giatti, L.; Duncan, B.B.; Chor, D.; Fonseca, M.J.M.; Matos, S.M.; Bisi Molina, M.D.C.; Barreto, S.M.; Bertazzi Levy, R.; et al. Ultra-processed foods, incident overweight and obesity, and longitudinal changes in weight and waist circumference: The Brazilian Longitudinal Study of Adult Health (ELSA-Brasil). Public Health Nutr. 2019, 23, 1076–1086. [Google Scholar] [CrossRef] [Green Version]
  84. Fardet, A.; Boirie, Y. Associations between diet-related diseases and impaired physiological mechanisms: A holistic approach based on meta-analyses to identify targets for preventive nutrition. Nutr. Rev. 2013, 71, 643–656. [Google Scholar] [CrossRef] [PubMed]
  85. Duval, C.; Rouillier, M.-A.; Rabasa-Lhoret, R.; Karelis, A.D. High intensity exercise: Can it protect you from a fast food diet? Nutrients 2017, 9, 943. [Google Scholar] [CrossRef] [PubMed] [Green Version]
  86. Williams, A.J.; Henley, W.E.; Williams, C.A.; Hurst, A.J.; Logan, S.; Wyatt, K.M. Systematic review and meta-analysis of the association between childhood overweight and obesity and primary school diet and physical activity policies. Int. J. Behav. Nutr. Phys. Act. 2013, 10, 101. [Google Scholar] [CrossRef] [Green Version]
  87. Shurong, L.; Jian, S.; Quanyong, X.; Ming, W. Association of dietary pattern and physical activity level with triglyceride to high-density lipoprotein cholesterol ratio among adults in Jiangsu, China: A cross-sectional study with sex-specific differences. Nutr. Res. 2014, 34, 674–681. [Google Scholar]
  88. Castetbon, K.; Lafay, L.; Volatier, J.L.; Escalon, H.; Delamaire, C.; Chauliac, M.; Ledesert, B.; Hercberg, S. The French national nutrition and health program (PNNS): Report of the studies and observed results.Le Programme National Nutrition Sante (PNNS): Bilan des études et résultats observés. Cah. Nutr. Diét. 2011, 46, S11–S25. [Google Scholar] [CrossRef]
  89. Ministère des Solidarités et de la Santé. Programme National Nutrition Santé 2019–2023; Ministère des Solidarités et de la Santé: Paris, France, 2019. [Google Scholar]
  90. Monteiro, C. The big issue is ultra-processing. World Nutr. 2010, 1, 237–269. [Google Scholar]
Figure 1. Evolution of type 2 diabetes prevalence (%) in the French population (children and adults included) during 1992–2019.
Sustainability 13 07433 g001
Table 1. Daily plant and UPF calorie percentages, level of low physical activity, and overweight/obesity prevalence for the three French INCA surveys.
INCA1 (1998–1999)INCA2 (2006–2007)INCA3 (2014–2015)INCA1 (1998–1999)INCA2 (2006–2007)INCA3 (2014–2015)
Children (0–17 1)Adults (18 1–79)
Kcal/day175917771765228521622114
Minimally processed food category calorie (%) 247.242.841.749.448.048.9
Plant calories (%)54.556.261.259.659.764.1
Real food (i.e., non-UPF) calories (%)57.256.854.560.859.865.0
Low level of physical activity (%)- 32038- 32537
Overweight (%)15 4141730 44351
Obesity (%)4 2349 41217
1 Age thresholds vary according to INCA surveys; 2 For 15 nutrient-dense food groups representative of food pyramids, i.e., bread and dry breadmaking; pasta, rice, and semolina; milk; ultra-fresh dairy; cheeses; eggs and derivatives; meats; poultry and game; fish, crustaceans and mollusks; vegetables (except potatoes); potatoes and their derivatives; legumes; fruits; nuts, seeds and oleaginous fruits; and offal; 3 data not available; 4 data from [58].
Table 2. Adequacy in meeting the DRI in the French adult population during 1998–2015.
INCA1INCA2INCA3
NutrientsUnitDRI/Day% DRI
Free sugarsg10% calories max- 11213
Fiber10% kcal30715866
EPAmg250--47
DHAmg250--68
Saltg5--160
SFA12% kcal12% calories max151413
Sodiummg1900168156167
Magnesiummg420-6981
Phosphorusmg700-181177
Potassiummg2000-148155
Calciummg90095102103
Manganesemg3-104111
Ironmg1111911995
Coppermg1-115131
Zincmg8-143127
Seleniummg70-76179
Iodinemg150-8499
Retinolmg750-9463
Vitamin B1mg1-9292
Vitamin B2mg2-106100
Vitamin B3mg17-107118
Vitamin B5mg6-9798
Vitamin B6mg2-9494
Vitamin B9mg330808792
Vitamin B12mg4-145135
Vitamin Cmg110708482
Vitamin Dmg15-1721 2
Vitamin Emg11-11093
1 Data not available; 2 supposedly, 80% of vitamin D is supplied by sun exposure; NB: values in red do not match the DRI. Abbreviations: DHA, docosahexaenoic acid; EPA, eicosapentaenoic acid.
Table 3. Percentages of consumed calories per day from food minimally processed pyramid-based groups in children and the adult French population during 1998–2015 based on the INCA1-3 surveys.
INCA1 (1998–1999)INCA2 (2006–2007)INCA3 (2014–2015)INCA1 (1998–1999)INCA2 (2006–2007)INCA3 (2014–2015)
Children (0–17 1)Adults (18 1–79)
Bread and dry breadmaking10.09.38.715.314.715.4
Milk5.95.03.35.65.14.8
Pasta, rice, and semolina4.84.45.44.74.54.2
Meats4.84.43.73.73.44.1
Potatoes and their derivatives4.33.72.53.53.23.1
Cheeses4.13.53.23.23.33.4
Ultra-fresh dairy3.93.74.43.12.72.2
Poultry and game2.82.02.12.92.93.1
Fruits2.62.02.32.52.01.6
Fish, crustaceans, and mollusks1.41.71.51.62.01.9
Vegetables (except potatoes)1.31.41.61.61.92.6
Eggs and derivatives0.91.01.11.21.21.1
Legumes0.40.41.60.50.40.4
Nuts, seeds, and oleaginous fruits- 20.20.2- 20.50.7
Offal- 20.10.1- 20.20.3
Total47.242.841.749.448.048.9
1 Age thresholds vary according to INCA surveys; 2 data not available from INCA1 survey.
Publisher’s Note: MDPI stays neutral with regard to jurisdictional claims in published maps and institutional affiliations.

