Article

Temporal, Spatial, and Socioeconomic Dynamics in Social Media Thematic Emphases during Typhoon Mangkhut

1
School of Management Science and Engineering, Nanjing University of Information Science & Technology, Nanjing 210044, China
2
Shanghai Engineering Research Center of Finance Intelligence and Institute of Fintech, Shanghai University of Finance and Economics, Shanghai 200434, China
3
Informatics Research Centre, University of Reading, Whiteknights, Reading RG6 6UD, UK
*
Author to whom correspondence should be addressed.
Sustainability 2021, 13(13), 7435; https://doi.org/10.3390/su13137435
Submission received: 1 June 2021 / Revised: 25 June 2021 / Accepted: 29 June 2021 / Published: 2 July 2021

Abstract

:
Disaster-related social media data often consist of several themes, and each theme allows people to understand and communicate from a certain perspective. It is necessary to take into consideration the dynamics of thematic emphases on social media in order to understand the nature of such data and to use them appropriately. This paper proposes a framework to analyze the temporal, spatial, and socioeconomic disparities in thematic emphases on social media during Typhoon Mangkhut. First, the themes were identified through a latent Dirichlet allocation model during Typhoon Mangkhut. Then, we adopted a quantitative method of indexing the themes to represent the dynamics of the thematic emphases. Spearman correlation analyses between the index and eight socioeconomic variables were conducted to identify the socioeconomic disparities in thematic emphases. The main research findings are revealing. From the perspective of time evolution, Theme 1 (general response) and Theme 2 (urban transportation) hold the principal position throughout the disaster. In the early hours of the disaster, Theme 3 (typhoon status and impact) was the most popular theme, but its popularity fell sharply soon after. From the perspective of spatial distribution, people in severely affected areas were more concerned about urban transportation (Theme 2), while people in moderately affected areas were more concerned about typhoon status and impact (Theme 3) and animals and humorous news (Theme 4). The results of the correlation analyses show that there are differences in thematic emphases across disparate socioeconomic groups. Women preferred to post about typhoon status and impact (Theme 3) and animals and humorous news (Theme 4), while people with higher income paid less attention to these two themes during Typhoon Mangkhut. These findings can help government agencies and other stakeholders address public needs effectively and accurately in disaster responses.

1. Introduction

Social media platforms such as Twitter can collect data in a timely and extensive manner, improve situational awareness during disasters, and provide the public with a reliable communication channel when traditional communication methods fail [1]. The information on social media is updated in a highly timely manner, and the networked communication structure of social media platforms can quickly convey disaster situational information to a large audience [2]. Effective analysis, utilization, intervention, and guidance of information diffusion via social media have become important means for improving scientific decision making in emergencies. Access to timely and accurate information is essential to make real-time decisions and to take immediate actions [3]. As a result, social media has emerged as an option in the response to disaster incidents and received extensive attention.
Narratives regarding a disaster often consist of several themes or topics, and each theme or topic allows people to understand and communicate from a certain perspective [4]. Theme evolution can be detected in different stages of a disaster in order to understand the users’ concerns of social media at different stages of a crisis [4,5,6].
However, social media behaviors are known to vary across socioeconomic groups. For example, well-educated people are more inclined to use social media [7]. This prompts the question of whether there are socioeconomic differences in thematic emphases on social media during natural disasters. These thematic differences among disparate groups of the population could lead to biased conclusions if the analysis is not carefully done. Thus, analyzing the temporal and spatial distribution of thematic emphases and their socioeconomic differences among disparate groups of the population is important. These types of studies can help disaster managers customize communication content to fit public needs and maximize the positive communication effects.
The paper aims to examine socioeconomic differences of thematic emphases on social media in disaster using the case of Typhoon Mangkhut. These findings can help government agencies and other stakeholders address public needs effectively and accurately in disaster responses. In this study, we seek to answer three research questions:
  • RQ1: What major themes appear in Sina Weibo texts during a typhoon disaster?
  • RQ2: What is the temporal and spatial distribution of themes?
  • RQ3: Are there any differences in thematic emphases across disparate socioeconomic groups?
We hypothesize that there are socioeconomic disparities of thematic emphases among disparate groups of the population. We employ a research framework based on the latent Dirichlet allocation (LDA) model and statistical analysis, which enable us to analyze the evolution and spatial distribution of each theme and generate an index, i.e., the proportion of each theme. Spearman correlation analyses between the index and the social variables during the disaster are conducted to identify the main social factors affecting the thematic emphases of Sina Weibo users.

2. Literature Review

2.1. Content Analysis on Social Media in Disaster Management

The era of big data and analytics opens up new possibilities for disaster management [8,9] in which the main source of big data is social media. When a disaster occurs, social media users usually generate massive amounts of data on social media such as Sina Weibo, Facebook, and Twitter. These social media data with temporal and spatial attributes have become an important means of understanding public behavior [10]. Managers and researchers can analyze social media data for disaster detection [11,12], situational awareness [13], risk communication [14,15,16,17,18], intelligent decision-making [13], emergency response to public opinions [19,20], and post-disaster damage assessment [21,22,23,24,25].
Social media data are multi-dimensional. Four types of data (i.e., space, time, content, and network) have been given particular attention, as useful information can be discovered from such data and in turn allows people to gain situational awareness and improve disaster response [26]. The amount of content that gets posted on various social media platforms provides a large volume of information that can be used for analytics at various levels [27]. For example, the LDA model for semantic information extraction with spatial and temporal analysis for hot spot detection is used to assess the footprint of and the damage caused by natural disasters [28]. Content analysis is used to track high-frequency foods/beverages mentions during four hurricanes for quantifying dietary patterns on Twitter [29]. Purohit, et al. [30] presented machine-learning methods to automatically identify and match social media needs and offers to substantially accelerate emergency relief efforts. Twitter data including those with the hashtag #4645Boricuas were collected to explore emergent themes within the hashtag [31].
Some studies analyze public opinions on social media from the perspective of theme evolution. Fan et al. [5] proposed a system analytics framework based on social sensing and text mining to detect theme evolution associated with the performance of infrastructure systems in disaster. Zhao et al. [6] attempted to understand social media publics’ changing concerns by analyzing whether and how the publics share messages of different themes and forms in different stages of a crisis. Based on a four-stage model of disaster, Xu et al. [4] found different themes on Twitter in different disaster stages using the case of Hurricane Irma.

2.2. Disparities in Social Media

There are social-geographical disparities in the use of social media. These disparities may cause bias and discrepancies in interpreting social media data, and so many academics and practitioners have warned against the naïve usage of the data [32]. Tweet density is supposedly dependent on the percentage of well-educated people with an advanced degree and a good salary who work in the areas of management, business, science, and arts [7]. Jiang et al. [33] not only identified how the demographic and socioeconomic factors relate to the number of Twitter users, but they also measured and mapped out how the influence of these factors vary across counties.
Existing research also confirms that social-geographical disparities of social media exist during the three phases of emergency management (preparedness, response, and recovery). Communities that are, for example, closer to a wildfire location and had a younger population, higher population density, and higher situational awareness tend to produce more useful information on social media sites [34]. Communities with higher disaster-related Twitter use are generally better off in social and geographical conditions [35]. Physically vulnerable communities have more intense social responses while socially vulnerable groups are digitally left behind in pre-disaster social responses to Hurricane Sandy [36]
Yuan et al. [37] found that White groups act more actively than the Black groups in talking about a hurricane event, and the female-affected citizens are less active than the male-affected citizens on social media during Hurricane Florence. Vulnerable populations use social media less in a disaster. Sociodemographic vulnerability factors reflect more the activity on Twitter during a crisis than infrastructural damage does, and sociodemographic factors negatively influence Twitter activity, which is further amplified in a crisis [38]. Significant associations between social media use and socioeconomic factors, households in rural areas, lower-income groups, and racial minorities are more likely to report greater inaccuracies in social media information [39]. Significant positive correlations are found between Twitter use density and resilience indicators, confirming that communities with higher resilience capacity or those characterized by better social–environmental conditions tend to have higher Twitter use [40].
It is important to note the uneven distribution of social media use in disaster management. Such disparities could have a serious impact on emergency management and disaster resilience [35]. The findings of disparities in social media use can inform emergency managers and public officials to effectively use social media data for resource allocation, action prioritization [41], and public opinion response.

3. Materials and Methods

3.1. Typhoon Mangkhut as a Case Study

Typhoon Mangkhut was the strongest typhoon in the Northwest Pacific in 2018. It made landfall in northern Philippines and then Guangdong, China and caused huge surges as high as 6 m. It also triggered a record storm surge of 2.35 m in Hong Kong, China. Typhoon Mangkhut was reported to affect 7.1 million people; when it landed, the maximum wind force in the center was over grade 17 in the Philippines and China and caused 133 deaths. A total of 900,000 hectares of crops were damaged [42]. Due to the severe impact of Typhoon Mangkhut on Philippines and southern China, it has now been delisted by the Typhoon Committee. Therefore, we chose Typhon Mangkhut as the case study to analyze thematic emphases of natural disaster events on the social media platform Sina Weibo.
At 20:00 on 7 September 2018, Typhon Mangkhut generated on the surface of the Pacific Northwest Ocean and landed on the coast of Guangdong Province, China, at around 17:00 on 16 September. Typhoon Mangkhut was officially announced as dissipated at 20:00 on 17 September.
In mainland China, Typhoon Mangkhut affected Guangdong, Guangxi, Hainan, Fujian, Guizhou, Yunnan, Hunan provinces, among which Guangdong and Guangxi provinces were seriously affected areas. We selected these 7 provinces in mainland China as the study area. Posts of Sina Weibo users in these provincial-level administrative regions were used to identify the temporal and spatial distribution of thematic emphases and in order for us to analyze the socioeconomic differences.

3.2. Sina Weibo Data

In the case study, we chose Sina Weibo as the data source. Sina Weibo is one of the largest social media platforms in China and is a Chinese equivalent to Twitter. According to the 2020 Weibo User Development Report, Sina Weibo has 511 million monthly active users in the month of September 2020.
We crawled data from the time that the typhoon center landed in Guangdong Province, China (5:00 p.m. on 16 September 2018) to the time that Typhoon Mangkhut dissipated (at 8:00 p.m. on 17 September). The time window was divided into one-hour intervals so that we can prepare for the evolution of themes. In terms of spatial areas, since Sina Weibo is basically used in mainland China, 7 disaster-affected provinces in mainland China were selected as research objects, excluding Hong Kong, Macao, and Taiwan.
The data were collected by a comprehensive strategy of keywords and locations, using the advanced search function of Sina Weibo. Sina Weibo’s advanced search function allows users to search for posts by time, location, and keyword. The search keyword we set was the phrase “tai feng shan zhu” (“台风山竹”), while the geographical location was limited to 7 disaster-affected provinces in mainland China, and the crawling interval was set to every hour. In this way, we retrieved posts about Typhoon Mangkhut from Sina Weibo users in 7 disaster-affected provinces per hour. The crawler was written in Python language. The crawled content included: user ID, publishing time, the content, the URL, and provincial administrative area.
The users of Sina Weibo include individuals and governments, companies, media, and other organizations. Since this paper focuses on public concerns, we further distinguished individual’s posts from those of organizations. Individual authentication accounts on Sina Weibo are marked in the orange logo, and non-individual users (institutions, enterprises, media, etc.) are marked in the blue logo. We observed that many ordinary individuals are usually not authenticated. In this way, we regarded users with either the orange logo or no authentication as individual users. We crawled the user’s personal information and selected those whose certified type is personal authentication or no authentication. Subsequently, duplications and irrelevant information were removed through information cleansing. After information cleansing on Sina Weibo data, a total of 19,807 Sina Weibo posts were obtained for our analysis in this article, involving 17,394 individual users.

3.3. Socioeconomic Data

In addition to Sina Weibo data, we collected 8 socioeconomic variables (Table 1). The selection of these variables was based on three reasons. Firstly, these variables represented the socioeconomic condition of a region; thus, they can be used to test the hypothesis that there are socioeconomic disparities of thematic emphases among disparate groups of the population. In Table 1, the variables DependencyRatio and PctYoung express the proportion of young people in the region from different angles; the variable Education expresses the education level of the people; the variables Income and Mobilephone express the wealth of the region; the variable Unemploy expresses the unemployment rate; the variable FemaleRatio expresses the proportion of women; and the variable PopDensity expresses the population density. The socioeconomic data came from the official website of the China Statistics Bureau (see http://www.stats.gov.cn/ (accessed on June 7, 2020)). Secondly, as related to disaster resilience, the same or similar set of 7 socioeconomic variables (except female ratio) were selected in two previous studies, i.e., [26,27], so the results can be compared to previous studies. The reason why we did not choose the same variables is that due to different national conditions, some variables were more difficult to find with the corresponding data in mainland China, and so we used similar variables instead. Thirdly, we added a female ratio to this study to identify gender differences in thematic emphases.
The total dependency ratio, disposable income, unemployment rate, and other related variables in Table 1 are all defined according to official national statistics. P 0 14 is the population of children aged 0–14 years; P 65 + is the population of elderly people aged 65 and over; and P 15 64 is the population of working-age people aged 15–64 years.
From a socioeconomic perspective, the percentage of the population with a bachelor or a higher degree, the disposable income per capita, and percentage of mobile Internet users are common indicators of high socioeconomic conditions. The percentage of young population and population density are considered positive indicators of community resilience [27], while the total dependency ratio and the percentage of the unemployed workforce are considered negative indicators of community resilience. The female ratio is an important indicator reflecting the gender ratio, which we used to identify the gender differences in thematic emphasis.

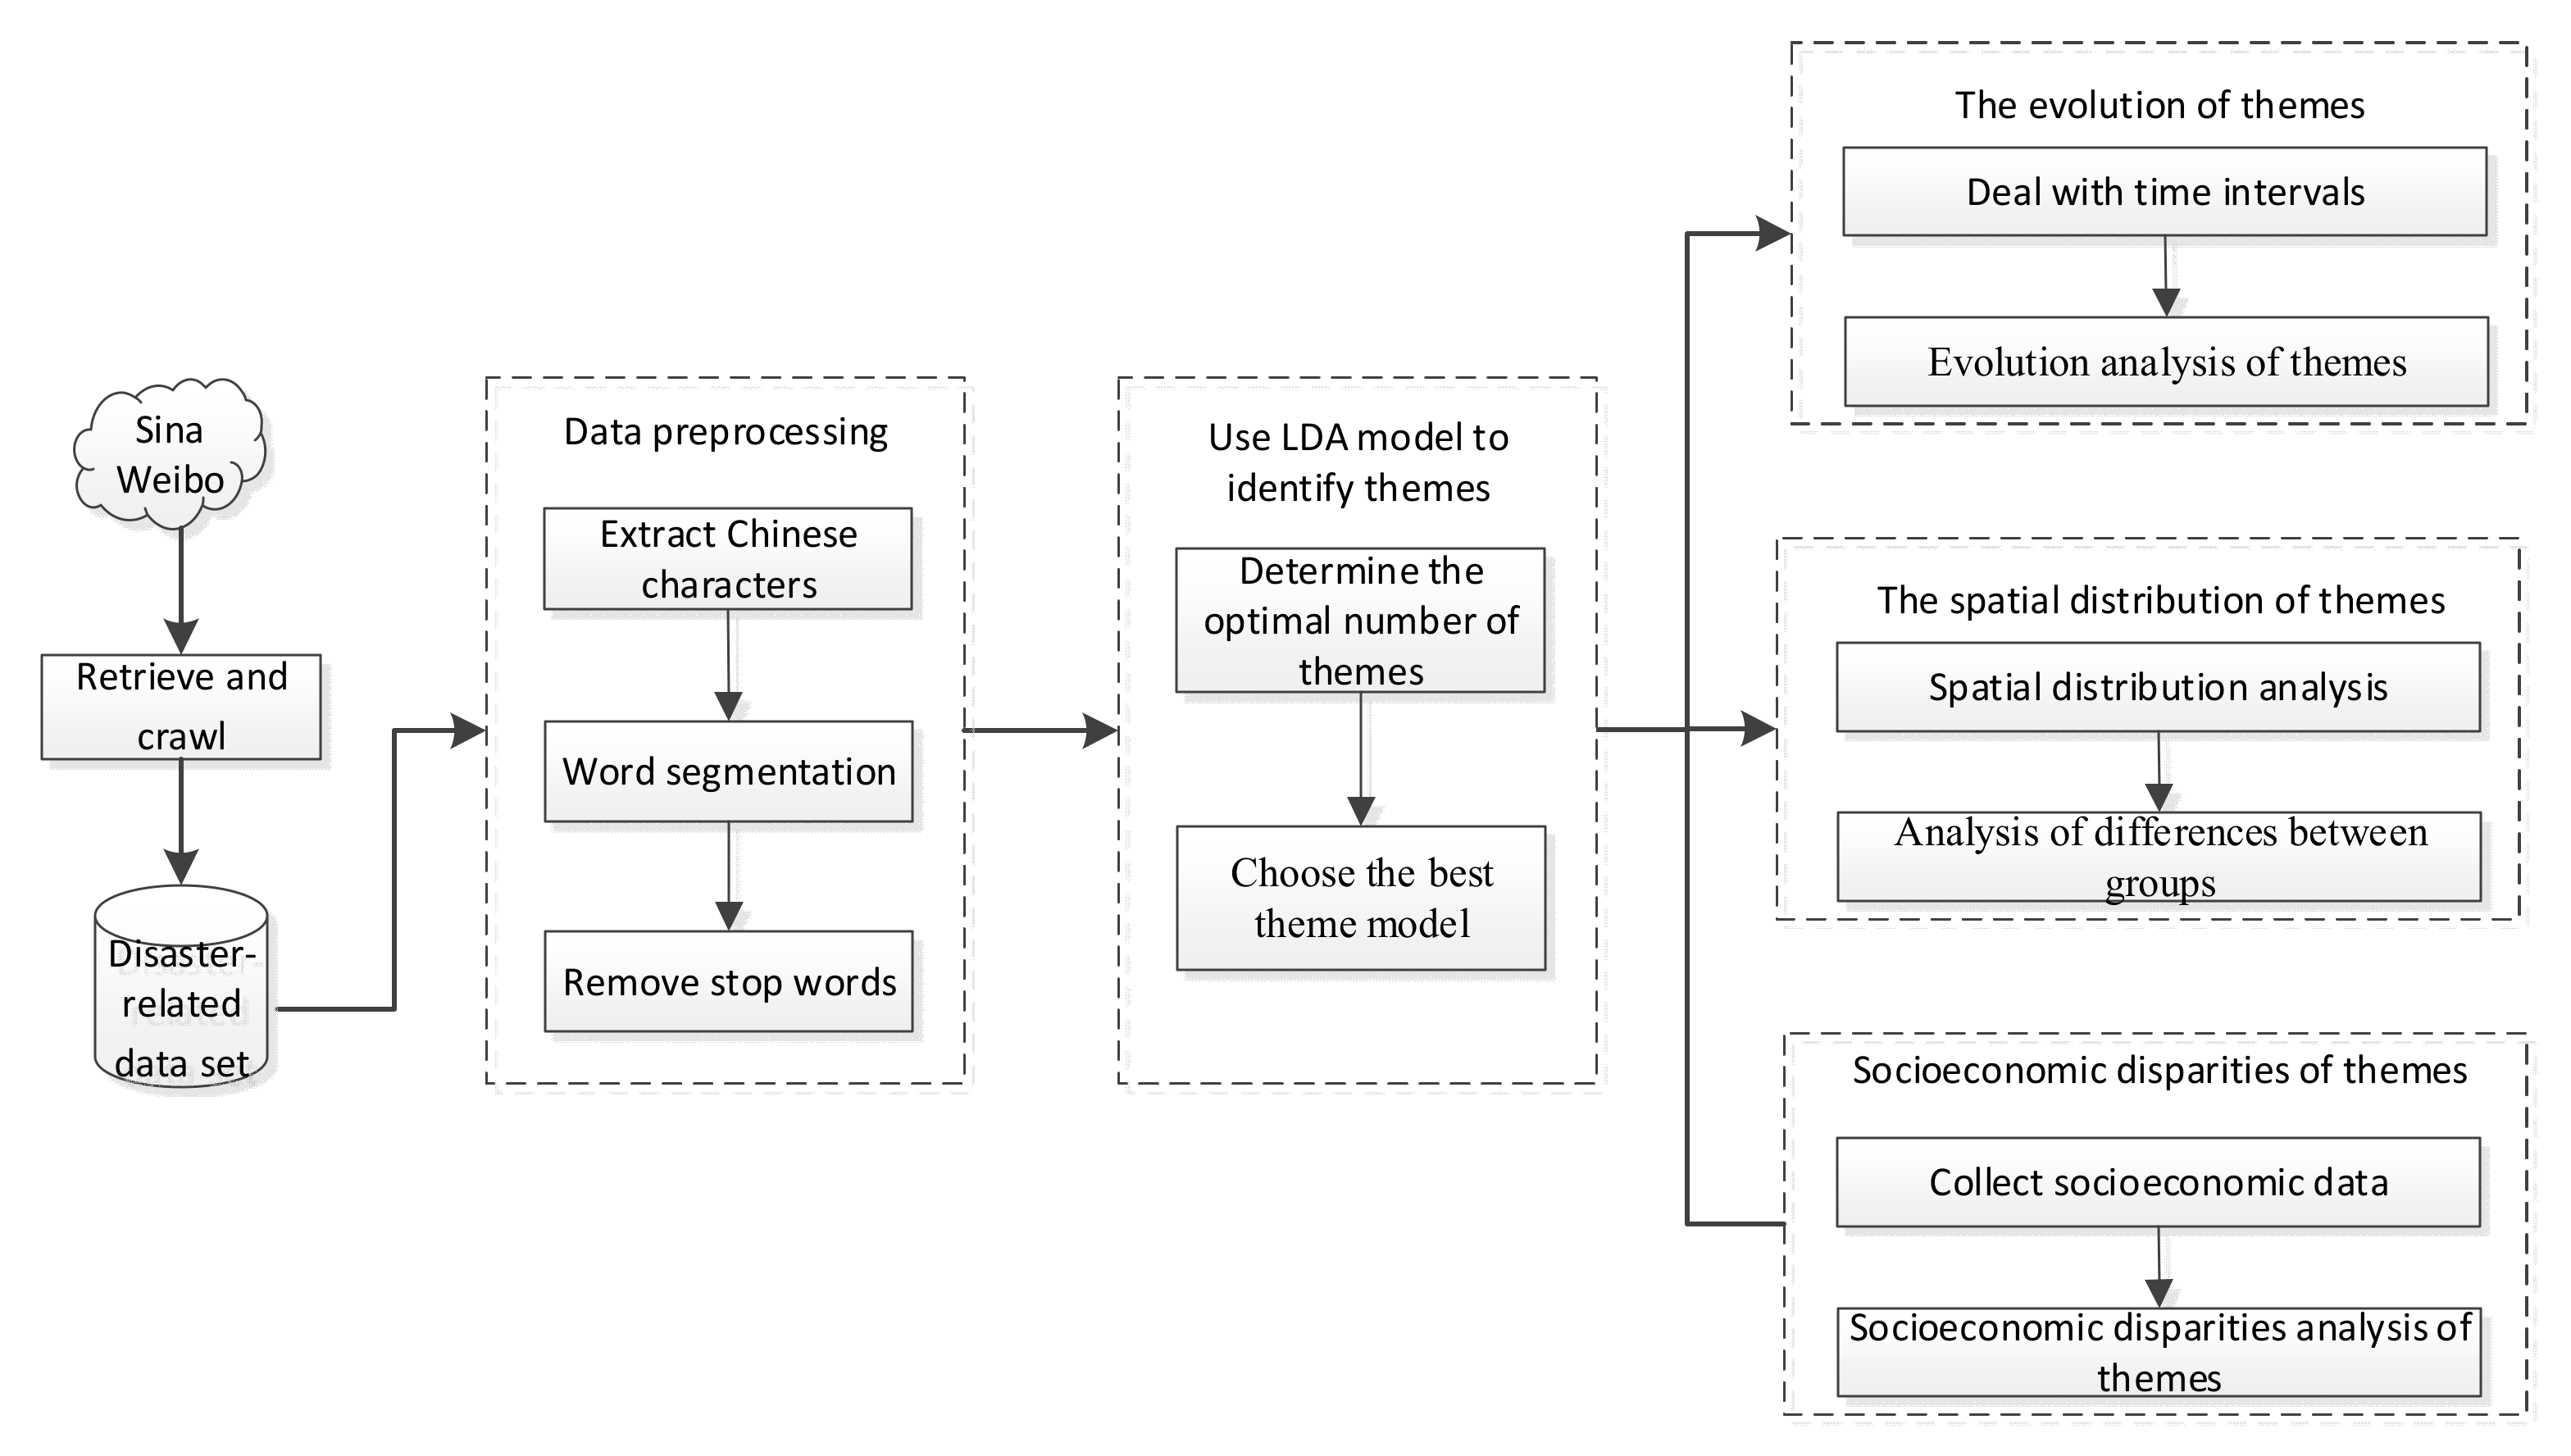
3.4. Research Design

To extract useful information and common indexes to represent the spatiotemporal and socioeconomic patterns of social media activities during meteorological disasters, we adopted a research framework that combines data preparation, theme mining, and data analyses based on LDA model and statistical analysis (Figure 1). Taking Sina Weibo as the data source, the LDA model was first used to extract themes of Sina Weibo posts. Next, we discovered and explained the evolution and spatial distribution of themes. We used statistical analysis to identify thematic differences between severely affected areas and general affected areas. Then, we analyzed the socioeconomic disparities in themes in conjunction with socioeconomic data. On this basis, we can provide recommendations of meteorological disaster management for government departments and other stakeholders.
After crawling and obtaining Sina Weibo big data relating to Typhoon Mangkhut, we extracted Chinese vocabulary to remove URLs, numbers, and special characters, and we then performed word segmentation and removed stop words. The current Chinese popular stop words lists are the Chinese stop words list, Sichuan University’s stop words list, Harbin Institute of Technology’s stop words list, and Baidu’s stop words list. We used the summary and deduplication versions on GitHub. Some words such as typhoon and Mangkhut were considered not useful for the thematic analysis of this study, and so these words were also added to the stop word library.
We then used the LDA model to extract themes of Sina Weibo posts. LDA [43] is the most common method for topic modeling, which is a type of probability model for discovering the abstract “themes” that occur in a collection of documents [44]. Traditional analysis methods, such as content analysis, require people to manually label themes, which is unrealistic for social media big data. Using LDA for topic modeling can automatically uncovering basic themes from a large amount of unstructured text data or big data. Relying on the LDA method, we can quickly discover themes (i.e., areas of public concern during disasters) from a large number of documents (i.e., Sina Weibo posts). LDA treats each document as a mixture of topics and each topic as a mixture of words. The document topic probabilities of an LDA model are the probabilities of observing each topic in each document used to fit the LDA model [31]. We chose the best topic model to identify themes of disaster-related Sina Weibo posts.
LDA has an excellent implementation in Python’s Gensim package. We wrote a Python program to identify the topics in Sina Weibo posts by calling related functions in the Gensim package. The pyLDAvis package based on Gensim is a good tool for LDA model visualization. A Python program was written to call the pyLDAvis package to visualize the themes.
A proportion of the theme (Formula (1)) was used as an indicator of spatiotemporal and socioeconomic disparities analysis. A proportion of the theme instead of the number of posts for the theme was selected for analysis because there are differences in the number of posts per hour, and the number of posts in peak hours is quite different from the posts in valley times. Therefore, in order to accurately measure themes people were concerned about, we chose the proportion of the theme as the analysis indicator. According to the document–topic probability matrix of the LDA model, the Sina Weibo posts were classified into themes, and each post was assigned to the theme with the highest probability.
Proportion   of   the   theme = number   of   posts   belong   to   the   theme number   of   disaster     related   posts
The time evolution of themes was used to analyze the change of themes over time. After assigning themes to each post, we calculated the proportion of each theme per hour. Then, a proportion–time evolution chart was obtained, and changes of themes over time were identified.
We also used the proportion of the theme to observe the spatial distribution of themes. Since we crawled the geographic location of each post when we crawled the Weibo data, we can use the posts to establish a mapping between geographic location (province) and each theme. Finally, we obtained the spatial distribution of each theme. In order to identify differences in thematic emphases between severely affected areas and moderately affected areas, we used independent-samples t-test to identify whether there are significant differences in thematic emphases between severely affected areas and moderately affected areas.
Finally, to test whether socioeconomic disparities in disaster-related Sina Weibo thematic emphases exist across different groups in disaster-affected areas, we computed the Spearman correlations between the proportion of each theme and the 8 socioeconomic variables (Table 1) to identify socioeconomic disparities in thematic emphases.

4. Results

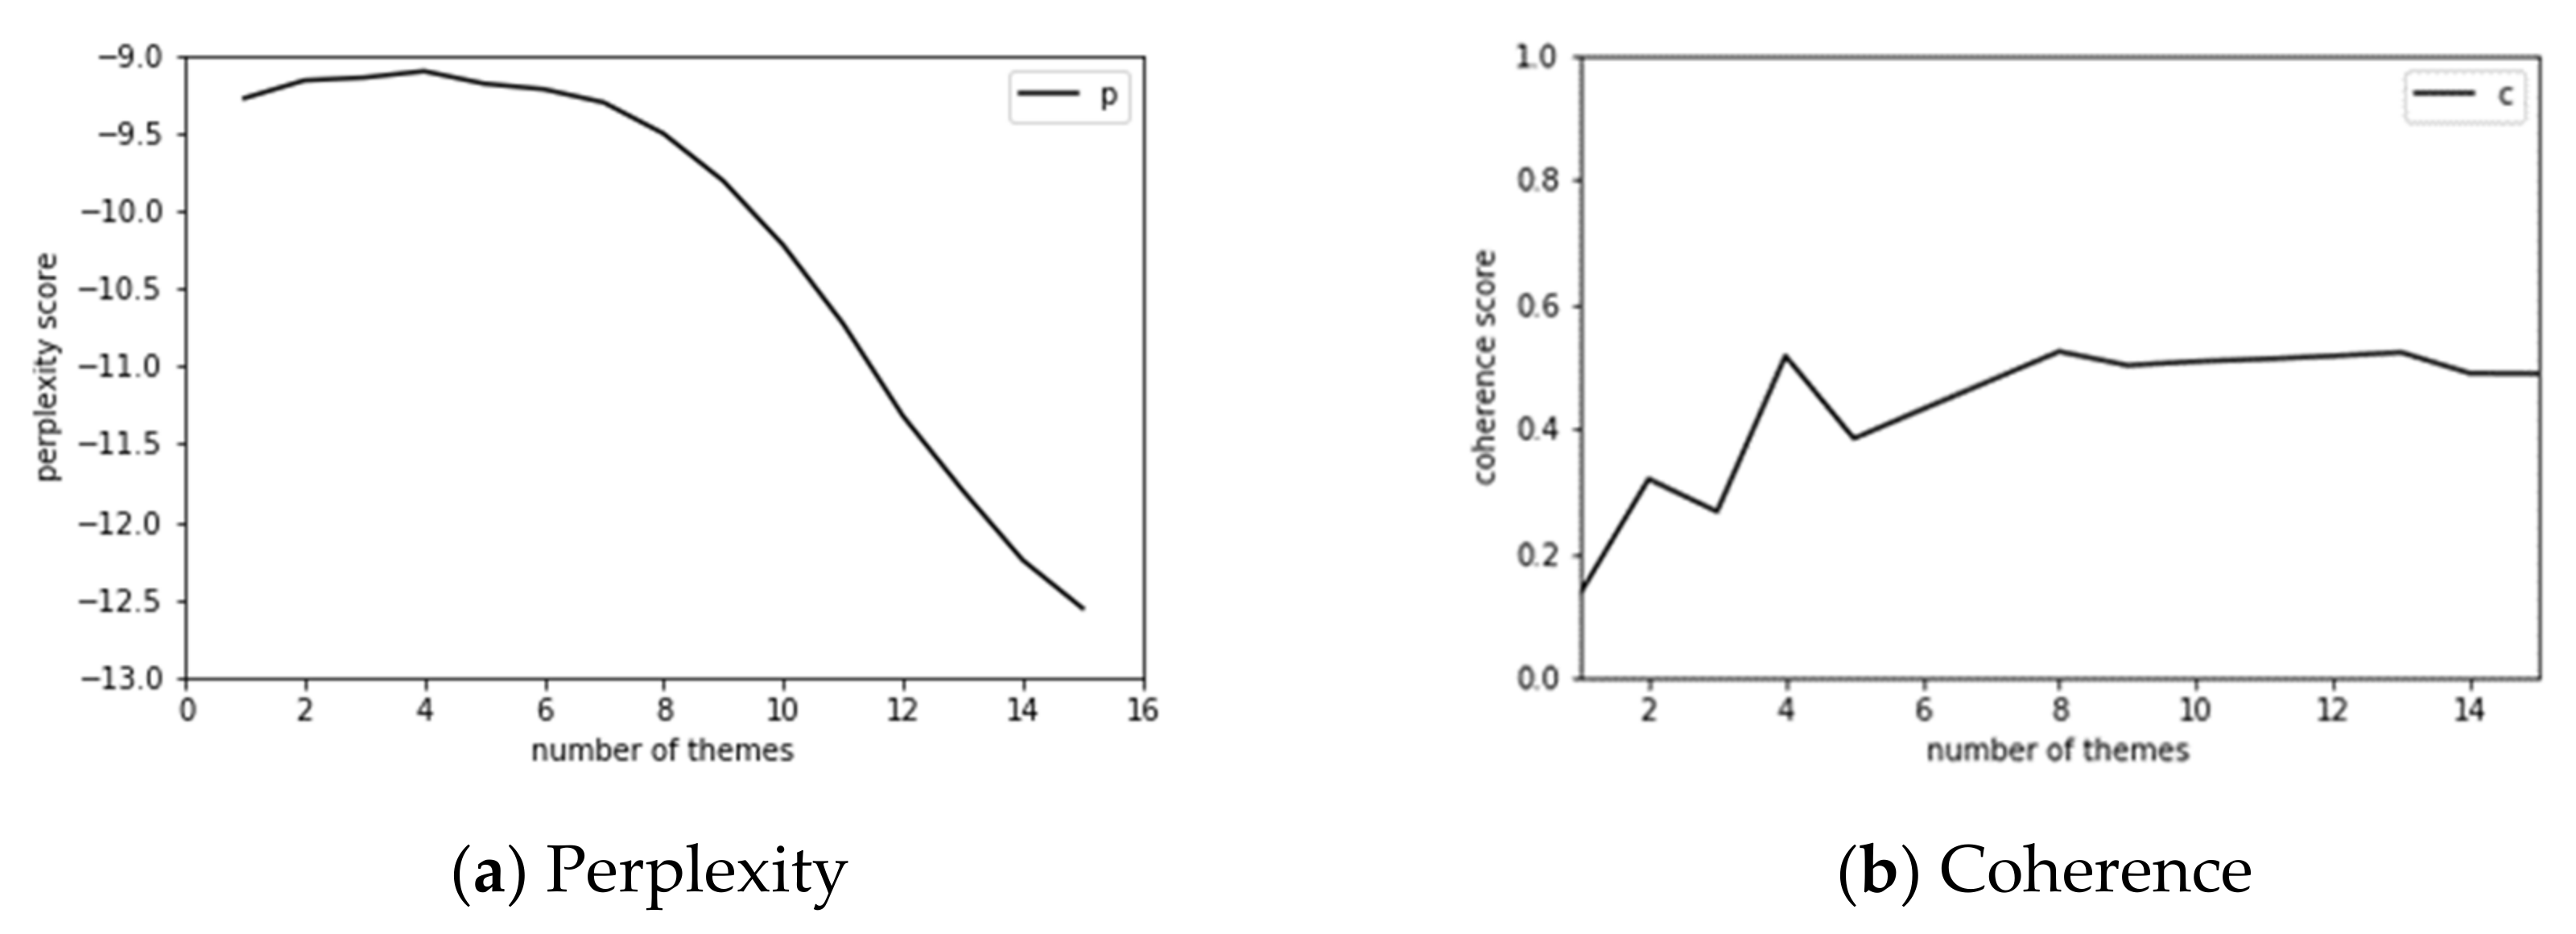
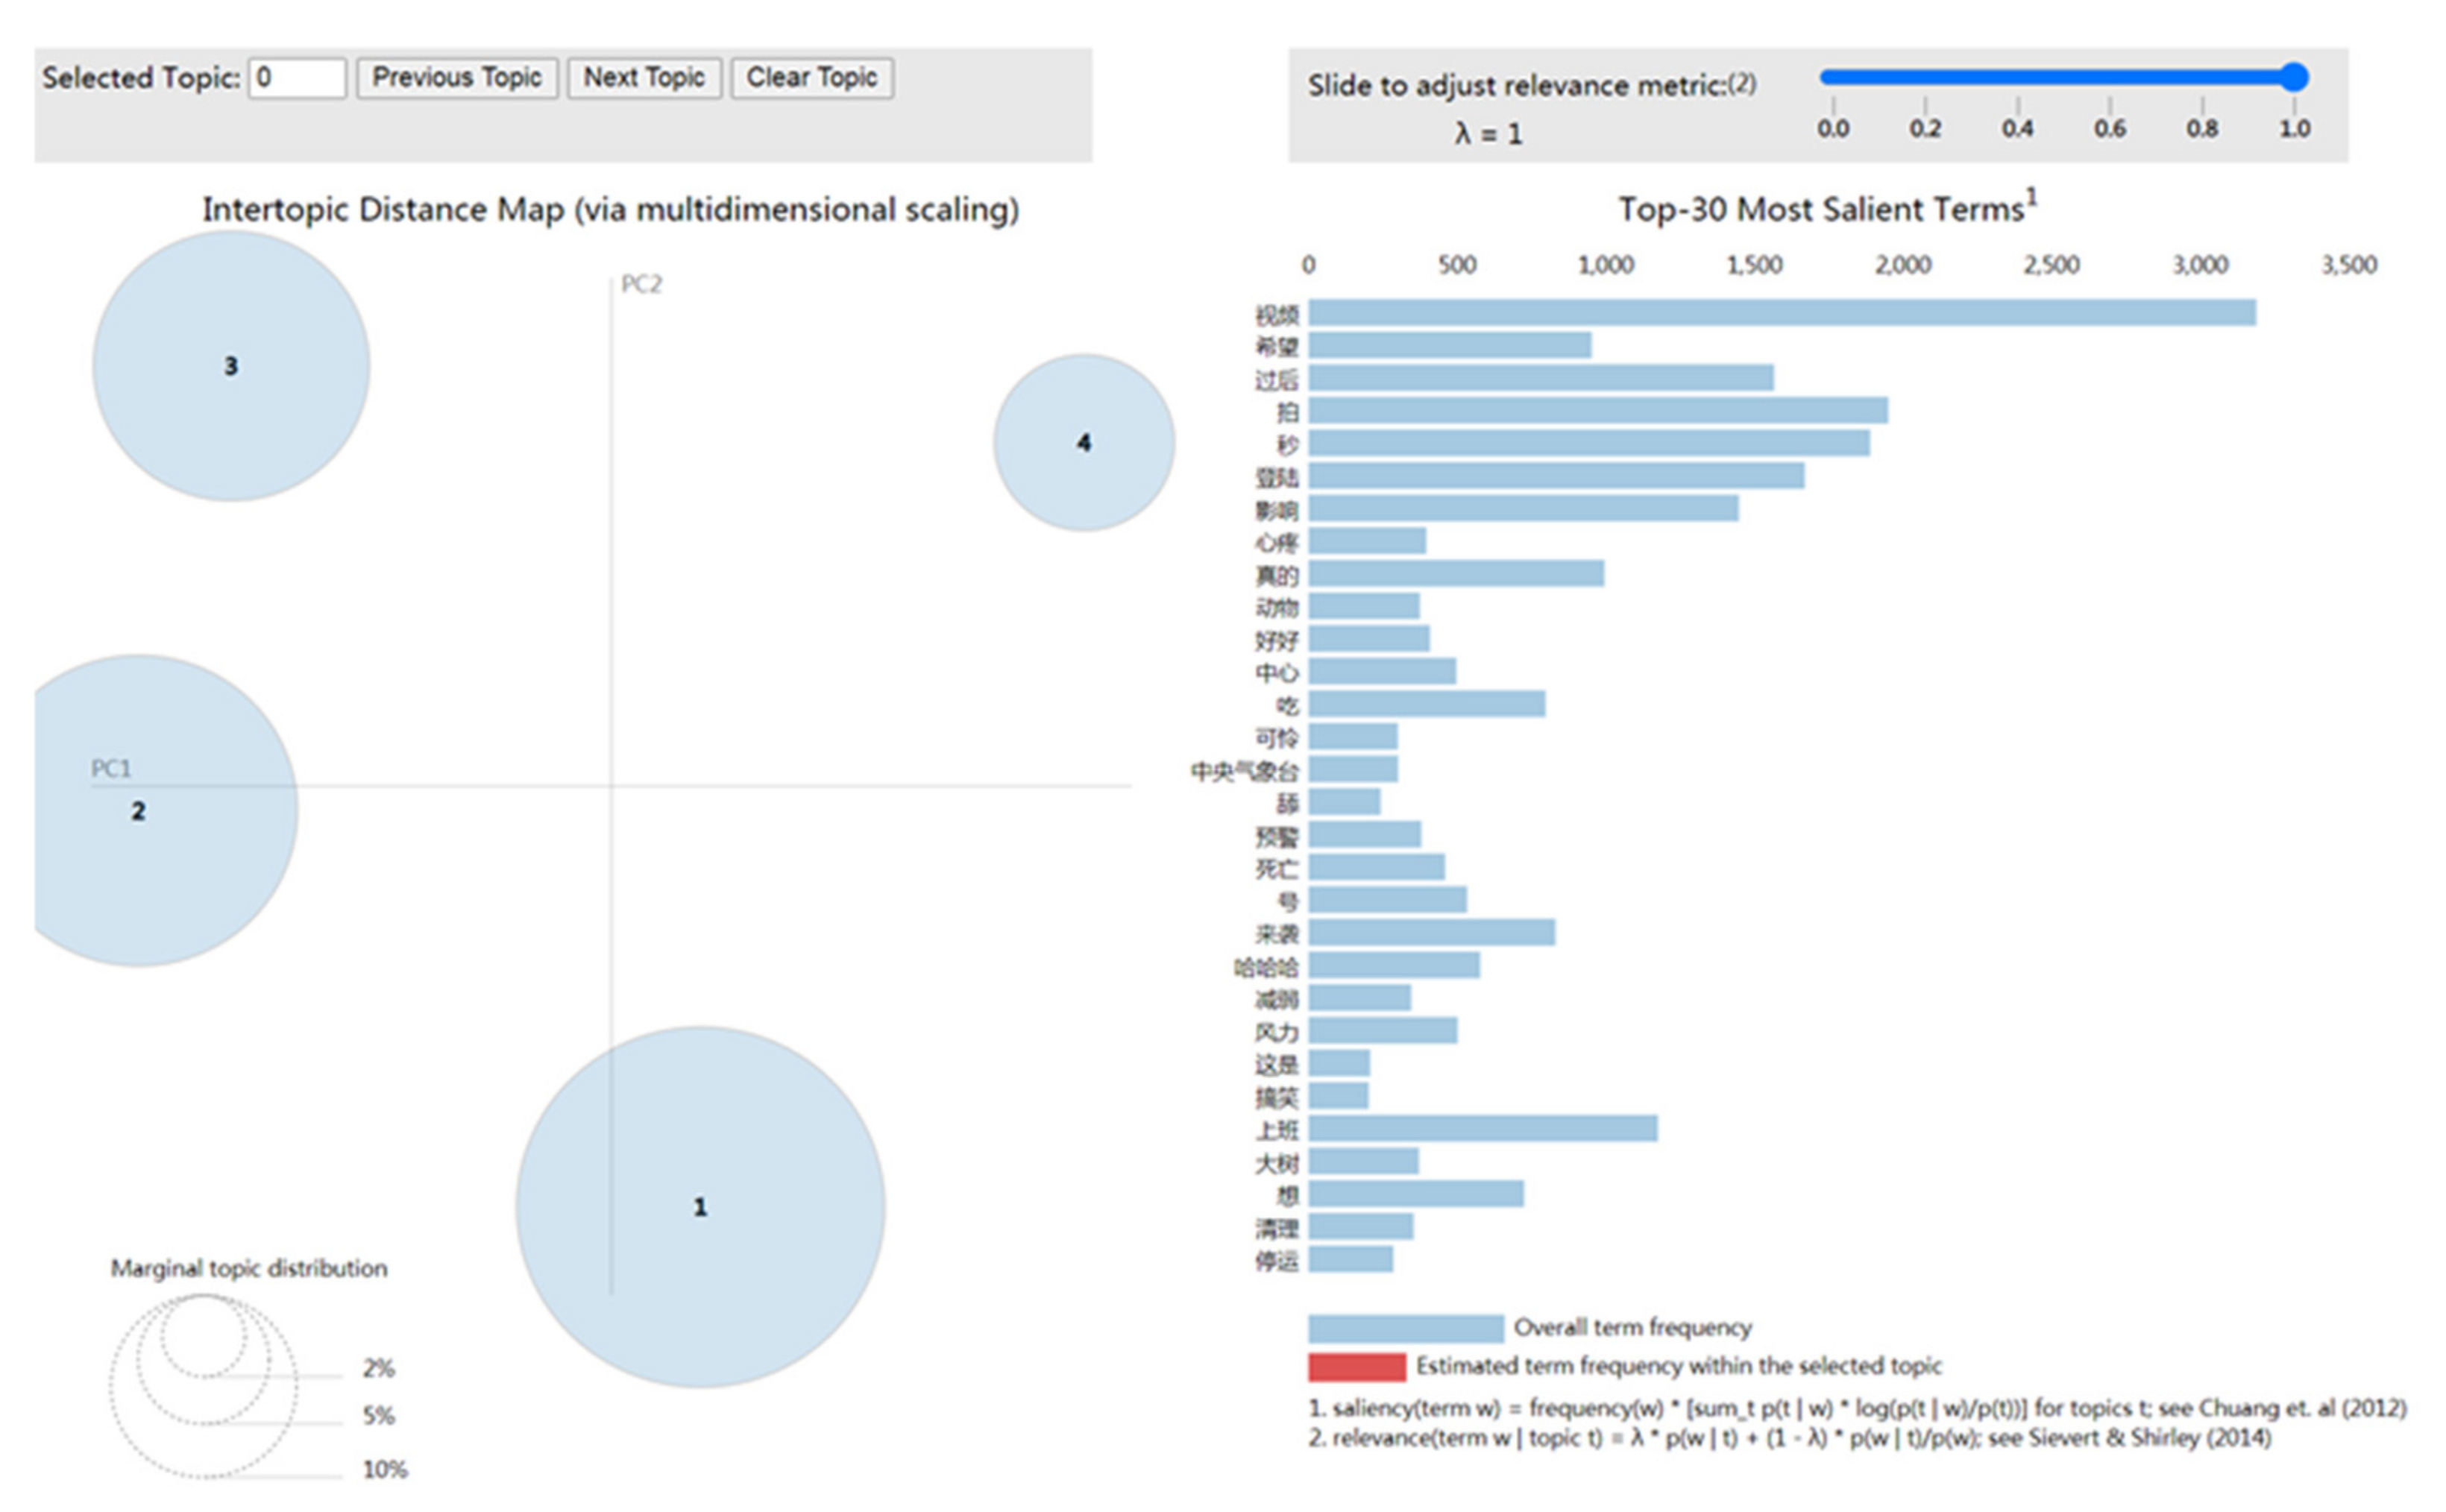
4.1. Major Themes Appear in Sina Weibo Texts

The LDA model [43] is used to train the microblog text corpus and identify the themes of the microblog text. The LDA model is a technique for taking some unstructured texts and automatically extracting its common topics.
We used quantitative and qualitative approach to choosing the best topic model, containing two quantitative indicators, perplexity and topic coherence. Perplexity means that for an article, we are not sure how it belongs to a certain topic. The lower the perplexity, the better the model. Surprisingly, perplexity does not always agree with human opinion about the quality of the model [45]. Topic coherence is another indicator used for choosing the best topic model; it measures how often the topic words appear together in the corpus [46]. The higher the coherence, the better the model.
Therefore, we used two steps to determine the optimal topic model. First, we calculated the perplexity values and coherence values, determined the corresponding extreme value, and produced an indication of the appropriate range of topics’ numbers. Second, a visual display of the degree of separation between different themes was produced in the form of a visual map (produced with LDAvis), so that the number of topics with the best degree of separation is selected as the optimal number of topics (Figure 2). The resulting topic model is shown in Figure 3. English translation of the labels in Chinese in Figure 3 is shown in Table 2.
On the left, four themes were plotted as circles, whose meanings are shown in Table 3. The circle’s centers are defined by the computed distance between themes. LDAvis [47] uses multi-dimensional analysis to extract the principal components as two dimensions and to distribute the topics to these two dimensions. The distance between the themes expresses the proximity between the themes. It can be seen that the distinction between the four themes is very good. The prevalence of each theme is indicated by the circle’s area. As can be seen from Figure 3, Theme 1 appears most frequently. On the right, one bar shows the overall term frequency (in bluish gray).
We chose words with a higher description value for the theme to be keywords that can better describe the content of the theme. After screening, the keywords of each theme were confirmed, and these are shown in Table 3. During the typhoon disaster, there were four themes that Sina Weibo users paid attention to: general response, urban transportation, typhoon status and impact, and animals and humorous news. Theme 1 describes the general response of Sina Weibo users during the typhoon disaster, and it is the most frequent. Compared with Hurricane Laura, the impact of Typhoon Mangkhut is not so severe. Because of timely weather forecasts, people were able to remain at home and could be prepared for traffic inconveniences and power outages. Theme 1 reflects the general response to Typhoon Mangkhut and psychological reflections. Looking at some Sina Weibo posts, we can even find that some users expressed the joy of not having to go to work and the excitement of some Sina Weibo users who experienced a typhoon for the first time. Although it is inconvenient for the public to go out due to the typhoon, the public was able to stock up on food in advance because of the timely warning. Through the analysis of the posts about food, it was found that the public mainly mentioned about cooking and eating at home during the typhoon. There are some complaints about the inconvenience, but there was no panic expressed about food. Although emotion analysis is not our emphasis in this paper, emotion expressions remained only at a general level as captured in Theme 1. Theme 2 describes urban transportation. The typhoon disaster greatly damaged urban transportation, which affected people’s basic work and life; from this, it can be seen that urban transportation is another theme people cared about most. Theme 3 concerns the news release of the typhoon, mainly about meteorological information, warning information, disruption of traffic, and suspension of school, while Theme 4 concerns animals and humorous news. Related Sina Weibo posts reflect the distress of small animals such as cats and dogs during the typhoon, and the joy in humorous news about the typhoon. This is also related to the less serious consequences caused by Typhoon Mangkhut in mainland China. The data we used were dated from the point when the typhoon landed. Certain activities such as evacuation had occurred before the typhoon made its landfall. We believe that if we crawled Sina Weibo posts before the typhoon landed, there should be an evacuation theme.

4.2. Analysis on the Evolution of the Themes

Here, we explain the evolution of the theme over time through the proportion of the theme (Formula (1)) in different time windows. According to the document topic probabilities of the LDA model, the probabilities that each post belongs to each theme were first obtained. Then each Sina Weibo post was classified into the theme with the highest probability. The change of the proportion of posts that belongs to each theme with time was analyzed to obtain a theme-time evolution map.
The Sina Weibo posts were divided into different time intervals (per hour), and the prevalence of each theme in different time intervals was calculated so that the evolution of each theme can be obtained (Figure 4). In the early hours of the disaster, the main themes in Sina Weibo focused on Theme 1 (general response), Theme 2 (urban transportation), and Theme 3 (typhoon status and impact). This shows that in the early hours of the typhoon disaster, the Sina Weibo users hoped to be able to obtain information and increase their disaster situation awareness. However, the popularity of Theme 3 (i.e., typhoon status and impact) soon fell sharply. After time elapsed for 12 h, which corresponds to 5:00 a.m. the next morning, the attention of Theme 2 (urban transportation) began to pick up quickly. At time = 14, which corresponds to 7:00 a.m. the next morning, Theme 3 (typhoon status and impact) has another small peak. This could be because people wanted to obtain the latest situation awareness information again after getting up in the next morning. Throughout the typhoon disaster, the dominant theme is Theme 1 (general response).

4.3. Analysis on the Spatial Distribution of Themes

To find out what the spatial distribution of thematic emphasis was during the typhoon, we linked each theme with the provinces and calculated the proportion of each theme in each provincial administrative unit (Figure 5). We found that geographically, the distribution of each theme in each province is different. This leads to our further hypotheses on the relationship between the spatial difference and the varying extents in the impact of the typhoon, which is addressed below.
After the typhoon landed, areas at or near the center of the typhoon were seriously affected. For example, urban transportation was greatly damaged. Areas a little away from the center of the typhoon were less affected and received heavy rainfalls. The varying extents in the impact of the typhoon on the public caused differences in the themes on social media.
The seven provinces in mainland China suffered from different disaster levels of Typhoon Mangkhut, among which Guangdong and Guangxi provinces were seriously affected areas. The provincial administrative regions were classified according to the disaster levels. Guangdong and Guangxi were seriously affected areas, and the other five provincial administrative regions were moderately affected areas. An independent-samples t-test was used to analyze the difference in thematic emphases of the two different groups (i.e., seriously affected areas, moderately affected areas). Because of the small number of samples (two samples in seriously affected areas and five in moderately affected areas), we used the proportion of each theme in every hour as samples for the independent-samples t-test. In some periods, such as early morning hours, few or no people posted on Sina Weibo. For example, in the data we crawled, there was only one post from 2:00 a.m. to 3:00 a.m. in Guizhou Province, and the post concerned Theme 2 (urban transportation). Such a case may cause inaccurate data analysis. In order to avoid such disturbing cases, we removed samples with very few posts, but we adopted the data where the number of posts is greater than or equal to 10 in each theme in the analysis, which resulted in variations in the sample size of independent sample tests under different themes.
Different levels of disaster have different impacts on the work and lives of people in disaster areas, which may affect their expression on Sina Weibo. Based on this, the following hypothesis is proposed in this paper:
Hypothesis: 
There are differences in the thematic emphases of Sina Weibo texts between seriously affected areas and moderately affected areas.
We used the data of the four themes to make independent-samples t-tests separately. The results show that there are significant differences in three themes (Themes 2, 3, and 4) between the seriously affected areas and moderately affected areas. Theme 1 (general response) is not significant at the 0.05 level of significance.
The results of the independent-samples t-test are shown in Table 4 and Table 5. Group statistics of topic proportion are shown in Table 4. Table 5 shows the independent samples test for Theme 2 (urban transportation). Due to space limitations, independent-samples t-tests for the other three themes remaining are given in Appendix (Table A1, Table A2 and Table A3).
From the group statistics, it can be seen that people in severely affected areas are more concerned about Theme 2 (urban transportation). People in moderately affected areas are more concerned about Theme 3 (Typhoon status and impact) and Theme 4 (animals and humorous news). The urban transportation in seriously affected areas was greatly damaged, which greatly disrupted the travel of the local public. Therefore, the public in seriously affected areas was more concerned about Theme 2 (urban transportation).

4.4. Analysis on Socioeconomic Disparities of Thematic Emphases

Correlations between the proportion of each theme and socioeconomic variables were calculated at the province level. Ideally, socioeconomic characteristics of users would be determined at the individual level, but that type of data was not available for obvious reasons [6], so locations were used to link the proportion of themes and the Sina Weibo users.
Since the data were not in a normal distribution, the Spearman correlation coefficient was used for analysis. Spearman correlation analyses between the index (proportion of each theme) and the eight socioeconomic variables were conducted to test the main hypothesis that the groups with different socioeconomic conditions have different thematic emphases in emergency situations (Table 6).
The percentage of the population with a bachelor or a higher degree was found to be positively correlated with the proportion of Theme 1 (general response). The population density was found to be negatively correlated with the proportion of Theme 1 (general response), but the coefficient is low and the correlation is weak. The percentage of mobile Internet users and percentage of the population 15 to 29 years old were found to be positively correlated with the proportion of Theme 2 (urban transportation). The percentage of the population with a bachelor or a higher degree, percentage of the unemployed workforce, and female ratio were found to be negatively correlated with the proportion of Theme 2 (urban transportation). The total dependency ratio, percentage of the unemployed workforce, and female ratio were found to be positively correlated with the proportion of Theme 3 (typhoon status and impact). The disposable income per capita, percentage of mobile Internet users and the percentage of the population 15 to 29 years old were found to be negatively correlated with the proportion of Theme 3 (typhoon status and impact). The total dependency ratio, percentage of the population with a bachelor or a higher degree, percentage of the unemployed workforce, and female ratio were found to be positively correlated with the proportion of Theme 4 (animals and humorous news). The disposable income per capita, percentage of mobile Internet users, and percentage of the population 15 to 29 years old were found to be negatively correlated with the proportion of Theme 4 (animals and humorous news).
Except for some Spearman correlation coefficients in Themes 3 and 4, the values of other correlation coefficients are less than 0.6; this shows that the relationships between the themes (1 and 2) and the socioeconomic variables are weak correlations. The relationships between Theme 3 and the percentage of mobile Internet users and the female ratio are strong correlations. The relationships between Themes 4 and the total dependency ratio, female ratio, percentage of mobile Internet users, and percentage of the population 15 to 29 years old are strong correlations.
The above results reveal how socioeconomic conditions affect disaster-related Sina Weibo thematic emphases during the Typhoon disaster. In addition, the results support the hypothesis that there are differences in thematic emphases across disparate socioeconomic groups. Women preferred to post about Theme 3 (typhoon status and impact) and Theme 4 (animals and humorous news), while people with a higher income paid less attention to these two themes during Typhoon Mangkhut. Young people posted fewer posts related to Theme 4.

5. Discussion

5.1. Principal Results

We found that the distribution of themes during the typhoon disaster varied in the time dimension. From the perspective of time evolution, Theme 1 (general response) and Theme 2 (urban transportation) hold the principal position throughout the disaster. In the early hours of the disaster, Theme 3 (typhoon status and impact) is the most popular theme, but its popularity soon fell sharply after. According to Fink’s (1986) four-stage model of disaster [48], Xu et al. [4] found that themes varied across different stages during Hurricane Irma. Zhao et al. [5] also confirmed that the diversity of major themes was significantly associated with the crisis stages. Our results and these findings can help government agencies and disaster managers address the public needs effectively at various stages in a timely manner.
Geographically, the distribution of each theme in each province is different. Our research confirms that the geographical differences in the themes are mainly caused by the severity of the disaster. In our study, people in moderately affected areas were more concerned about Theme 3 (typhoon status and impact) and Theme 4 (animals and humorous news). Generally speaking, areas close to the disaster site tend to generate more useful information on social media sites [34]. Our research further shows that the themes of public concern are also related to the extent of the disaster.
Social media behaviors are known to vary across socioeconomic groups [7]. Thematic differences among disparate groups of the population could lead to biased conclusions if the analysis is not carefully done. Spearman correlation analyses between the index (proportion of each theme) and the eight socioeconomic variables confirm our hypothesis that there are socioeconomic differences in thematic emphases across disparate groups of the population. Women preferred to post about Theme 3 (typhoon status and impact) and Theme 4 (animals and humorous news), while people with more wealth paid less attention to these two themes during Typhoon Mangkhut. Yuan et al. found that citizens with different demographic characters presented varying emotions and concerns in the same disasters [49]. These understandings of varying sentiments and concerns of different demographic groups can help crisis response managers design and implement on-target response strategies [37].
These findings provide new insights into the roles of social media that can be used in creating or dismantling the digital divide during disasters and can help government agencies, crisis managers, and other stakeholders to customize communication content to fit public needs and maximize positive communication effects.

5.2. Limitations and Future Research

This paper reveals the temporal, spatial, and socioeconomic patterns in thematic emphases on social media during Typhoon Mangkhut. However, limitations exist in our current work. The dataset of Sina Weibo posts used in this case study was incomplete. This dataset was collected by a Python crawler through the advanced search function on Sina Weibo. Sina Weibo’s search limit is to display only 50 pages. We adopted the advanced search function of Sina Weibo, crawling every hour of data in each province, and we thus crawled as much relevant data as possible in this way. Although most of the data can be fully crawled, the data of the popular province during peak hours were still partially missing. However, we believe that the incompleteness of data basically has little effect on our thematic analysis.
The eight socioeconomic factors selected cannot fully explain the differences in thematic emphases related to disasters. Other factors, such as damage caused by disasters or similar experiences in the past, may also affect the focus of Sina Weibo users; this point can be furthered considered in future research.
Due to the existence of digital inequality [50,51,52], some vulnerable groups may lack representation or fail to speak online. Our research is based on Sina Weibo data, which may not sufficiently reflect the public opinion of these vulnerable groups. How to combine online and offline data to accurately reflect the concerns of the public, especially vulnerable groups, is the direction of further research.

6. Conclusions

This study contributes to identifying temporal, spatial, and socioeconomic dynamics in social media thematic emphases in disaster management through a case study of Typhoon Mangkhut. We found that the distribution of themes during the typhoon disaster varies in time and space. Spearman correlation analyses confirmed that there are socioeconomic differences in thematic emphases across disparate groups of the population. Women prefer to post about Theme 3 (typhoon status and impact) and Theme 4 (animals and humorous news), while socioeconomically well-off people pay less attention to these two themes during Typhoon Mangkhut.
There are important implications of the framework and research findings. First, this research adopts the concept of socioeconomic disparities into thematic analysis and sets a computable quantitative index: the proportion of the theme, enriching and developing the theoretical analyses of thematic analysis and socioeconomic disparities. Second, the proposed research framework can be easily applied to other different disasters. The research results can help policymakers and other stakeholders to identify the unique information needs of different groups and help provide tailor-made information support for disaster preparedness, mitigation, response, and recovery.

Author Contributions

Conceptualization, H.Z. and K.L.; data curation, H.Z.; funding acquisition, H.Z. and K.L.; methodology, H.Z.; writing—original draft, H.Z.; writing—review and editing, H.Z. and K.L. All authors have read and agreed to the published version of the manuscript.

Funding

This research was funded by General Project of Philosophy and Social Science Research in Colleges and Universities of Jiangsu Province, China (grant number 2018SJA0147). This work was also supported by the Shanghai Engineering Research Center of Finance Intelligence (grant number 19DZ2254600).

Institutional Review Board Statement

Not applicable.

Informed Consent Statement

Not applicable.

Data Availability Statement

The data presented in this study are available on request from the corresponding author. The data are not publicly available due to the restrictions of the social media platform.

Conflicts of Interest

The authors declare no conflict of interest.

Appendix A

Table A1. Independent samples test of thematic proportion for Theme 1 (general response).
Levene’s Test for Equality of Variancest-Test for Equality of Means
FSig.tdfSig.
(Two-Tailed)
95% Confidence Interval of the Difference
Lower Upper
Equal variances assumed4.3390.040−1.7261120.087−0.07161120.0049264
Equal variances not assumed −1.802111.7800.074−0.07000120.0033164
Table A2. Independent samples test of thematic proportion for Theme 3 (typhoon status and impact).
Levene’s Test for Equality of Variancest-Test for Equality of Means
FSig.tdfSig.
(Two-Tailed)
95% Confidence Interval of the Difference
Lower Upper
Equal variances assumed27.7570.000−6.193790.000−0.1751184−0.0899311
Equal variances not assumed −6.24356.7000.000−0.1750352−0.0900143
Table A3. Independent samples test of thematic proportion for Theme 4 (animals and humorous news).
Levene’s Test for Equality of Variancest-Test for Equality of Means
FSig.tdfSig.
(Two-Tailed)
95% Confidence Interval of the Difference
Lower Upper
Equal variances assumed3.5160.066−7.962540.000−0.1007307−0.0602044
Equal variances not assumed −7.48235.9050.000−0.1022827−0.0586524

References

  1. Luna, S.; Pennock, M.J. Social media applications and emergency management: A literature review and research agenda. Int. J. Disaster Risk Reduct. 2018, 28, 565–577. [Google Scholar] [CrossRef]
  2. Zhang, C.; Fan, C.; Yao, W.; Hu, X.; Mostafavi, A. Social media for intelligent public information and warning in disasters: An interdisciplinary review. Int. J. Inf. Manag. 2019, 49, 190–207. [Google Scholar] [CrossRef]
  3. Rojas, M.M.; Pardo-Ferreira, M.D.C.; Rubio-Romero, J.C. Twitter as a tool for the management and analysis of emergency situations: A systematic literature review. Int. J. Inf. Manag. 2018, 43, 196–208. [Google Scholar] [CrossRef]
  4. Xu, Z.; Lachlan, K.; Ellis, L.; Rainear, A.M. Understanding public opinion in different disaster stages: A case study of Hurricane Irma. Internet Res. 2019, 30, 695–709. [Google Scholar] [CrossRef]
  5. Fan, C.; Mostafavi, A.; Gupta, A.; Zhang, C. A system analytics framework for detecting infrastructure-related topics in disasters using social sensing. In Privacy Enhancing Technologies; Springer Science and Business Media LLC: Berlin/Heidelberg, Germany, 2018; pp. 74–91. [Google Scholar]
  6. Zhao, X.; Zhan, M.; Wong, C.-W. Segmenting and understanding publics in a social media information sharing network: An interactional and dynamic approach. Int. J. Strat. Commun. 2017, 12, 25–45. [Google Scholar] [CrossRef]
  7. Li, L.; Goodchild, M.F.; Xu, B. Spatial, temporal, and socioeconomic patterns in the use of Twitter and Flickr. Cartogr. Geogr. Inf. Sci. 2013, 40, 61–77. [Google Scholar] [CrossRef]
  8. Akter, S.; Wamba, S.F. Big data and disaster management: A systematic review and agenda for future research. Ann. Oper. Res. 2017, 283, 939–959. [Google Scholar] [CrossRef] [Green Version]
  9. Sarker, M.N.I.; Peng, Y.; Yiran, C.; and Shouse, R.C. Disaster resilience through big data: Way to environmental sustainability. Int. J. Disaster Risk Reduct. 2020, 51. [Google Scholar] [CrossRef]
  10. Liu, Y.; Yuan, Y.; Zhang, F. Mining urban perceptions from social media data. J. Spat. Inf. Sci. 2020, 51–55. [Google Scholar] [CrossRef]
  11. Pekar, V.; Binner, J.; Najafi, H.; Hale, C.; Schmidt, V. Early detection of heterogeneous disaster events using social media. J. Assoc. Inf. Sci. Technol. 2019, 71, 43–54. [Google Scholar] [CrossRef]
  12. Perinan-Pascual, C.; Arcas-Tunez, F. The analysis of tweets to detect natural hazards. In Intelligent Environments 2018; Chatzigiannakis, I., Tobe, Y., Novais, P., Amft, O., Eds.; Ios Press: Amsterdam, The Netherlands, 2018. [Google Scholar]
  13. Li, Z.; Wang, C.; Emrich, C.T.; Guo, D. A novel approach to leveraging social media for rapid flood mapping: A case study of the 2015 South Carolina floods. Cartogr. Geogr. Inf. Sci. 2018, 45, 97–110. [Google Scholar] [CrossRef]
  14. Son, J.; Lee, H.K.; Jin, S.; Lee, J. Content features of tweets for effective communication during disasters: A media synchronicity theory perspective. Int. J. Inf. Manag. 2019, 45, 56–68. [Google Scholar] [CrossRef]
  15. Vyncke, B.; Perko, T.; van Gorp, B. Information sources as explanatory variables for the belgian health-related risk perception of the fukushima nuclear accident. Risk Anal. 2016, 37, 570–582. [Google Scholar] [CrossRef] [PubMed] [Green Version]
  16. Balog-Way, D.; McComas, K.; Besley, J. The evolving field of risk communication. Risk Anal. 2020, 40, 2240–2262. [Google Scholar] [CrossRef] [PubMed]
  17. Yoo, W. How risk communication via Facebook and Twitter shapes behavioral intentions: The case of fine dust pollution in South Korea. J. Heal. Commun. 2019, 24, 663–673. [Google Scholar] [CrossRef] [PubMed]
  18. Guidry, J.P.; Jin, Y.; Orr, C.A.; Messner, M.; Meganck, S. Ebola on Instagram and Twitter: How health organizations address the health crisis in their social media engagement. Public Relat. Rev. 2017, 43, 477–486. [Google Scholar] [CrossRef]
  19. Zhao, Y.X.; Cheng, S.X.; Yu, X.Y.; Xu, H.L. Chinese public’s attention to the covid-19 epidemic on social media: Observational descriptive study. J. Med. Internet Res. 2020, 22. [Google Scholar] [CrossRef]
  20. Ma, X.; Liu, W.; Zhou, X.; Qin, C.; Chen, Y.; Xiang, Y.; Zhang, X.; Zhao, M. Evolution of online public opinion during meteorological disasters. Environ. Hazards 2019, 19, 375–397. [Google Scholar] [CrossRef]
  21. Shan, S.; Zhao, F.; Wei, Y.; Liu, M. Disaster management 2.0: A real-time disaster damage assessment model based on mobile social media data—A case study of Weibo (Chinese Twitter). Saf. Sci. 2019, 115, 393–413. [Google Scholar] [CrossRef]
  22. Wu, D.; Cui, Y. Disaster early warning and damage assessment analysis using social media data and geo-location information. Decis. Support. Syst. 2018, 111, 48–59. [Google Scholar] [CrossRef]
  23. Yuan, F.X.; Liu, R. Feasibility study of using crowdsourcing to identify critical affected areas for rapid damage as-sessment: Hurricane matthew case study. Int. J. Disaster Risk Reduct. 2018, 28, 758–767. [Google Scholar] [CrossRef]
  24. Kryvasheyeu, Y.; Chen, H.; Obradovich, N.; Moro, E.; Van Hentenryck, P.; Fowler, J.; Cebrian, M. Rapid assessment of disaster damage using social media activity. Sci. Adv. 2016, 2, e1500779. [Google Scholar] [CrossRef] [Green Version]
  25. Jamali, M.; Nejat, A.; Ghosh, S.; Jin, F.; Cao, G. Social media data and post-disaster recovery. Int. J. Inf. Manag. 2019, 44, 25–37. [Google Scholar] [CrossRef]
  26. Wang, Z.; Ye, X. Social media analytics for natural disaster management. Int. J. Geogr. Inf. Sci. 2018, 32, 49–72. [Google Scholar] [CrossRef]
  27. Sharma, S.; Jain, A. Role of sentiment analysis in social media security and analytics. Wiley Interdiscip. Rev. Data Min. Knowl. Discov. 2020, 10, 27. [Google Scholar] [CrossRef]
  28. Resch, B.; Usländer, F.; Havas, C. Combining machine-learning topic models and spatiotemporal analysis of social media data for disaster footprint and damage assessment. Cartogr. Geogr. Inf. Sci. 2018, 45, 362–376. [Google Scholar] [CrossRef] [Green Version]
  29. Turner-McGrievy, G.; Karami, A.; Monroe, C.; Brandt, H.M. Dietary pattern recognition on Twitter: A case example of before, during, and after four natural disasters. Nat. Hazards 2020, 103, 1035–1049. [Google Scholar] [CrossRef]
  30. Purohit, H.; Castillo, C.; Diaz, F.; Sheth, A.; Meier, P. Emergency-relief coordination on social media: Automatically matching resource requests and offers. First Monday 2013, 19. [Google Scholar] [CrossRef]
  31. Garcia-Ramirez, G.M.; Bogen, K.W.; Rodriguez-Guzman, V.; Nugent, N.; Orchowski, L.M. #4645boricuas: Twitter reac-tions to the estimates of deaths by hurricane Maria in Puerto Rico. J. Community Psychol. 2020, 23. [Google Scholar] [CrossRef]
  32. Olteanu, A.; Castillo, C.; Diaz, F.; Kıcıman, E. Social Data: Biases, methodological pitfalls, and ethical boundaries. Front. Big Data 2019, 2, 13. [Google Scholar] [CrossRef] [Green Version]
  33. Jiang, Y.; Li, Z.; Ye, X. Understanding demographic and socioeconomic biases of geotagged Twitter users at the county level. Cartogr. Geogr. Inf. Sci. 2018, 46, 228–242. [Google Scholar] [CrossRef]
  34. Zou, L.; Lam, N.S.N.; Cai, H.; Qiang, Y. Mining Twitter data for improved understanding of disaster resilience. Ann. Am. Assoc. Geogr. 2018, 108, 1422–1441. [Google Scholar] [CrossRef]
  35. Zou, L.; Lam, N.S.N.; Shams, S.; Cai, H.; Meyer, M.A.; Yang, S.; Lee, K.; Park, S.J.; Reams, M.A. Social and geographical disparities in Twitter use during hurricane Harvey. Int. J. Digit. Earth 2019, 12, 1300–1318. [Google Scholar] [CrossRef]
  36. Wang, Z.; Lam, N.S.; Obradovich, N.; Ye, X. Are vulnerable communities digitally left behind in social responses to natural disasters? An evidence from Hurricane Sandy with Twitter data. Appl. Geogr. 2019, 108, 1–8. [Google Scholar] [CrossRef]
  37. Yuan, F.; Li, M.; Zhai, W.; Qi, B.; Liu, R. Social media based demographics analysis for understanding disaster response disparity. In Construction Research Congress 2020; American Society of Civil Engineers (ASCE): Tempe, AZ, USA, 2020; pp. 1020–1028. [Google Scholar]
  38. Samuels, R.; Taylor, J.E. Deepening the divide: Crises disproportionately silence vulnerable populations on social media. J. Manag. Eng. 2020, 36, 04020083. [Google Scholar] [CrossRef]
  39. Dargin, J.S.; Fan, C.; Mostafavi, A. Vulnerable populations and social media use in disasters: Uncovering the digital divide in three major U.S. hurricanes. Int. J. Disaster Risk Reduct. 2021, 54, 102043. [Google Scholar] [CrossRef]
  40. Wang, K.; Lam, N.; Zou, L.; Mihunov, V. Twitter use in hurricane isaac and its implications for disaster resilience. ISPRS Int. J. Geo Inf. 2021, 10, 116. [Google Scholar] [CrossRef]
  41. Fan, C.; Esparza, M.; Dargin, J.; Wu, F.; Oztekin, B.; Mostafavi, A. Spatial biases in crowdsourced data: Social media content attention concentrates on populous areas in disasters. Comput. Environ. Urban. Syst. 2020, 83, 101514. [Google Scholar] [CrossRef]
  42. China Meteorological Administration. China Meteorological Disaster Yearbook; Meteorological Press: Beijing, China, 2020. (In Chinese)
  43. Blei, D.M.; Ng, A.Y.; Jordan, M.I. Latent Dirichlet Allocation. J. Mach. Learn. Res. 2003, 3, 993–1022. [Google Scholar]
  44. Guo, Y.; Barnes, S.; Jia, Q. Mining meaning from online ratings and reviews: Tourist satisfaction analysis using latent Dirichlet allocation. Tour. Manag. 2017, 59, 467–483. [Google Scholar] [CrossRef] [Green Version]
  45. Chang, J.; Boyd-Graber, J.; Gerrish, S.; Wang, C.; Blei, D. Reading tea leaves: How humans interpret topic models. In Proceedings of the 22nd Advances in Neural Information Processing Systems, Vancouver, BC, Canada, 7–10 December 2009. [Google Scholar]
  46. Röder, M.; Both, A.; Hinneburg, A. Exploring the Space of Topic Coherence Measures. In Proceedings of the 8th ACM International Conference on Web Search and Data Mining, New York, NY, USA, 2–6 February 2015; pp. 399–408. [Google Scholar]
  47. Sievert, C.; Shirley, K. LDAvis: A method for visualizing and interpreting topics. In Proceedings of the Workshop on Interactive Language Learning, Visualization, and Interfaces, Baltimore, MD, USA, 27 June 2014; Association for Computational Linguistics: Stroudsburg, PA, USA, 2014; pp. 63–70. [Google Scholar]
  48. Fink, S. Crisis Management: Planning for the Inevitable; American Management Association: New York, NY, USA, 1986. [Google Scholar]
  49. Yuan, F.X.; Li, M.; Liu, R.; Zhai, W.; Qi, B. Social media for enhanced understanding of disaster resilience during hurricane Florence. Int. J. Inf. Manag. 2021, 57. [Google Scholar] [CrossRef]
  50. van Deursen, A.; van Dijk, J. The first-level digital divide shifts from inequalities in physical access to inequalities in material access. New Media Soc. 2019, 21, 354–375. [Google Scholar] [CrossRef] [PubMed] [Green Version]
  51. Deursen, A.J.A.M.; Helsper, E.; Eynon, R.; van Dijk, J.A.G.M. The compoundness and sequentiality of digital inequality. Int. J. Commun. 2017, 11, 452–473. [Google Scholar]
  52. Park, S. Digital inequalities in rural Australia: A double jeopardy of remoteness and social exclusion. J. Rural. Stud. 2017, 54, 399–407. [Google Scholar] [CrossRef]
Figure 1. The research framework.
Sustainability 13 07435 g001
Figure 2. Perplexity and coherence.
Sustainability 13 07435 g002
Figure 3. The resulting topic model (produced with LDAvis).
Sustainability 13 07435 g003
Figure 4. The evolution of each theme.
Sustainability 13 07435 g004
Figure 5. The spatial distribution of each theme. The color on the map reflects the percentage of each theme in all themes. The closer the color is to green, the closer the ratio is to 0%; the closer the color is to red, the closer the ratio is to 50%.
Sustainability 13 07435 g005
Table 1. List of socioeconomic variables.
AbbreviationVariableFormula of the Variable
Dependency RatioTotal dependency ratio, 2018 Dependency   Ratio = P 0 14 + P 65 + P 15 64 × 100 %
Education% population with a bachelor or a higher degree, 2018Proportion of population with bachelor degree and above
IncomeDisposable income per capita, 2018Residents’ disposable income refers to the sum of residents’ final consumption expenditure and savings.
Mobilephone% mobile Internet users, 2018The ratio of the number of mobile Internet users to the number of households
Unemploy% unemployed workforce, 2018Ratio of registered unemployed persons in urban areas to employed persons in urban units
FemaleRatioFemale ratio, 2018Ratio of female population to population
PctYoung% population 15 to 29 years old, 2010Percentage of population aged 15–29 years
PopDensityPopulation density, 2018population per square kilometer
Table 2. English translation of the labels in Chinese in Figure 3.
Chinese TermEnglish TermChinese TermEnglish TermChinese TermEnglish Term
视频video好好good哈哈哈ha-ha
希望hope中心center减弱weaken
过后aftereat风力wind force
take可怜pathetic这是this is
second中央气象台Central Meteorological Observatory搞笑humorous
登陆landinglick上班work
影响influence预警warning大树big tree
心疼distressed死亡deathwant
真的reallynumber清理clean
动物animal来袭hit停运suspension of traffic
Table 3. Keywords of each theme.
No.Name of ThemeKeywords of Theme
Theme 1General responseeat, want, work, ha-ha, feel, holiday, home, experience, hope, life, first time
Theme 2Urban transportationtree, clean up, ravaged, chaos, influence, bring, traffic police, community
Theme 3Typhoon status and impactlanding, impact, center, wind force, warning, weakening, release, expected, weather, out of service, suspension of traffic, suspension of school, flights
Theme 4Animals and humorous newsdistressed, animals, poor, good, humorous, memory, dog, cat
Table 4. Group statistics of thematic proportion.
ThemeGroupNMeanStd. DeviationStd. Error Mean
Urban transportationSeriously affected areas450.3450800.09629320.0143545
Moderately affected areas490.2671660.11541160.0164874
Typhoon status and impactSeriously affected areas400.1506930.05697790.0090090
Moderately affected areas410.2832180.12306790.0192200
Animals and humorous newsSeriously affected areas340.0881220.03228610.0055370
Moderately affected areas220.1685900.04324910.0092207
Table 5. Independent samples test of thematic proportion (theme 2—urban transportation).
HypothesisLevene’s Test for Equality of Variancest-Test for Equality of Means
FSig.tdfSig.
(Two-Tailed)
95% Confidence Interval of the Difference
Lower Upper
Equal variances assumed0.0140.906−3.537920.001−0.121666−0.034161
Equal variances not assumed −3.56491.1900.001−0.121336−0.034491
Table 6. Spearman correlations between the proportion of each theme and the eight variables.
Spearman Correlation General ResponseUrban TransportationTyphoon Status and ImpactAnimals and Humorous News
DependencyRatio0.125−0.1930.499 **0.608 **
Education0.229 *−0.440 **0.0840.507 **
Income−0.1370.076−0.555 **−0.574 **
Mobilephone−0.0630.315 **−0.605 **−0.621 **
Unemploy0.094−0.435 **0.417 **0.564 **
FemaleRatio0.146−0.450 **0.661 **0.787 **
PctYoung−0.1190.207 *−0.496 **−0.608 **
PopDensity−0.258 **0.177−0.485 **−0.560 **
* Correlation is significant at the 0.05 level (2-tailed). ** Correlation is significant at the 0.01 level (2-tailed).
Publisher’s Note: MDPI stays neutral with regard to jurisdictional claims in published maps and institutional affiliations.

