Article

Psychoacoustic Evaluation of Hydraulic Pumps

1
Institute for Fluid Power Drives and Systems (ifas), RWTH Aachen University, 52074 Aachen, Germany
2
Teaching and Research Area of Work and Engineering Psychology, Institute of Psychology (IfP), RWTH Aachen University, 52056 Aachen, Germany
*
Author to whom correspondence should be addressed.
Sustainability 2021, 13(13), 7320; https://doi.org/10.3390/su13137320
Submission received: 28 May 2021 / Revised: 21 June 2021 / Accepted: 24 June 2021 / Published: 30 June 2021
(This article belongs to the Special Issue Fluid Power Components and Systems)

Abstract

:
In this study, sound measurements of an axial piston pump and an internal gear pump were performed and subjective pleasantness judgements were collected in listening tests (to analyze the subjective pleasantness), which could be seen as the inverse of the subjective annoyance of hydraulic drives. Pumps are the dominant sound source in hydraulic systems. The noise generation of displacement machines is subject of current research. However, in this research only the sound pressure level (SPL) was considered. Psychoacoustic metrics give new possibilities to analyze the sound of hydraulic drive technology and to improve the sound quality. For this purpose, instrumental measurements of the acoustic and psychoacoustic parameters are evaluated for both pump types. The recorded sounds are played back to the participants in listening tests. Participants evaluate them regarding the subjective pleasantness by means of paired comparison, which is an indirect scaling method. The dependence of the subjective pleasantness on speed and pressure was analyzed for both pump types. Different regression analyses were carried out to predict the subjectively perceived pleasantness or annoyance of the pumps. Results show that a lower speed is the decisive operating parameter for reducing both the SPL and the annoyance of a hydraulic pump.

1. Motivation and Introduction

The electrification of mobile machinery is subject of current research. Construction machinery manufacturers presented the first electrified mobile work machines in the compact segment [1]. Hydraulic drive technology will still be an essential component for realizing the working movement. In the context of electrification, the noise of hydraulic drive technology, which was previously concealed by the noise level of the combustion engine, is becoming increasingly predominant in the generation of the working noise.
A study published by the WHO concludes that environmental noise is the source of various diseases, including sleep disorders and hypertension [2]. Noise is defined as a sound that is negatively evaluated by humans, impairs cognitive performance, and/or is detrimental to health. In fact, even sounds at moderate levels could be perceived as noise and can be considerably annoying. The perception of the annoyance or pleasantness, respectively, of a sound depends especially on its acoustic and psychoacoustic properties. Psychoacoustics include the subjective perception of physical acoustic events and is a branch of psychophysics [3].
Hydraulic pumps convert the mechanical energy from an electric motor or combustion engine to hydraulic energy; they can be found in almost all mobile machines. Pumps are the dominant sound source in hydraulic systems. Sound emission depends on the pump design and is subject of current research [4]. In previous work on sound emission of pumps, only the sound level was considered. Here, a physical measurement was considered without including the subjective perception or annoyance of the sound in the evaluation.
Zhang et al. [5] analyzed the sound quality of an axial piston pump in a pressure range up to 210 bar and rotational speeds between 1000 and 1800 rpm. The authors also used psychoacoustic metrics and listening tests to determine the subjectively perceived pleasantness. To predict the sound quality of the axial piston pump, a neural network was used. However, due to the upcoming switch, from the combustion engine to an electric drive motor, the rotational speed of the pumps will increase drastically. The sound pressure level (SPL), as well as the loudness, show a strong dependency on rotational speed. In addition, the electrification of the hydraulic system allows the usage of constant displacement pumps, for example internal gear pumps. Therefore, sound quality research at higher rotational speeds and with different types of displacement machines is necessary.
In this study, the acoustic and psychoacoustic properties of variable speed hydraulic drives were investigated. Therefore, the contribution to the subjectively perceived pleasantness or annoyance of the respective hydraulic drive was analyzed. Various acoustic and psychoacoustic measures could be instrumentally calculated (e.g., sound level, loudness, roughness, sharpness). There is still no model available, which predicts the subjectively perceived pleasantness or annoyance as an integral hedonic judgement based on such measurements.
The subjectively perceived annoyance of a product sound is highly product-specific. Hence, research from other technical areas cannot easily be transferred to hydraulic drive technology. In this study, sound measurements were performed on an axial piston pump and on an internal gear pump. The sound recordings were evaluated in listening tests with regard to pleasantness by participants. These subjective assessments of pleasantness were correlated with instrumentally measured acoustic and psychoacoustic sound characteristics. Finally, a model for the calculation of the perceived pleasantness or annoyance of hydraulic drives are presented.

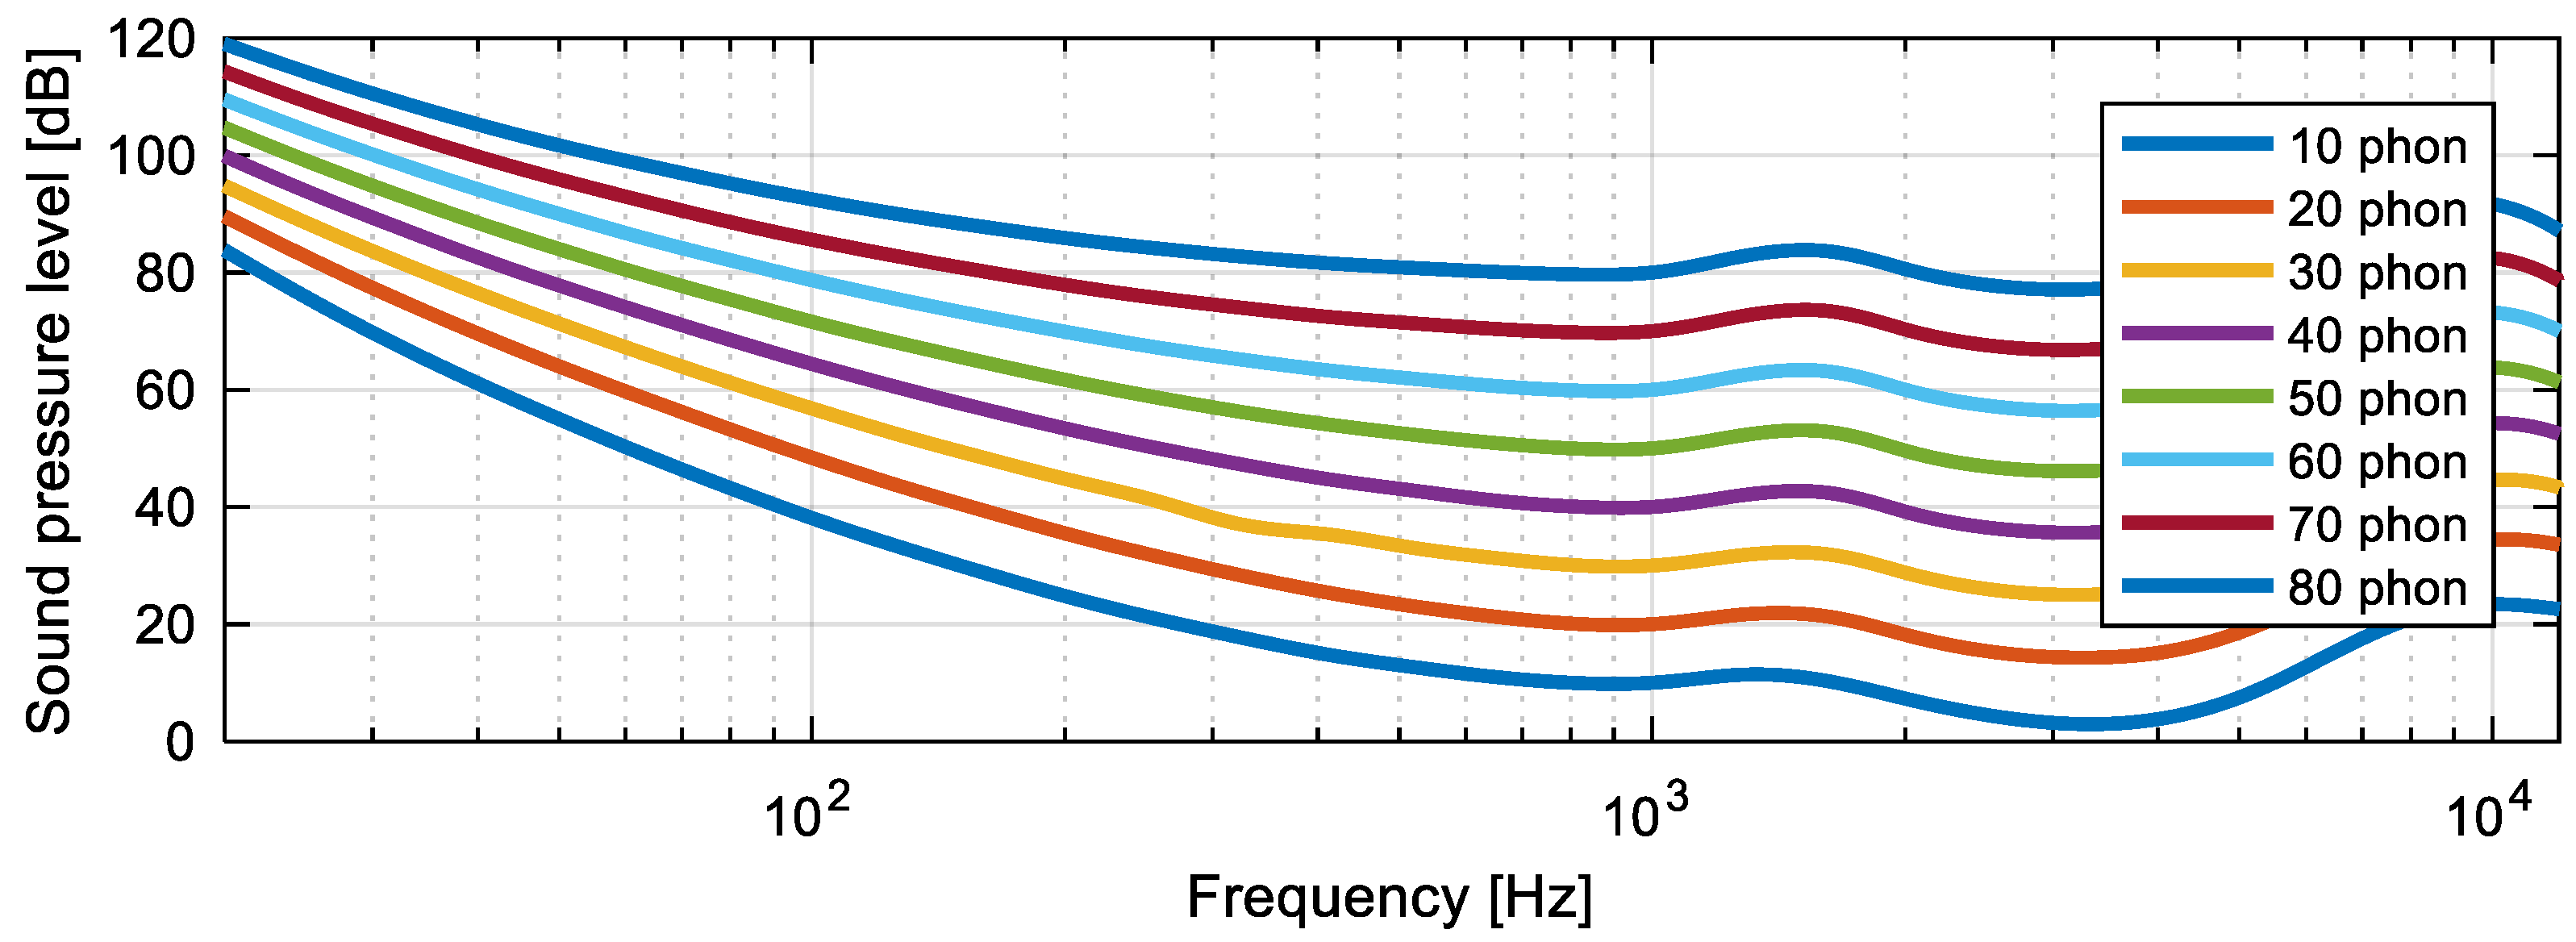
1.1. Basics of Acoustics and Psychoacoustics

Physically, airborne sound is a longitudinal wave propagating in the carrier medium air. The wave propagating causes a pressure fluctuation around the static ambient pressure. The human hearing is able to perceive pressure fluctuations in a range between 20 µPa and 200 Pa in a frequency range between 40 Hz and 20 kHz. The SPL is calculated as Lp according to Equation (1), from the effective sound pressure p in relation to the reference sound pressure p0. The SPL is expressed in dB. For airborne sound, the reference SPL is p0 = 20 µPa, equivalent to the human hearing threshold [6].
SPL :   L p = 10   l g p 2 p 0 2 = 20   l g p p 0   [ dB ]
Due to the anatomy of the human ear, the perception of sound level is not only dependent on the SPL. It also depends on the frequency of the sound. Figure 1 shows equal loudness curves, called isophones, according to DIN ISO 226 [7], over the frequency. The isophone is given in phon and is defined such that it is equivalent to the SPL at a frequency of 1 kHz. Along an isophone, a sound is perceived as equally loud. Especially at lower frequencies, a much higher SPL is required compared to a sound at 1 kHz, for the sound to be perceived as equally loud by humans. The A-weighting of the SPL [dB(A)] is used to take this frequency dependence of the loudness perception of the human ear into account. It is often used to indicate the loudness of the noise emission of technical products and machines or the immissions to which humans are exposed.
In addition to the sound pressure, which is considered in classical acoustics, sounds have further characteristics, which are auditory-perceptively perceived by human listeners. Psychoacoustic models are based on empirical investigations. They describe the relationship between acoustic stimulus and human perception. Studies have shown that the subjective perception of a sound event on the dimension loud–quiet is better predicted by the psychoacoustic quantity loudness than by the A-weighted SPL [3].
In acoustics, physical parameters usually use a logarithmic scale, e.g., the SPL in dB. However, psychoacoustic parameters often use a linear scale to human perception [8]. The calculation of the loudness N according to Zwicker is defined in DIN 45631 and is given in sone [9]. For example, a sound with a loudness of 2 sone is evaluated as twice as loud as a sound with a loudness of 1 sone. The loudness includes the SPL, the frequency, the time course, as well as masking effects of a sound event [10]. The human auditory system summarizes sound stimuli that are close to each other with respect to their frequency into frequency bands, also called critical bands. Lined up, a frequency scale of 24 critical bands with the unit [Bark] results (see Zwicker [11,12,13]). Therefore, the width of a frequency band corresponds to 1 Bark and refers to the tonality z, which is an alternative scale for the frequency. The loudness is calculated according to Equation (2) as an integral of the specific loudness N′ [sone/Bark] over the tonality for all critical bands [13,14].
N = 0 24   B a r k N d z [ s o n e ]
Accordingly, to Fastl and Zwicker, the specific loudness can be calculated by Equation (3). E is the excitation of the sound. In addition, ETQ as well as E0 are used in the calculation of the specific loudness. ETQ is the excitation at threshold in quiet. E0 correspond to the reference intensity I0 [13]. For further information about the calculation of the specific loudness and the derivation of Equation (3) for example [13] can be used.
N = 0.08   ( E T Q E 0 ) 0.23 [ ( 0.5 + 0.5   E E T Q ) 0.23 1 ]   s o n e B a r k
The loudness can be converted to the isophones LN using Equations (4) and (5) [15].
L N = 40 + 33.22 log ( N )   [ p h o n ]   f o r   N > 1   s o n e
L N = 40   ( N + 0.0005 ) 2   [ p h o n ]   f o r   N < 1   s o n e
In the following example, the loudness of two measured broadband sound recordings with a fictitious sound of 1 kHz is compared. All three sounds have a SPL of 58.5 dB. The two broadband sounds are an axial piston pump and an internal gear pump, which operate at different operating points. Figure 2 shows the distribution of the SPL over frequency for the third-octave frequencies from 25 Hz to 12.5 kHz.
In Figure 3 the calculated specific loudness is plotted over the tonality. The loudness of the sounds corresponds to the area below the gradients. The determined loudness for the sound at 1 kHz is N1kHz = 3.15 sone, while the axial piston pump (APP) with a loudness of NAPP = 9.50 sone and the internal gear pump (IGP) with a loudness of NIGP = 9.83 sone are perceived more than three times as loud by humans.
The consideration of masking effects in the determination of the loudness is shown very well in the graphical determination of the 1 kHz sound. The specific loudness rises sharply at the threshold of 8 bark. The critical band rate for a frequency of 1 kHz is 8.5 bark [13]. The masking effect is taken into account at second edge of the specific loudness. There, the specific loudness decreases slowly. Accordingly, sound components with lower amplitude and higher frequency, which will be masked by the 1 kHz sound, are also taken into account in the calculation.
In addition, the sharpness is also considered as a further psychoacoustic parameter. The sharpness S describes the perception of high-frequency components of a sound. As the high-frequency components of a sound increase, they are increasingly perceived by humans as aggressive and annoying [16]. The method for calculation is described in DIN 45692. The sharpness will be measured in the unit acum [17]. It is calculated according to Equation (6). k is the normalization constant for scaling a reference sound to 1 acum and usually assumes values between 0.105 ≤ k < 0.115. High-frequency sound components are weighted more strongly than low-frequency components. Therefore, the weighting function g(z) is used. The weighting function can be calculated according to Equations (7) and (8) [17] and increases exponentially for high frequencies, see Figure 4.
S = k N   0 24   B a r k N ( z )   g ( z ) z B a r k   d z [ a c u m ]
g ( z ) = 1                                                         f o r   z 15.8   B a r k
g ( z ) = 0.15   e 0.42   ( z B a r k 15.8 ) + 0.85           f o r   z > 15.8   B a r k
Studies have shown that the perception of sharpness corresponds well with the calculated sharpness according to Equation (6). The perception of sharpness is mainly influenced by the spectral composition and the central frequency of the sound. The perception of sharpness increases drastically with increasing central frequency. Therefore, the calculation model of the sharpness in Equation (5) uses a weighting function, which has the value of one for low tonality [13]. In order to consider the spectral composition of the sound, the loudness is used for the calculation model of the sharpness.

1.2. Noise Generation in Hydraulic Systems

In hydraulic systems, three types of sound can be differentiated: structure-borne, airborne and fluid-borne sound. The sound types propagate in their corresponding media and interact at the phase boundaries, where they are converted into each other. When considering hydraulic systems, the interactions between fluid and structure-borne sound within the system as well as the conversion of structure-borne sound into airborne sound at the system boundaries are relevant. Fluid-borne noise can propagate through other hydraulic components and thus lead to airborne noise at locations outside the pump [18].
In axial piston pumps, as exemplarily shown in Figure 5 (top), structure-borne noise occurs due to the change of the displacement chamber between the high and low pressure sides. Pulsating forces are generated, which cause vibration on the component structure [18,19]. The calculation of Schoemacker shows that the swivel torque at the swash plate of an axial piston pump periodically oscillates with twice the number of pistons and thus causes a movement of the swash plate [20]. The kinematic relationships in an internal gear pump also result in a periodic force excitation of the gears; see Figure 5 (bottom). Additionally, the internal forces and their mechanical coupling to the housing structure are depicted in Figure 5. The transmission of vibrations between components as well as between components and fluid are simplified as a spring-damper model. Due to the internal alternating forces as well as the pressure pulsation, dynamic bearing forces occur and excite the housing structure of the pump. The structure-borne sound results in airborne noise, which is perceived by humans.
Fluid-borne sound is caused by the pressure pulsations inside the fluid, when switching between high and low pressure (with a finite number of displacement chambers), by cavitation and unsteady flow forces. However, the latter causes play a minor role in sound generation. Pressure pulsations [18,19] are mainly responsible for the development of fluid-borne sound.
A fast Fourier transform (FFT) visualizes the dominant excitation frequencies of both pump types. Figure 6 shows the normalized FFT of the SPL for an internal gear pump and an axial piston pump at a rotational speed of 1000 min−1. The load pressure is 250 bar. However, the dominant excitation frequencies depend on the rotational speed n and on the number of displacers z. For the axial piston pump, z is equal to the number of pistons. In this case, a pump with nine pistons is used. For the internal gear pump, z1 is the number of teeth of the external gear, which is the driving gear, and z2 the number of teeth of the internal gear, which is the driven gear. For the internal gear pump, the number of teeth of the external gear is z1 = 13 and for the internal gear z2 = 19. Figure 6 shows a good correlation between the number of displacers and the dominant excitation frequencies.
Figure 7 shows the normalized FFT of the SPL for an internal gear pump and an axial piston pump at a rotational speed of 3000 min−1. The load pressure is equal to Figure 6. The dominant excitation frequencies still correlate with the number of displacers and the rotational speed. Due to the higher rotational speed, there is a shift to higher frequencies. Both diagrams illustrate the impact of the mechanical kinematic effects inside the pump on the pressure sound level, which are sketched in Figure 5.
Methods to minimize noise emissions can be divided into primary and secondary methods. The primary methods try to prevent or minimize the noise generation directly at the source, e.g., by modified pressure grooves and reduction of pressure pulsations and cavitation. Secondary methods reduce the transmission of already generated sound from the source to the receiver. Examples are the use of sound-absorbing materials, load transfer via internal parts, pulsation-reducing elements, and the encapsulation of sound-emitting elements [21].
So far, the fundamentals of noise generation in hydraulic pumps are shown. In the last decades, much effort was spent to reduce the noise emission of pumps or to increase the understanding of noise generation [4,22,23,24,25,26,27,28,29,30,31,32,33,34,35,36]. However, the presented study is about a psychoacoustic evaluation of hydraulic pumps, which have not been subject of research activities. The psychoacoustic evaluation of hydraulic pumps is a new approach of considering the noise emission in hydraulic drive technology.

2. Materials and Methods

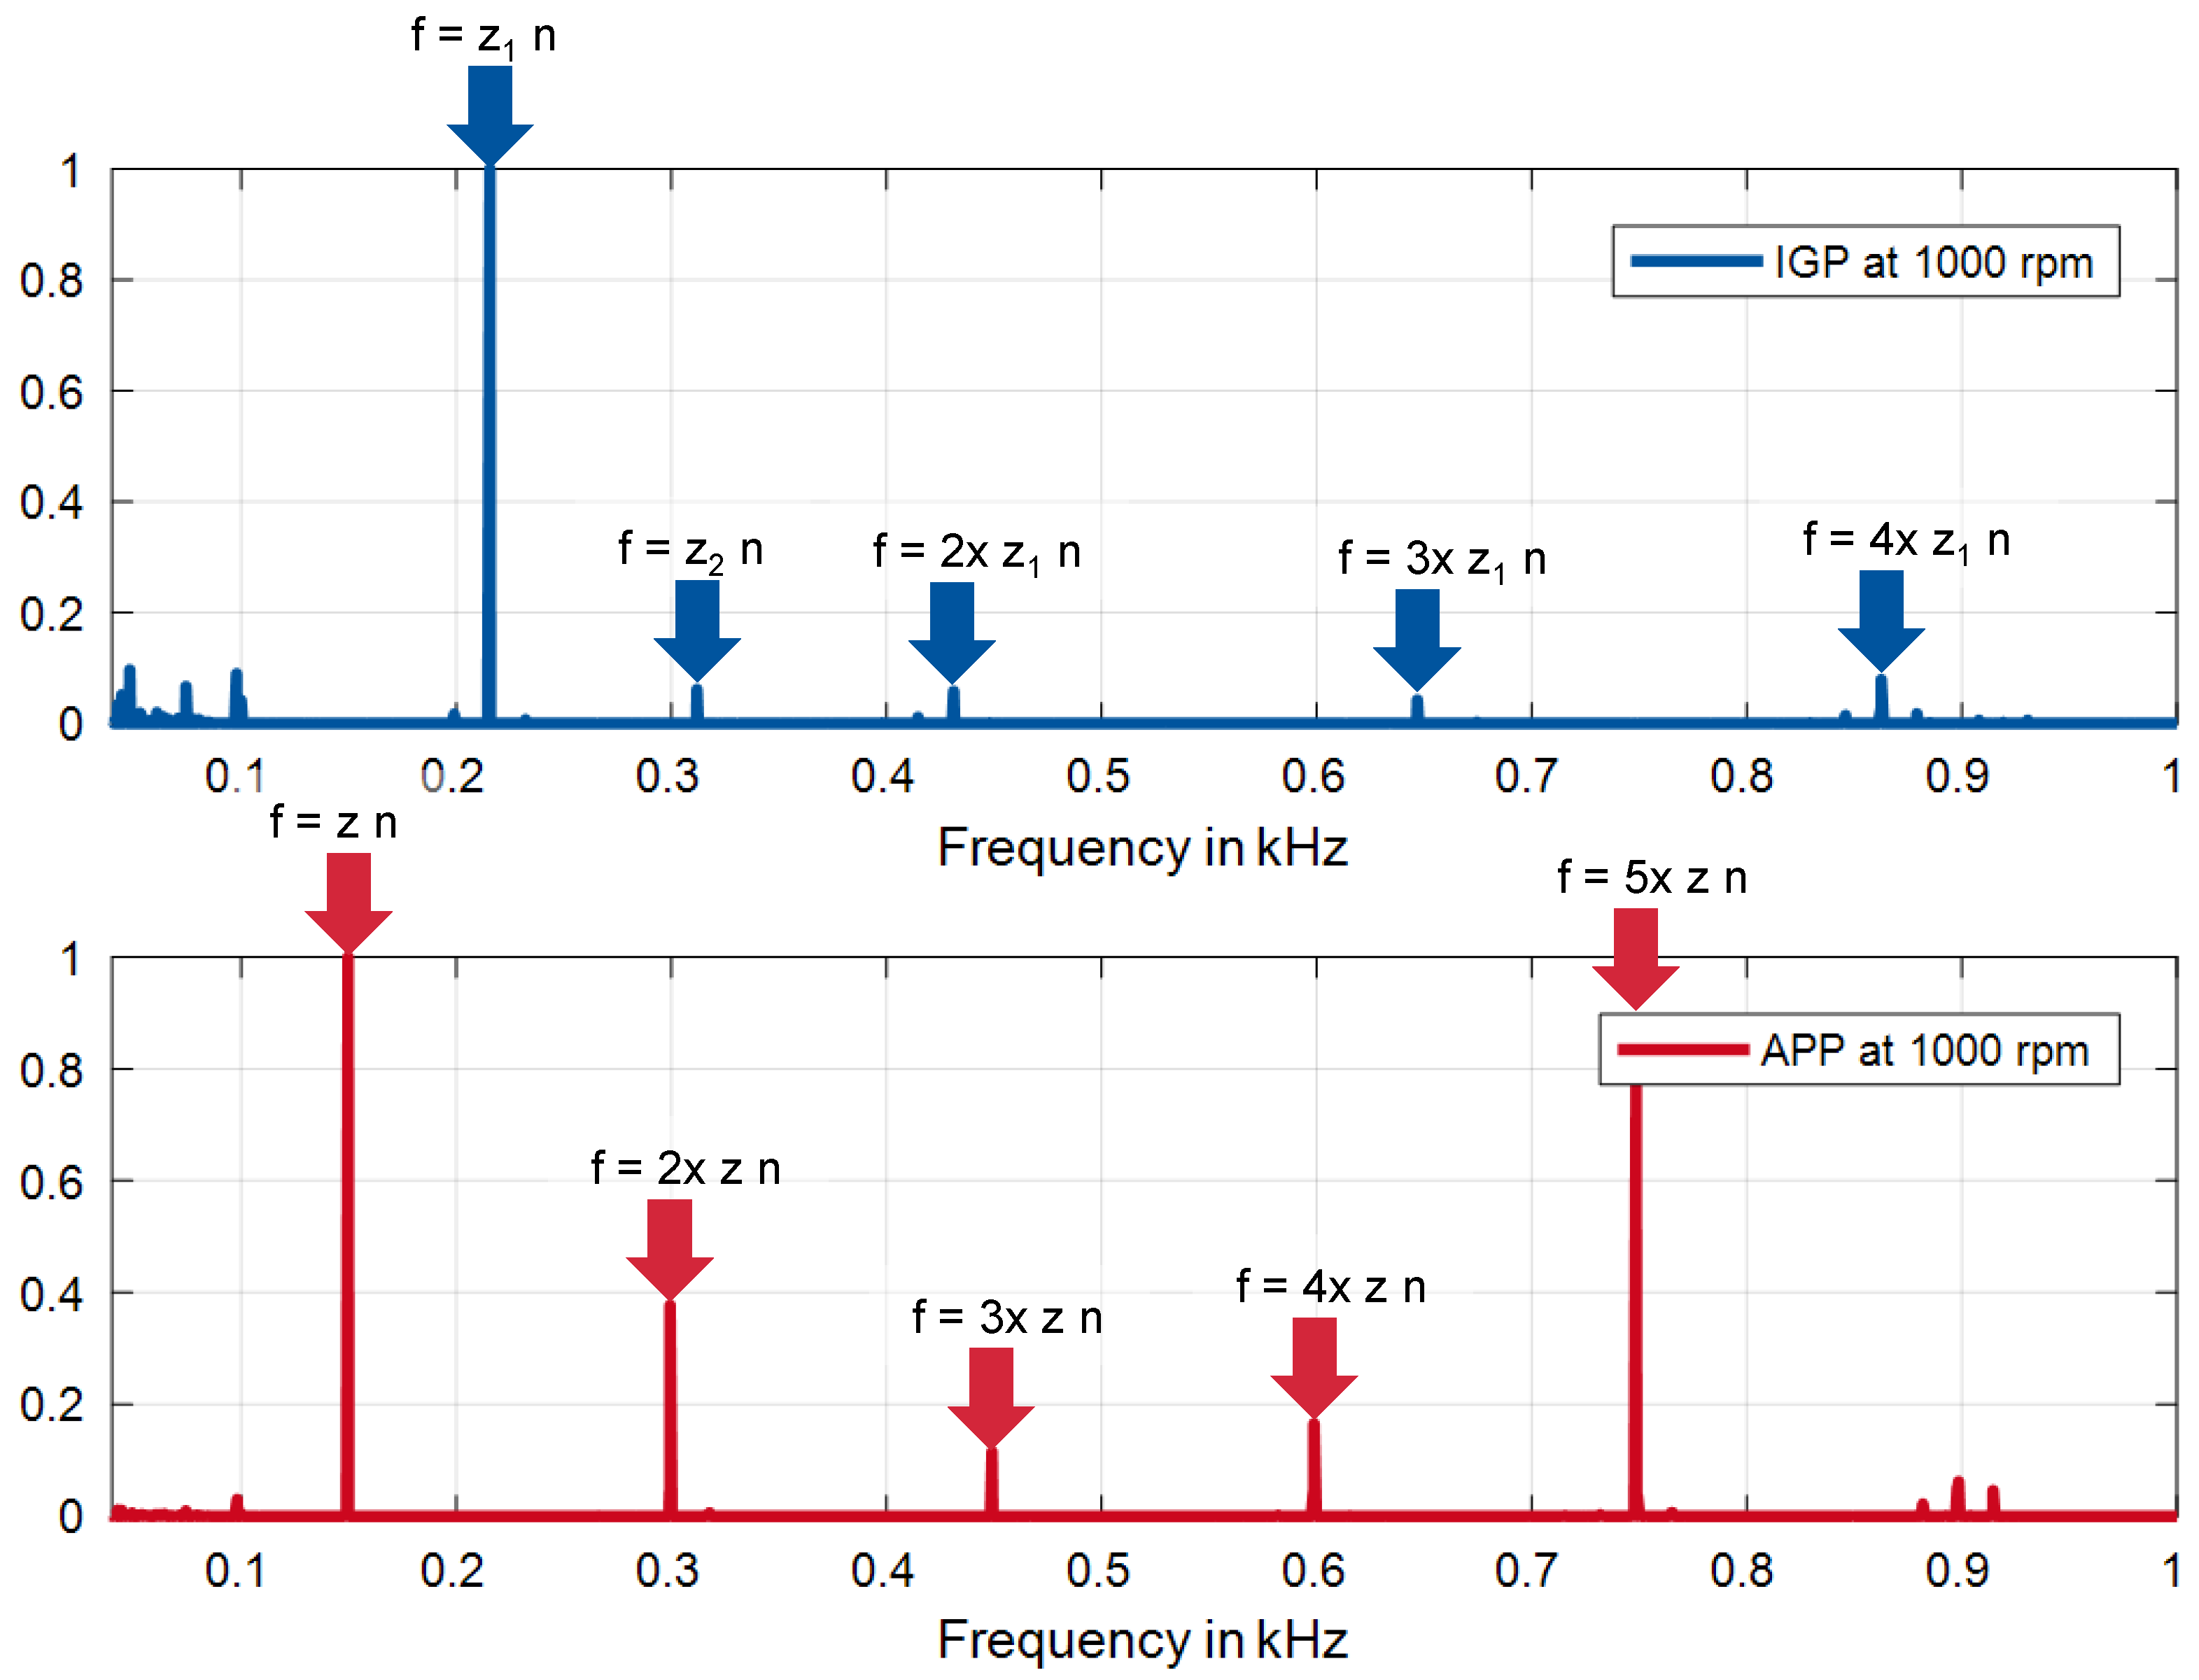
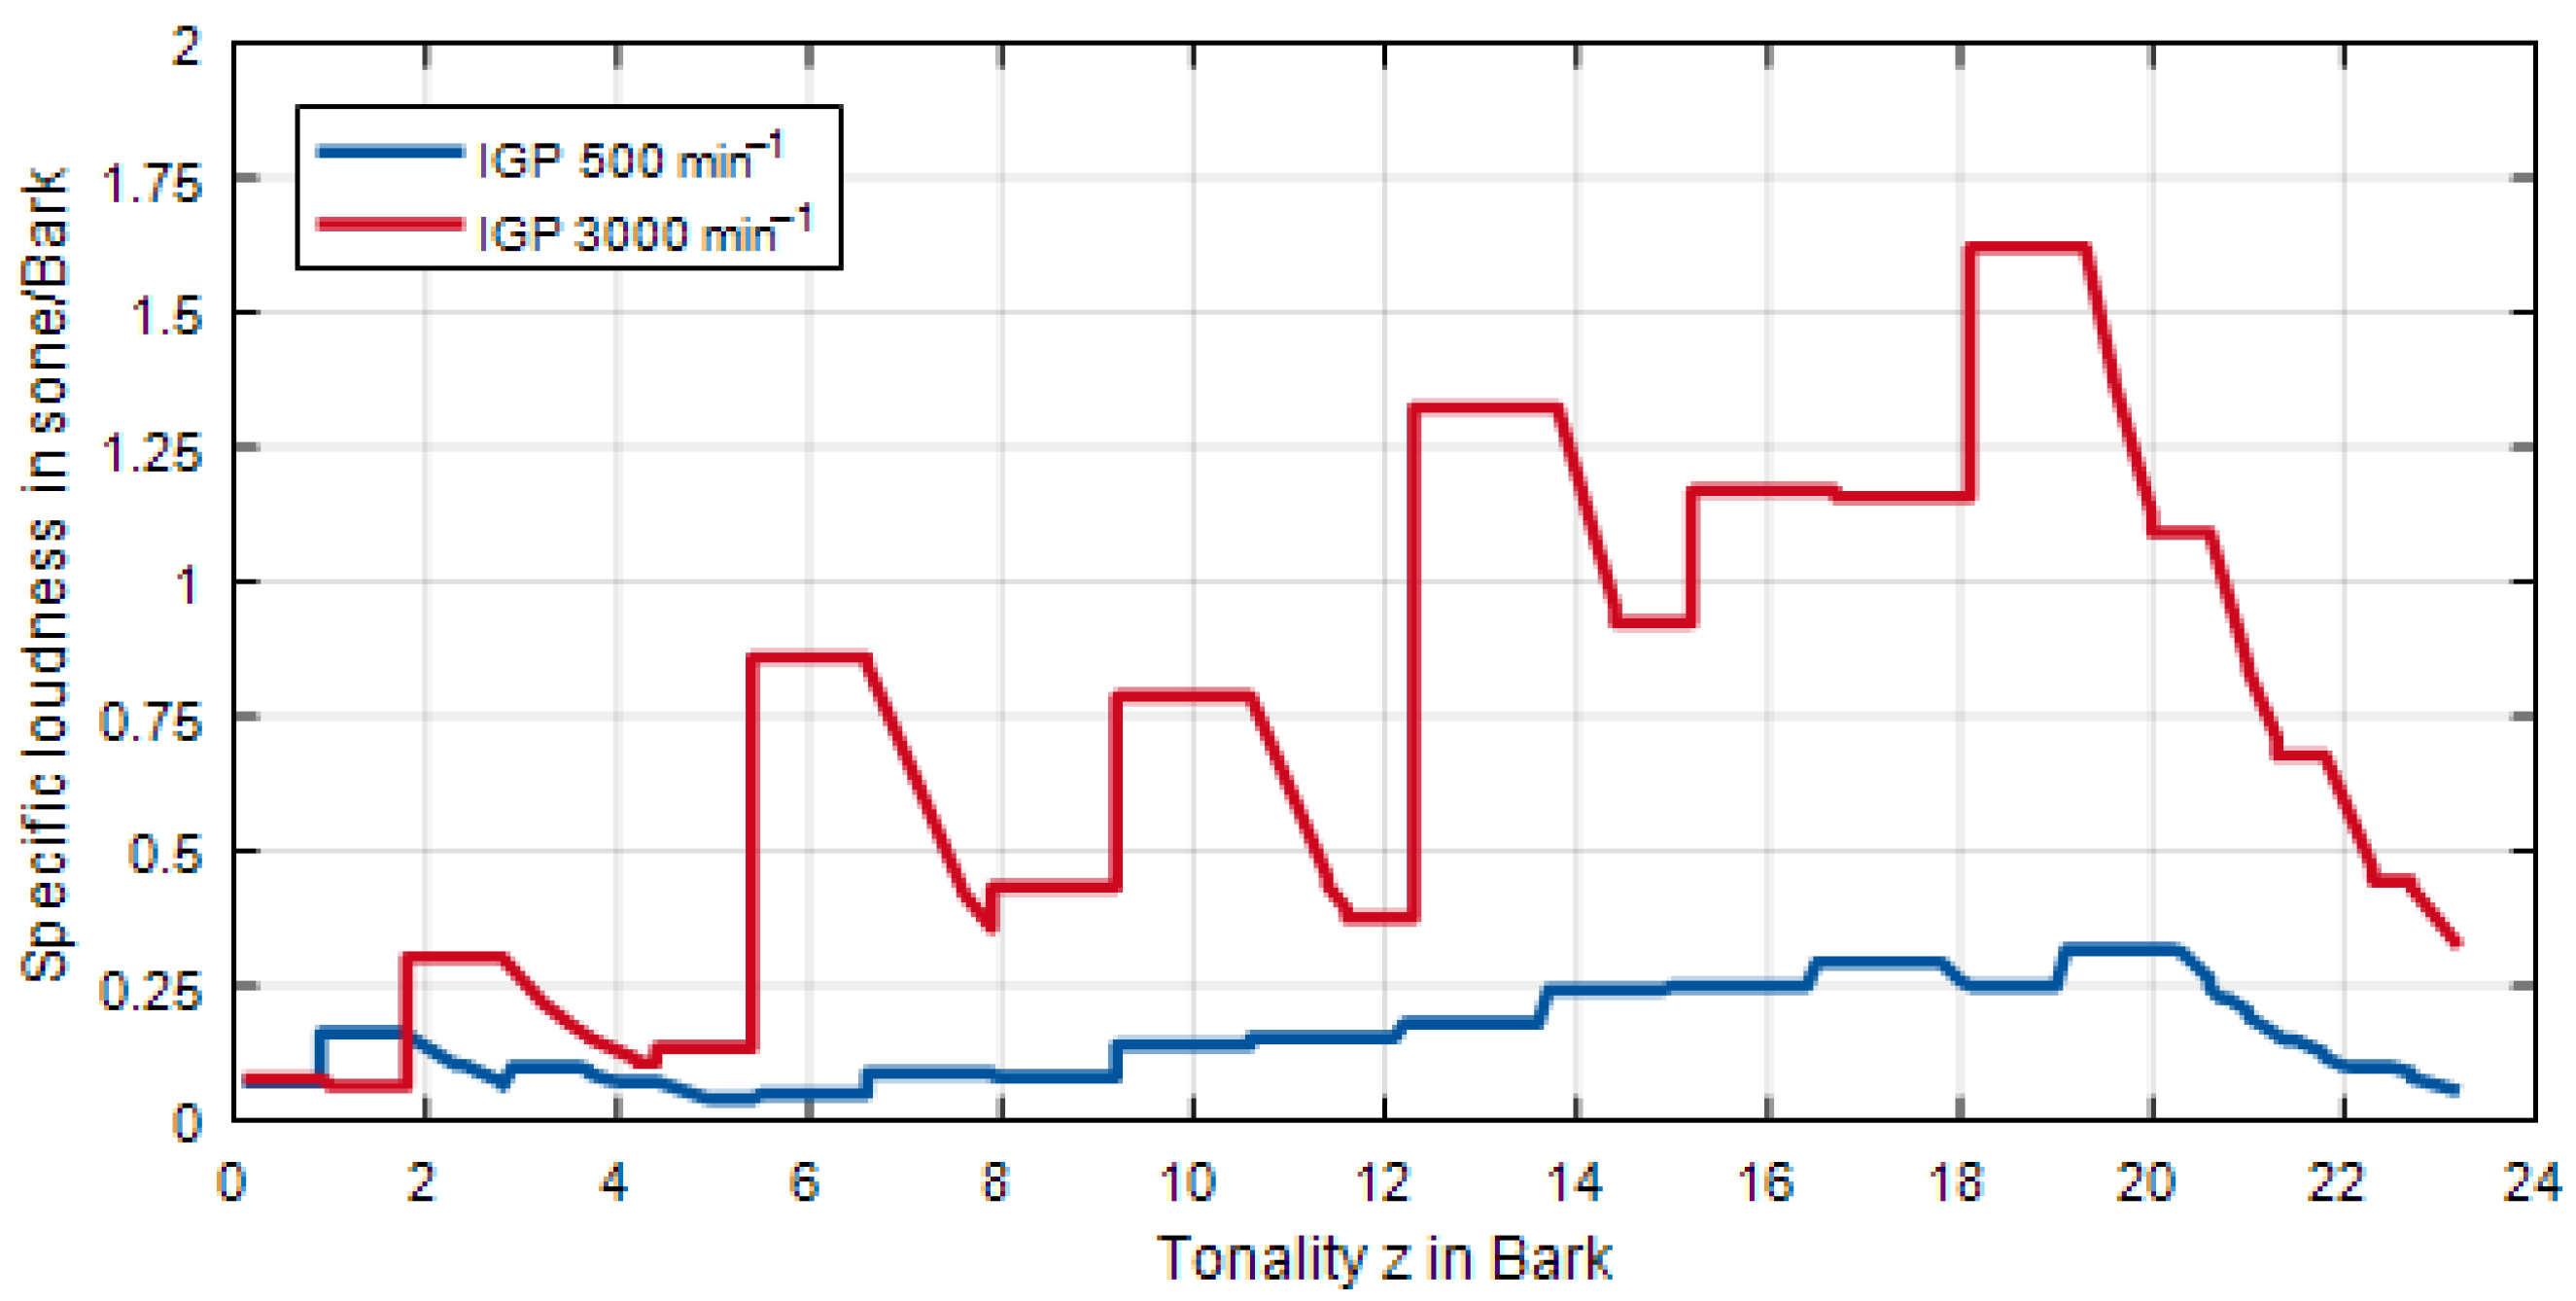
Instrumental Measurement of an Axial Piston Pump and an Internal Gear Pump

In this study, an axial piston pump in swash plate design and an internal gear pump are instrumentally measured in an anechoic chamber. Both pumps are specified by the manufacturer with a geometrical displacement of 20 cm³. For the measurement on the adjustable axial piston pump, the pressure controller is set to a pressure value above the maximum load pressure of 250 bar. Thus, the displacement of the axial piston pump is at its maximum. The speed is varied between 500 min−1 and 3500 min−1 in steps of 500 min−1. The load pressure is set between 50 bar and 250 bar, in steps of 50 bar, via a proportional directional valve. Each operating point is held for at least 60 s before the sound recording is started. The sound was recorded for another 60 s. The measurements are performed with an HLP 46, at temperatures between 50 °C and 64 °C. The temperature of the fluid increases especially at high speed and high load pressure due to the high cooling requirement. Figure 8 shows the simplified schematic hydraulic circuit used for the measurements. The main components of the drive chamber are the electric drive motor and the hydraulic infrastructure, including a proportional directional valve to apply the pressure. The separation between the pump and the drive is achieved by the anechoic chamber.
Figure 9 shows the arrangement of the microphones in the anechoic chamber. The electric drive motor and the hydraulic infrastructure are acoustically separated from the anechoic chamber. In total, six microphones are used for the sound recording of the pumps. Five microphones are arranged in a semi-circle with a distance of 1.5 m around the pump. Another microphone is located at the top, also at a diagonal distance of 1.5 m from the pump.
The instrumental measurements of the sound recordings included the A-weighted SPL as well as the psychoacoustics parameters loudness and sharpness. The Siemens LMS SCADAS Mobile type SCM202 data acquisition system in combination with six G.R.A.S. 46AE 1/2″ microphones were used. For further evaluation, microphone no. 4 was used, which was arranged in alignment to the drive shaft, see Figure 9. The SPL, according to the A-weighting, the loudness and sharpness were averaged over the recording duration for each operating point, i.e., pressure and speed, and then normalized. A qualitative comparability between the two pump designs is maintained. In the following, the results of the instrumental measurements are presented and discussed.
Figure 10 shows the normalized SPL (A-weighted) over speed and pressure for the axial piston pump and the internal gear pump. A direct comparison of the two types shows that the level of the SPL for the internal gear pump is significantly lower. At the operating point 3000 min−1/250 bar, the A-weighted SPL of the internal gear pump is about 10% lower than the A-weighted SPL of the axial piston pump. For both pumps, the SPL increases with increasing speed and pressure. The effect of the rotational speed on the SPL has to be considered higher.
Figure 11 shows the normalized loudness according to Zwicker over speed and pressure for the axial piston pump and the internal gear pump. The loudness also shows a dependence of speed and pressure, with the speed dependency being predominant. At the operating point 3000 min−1/250 bar, the loudness of the internal gear pump is about 30% lower than the loudness of the axial piston pump.
Figure 12 shows the normalized sharpness over speed and pressure for the axial piston pump and the internal gear pump. The maximum value of the measured sharpness, to which the maps are normalized, occurs for the internal gear pump. A clear tendency of the sharpness distribution over pressure and speed cannot be determined for either pump type. The interpretation of the sharpness is very difficult, because there is no obvious dependency of the sharpness on pressure or rotational speed in the measured data. It should be noted that the general level of sharpness is very high over all operation points. Accordingly, pump noises are obviously characterized by high-frequency sound components.
The sharpness does not increase with increasing speed. That is contrary to expectations, because theoretically an increasing speed is accompanied by higher-frequencies. A possible explanation for this is that the loudness is used to calculate the sharpness (see Equation (6)). Figure 13 shows the specific loudness of the internal gear pump for two different speeds at the same load pressure. The normalized sharpness (Figure 12) is comparable for both sounds (about 0.91). The area below the curves (corresponding to the loudness) also increases with increasing speed and no significant shift to higher frequencies (higher tonality) takes place. Therefore, the sharpness evaluation of both sounds is comparable. As mentioned before, the spectral composition and the central frequency are the main influences on the sharpness.

3. Analysis of Results

3.1. Listening Tests to Determine the Subjectively Perceived Pleasantness or Annoyance

In the second part of the study, the sound recordings were used in a listening test to determine the subjectively perceived pleasantness or annoyance as a function of pump type and operating point (rotational speed and pressure). For this, 20 participants (55% female) aged between 18 and 40 years (M = 24 years, SD = 6 years) participated in the listening tests. All reported normal hearing. The sound recordings were presented to the participants via a Focusrite Scarlett 2i2 audio interface using Sennheiser HD 650 headphones in a soundproof chamber of the Teaching and Research Area of Work and Engineering Psychology. To determine the subjectively perceived pleasantness or annoyance of the sounds, the so-called paired-comparison method, an indirect scaling method, was used [37]. Here, the various sound recordings were played back to each participant in pairs. Participants had to decide on which of the two stimuli was characterized more by the attribute of interest (here: pleasantness), i.e., which stimulus dominated the other. The judgement of pleasantness corresponded inverted to the judgement of annoyance. All possible pair combinations of the realized operating parameters for hydraulics and psychoacoustics within one pump and between both pumps are presented for subjective evaluation. Figure 14 shows the graphical user interface (GUI) to determine the subjectively perceived pleasantness by paired comparisons.
In the first step of data analysis, we counted, for each sound pair, how many participants preferred one sound to the other in the paired comparisons. The results of the preference counts are depicted in terms of so-called preference matrices in Figure 15 for the axial piston pump and the internal gear pump. Please note that this figure only depicts the results of the sound pairings, where the two sounds to be compared came from the same pump type. The results for the sound pairings with sounds from different pump types are depicted in the full preference matrix in Appendix A.
The numbers in the matrices shown in Figure 15 correspond to the number of participants who preferred the sound recording of the respective row in the paired comparisons to the sound recording in the respective column. The maximum possible preference of 20, due to the 20 participants taking part in this listening experiment. The matrices are shown in full, although the number of preferences for one sound of a pair is inverse to the number of preferences for the other sound of the respective pair. For example, 16 participants preferred in the case of the axial piston pump the sound at the operation point (500 rpm, 150 bar) to the sound at the operation point (500 rpm, 200 bar), while the remaining four participants judged the other way around. The color-coding of the preference counts in Figure 15 already suggests that, for these two pump types, the rotational speed is particularly decisive for the preference judgement. Before we test this statistically, by means of regression analyses in the following section, we use the preference counts per sound condition to calculate so-called priority vectors. These can be compared directly with each other and thus allow a direct comparison of the two pump types and the different operating points on a common scale in regards to subjective pleasantness or annoyance.
To allow a comparison between the two pump types with regard to subjective preference, we took into account all paired comparisons for the calculation of the priority vectors; i.e., both the sound pairings in which sounds originate from the same pump and the sound pairings in which sounds from different pumps were presented for evaluation (see Appendix A).
Priority vectors were derived from the full paired-comparison data by the Analytic Hierarchy Process (AHP) method (cp. e.g., [38]). Namely, the preference counts of each of the 18 sounds—2 (pump) × 3 (rotational speed) × 3 (load pressure)—were used to derive normalized rank values for the respective sound condition. Therefore, in each row, the sounds were assigned rank values from 2 to 18, with an increasing number of participants who preferred the respective sound. That is, the sound with the lowest preference count was given a 2, and the sound with the highest preference count was given an 18. If several sounds reached the same preference count, they were also assigned the same rank. At the same time, in the respective column, the non-preferred sound of a sound pairing was assigned the corresponding reciprocal value, e.g., 1/2, 1/18. Then, the rank values were summarized per row. This line total was divided by the sum of all line totals, which resulted in the priority vector for the respective row of the preference matrix and, thus, for the respective sound condition. The priority vector of a sound condition can therefore be interpreted as a normalized rank value, where all priority vectors add up to a sum of 1.
Figure 16 depicts the priority vectors of the two pumps at all tested operation points. The sounds of the internal gear pump reached higher preference values, indicating that the sounds of this pump were generally preferred to that of the axial piston pump. In this case, the internal gear pump was considered more pleasant and, thus, less annoying. However, for both types of pumps, the subjective pleasantness decreased with increasing speed; vice versa, the subjectively perceived annoyance increased with increasing speed.
How A-weighted SPL and the above-considered psychoacoustic measures are related to the assessment of pleasantness or annoyance cannot be told from Figure 16. This can be clarified by means of the regression analyses presented in the following. These regression analyses establish a connection between the subjective judgements of pleasantness or annoyance on the one hand and pump type, operating condition, and psychoacoustic parameters on the other hand.

3.2. Regression Analyses to Predict the Subjectively Perceived Pleasantness or Annoyance

In the third part of the study, regression analyses were used to determine the extent to which the subjective judgements of pleasantness or annoyance as an integral hedonic judgement could be predicted (A) from the pump type and operating condition, and (B) from the instrumentally determined acoustic and psychoacoustic measurements. Before the specific analyses are presented, a brief introduction of the method of regression analysis is given.
In general, regression analyses are used to test statistically to what extent a single target variable—the so-called criterion variable—can be predicted from a set of predictor variables. In the present study, the criterion variable is the pleasantness judgement, and the predictor variables are operating condition, pump type, and/or (psycho-)acoustic parameters. Thereby, different statistical parameters are obtained, two of which are of special interest in the context of this study.
Firstly, these are the regression coefficients of the predictor variables. These indicate the respective contribution of a predictor variable to the variations of the criterion variable—in this case, the pleasantness judgments in terms of priority vectors. The higher the value of a regression coefficient, the greater the contribution or relevance of the corresponding predictor variable to the criterion. The algebraic sign of the regression coefficient indicates whether the relationship of the corresponding predictor variable and the criterion is positive (same direction, i.e., the more, the more) or negative (opposite direction, i.e., the less, the more). Regression coefficients can be specified in two different forms. The unstandardized regression coefficient B indicates by how many units the value of the criterion variable increases or decreases when the predictor variable increases by one unit. Since unstandardized regression coefficients cannot be directly compared with each other if the scaling of the predictor variables differs, standardized regression coefficients β are often calculated. These can be directly compared with each other because the standardization removes the scaling of the individual predictor variables. Besides the purely descriptive information content of a regression coefficient, it can be tested for statistical significance, and the test result is indicated by the so-called p-value. If the t-test usually used for this purpose results in p is <0.05, it can be assumed that the contribution of the predictor variable contributes non-randomly to the prediction of the criterion variable; it is therefore “significant”. At the same time, a predictor variable can be removed from the regression equation without significant losses in model performance if the corresponding regression coefficient is found to be statistically non-significant.
Secondly, the amount of the so-called “explained variance” is of interest as a further characteristic of a regression model. The criterion variable (here priority vectors) shows a certain variation. Not all participants report the exact same subjective judgements about the sounds to be assessed. Within the framework of regression analysis, the question arises as to how much of these variations (i.e., the total variance of the priority vectors) can be modeled (elucidated) by the regression equation and thus by the included predictor variables. Here, the measure R² indicates the proportion of the total variance that can be explained. Whether this proportion is significant (more than just random) compared to the simplest possible prediction model (namely the criterion’s mean) is checked by means of the F-test, which is considered significant in the case of p < 0.05.
Within the context of the present study, regression analyses were used to examine the extent to which the subjective judgements of pleasantness can be explained (A) from pump type (dichotomous variable: axial piston pump vs. internal gear pump) and operating conditions (rotational speed, load pressure), and (B) by the instrumentally determined acoustic and psychoacoustic measures (A-weighted SPL, loudness, sharpness). Since the SPL proves to be particularly important here, it is finally examined in (C) to what extent this acoustic measure can be predicted by pump type, rotational speed, and load pressure. In all reported multiple linear regressions, we used the forced entry method, in which all predictor variables are forced into the regression model simultaneously. Note that the subjective pleasantness of a sound condition is represented by the respective priority vector. Thus, the above-calculated 18 priority vectors represent the criterion variable in all reported regressions.
(A) The linear regression of the priority vectors from the predictor variables pump type, rotational speed, and load pressure is shown in Equation (9); the respective statistical indicators are dissected in Table 1.
priority vector = 0.47 pump type − 0.84 speed − 0.09 pressure
Overall, 93% of the total variance can be explained with this linear model (R² = 0.93, F(3, 14) = 63.86, p < 0.001). The standardized regressions coefficients (β) in Table 1 indicate that rotational speed is more decisive for subjective pleasantness than the pump type although the latter also plays a statistically significant role in the regression model. Load pressure, however, does not significantly contribute to the prediction of priority vectors and thus of subjective pleasantness or annoyance. The impact of the two significant predictor variables on the criterion variable is visualized in Figure 17. The figure indicates that lower rotational speeds are experienced as more pleasant, and vice versa, as less annoying. This applies to both pump types, whereby the internal gear pump achieves higher priority vectors at the same rotational speed, and is thus subjectively perceived as more pleasant than the axial piston pump.
(B) The 18 pump sounds in the present study were derived by varying pump type, rotational speed, and load pressure, but not from controlled variations of acoustic or psychoacoustic sound characteristics. Thus, the latter had to be checked on being correlated to each other before simultaneous consideration in one regression analysis. This is due to the statistical problem that regression coefficients for strongly correlated predictor variables cannot be reliably estimated, i.e., if the multicollinearity of the predictor variables is too high. In fact, SPL and loudness correlated significantly for the sounds examined in this study (r = 0.98, p < 0.001) while sharpness did not correlate significantly with either SPL (r = 0.39, p = 0.11) or loudness (r = 0.36, p = 0.14).
Thus, we decided to calculate two regression models with one model predicting priority vectors—and thus subjective pleasantness—from SPL and sharpness, while the other model used loudness and sharpness. However, both models resolve almost the same amount of total variance: the model with SPL and sharpness accounts for 97% of total variance (R² = 0.97, F(2, 15) = 262.12, p < 0.001), the model with loudness and sharpness for 96% (R² = 0.96, F(2, 15) = 180.45, p < 0.001). Correspondingly, we report the regression equation for predicting the priority vectors from SPL and sharpness in equation (10), as well as the associated statistical parameters in Table 2.
priority vector = −0.99 SPL − 0.001 sharpness
The predictor variable SPL models the criterion priority vector almost perfectly with a regression coefficient of nearly 1. Sharpness, on the other hand, does not contribute significantly to the regression model (cp. Table 2). The high predictive value of SPL can also be seen in Figure 18, as the measured values are very close to the regression line. The figure indicates that subjective pleasantness, as operationalized by the priority vector, declines rapidly with increasing SPL.
As SPL proves to be particularly important for this sound category, we decided to model SPL from pump type, rotational speed, and load pressure. Equation (11) describes this regression, which accounts for 94% of the total variance of SPL (R² = 0.94, F(3, 14) = 67.14, p < 0.001). As Table 3 indicates, pump type and rotational speed prove to be significant predictor variables in contrast to load pressure. For the sake of completeness, it should be mentioned that loudness—if considered instead of SPL—can be also modeled by pump type, speed, and pressure (F(3, 14) = 138.40, p < 0.001). Here, the amount of explained variance reaches 97% (R² = 0.97).
SPL = −0.52 pump type + 0.82 speed + 0.03 pressure
Figure 19 visualizes the impact of the two significant predictor variables rotational speed and pump type on SPL. The figure shows that the axial piston pump is characterized by higher SPL values at the same rotational speed as the internal gear pump. Additionally, the SPL increases with increasing rotational speed.
The relevance of the pump type for the prediction of the SPL of the operating sound is obvious when we exclude pump type from the above-mentioned regression, i.e., when modeling SPL only from rotational speed and load pressure). By doing so, only 67% of the total variance of the loudness differences between the examined noises can be elucidated R² = 0.67, F(2, 15) =15.11, p < 0.001). (Again, for the sake of completeness, it should be mentioned that loudness is modeled—just as well or as poorly as SPL—by rotational speed and load pressure; R² = 0.67, F(2, 15) = 15.01, p < 0.001). Equation (12) describes this reduced regression model for SPL; its statistical characteristics are depicted in Table 4. The association between the significant predictor variable rotational speed and the criterion variable SPL is shown in Figure 20 by means of a scatter plot.
SPL = 0.82 speed + 0.03 pressure

4. Conclusions

In this study, sound measurements and sound analyses on an axial piston pump and an internal gear pump were performed and subjective annoyance judgments in listening tests were collected to analyze the acoustic annoyance or pleasantness of variable speed hydraulic drives. To provide a basic understanding of the measured quantities, the essential basics of acoustics and psychoacoustics were briefly introduced and the sound generation in hydraulic systems was discussed. Furthermore, the procedure of the instrumental measurements was described and then the A-weighted SPL, loudness, and sharpness were presented and discussed. The A-weighted SPL, as well as the loudness, show a dependency of rotational speed and pressure. Hereby, the dependency of the rotational speed is predominant. The measurement of the loudness shows that the loudness of the internal gear pump is about 30% lower than the loudness of the axial piston pump at 3000 min−1/250 bar. However, the A-weighted SPL of the internal gear pump is only about 10% lower than the A-weighted SPL of the axial piston pump in the same operation point. The interpretation of the sharpness is very difficult, because there is no obvious dependency of the sharpness on pressure or rotational speed in the measured data. In context of electrification and the noise of hydraulic pumps, increasing the pressure level has a lower impact on the emitted sound than increasing the rotational speed of the electro-hydraulic drive. The study also shows that the trend to higher rotational speed has to consider noise emission as well.
The sound recordings of the pumps were presented pair-wise to the participants in a listening test. According to the indirect scaling method of pairwise comparisons, participants had to judge which of the two sounds at hand was more pleasant to them and, thus, less annoying. The analysis of these subjective judgements revealed that the internal gear pump is preferred to the axial piston pump. Lower speeds result in lower SPL, and are judged more pleasant (or less annoying). On the other hand, neither load pressure nor sharpness are found to have a significant effect on the pleasantness of the sounds studied and, thus, on annoyance. Yet, it should be noted that the general level of sharpness is high for both types of pumps. Furthermore, the variation of sharpness shows no clear dependency on load pressure or rotational speed. Therefore, more research on the sharpness of the pump sound is necessary in the future. To summarize, rotational speed is the decisive operating parameter for reducing the sound level and the subjective annoyance of a hydraulic pump. That means on the other side, load pressure, as the other operating parameter, is a much more flexible operating point than rotational speed in hydraulic pumps to increase their technical power, while at the same time keep it as quiet and pleasant to hear as possible.

Author Contributions

Conceptualization, T.P., M.G., S.S. and K.S.; methodology, S.S.; formal analysis, T.P. and M.G.; writing—original draft preparation, T.P and M.G..; writing—review and editing, S.S. and K.S.; supervision, S.S. and K.S.; project administration, S.S. and K.S.; funding acquisition, T.P., S.S. and K.S. All authors have read and agreed to the published version of the manuscript.

Funding

This research was founded within the framework of the Excellence Strategy of the German Federal and State Governments to promote science and research at German universities.

Institutional Review Board Statement

Ethical review and approval were waived for this study, since all procedures employed undoubtedly were in accordance with the ethical guidelines of the Declaration of Helsinki.

Informed Consent Statement

Informed consent was obtained from all subjects involved in the study.

Data Availability Statement

The measurements used for this research are currently not on a platform or website.

Acknowledgments

This work was carried out as part of project OPSF507 “Psychoacoustics and subjective assessment of variable speed hydraulic drives”, which was funded within the framework of the Excellence Strategy of the German Federal and State Governments to promote science and research at German universities.

Conflicts of Interest

The founder of this research has no role in the measurements, the data analyses, the hearing tests, in writing these manuscript. The authors declare no conflict of interest.
Note: This article is a modified and extended version of a conference paper published in the German language: Pietrzyk, Tobias; Georgi, Markus; Schlittmeier, Sabine; Schmitz, Katharina: Psychoakustische Beurteilung drehzahlvariabler hydraulischer Antriebe, 8. Fachtagung Baumaschinentechnik 2020, Dresden, Germany, 1–2 October 2020.

Appendix A

Figure A1. Complete preference matrix for all paired-comparisons (N = 20 participants) of the axial piston pump (APP) and of the internal gear pump (IGP) at the different operation points (rotational speed and pressure).
Sustainability 13 07320 g0a1

References

  1. Holzer, A.; Leifeld, R.; Opgenoorth, A.; Pietrzyk, T.; Schoemacker, F.; Vonderbank, T.; Schmitz, K. Trends und Highlights der BAUMA 2019, O+P Fluidtechnik, 7-8/2019. Available online: https://digital.oup-fluidtechnik.de/o-p-fluidtechnik-7-8-2019/62756917/34 (accessed on 29 June 2021).
  2. WHO. Burden of Disease from Environmental Noise-Quantification of Healthy Life Years Lost in Europe; WHO: Geneva, Switzerland, 2011. [Google Scholar]
  3. Genuit, K. Erweiterung von Lärmprognosen durch die Psychoakustik; DAGA: Oldenburg, Germany, 2014. [Google Scholar]
  4. Schleihs, C.W. Acoustic Design of Hydraulic Axial Piston Swashplate Machines. Ph.D. Thesis, RWTH Aachen University, Aachen, Germany, 2017. [Google Scholar]
  5. Zhang, J.; Xia, S.; Ye, S.; Xu, B.; Zhu, S.; Xiang, J.; Tang, H. Sound quality evaluation and prediction for the emitted noise of axial piston pumps. Appl. Acoust. 2019, 145, 27–40. [Google Scholar] [CrossRef]
  6. DIN 45630. Grundlagen der Schallmessung–Physikalische und subjektive Größen von Schall. December 1971. Available online: https://webstore.ansi.org/standards/din/din456301971de (accessed on 29 June 2021).
  7. DIN ISO 226. Akustik–Normalkurven Gleicher Lautstärkepegel (ISO 226:2003). April 2006. Available online: https://www.beuth.de/de/norm/din-iso-226/86282153 (accessed on 29 June 2021).
  8. Klocke, F.; Brecher, C. Zahnrad-und Getriebetechnik; Carl Hanser Verlag München: Munich, Germany, 2016. [Google Scholar]
  9. DIN 45631. Berechnung des Lautstärkepegels und der Lautheit aus dem Geräuschspektrum–Verfahren nach E. Zwicker. March 1991. Available online: https://www.en-standard.eu/din-45631-berechnung-des-lautstarkepegels-und-der-lautheit-aus-dem-gerauschspektrum-verfahren-nach-e-zwicker/ (accessed on 29 June 2021).
  10. Neubauer, P. Konzeption und Auslegung von Geräuschoptimierten Inäquidistanten Verzahnungen. Ph.D. Thesis, TU Darmstadt, Darmstadt, Germany, 2019. [Google Scholar]
  11. Zwicker, E. Unterteilung des hörbaren Frequenzbereichs in Frequenzgruppen. Acustica 1960, 10, 185. [Google Scholar]
  12. Zwicker, E. Psychoakustik; Springer: Berlin/Heidelberg, Germany, 1982. [Google Scholar]
  13. Fastl, H.; Zwicker, E. Psychoacoustics: Facts and Models, 3rd ed.; Springer: Berlin/Heidelberg, Germany, 2007. [Google Scholar]
  14. Head Acoustics: Lautheits-und Schärfeberechnung in der ArtemiS Suite–Application Note 02/18. 2018. Available online: https://global.head-acoustics.com/downloads/de/application_notes/Psychoakustische-Analysen_I_d.pdf (accessed on 29 June 2021).
  15. Möser, M. Psychoakustische Messtechnik; Springer: Berlin/Heidelberg, Germany, 2018. [Google Scholar]
  16. Carl, C. Gehörbezogene Analyse und Synthese der Vibroakustischen Geräuschanregung von Verzahnungen. Ph.D. Thesis, RWTH Aachen, Aachen, Germany, 2014. [Google Scholar]
  17. DIN 45692. Messtechnische Simulation der Hörempfindung Schärfe. August 2009. Available online: https://webstore.ansi.org/standards/din/din456922009de (accessed on 29 June 2021).
  18. Nafz, T.M. Aktive Ventilumsteuerung von Axialkolbenpumpen zur Geräuschreduktion Hydraulischer Anlagen. Ph.D. Thesis, RWTH Aachen, Aachen, Germany, 2011. [Google Scholar]
  19. Müller, B. Einsatz der Simulation zur Pulsations-und Geräuschminderung Hydraulischer Anlagen. Ph.D. Thesis, RWTH Aachen, Aachen, Germany, 2002. [Google Scholar]
  20. Schoemacker, F.; Murrenhoff, H. Interaction between Swash Plate Movement and Commutation in Axial Piston Machines. In Proceedings of the 10th JFPS International Symposium on Fluid Power, Fukuoka, Japan, 24–27 October 2017. [Google Scholar]
  21. Jarchow, M. Maßnahmen zur Minderung Hochdruckseitiger Pulsation Hydrostatischer Schrägscheibeneinheiten. Ph.D. Thesis, RWTH Aachen, Aachen, Germany, 1997. [Google Scholar]
  22. Edge, K. Designing quieter hydraulic systems-some recent developments and contributions. In Proceedings of the 4 JHPS International Symposium on Fluid Power, Tokyo, Japan, 15–17 November 1999. [Google Scholar]
  23. Ericson, L. On Fluid Power Pump and Motor Design-Tools for Noise Reduction. Ph.D. Thesis, Linköping University, Linköping, Sweden, 2011. [Google Scholar]
  24. Johansson, A. Design Principles for Noise Reduction in Hydraulic Piston Pumps-Simulation, Optimisation and Experimental Verification. Ph.D. Thesis, Linköping University, Linköping, Sweden, 2005. [Google Scholar]
  25. Johansson, A.; Ölvander, J.; Palmberg, J.-O. Experimental verification of cross-angle for noise reduction in hydraulic piston pumps. J. Syst. Control Eng. 2007, 221, 321–330. [Google Scholar] [CrossRef]
  26. Klop, R.J. Investigation of Hydraulic Transmission Noise Sources; Purdue University: West Lafayette, IN, USA, 2010. [Google Scholar]
  27. Klop, R.; Ivantysynova, M. Sound intensity measurement to investigate noise generation of hydrostatic transmissions. In Proceedings of the 7th International Fluid Power Conference (IFK), Aachen, Germany, 22–24 March 2010. [Google Scholar]
  28. Klop, R.; Ivantysynova, M. Investigation of Noise Sources on a Series Hybrid Transmission. Int. J. Fluid Power 2011, 12, 17–30. [Google Scholar] [CrossRef]
  29. Kunze, T.; Berneke, S. Noise reduction at hydrostatic pumps by structure optimization and acoustic simulation. In Proceedings of the 5th International Fluid Power Conference (IFK), Aachen, Germany, 20–22 March 2006. [Google Scholar]
  30. Ohuchi, H.; Masuda, K. Active noise control of a variable displacement axial piston pump with even number of cylinders. In Proceedings of the 4 JHPS International Symposium on Fluid Power, Tokyo, Japan, 15–17 November 1999. [Google Scholar]
  31. Opperwall, T.; Vacca, A. Performing and Interpreting Experiments towards Understanding Noise Generation in Displacement Machines; SICFP2013: Linköping, Sweden, 2013. [Google Scholar]
  32. Opperwall, T.; Vacca, A. Modeling noise sources and propagation in displacement machines and hydraulic lines. In Proceedings of the 9th JFPS International Symposium on Fluid Power, Matsue, Japan, 28–31 October 2014. [Google Scholar]
  33. Seeniraj, G.K. Model Based Optimization of Axial Piston Machines Focusing on Noise and Efficiency. Ph.D. Thesis, Perdue University, West Lafayette, IN, USA, 2009. [Google Scholar]
  34. Schleihs, C.; Murrenhoff, H. Modal Analysis Simulation and Validation of a Hydraulic Motor. In Proceedings of the 9th JFPS International Symposium on Fluid Power, Matsue, Japan, 28–31 October 2014. [Google Scholar]
  35. Schleihs, C.; Murrenhoff, H. Acoustical simulation of a hydraulic swash plate motor. In Proceedings of the ASME/Bath Symposium on Fluid Power and Motion Control (FPMC), Chicago, IL, USA, 12–14 October 2015. [Google Scholar]
  36. Yamazaki, T.; Kojima, E. Prediction of sound power radiated from oil hydraulic pump using FEM and BEM. Acoust. Sci. Technol. 2003, 24, 2. [Google Scholar] [CrossRef] [Green Version]
  37. Thurstone, L.L. A law of comparative judgement. Psychol. Rev. 1927, 34, 273–286. [Google Scholar] [CrossRef]
  38. Saaty, T.L. How to make a decision: The Analytic Hierarchy Process. Eur. J. Oper. Res. 1990, 48, 9–26. [Google Scholar] [CrossRef]
Figure 1. Equal loudness curves (isophones) from 10 to 80 phon according to DIN ISO 226.
Sustainability 13 07320 g001
Figure 2. Distribution of the SPL in the third-octave spectrum, total SPL of 58.5 dB for each sound.
Sustainability 13 07320 g002
Figure 3. Specific loudness for an internal gear pump (IGP), an axial piston pump (APP) and a sound of 1 kHz with a SPL of 58.5 dB.
Sustainability 13 07320 g003
Figure 4. Weighting function g(z) according to DIN 45692.
Sustainability 13 07320 g004
Figure 5. Schematic sketch of internal forces and their mechanical coupling to the housing structure for an axial piston pump (top) and for an internal gear pump (bottom).
Sustainability 13 07320 g005
Figure 6. Normalized FFT of the SPL for an internal gear pump (top) and an axial piston pump (bottom) at 1000 min−1, 250 bar and a frequency range of 40 Hz to 1 kHz.
Sustainability 13 07320 g006
Figure 7. Normalized FFT of the SPL for an internal gear pump (top) and an axial piston pump (bottom) at 3000 min−1, 250 bar and a frequency range of 40 Hz to 3 kHz.
Sustainability 13 07320 g007
Figure 8. Simplified schematic hydraulic circuit.
Sustainability 13 07320 g008
Figure 9. Set up for the instrumental measurements: (a) electric drive motor and the hydraulic infrastructure; (b) arrangement of the microphones in the anechoic chamber.
Sustainability 13 07320 g009
Figure 10. Normalized A-weighted SPL of an: (a) axial piston pump; (b) internal gear pump.
Sustainability 13 07320 g010
Figure 11. Normalized loudness of an: (a) axial piston pump; (b) internal gear pump.
Sustainability 13 07320 g011
Figure 12. Normalized sharpness of an: (a) axial piston pump; (b) internal gear pump.
Sustainability 13 07320 g012
Figure 13. Specific loudness for an internal gear pump at 500 min−1 and 3000 min−1.
Sustainability 13 07320 g013
Figure 14. Graphical user interface (GUI) to determine the subjectively perceived pleasantness.
Sustainability 13 07320 g014
Figure 15. Preference matrices (N = 20 participants) for sound pairs in which both sounds were derived either from the axial piston pump (upper panel) or from the internal gear pump (lower panel).
Sustainability 13 07320 g015
Figure 16. Priority vectors for the axial piston pump (left) and the internal gear pump (right) representing the subjectively perceived pleasantness.
Sustainability 13 07320 g016
Figure 17. Scatter plot for rotational speed and priority vector with separated regression lines for the axial piston pump and the internal gear pump. Each circle represents the measured values for one of the 18 pump sounds in the present study.
Sustainability 13 07320 g017
Figure 18. Scatter plot for A-weighted SPL and priority vector with regression line. Each circle represents the measured values for one of the 18 pump sounds in the present study.
Sustainability 13 07320 g018
Figure 19. Scatter plot for rotational speed and A-weighted SPL with separated regression lines for axial piston pump and internal gear pump. Each circle represents the measured values for one of the 18 pump sounds in the present study.
Sustainability 13 07320 g019
Figure 20. Scatter plot for rotational speed and A-weighted SPL with regression line without consideration of pump type. Each circle represents the measured values for one of the 18 sounds in the present study.
Sustainability 13 07320 g020
Table 1. Regression table for the regression of subjective pleasantness as indicated by priority vector from pump type, rotational speed, and load pressure, as given in Equation (9). The table displays for each predictor variable the unstandardized regression coefficient B with standard error (SE), the standardized regression coefficient β and the corresponding t-test with p-value.
VariableBSE Bβtp
constant0.110.15
Pump type0.040.010.476.78<0.001
Speed (rpm)−0.0010.001−0.84−12.00<0.001
Pressure (bar)−0.0010.001−0.09−1.290.22
Table 2. Regression table for the regression of subjective pleasantness in terms of priority vector from a-weighted SPL and sharpness, as given in Equation (10). The table displays, for each predictor variable, the unstandardized regression coefficient B with standard error (SE), the standardized regression coefficient β, and the corresponding t-test with p-value.
VariableBSE Bβtp
constant0.300.03
SPL (dB(A))−0.0040.001−0.99−21.11<0.001
Sharpness (acum)0.0010.020.0010.030.98
Table 3. Regression table for the regression of A-weighted SPL from pump type, rotational speed, and load pressure, as given in Equation (11). The table displays, for each predictor variable, the unstandardized regression coefficient B with standard error (SE), the standardized regression coefficient β, and the corresponding t-test with p-value.
VariableBSE Bβtp
constant50.823.60
Pump type−10.211.35−0.52−7.58< 0.001
Speed (rpm)0.010.0010.8211.99< 0.001
Pressure (bar)0.010.020.030.500.63
Table 4. Regression table for the regression of A-weighted SPL from rotational speed and load pressure, as given in Equation (12). The table displays, for each predictor variable, the unstandardized regression coefficient B with standard error (SE), the standardized regression coefficient β, and the corresponding t-test with p-value.
VariableBSE Bβtp
constant45.727.72
Speed (rpm)0.010.0010.825.49<0.001
Pressure (bar)0.010.040.030.230.82
Publisher’s Note: MDPI stays neutral with regard to jurisdictional claims in published maps and institutional affiliations.

