1. Introduction
Evacuation routes are fundamental ways that indicate the path to be followed when leaving a building, generally to a specific meeting point out of danger to avoid putting people’s lives at risk [
1]. The implicit hazards of facilities, emergency measures, and safe assembly areas must be considered in the design of evacuation routes [
2,
3,
4]. However, these tasks are a bit difficult to implement in wooded environments, i.e., there is no defined route in a wildfire since it changes according to the geographical variations of the terrain, topology, climatic factors, and type of fuel; therefore, safe evacuation routes vary as the incident progresses [
5]. Consequently, national and international agencies currently encourage research in creating mechanisms for forecasting, detecting, and monitoring forest fires and educational policies for forest conservation [
6,
7]. Meanwhile, technical guides and evacuation plans are offered as consultation tools aimed at communities and field personnel to minimize risks and reduce the mortality rate in these emergencies [
8].
Forest fires are a vital and essential process for the natural regulation of the ecosystem. Human action has modified this stability through increasingly aggressive intervention on renewable and non-renewable natural resources [
9]. The costs are not only economic. The World Health Organization (WHO) affirms that fire trapping causes the main consequences of mortality from the incident during evacuations and air, nautical, and traffic accidents produced by reduced visibility to the firefighters, rescuers, and civilian population [
10,
11]. The risks are always implicit in a fire; for a forest firefighter, these would re-power when they do not have communication with the personnel to locate the fire origin point, not being able to define the spread direction for the creation of firebreaks, or not have well-identified safe areas and escape routes [
12]. Planning how to avoid this type of accident is vital, and more so when the fire is directed to populated areas. The firefighters have technological tools that help them mitigate these problems, e.g., mobile computing [
13]. However, what if the rescuers make a wrong decision based on their analysis? Can the direction the fire takes catch rescuers? These are questions firefighters are faced with in a wildfire, and, depending on the intensity, they could cause severe damage to the environment and human beings.
This paper describes a tool for dynamic evacuation routes calculation, which varies considering the terrain’s physical characteristics and fire behavior in a forest. Cellular automaton (CA) is implemented to model the spread of a forest fire that uses geographic information (latitude, longitude, and elevation) to calculate the probability that a cell will catch fire and a meteorological API to obtain information on temperature, humidity, and wind speed and direction in real time [
14]. In addition, the application uses an algorithm to calculate evacuation routes outdoors [
15]; both methods represent previous work of the project, and they have been unified for the creation of this prototype. The tool graphically shows the behavior of the evacuation routes in different fire scenarios and updates depending on the spread. This paper aims to present a way to create a computational tool that allows forest firefighters to be prepared against the eventualities of a wildfire in real time. Furthermore, the tool is designed so that relief agencies can generate control and rescue plans in order to safeguard the lives of human beings.
The remainder of this paper is divided into five sections.
Section 2 describes the state-of-the-art current technologies involved in emergency management, solutions to forest fires, and this proposal’s innovation.
Section 3 describes the prototype proposed architecture, the external applications, the mathematical models used to design the virtual sensor network (VSN), and the algorithms’ rules for wildfire spread and route evacuation.
Section 4 presents the case studies, providing information on the algorithm’s variables and showing the simulation results. Finally,
Section 5 presents the discussions, conclusions, and future works derived from this paper’s research.
2. State of the Art
Forest fire seasons in the world have increased in recent years, causing severe damage to populations living in forested or fire-prone area [
16]. This section presents the scientific literature on articles and related works to the different topics considered in this paper’s scope (wildfires and tools). In addition, the relationship of the algorithms implemented in previous works and used for application development are described.
2.1. Wireless Sensor Network for Monitoring Wildfires
Wireless sensor network (WSN) technology is implemented due to the need to cover complex surfaces, where wired networks are expensive and not very scalable. For example, in [
17], the design and construction of a dynamic monitoring system for a wireless sensor network that operates under the IEEE 802.15.4 (ZigBee) protocol is described. The system allows interactive communication with the entire network and manages data control by implementing tree and mesh topologies and achieving extensive communication coverage. Likewise, in [
18], the implementation and experimental validation of an ISA100.11a simulation model for industrial wireless sensor networks (IWSN) are presented, obtaining a high simulation precision by integrating the software stack running on the field devices into the NS3 simulator.
The literature review describes various WSN applications for supporting or monitoring fires from different perspectives, especially when it comes to monitoring the spread of wildfires. For example, Dasari et al. [
19] described a network of simulated sensors used in OMNeT++ programming language to create a mechanism for the early detection of forest fires. A graphical user interface (GUI) displays real-time temperature monitoring and its respective alert settings in an emergency. Kovács et al. [
20] designed and implemented a low-cost and energy-consuming WSN for forest fire monitoring, using a Microchip PIC18F4685 MCU and an ISM Si4432 band transceiver from Silicon Laboratories. They detailed the basic functional principles of the system and the results of the energy consumption measurement. Grover et al. [
21] analyzed a WSN that collects data on temperature, humidity, smoke, and oxygen levels at various points in a wooded environment, to verify the quality of the information and the sensing time, to help authorities reduce the loss of life and housing in the event of a forest fire. The node’s location is made through satellite communication to reduce coverage holes and ensure the lowest latency range. This node communicates to a monitoring station with its location and sends alerts considering the configured variables’ thresholds. However, to reduce the damage caused by wildfires and take more effective preventive measures, many researchers have worked on mathematical models to simulate the wildfire spread, taking into account environmental and geographic variables depending on the study area. Rothermel [
22] defined a fire prediction model assuming that it spreads over a surface with adequate continuous fuel and considering the effects of wind, humidity, and slope on heat transfer, among other factors. Although most simulators use this model to predict fire behavior, it does not consider fire in the treetops, which makes it obsolete for a forest with a high density of vegetation. The proposed prototype is based on conditions that consider heterogeneous terrain, fuel, and climate. The detailed fire prediction model for this job is described in [
14]; this tool’s core is the cellular automata (CA) and graphical information system (GIS) provided by the Google Maps API, allowing for a simulation that considers the type and density of the vegetation in a specific area.
2.2. Evacuation Routes in Emergencies
Per the Ecuadorian Institute of Standardization INEN-56 (
https://www.normalizacion.gob.ec/buzon/normas/GPE-60-1.pdf, accessed on 15 October 2020), any infrastructure that houses more than 50 people or has a public area greater than 1000 m
must have evacuation routes and emergency exits in a mandatory way to safeguard people’s lives against harm. Different models and computational tools have been developed to streamline this process that offer efficient response plans to the agents in charge of reacting to dangerous events. Aymaz et al. [
23] described a particle swarm optimization (PSO) technique to minimize hazardous conditions in the evacuation process during an indoor fire. The route’s orientation depends on the type of infrastructure, the smoke and light conditions, and the distance to the building’s safe exit points. Likewise, in [
24], several technologies related to smart cities and big data ecosystems are described to develop and present an architecture proposal for fast data services, useful for managing and improving response times in an emergency. The architecture’s effectiveness [
25] and ability to handle and process streaming data to generate early alerts for each unforeseen event were validated. Finally, a fire simulation to affect the studied scenario and analyze its response times was implemented.
The evacuation of natural persons and the rescue team is essential in wildfires, thus, e.g., a large-scale evacuation model called buildingEXODUS was developed by Veeraswamy et al. [
26], which includes the entire road network, open spaces, and buildings in a specific area. They used a wildfire spread model to assess various evacuation procedures pedestrians had to follow based on the route taken, providing key statistics such as time to meet, distance, congestion experienced by officers, and margins associated with the use of each evacuation route. Beloglazov et al. [
27] described a forest fire simulator to model people’s behavior through dynamic factors to identify populations at risk and carry out precise emergency planning. They calculated detailed projections of how the scenarios would play out using behavioral models, microscopic traffic simulators, warning generators, and other existing metrics. The experiments provided information on the role of dynamic factors in modeling bowel movements. They provided a Software as a Service (SaaS) system. This approach allows users to easily explore and understand the risk of possible scenarios, controlling the location of the ignition of the fire, the speed of the wind, the capacity of the shelter, and its position.
2.3. Tools for Fighting Wildfires
In cases of wildfires with surrounding populated areas, people have the option of escaping or defending their homes [
28,
29]; however, that decision may come a little late based on people’s predictions due to different variables. It is not only about deciding whether to escape and leave all their belongings, but there may also be primary factors such as children, the elderly, pets, and material goods (car and house) [
30]. In addition, forest fires spread more or less quickly due to various factors, e.g., wind speed, wind direction, terrain inclination, humidity, and more, which can affect people’s decisions.
Wildland firefighters advise people to evacuate homes when fires threaten them. However, evacuations can become complicated as the fire spreads. In addition, effective evacuations require specific protocols to be followed that the population may not be familiar with, causing complications when protecting people in emergencies [
31]. Forest firefighters and rescue teams use various tools to control and fight forest fires, both physical and digital. For example, Pulaski is a versatile tool that combines an ax and a hoe in the same head; it has a rigid handle made of wood, plastic, or glass. This tool performs multiple tasks, including cutting and hauling brush, excavating, and cutting wood to create firewalls [
32]. OruxMaps is a digital tool that allows visualization routes designed on online/offline maps and navigating accurately to destination locations in a three-dimensional way. It efficiently manages geographic and topographic data, is widely used among firefighters to become familiar with the terrain, and analyzes evacuation routes when they need to escape danger [
33,
34].
The projects, tools, and applications described in the previous subsections are excellent and very useful in various scenarios, especially WSN which allows real-time monitoring of study areas. However, there is no algorithm or digital tool on the market that considers variables such as physical elevations, wind speed, and direction or the type and density of vegetation on the ground to predict in real time the wildfire spread and simultaneously create outdoors dynamic evacuation routes. This algorithm’s design would help relief agencies execute a better control and combat plan, decrease reaction times, take timely actions, and efficient decisions based on the development of the incident and the terrain characteristics.
3. Materials and Methods
This section analyzes the main tools used in developing the evacuation route algorithm and their interaction at each stage within the system. In addition, the mathematical models used for the fire spread and the calculation of evacuation routes are described.
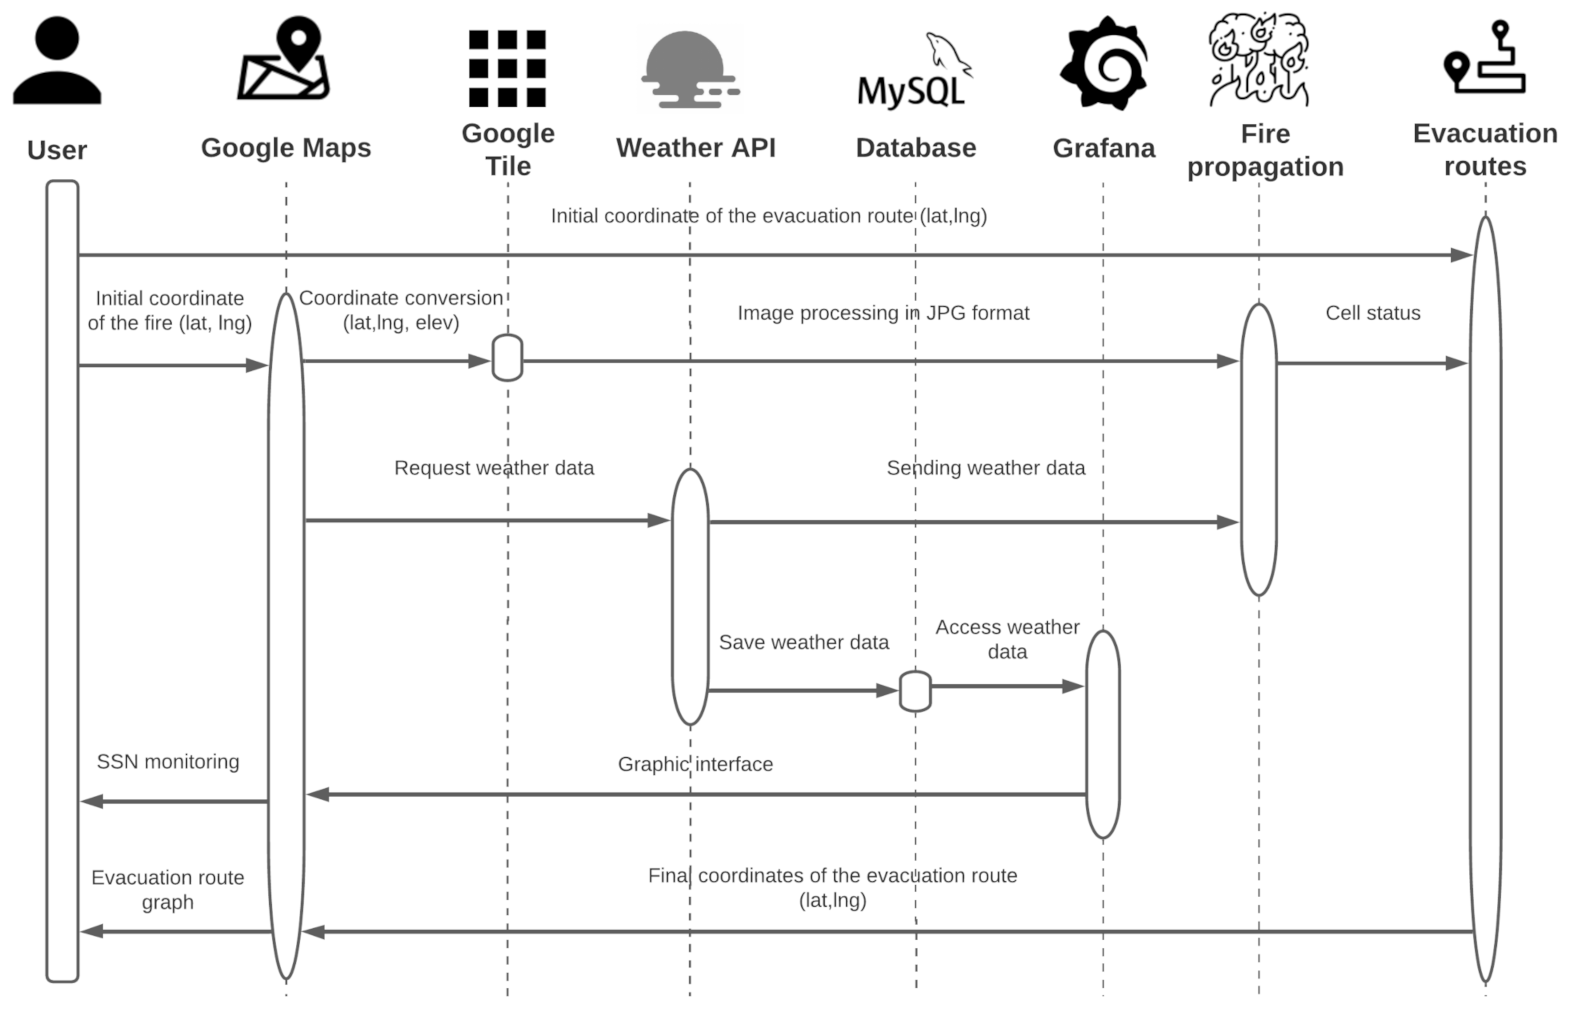
Figure 1 shows the general diagram of the application and the interaction with external tools and algorithms. The application needs to define a study area to create a virtual sensor network that obtains information from the web in real time. If there is a possible ignition point (measured by temperature changes), it calculates the propagation of a possible fire. Evacuation routes are calculated based on the user’s position; this depends on whether the user provides the location or a starting point and whether arrival points (safe zones) have been defined.
3.1. External Components of the Application
The simulation needs to obtain the input variables from the monitoring area necessary to correct the algorithm. Google Maps provides the coordinate system and a panoramic image of the study setting. Google Tile (
http://www.maptiler.com/google-maps-coordinates-tile-bounds-projection/, accessed on 10 November 2020), for its part, transforms the spherical shape of the stage into a flat map to be processed directly in the algorithm and to accurately describe the characteristics of the stage. The OpenWeather meteorological API is used (
https://openweathermap.org/api, accessed on 12 November 2020) to simulate the sensor network. This software allows obtaining the values of temperature, speed, and direction of the wind in real time, essential to predicting the development of a forest fire with high fidelity. Simultaneously, the MySQL database (
https://openwebinars.net/blog/que-es-mysql/, accessed on 10 December 2020) and the Grafana (
https://pandorafms.com/blog/es/que-es-grafana/, accessed on 5 January 2021) platform are implemented to save the sensors’ information and continuously monitor the VSN.
3.2. Wildfire Spread Algorithm
The propagation model uses an automated cell with geographic information using Google Maps. The algorithm has an accuracy of 99% using as a base the Alexandridis’ model, as described in [
14]. This paper describes a previous work where the feasibility of a tool for predicting forest fires and state change rules in cellular automata is analyzed. The equation to obtain the probability that a cell is burning is given by [
35]:
where
is an empirical factor with a value of 0.58.
(Vegetation) depends on the kind of vegetation in the zone.
(Density) can have the values of limited = −0.4, medium = 0, or high = 0.3.
(Wind speed) is the angle between the direction of propagation of the fire (the direction in which the neighboring cell has been with respect to the center) and the wind direction.
indicates fire spreads faster if it goes uphill than downhill.
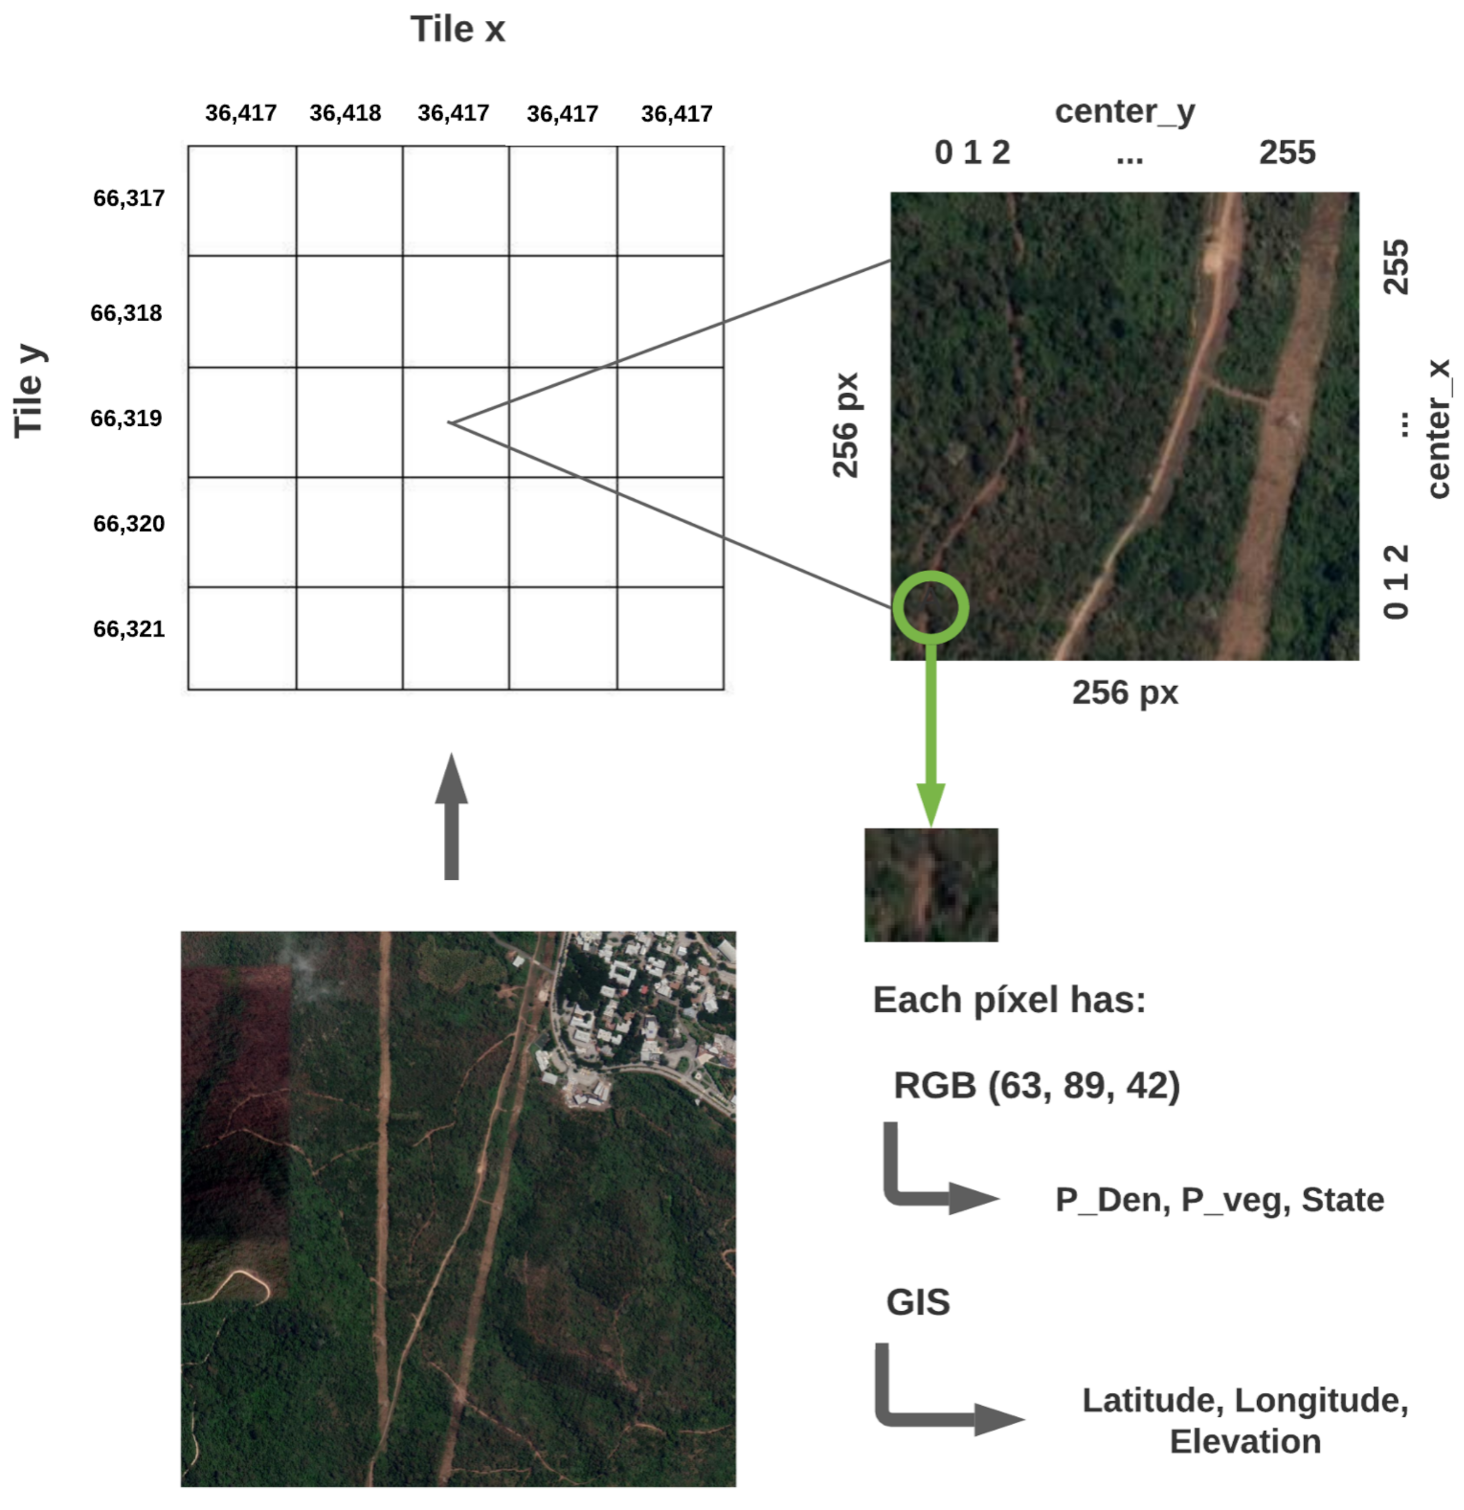
The fire propagation is carried out on an image of the forest obtained from the Google Maps API. It is divided into 25 smaller images called
Tiles and where there is a 256 × 256 px matrix. The matrix represents the cellular automata (CA) (
Figure 2). CA considers a finite number of states that evolve according to a set of rules in discrete time; the possible states are:
State 1: The cell does not contain vegetation and therefore cannot catch fire.
State 2: The cell contains fuel, but it has not yet caught fire.
State 3: The cell is on fire.
State 4: The cell contained vegetation and burned.
In each discrete step (t) of the simulation, there are several rules for the transition of the states, given the cell (i,j):
Rule 1: If the state of (i, j, t)=1, then the next state will be (i, j, t + 1)=1. Therefore, cells that do not contain fuel will remain in the same state, because they cannot catch fire.
Rule 2: If the state of (i, j, t)=3, then the next state will be (i, j, t +1)=4. Therefore, if the current cell is on fire, in the next step, it will be considered completely burned out.
Rule 3: If the state of (i, j, t)=4, then the next state will be (i, j, t +1)=4. Therefore, if the cell is completely burned, its state will not change.
Rule 4: If the state of (i, j, t) = 3, then the state of (i ±, j±, t + 1) = 3, , with certain probability of fire. Therefore, if the current cell is burning, its neighboring cells will burn as well, unless they have already been evaluated by the above rules.
Algorithm 1 shows the analysis that is performed for each cell in the CA. This process is repeated for each neighbor of a point. The algorithm only needs a location to evaluate and the points of interest (initial, ignition point of the fire; location, location point of the person at the start of the wildfire).
| Algorithm 1: Process of cell evaluation (CA) |
Result: Propagation (Change of states)
Input: Location, Init point, directory.
Output: CA with propagation information of each cell:(IDmesh) Cell ID, (degree) Next step to a neighbor in that direction, (x, y) Position on the Tile, (lat, long) Latitude and longitude, (ele) Elevation, (Pburn) Probability of the cell catching fire, (State) Cell Status.
Get the Google Tile to start processing. Extracted from directory
Obtain the mesh (matrix) for the cellular automata of the Google Tile chosen. (location)
The initial position is obtained for the fire spread calculation. (init point)
![Sustainability 13 07295 i001]() |
3.3. Evacuation Routes Algorithm
A study area can be composed of multiple routes; however, to determine if a path is suitable to be part of an evacuation route, the algorithm evaluates the modified states of the CA cells after executing the fire spread algorithm and classifies them into new states according to the following rules:
State 1: The cell does not contain vegetation. It can be part of a safe evacuation route.
State 2: The cell contains fuel. It can be part of a safe evacuation route.
State 3: The cell is on fire. It will not be part of a safe route.
State 4: The cell contained vegetation and burned. It will not be part of a safe route.
When the cellular automata has been created and an ignition point
is specified in the matrix, it begins with the calculation of evacuation routes using a directed graph; G = (node, edge), where an edge
is considered directed if it goes from a path (
x,y). The model currently calculates the evacuation routes considering the slope of the terrain using geo-referential positioning (latitude, longitude, and elevation), assuming that the area affected by the fire is a forest [
15]. The
analyzes the vegetation density by
to know if a cell can burn or not, i.e., evaluates if the cell is empty terrain, asphalt, or vegetable fuel. However, due to the precision of eight digits at each point in the matrix (CA), the distance between
and
is minimal (approximately one step). For this reason, the graph creates several branches in different directions of the Cartesian plane, considering that the neighborhood of a point
is evaluated.
The route calculation starts from a position (
) adding a new node N to the graph; depending on whether the user moves uphill or downhill, assuming that you have two positions (
), these positions are composed of
and
. These points allow generating a route between the entire graph. The algorithm is described in detail in [
15].
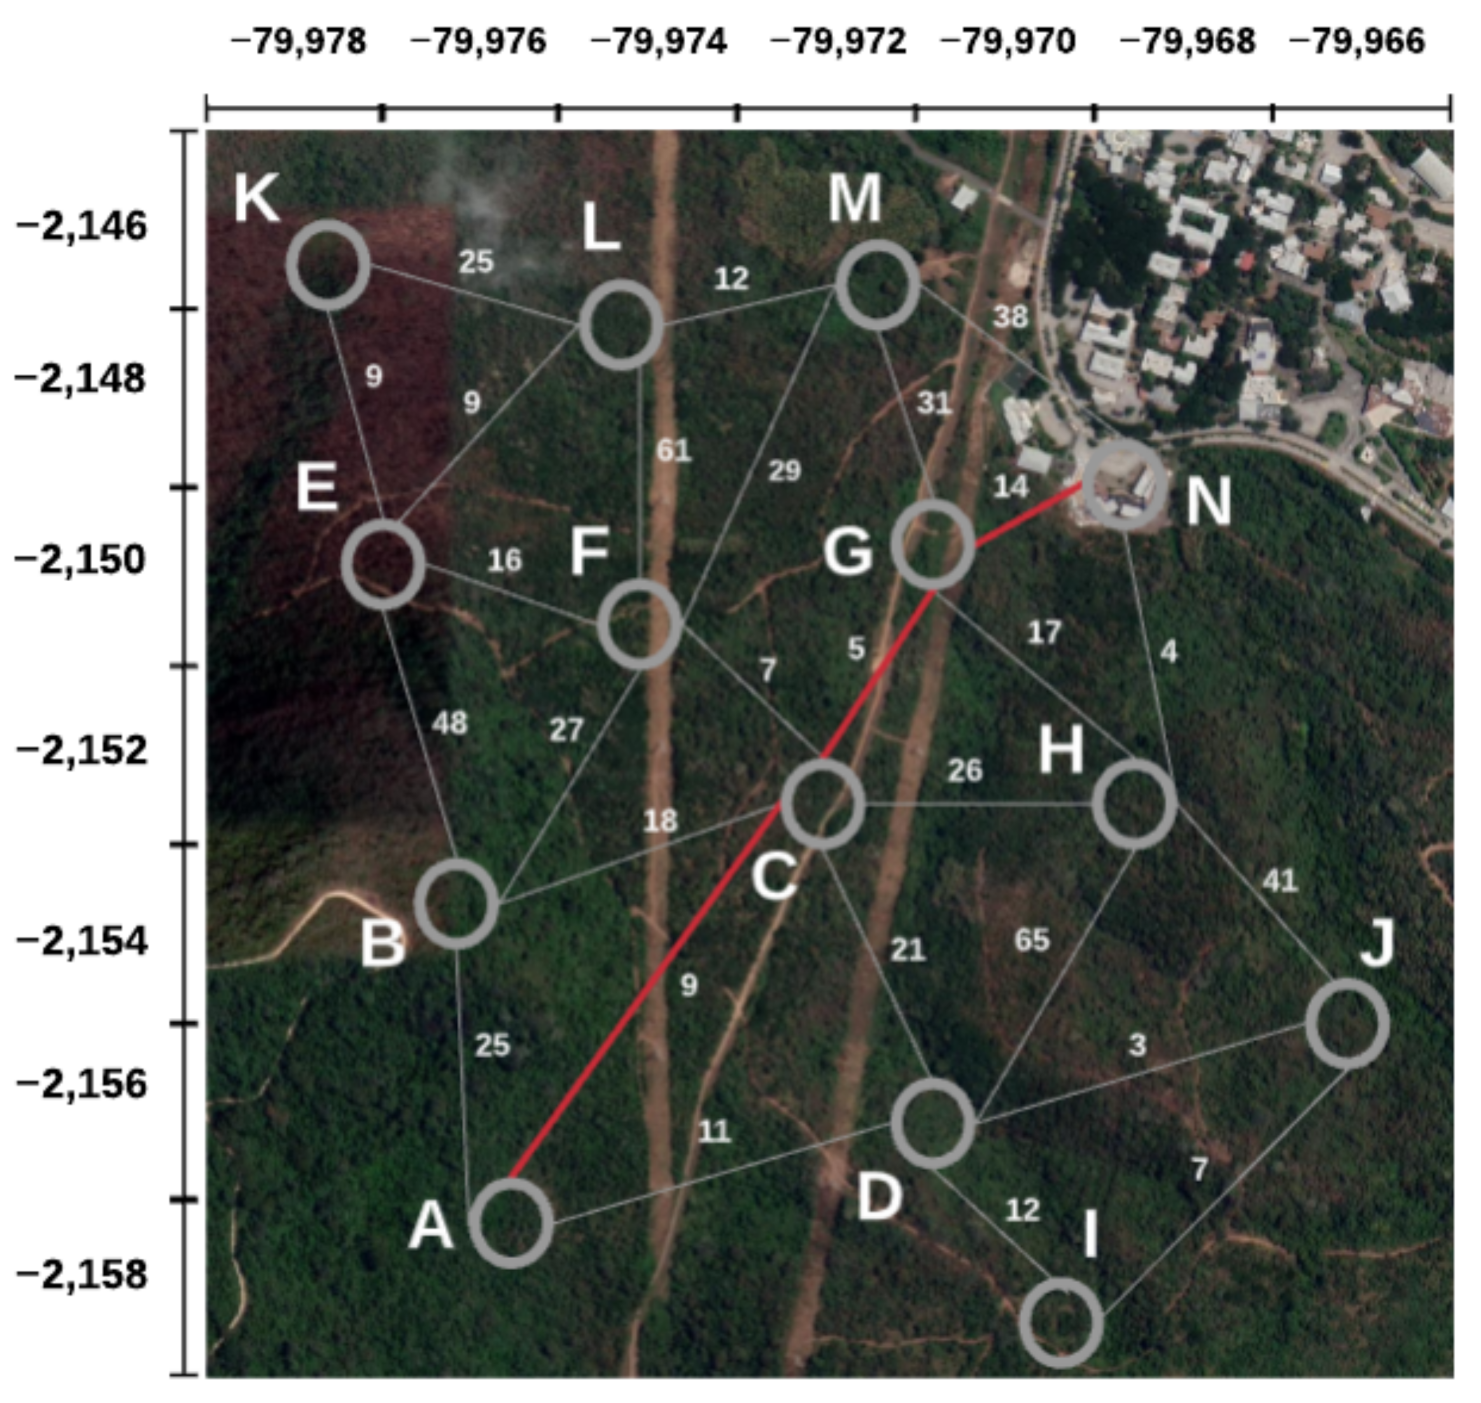
Figure 3 shows a schematic model of the evacuation route applying the
Dijkstra algorithm. The study area is converted into a graph, and the
Dijkstra search method is used to find the shortest route to a defined endpoint. The final states of the CA will serve to assign a cost to each node in the area. In the cells free or without fire, the probability of the cost will be minimal, while, for the burning or burned cells, the cost will be infinite. At each jump (discrete), each edge’s costs are added to find the smallest, discarding repeated or unusable paths to optimize processing. The graph shown in the figure is referential. Each Google Tile processes a graph separately and is joined with another at the perimeter of the GTI.
Finally, Algorithm 2 shows the calculation of evacuation routes after having created the CA. The result of this process is three positional arrays that allow creating a dynamic graph to find the route each time there is an event.
| Algorithm 2: Process for calculating evacuation routes |
Result: Evacuation routes
Input: Location, Init point, Tile, index, image name.
Output: x : List with points of the path in the x-axis.
y : List with points of the path in the y-axis.
z : List with points of the path in the z-axis.
Route Graph
Algorithm: The automated cell where the person is initially is obtained
![Sustainability 13 07295 i002]() |
3.4. Virtual Sensor Network Coverage
It is necessary to monitor the study area using a sensor network to obtain the fire propagation algorithm’s input parameters. To model the network as close to reality as possible, the transmitter device XBee-PRO S2 was chosen, whose characteristics are ideal for this type of environment. The equipment has a transmission power of 10 mW, a data rate of 250,000 bps, and a reception sensitivity of −102 dBm and operates on the ISM frequency of 2.4 GHz. These data are used in the following sections to calculate the sensor network’s optimal coverage that ensures a successful connection.
3.4.1. Link Calculation
The transmission power values and the necessary link margin for optimal communication can be calculated based on the total system loss prediction. The following expression can define the link calculation:
where
ME (dB) is the link margin,
Pt is the transmitted power,
Gt is the transmission gain,
L is the propagation losses,
Gr is the receiver gain, and
THrx is the receiver sensitivity. For the transmitting equipment’s data, taking into account a link margin of 10 dB to guarantee communication even if there are additional losses due to rain, mist, or other external factors, a minimum propagation loss (
L) is obtained as 105 dB.
3.4.2. Propagation Model
The analyzed habitat is a deciduous forest, characterized by its dry condition and trees with low leaf density. Three propagation models were studied for this environment: Friis Free Space [
36], Weissberger, and ITU Early Vegetation [
37].
The equations for the Friis model are given by:
where
and
d are measured in meters. The losses were calculated using the data from the Xbee-PRO device. The same device is used for all models.
The equations for the Weissberger model are given by:
The equations for the ITU Early Vegetation model are given by:
where
d is the depth of the foliage in meters and
f is the frequency in GHz for both models (Weissberger and ITU Early Vegetation).
Table 1 shows the results obtained from the propagation losses to find the optimal distance between the nodes, considering the attenuation result calculated in Equation (
2). According to the Friis Free Space model, the coverage is more than 130 m; for the Weissberger model, the coverage is around 100 m; and for the ITU Early Vegetation model, the result is close to 80 m. Remembering that 10 dB of link margin was taken and that it seeks to optimize the network’s costs and ensure the communication link, coverage of 100 m is proposed for the sensor network model.
Finally,
Figure 4 shows the sensor network model with the previously calculated coverage distance; this is used to monitor the entire area and warn about possible inconveniences (wildfires). Each point in the network represents a sensor node that uses the meteorological API to obtain the necessary values to calculate fire spread. Sixty nodes are used to cover the study area; this creates a virtual sensor network (VSN). This network is used for the constant monitoring of an area. It is related to the application proposal in general; e.g., if there is an ignition point within the area, the fire spread process is executed, and, at the same time, possible evacuation routes are calculated (the routes depend on the position of the user). The implementation of this application using Google Maps and the network design are outside the scope of this paper.
4. Scenarios and Results Analysis
This section analyzes the behavior of evacuation routes and performance metrics under different simulation scenarios. It is worth mentioning that these metrics may change depending on the equipment’s characteristics. The tests were carried out with a computer with Intel CI3-7200U 8GB/ 1TB/W10. The results are presented using the Google Maps platform.
4.1. Basic Scenario: Without Terrain Elevation
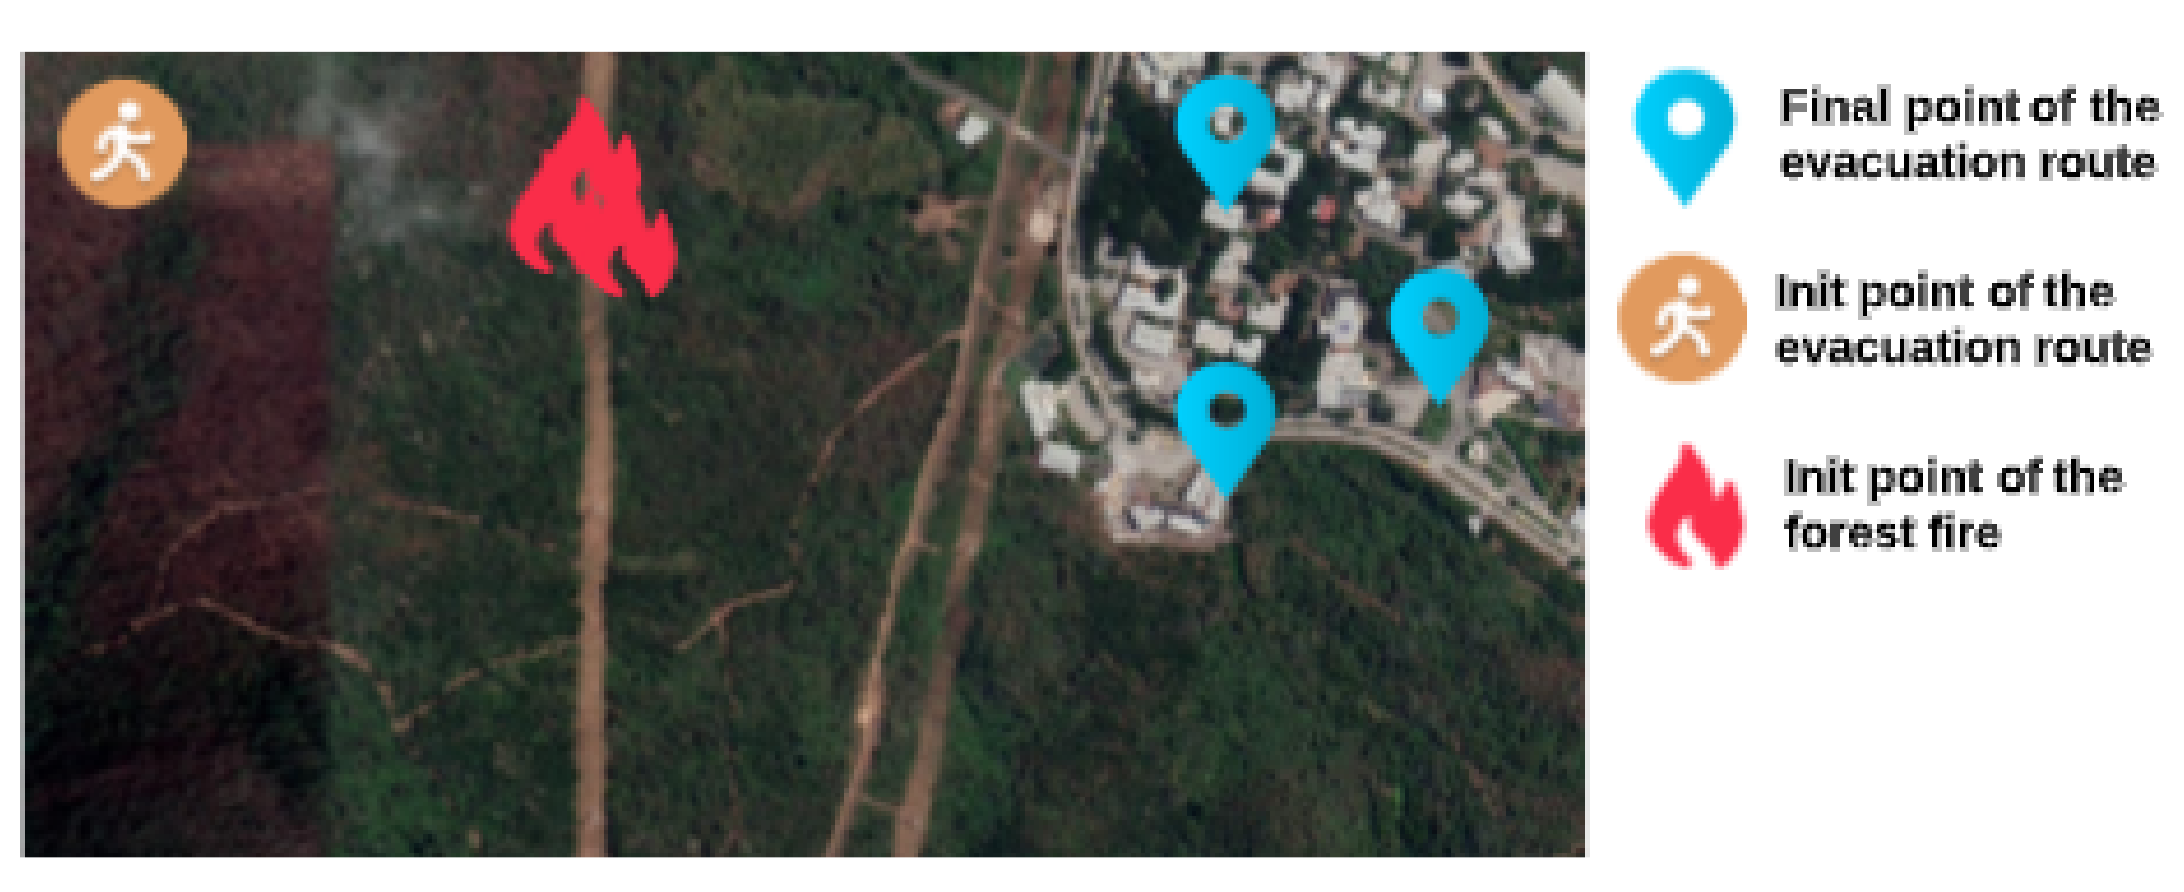
The results of the route creation algorithm are evaluated through a topographic study of the terrain. The elevations of each point in the area are obtained with Google Maps, and the type of vegetation is analyzed using each Google Tile; this allows identifying the amount of vegetation on the road. Furthermore, the distance from the start point to an endpoint (evacuation point) is considered. The characteristics for this scenario are:
There is less density of vegetation on this road.
It does not have high elevations.
It has a firewall in its path.
There is a distance of 861 m between the starting point and endpoint.
Figure 5 and
Table 2 show the basic scenario configuration; each scenario (basic, intermediate, and advanced) has a starting point and some evacuation points for the algorithm to find the closest route while the fire spreads.
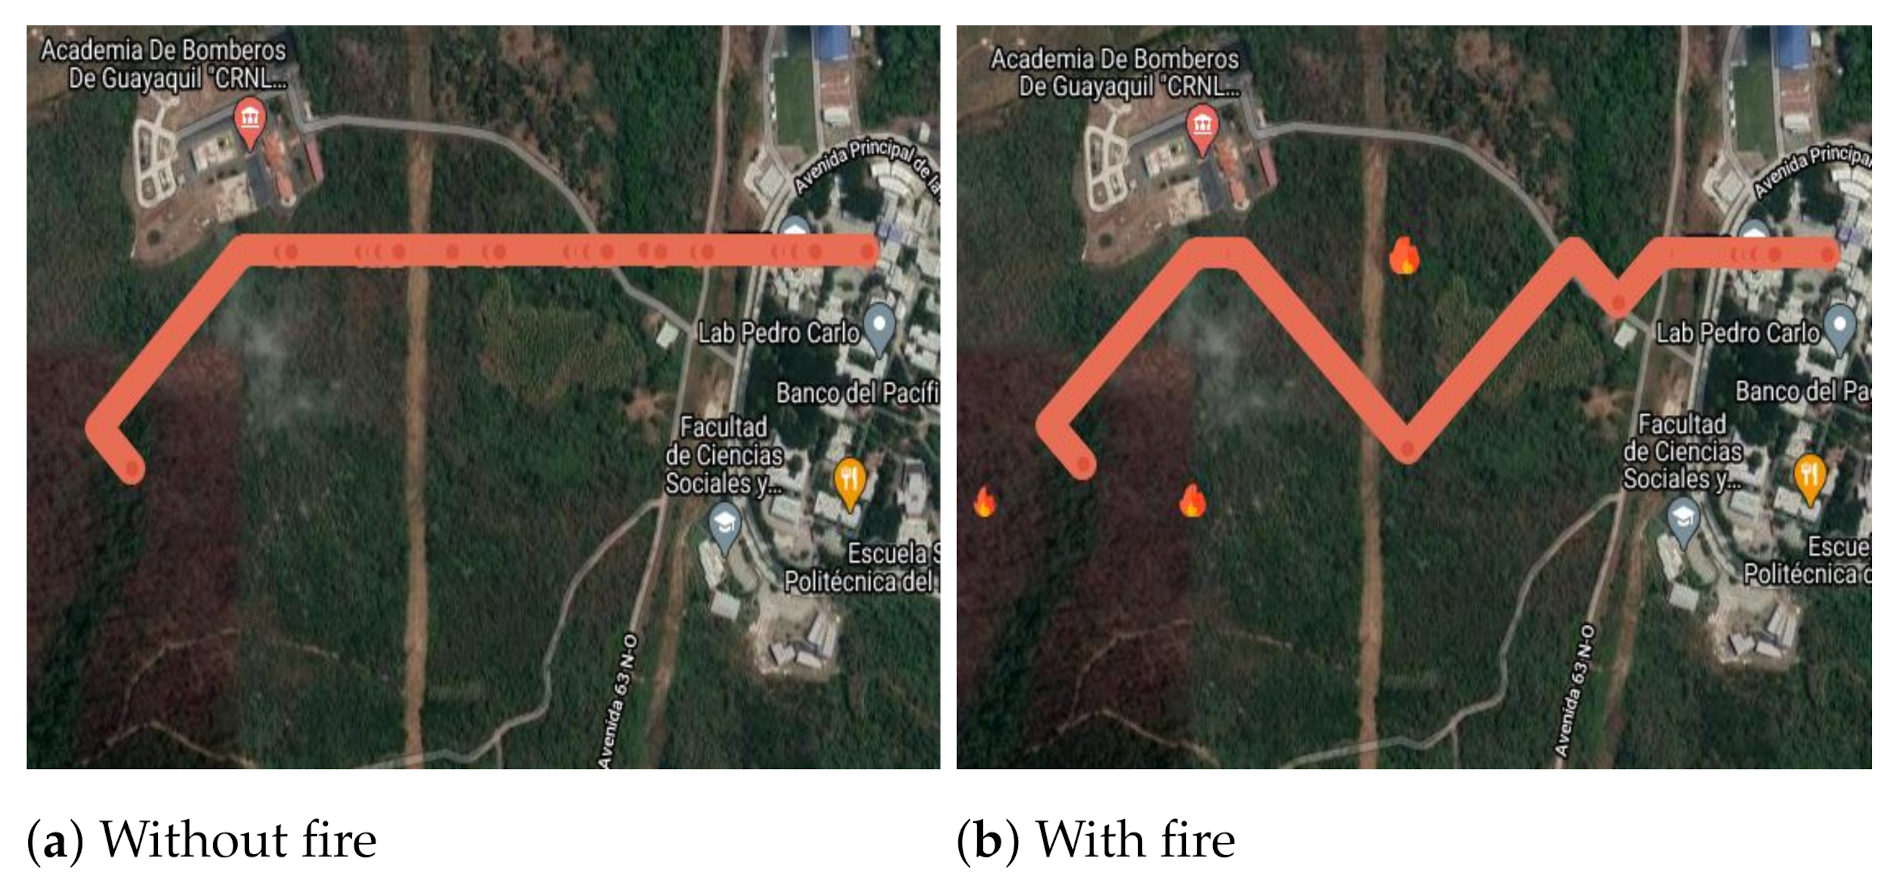
Figure 6a shows the result of the simulation of an evacuation route. It is observed that the route takes the shortest path without deviating its direction. The fire propagation algorithm in the forest is not activated, and the route calculation time is 148.31 s.
Figure 6b shows the result of the simulation when there is the presence of fire in the forest; it can be seen how the route reacts by deviating its original direction and identifying another appropriate route that maintains a safe distance from the fire, even if it is not the shortest way to the point of survival. The evacuation route calculation time is approximately 87.73 s with a fire spread time of 39 s.
4.2. Intermediate Scenario: Terrain Elevation
The fire propagation algorithm considers the vegetation density according to the RGB color of the area to be evaluated (Google Tile); if the color is denser (dark green), it is considered a higher density of vegetation. This value influences knowing which areas of the forest are prone to catch fire faster in the event of a fire. A starting point with higher density vegetation is considered, as well as a greater distance between the final and initial points. The characteristics of this scenario are:
There is a higher density of vegetation on this road.
Elevation is up to 70 m.
There is no firewall in its path.
There is a distance of 935 m between the starting point and endpoint.
Table 3 shows the initial configuration of the algorithm.
Figure 7a shows how the route takes a direct path, with very few deviations on the ground (considering that there is elevation, the path with less slope is taken), and the route calculation time is 100.23 s.
Figure 7b shows the initial point of the fire; this shows how the route reacts by deviating its original path, moving away from the danger and maintaining a safe distance from the fire. In addition, due to the change of direction that occurs, the algorithm assigns another endpoint on the evacuation route (the one closest to the route change). The evacuation route calculation time is approximately 117.85 s with a fire spread time of 59 s.
4.3. Advanced Scenario: Elevations and Firewalls
Firewalls are areas in a forest where there is no fuel, preventing a forest fire from spreading. The algorithm can identify these areas or paths to obtain safer routes. In this scenario, we seek to observe the algorithm’s response to various firewalls and increase the distance compared to the previous scenarios. The characteristics of the stage are:
There is a higher density of vegetation on this road.
The road has elevations greater than 70 m.
It has three firewalls in its path.
There is a distance of 1175 m between the starting point and endpoint.
Table 4 shows the initial configuration of the algorithm for this scenario.
Figure 8a shows the longest route in the simulation with the most extended route creation times. There is no fire incidence, and the time to find the shortest route is 163.30 ms.
Figure 8b shows how the route abruptly changes direction to avoid the fire and stay safe from danger. Furthermore, due to the terrain’s geographical formation, more variations are generated until reaching a safe point. The evacuation route calculation time is approximately 163.53 s with a fire spread time of 118 s.
4.4. VSN Monitoring
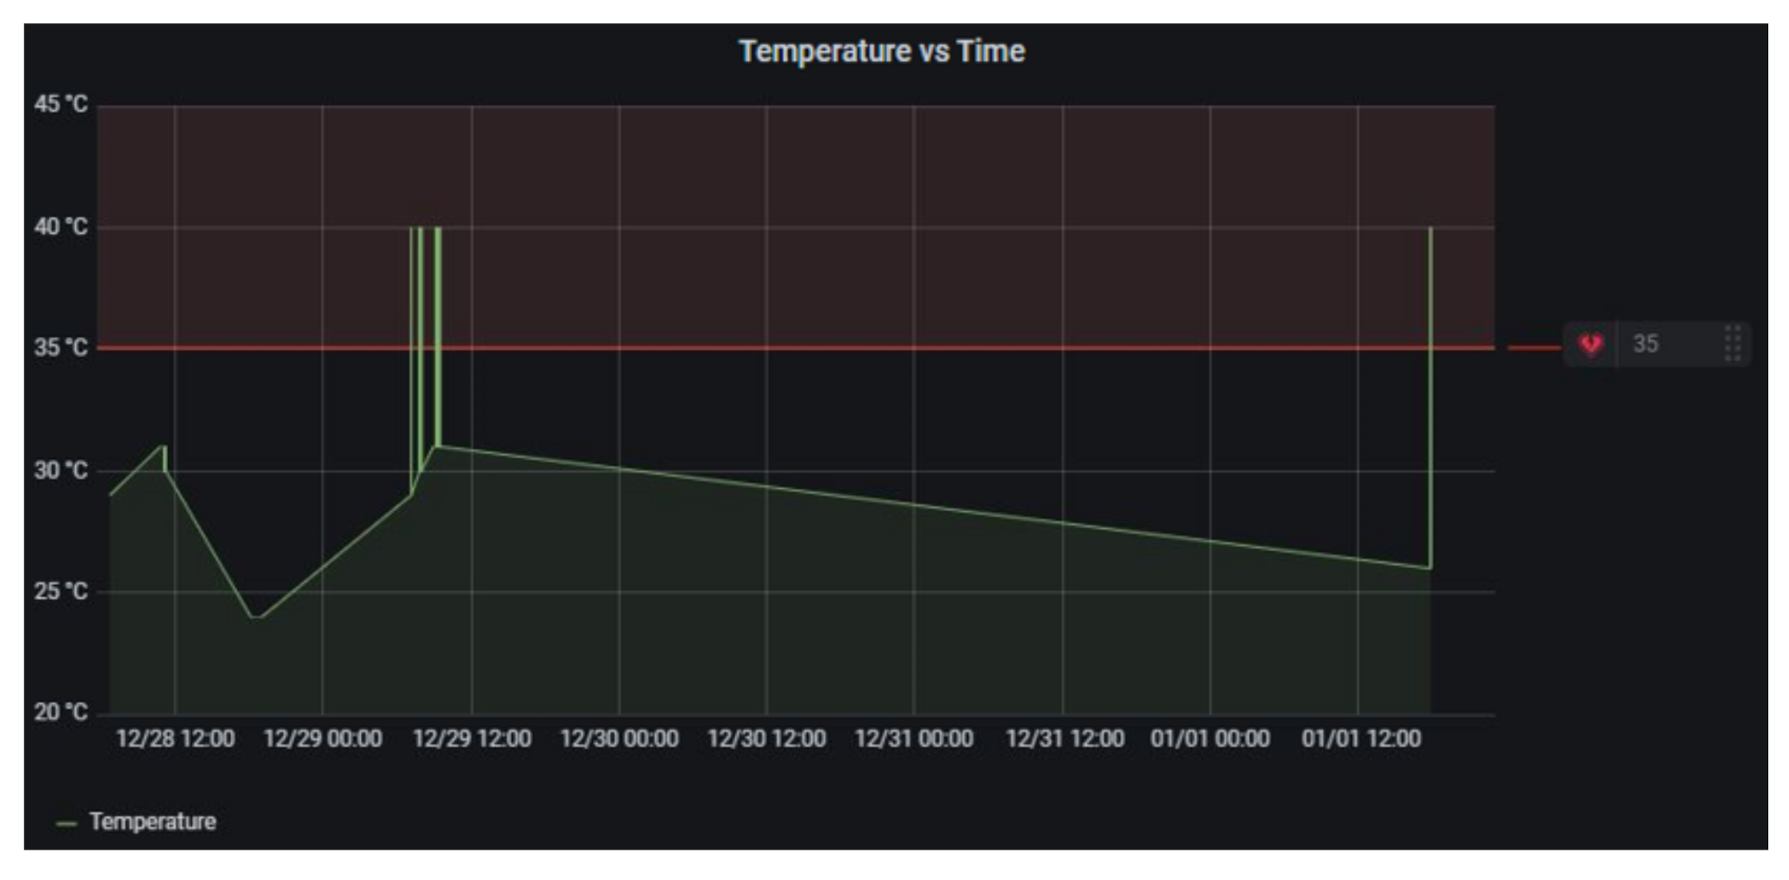
The visualization and monitoring of meteorological data from the sensor network use the open source software Grafana. This platform allows creating dashboards and multiple charts from different sources of information, in this case, a MySQL database. In the graphical interface design, a table shows the temperature values in Celsius, wind speed in m/s, and wind direction in sexagesimal degrees of the 60 sensor nodes that make up the VSN, while historical graphs observe changes in these parameters over time.
Figure 9 shows the final interface for VSN monitoring
The temperature was selected as the analysis parameter in the early warning configuration. The normal range for a dry forest is between 20.2 and 26.7
C (
https://bioweb.bio/faunaweb/amphibiaweb/RegionesNaturales, accessed on 25 January 2021). The value of 35
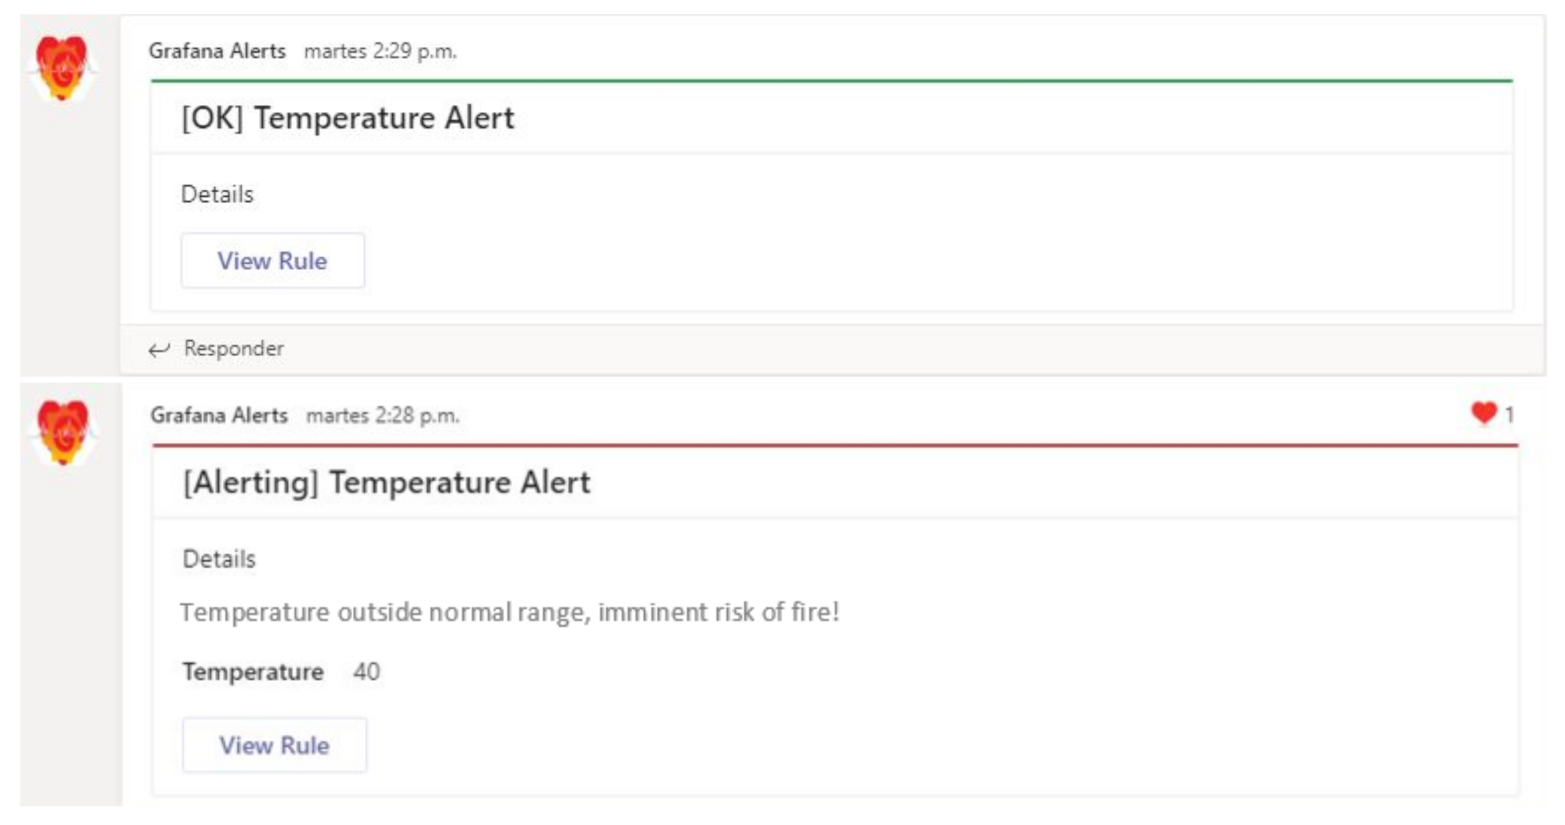
C is chosen as the maximum threshold. The system automatically searches for the VSN sensor with the closest location to the fire and changes its temperature value to one higher than the configured maximum threshold. When any data are above this limit, Grafana immediately sends the alert message, as shown in
Figure 10.
Finally,
Figure 11 shows the Grafana warning messages.
Figure 11 (top) shows the case is when all sensed values up to that moment are within the normal range, while
Figure 11 (bottom) shows the case when there are sensed data above the configured limits.
5. Discussion and Conclusions
This article presents the impact of evacuation routes in different fire scenarios considering the study area is a forest. The study incorporated the terrain’s physical elevations, the meteorological data sensed in real-time, and a fire propagation algorithm to obtain more precise and realistic simulation results. The results show that the evacuation route reacts to the presence of fire in the forest, deviating from its original direction and identifying another appropriate route that maintains a safe distance from the fire, although this is not the shortest route to an arrival point. The model for calculating evacuation routes is focused on forested areas but does not take into account whether there is a tree or physical obstruction due to geo-referential positioning; however, with the precision of the data obtained from latitude, longitude, and elevation being approximately one step, there may be a minimal margin of error concerning the calculated evacuation route. The tool is expected to serve as a reference to find optimal evacuation routes that relief agencies can consider in emergencies, knowing that the algorithm uses some variables and is coupled according to the wildfire spread.
The algorithm was used for multiple scenarios where the study area is a forest; the configuration is simple because only the new longitude/latitude coordinate must be inserted to calculate the evacuation routes. The model is limited to knowing geo-positioning points that are used by the algorithm; however, we are working on an algorithm that uses Google Maps with roads to improve the calculation of evacuation routes allowing it to be more realistic, in order to extend the model to other study areas, e.g., populated areas with a forest nearby. An important point to consider in the application is that, when studying larger areas, it must be analyzed by parts because doing it in a single execution could lower the fire propagation algorithm’s accuracy and evacuation routes.
The tools used by forest firefighters are limited; they can generate evacuation routes but only considering a starting point and the arrival point without considering fire propagation models and environmental variables as this application does. This prototype presents a firm path for constructing a digital tool (future work) that allows relief agencies to be immediately alerted to forest fire events, observe fire behavior in real time, and simultaneously offer safe evacuation routes as the event progresses. This tool’s application would help safeguard the lives of firefighters, rescuers, and civilians within the forest and minimize mortality rates in a similar event. All these scenarios are considered future works.


