1. Introduction
Low-impact development (LID) is the land planning and engineering design approach to the sustainable management of stormwater runoff. LID is recognised as very effective in mitigating the negative impact of urbanisation on hydrological processes, and various, although slightly different, approaches have been proposed and developed worldwide [
1,
2]. Urban flooding has become one of the most frequent natural disasters in recent years [
3], and LID is going to be used as an alternative to traditional grey infrastructures in order to control stormwater runoff at the source [
4].
In this context, the need to increase awareness among public authorities on the issue of stormwater management clearly emerges, as well as the need to improve capabilities in urban stormwater modelling—thus promoting the installation of LID solutions in urban catchments.
In the framework of urban stormwater modelling, geographic information systems (GIS) represent a growing technology designed for storing, analysing, and displaying data in a geographical context that can facilitate a better understanding of the hydrologic–hydraulic response of the urban area of concern, especially in critical areas where pluvial flooding occurs [
5] and accurate estimations of drainage characteristics are needed [
6]. Regarding the installation of LID systems, GIS allows evaluating the role of various LID systems under different hypotheses, including system configurations and environmental/operational conditions. Indeed, GIS applications can be designed to study the impact of LID scenarios with respect to several characteristics, e.g., stormwater quality, stormwater quantity, runoff pattern, piping network, and percentage of soil imperviousness of the drainage area.
The use of decision support tools (DSTs) is becoming more and more widespread in the estimation of the impact and/or added values of LID in providing ecosystem services, stimulating higher real estate prices, and preventing flooding problems in the medium–long term, and hence, DST constitutes a potentially powerful tool when addressing future planning and the rehabilitation of urban spaces [
7,
8]. Even if many approaches exist to determining the values of LID, new tools are needed to interpret the vast quantity of information in an integrated assessment in order to support planning, including suitable approaches to better balance environmental and socioeconomic aspects and to account for stakeholder opinions so as to select more widely accepted solutions [
9,
10].
Considering these challenges, the project TRIG Eau “Trans-Boundary, Resilience, Innovation and Governance for Hydrogeological Risk Reduction” aims to strengthen the resilience of French and Italian territories exposed to hydrogeological and hydraulic risk by promoting the implementation of sustainable water management strategies in territorial planning, at both a regional and local scale. The TRIG Eau project was founded within the Interreg Italy France Maritime Programme 2014–2020 co-financed by the European Regional Development Fund (ERDF) within the framework of the European Territorial Cooperation (ETC) and involves four Mediterranean regions: Liguria, Tuscany, and Sardinia within the Italian territory and the Provence-Alps-French Riviera (PACA) within the French territory. The project, which started in 2017, recently ended. Among the relevant sub-objectives of the project, the potential impact of LID systems implemented within the urban landscape was evaluated by means of a web-GIS platform for urban flood evaluation. The results of the survey run by means of relevant stakeholder interviews and questionnaires within the TRIG Eau project [
2] evidence that the types of LID considered to be the most interesting for drainage system updates are domestic rainwater harvesting (DRWH) systems.
DRWH systems have been largely recognised as among the key tools for LID solutions that aim to restore the natural hydrologic cycle in the urban environment. Indeed, DRWH limits the demand for potable water [
11], and at the same time, contributes to controlling stormwater runoff at the source by providing distributed retention storage throughout the catchment [
12]. The ability of conventional DRWH systems to simultaneously provide the dual benefit of water supply augmentation and stormwater detention has recently been recognised and investigated through both modelling and experimental studies see e.g., [
13,
14]. Although DRWH systems are increasingly being designed with a focus on low-impact stormwater management, design protocols and recommendations are still often drawn up with the objective of saving water without considering the other potential benefits associated with the multiple-purpose nature of DRWH systems. Campisano et al. [
15] indicated that the degree of DRWH system implementation and technology selection is strongly influenced by economic constraints and local regulations and suggest that research should be devoted to the understanding of how institutional and socio–political support can be best targeted to improve system effectiveness and community acceptance.
In this framework, the main objective of the present research was to develop a web-GIS application in order to assess the impact of LID systems in mitigating urban flooding. In the web-GIS application, case study webpages are implemented in order to provide a reference study in the field of urban flood risk mitigation for specific urban areas. The first specific objective was to illustrate the architecture and the functioning of the case study webpage for the implementation of LID systems. Finally, the developed approach and the robustness of the numerical algorithms are tested on selected case studies in the Liguria Region and Tuscany Region (Italy), where specific DRWH scenarios have been foreseen.
2. Materials and Methods
2.1. The TRIG Eau Platform
The TRIG Eau platform, developed within the homonymous project, had the general aim of raising awareness on stormwater management issues and promoting the use of LID systems to restore the natural hydrological cycle by favouring infiltration and reducing runoff, thus achieving the principles of hydraulic and hydrological invariance. The TRIG Eau platform was configured as a web-GIS application of the EPA’s Storm Water Management Model (SWMM) v. 5.1.007 [
16], relating to the simulation of the hydrologic–hydraulic behaviour of a drainage network in an urban environment. The platform consists of two main pages: the case study webpage and DST webpage, both configured to support decisions on the selection of innovative solutions that are not very widespread today. The web-GIS application is available online (
http://www.trigeau.servergis.it/it, accessed on 28 June 2021) in Italian and French. The web interface was built on the Plone content management system which itself was built on the Zope Python application server.
Through the TRIG Eau case study webpage, the user can consult and query the results of four case studies (see the link
http://www.trigeau.servergis.it/it/casi-di-studio, accessed on 28 June 2021) carried out in the 4 regions involved in the project: Liguria, Sardinia, Tuscany for Italy and Provence-Alps-French Riviera (PACA) for France.
2.2. The Case Study Webpage
In the TRIG Eau platform, the case study webpage was implemented according to the following methodological approach:
Urban area analysis;
Hydrologic–hydraulic modelling of the actual scenario;
Actual flood conditions;
LID intervention design and modification of the urban area;
Hydrologic–hydraulic modelling of the post intervention scenario;
Performance analysis.
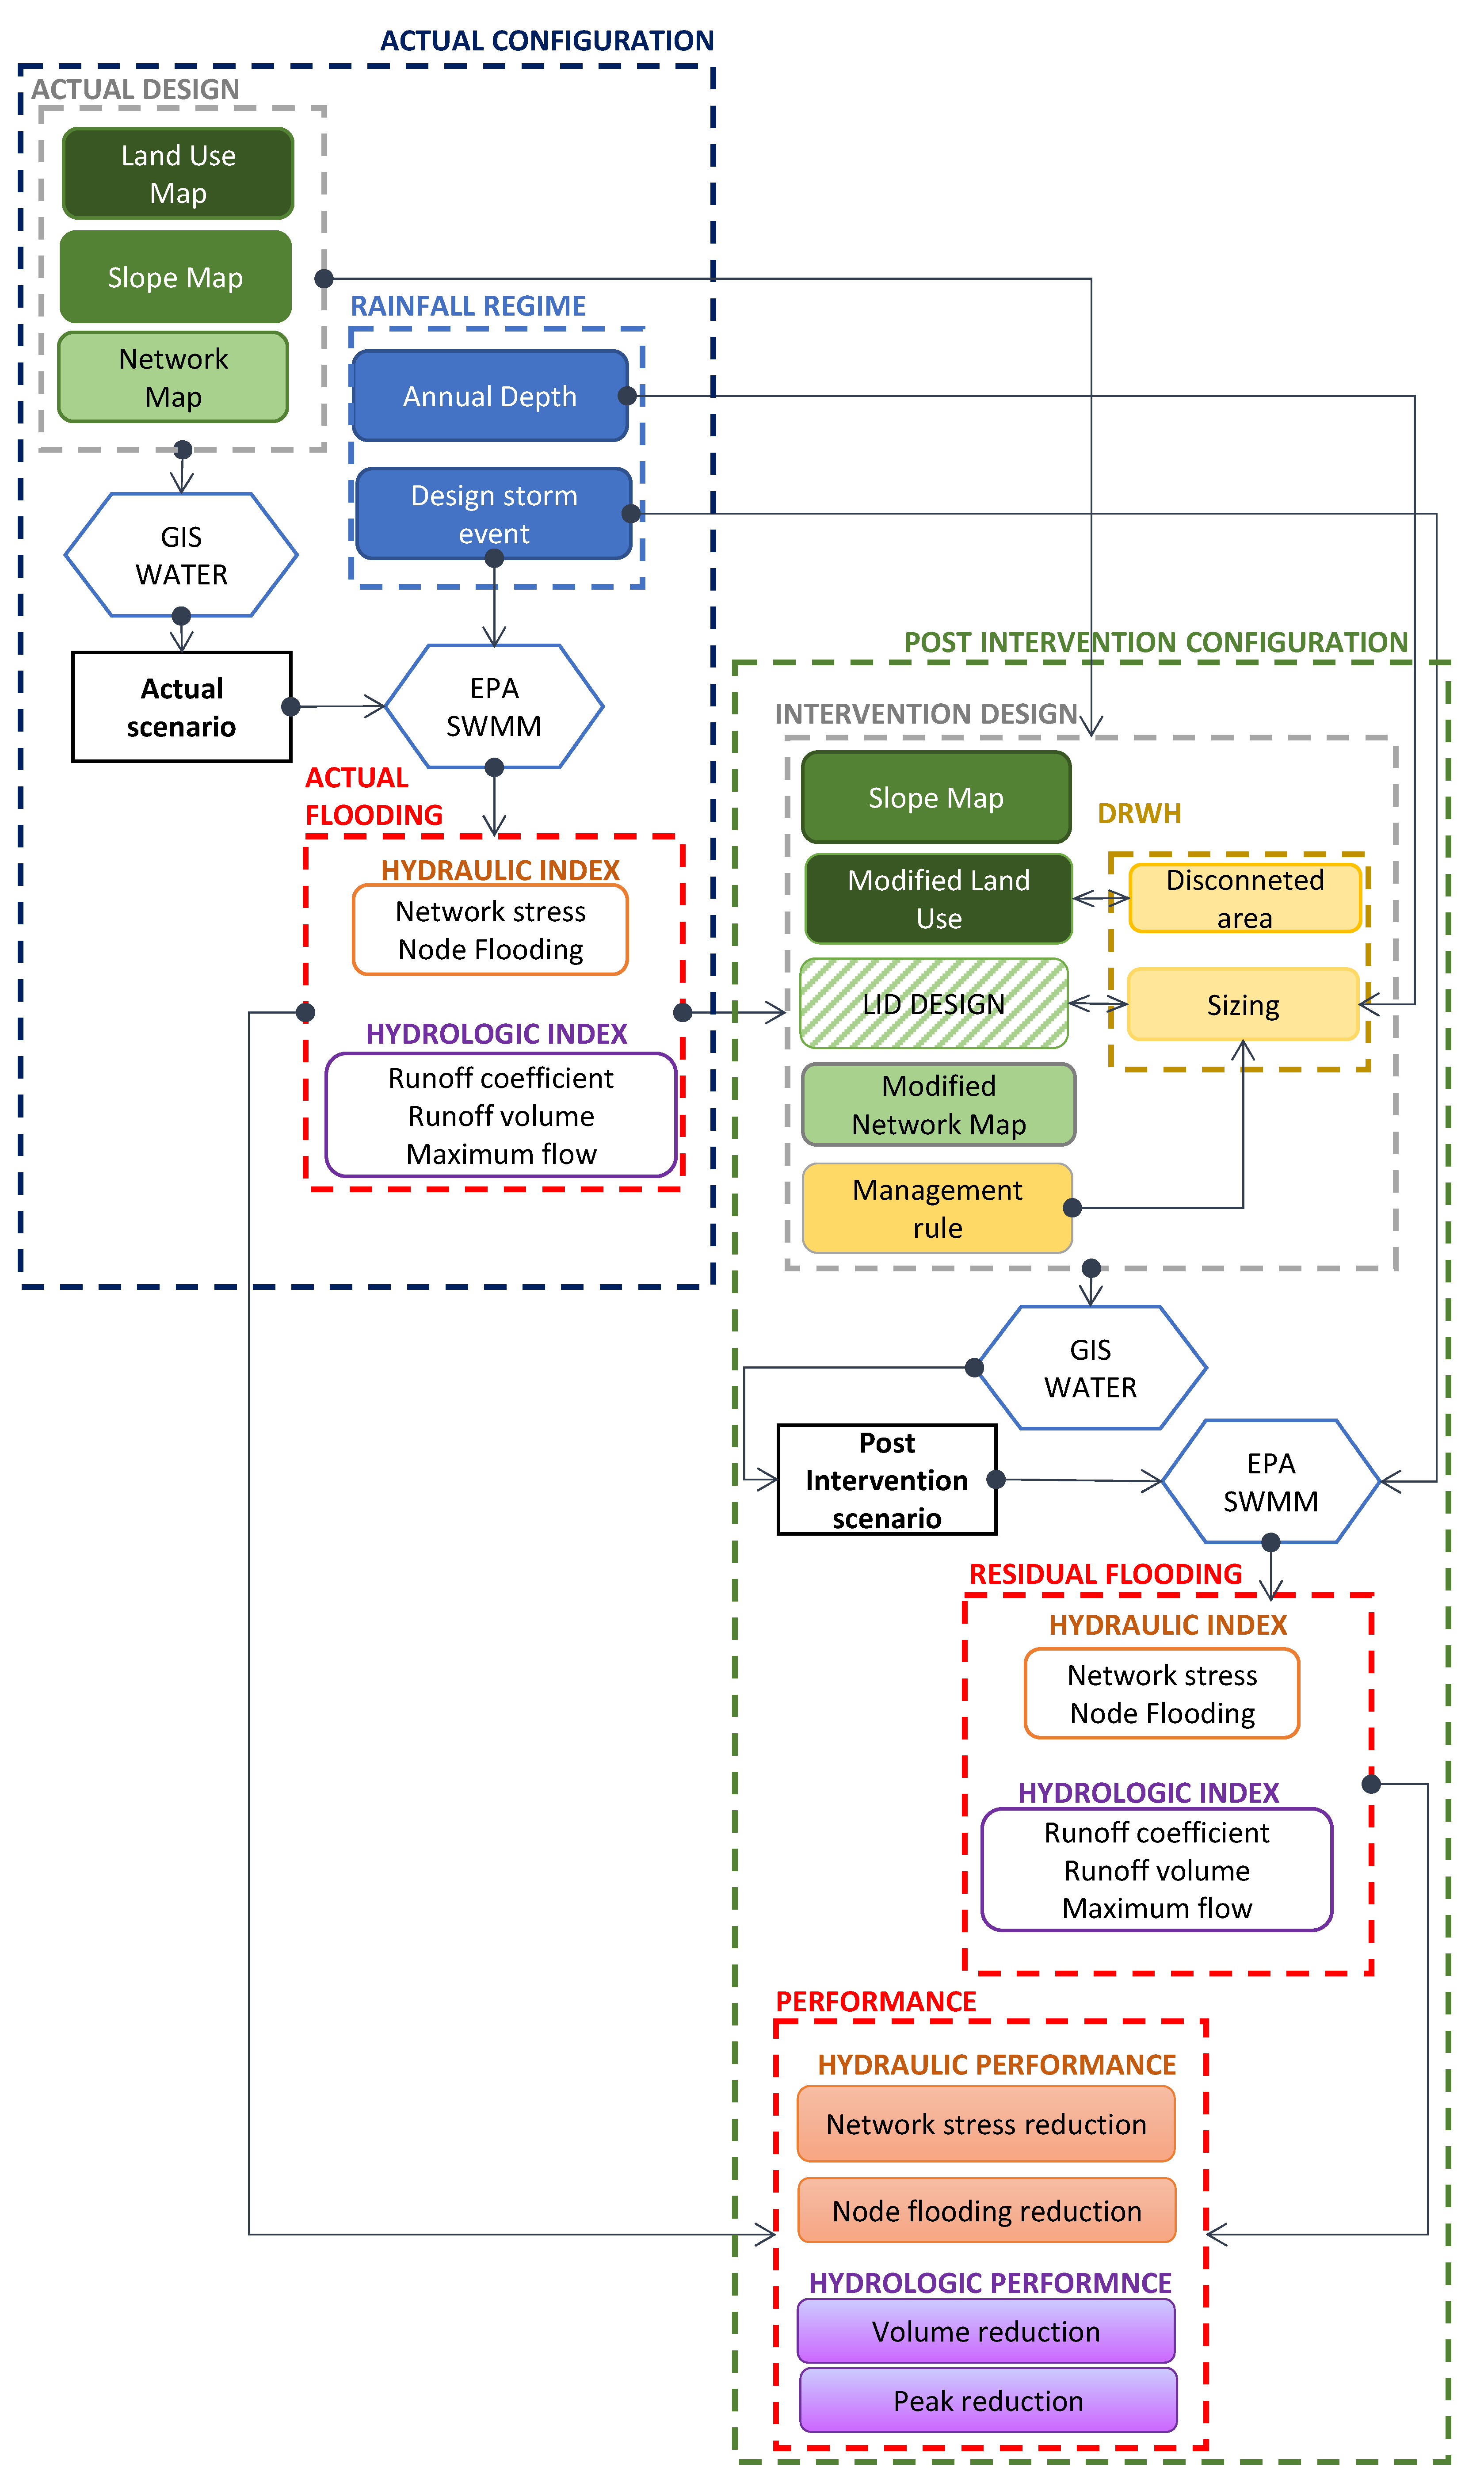
In detail, the flow chart of the case study webpage is illustrated in
Figure 1. The
actual scenario, corresponding to the current configuration of the urban area, is implemented by means of the open source application GIS WATER (
https://www.giswater.org, accessed on 28 June 2021); such an application allows the management and exploitation of the urban drainage system, connecting the spatial database related to land use, surface slope, and stormwater network configuration. The hydrologic–hydraulic simulation was undertaken the SWMM model v.5.1.007 using selected design storms as input data. Simulation results were analysed by means of both hydraulic and hydrologic indexes describing, respectively, the status of the drainage network and the hydrologic response, thus measuring the actual flood conditions. The
post intervention scenario corresponds to the configuration of the urban area including the hypothetical installations of LID systems. It was implemented by means of GIS WATER, modifying the reference land use and the network characteristics according to the foreseen LID systems whose design was based on the hydraulic stress of the
actual scenario. The hydrologic–hydraulic simulation was performed including the SWMM LID modules, then the residual flood condition was assessed by means of the aforementioned hydraulic and hydrologic indexes. Finally, the performance of the proposed LID systems was quantified as the percentage difference between the hydraulic and hydrologic indexes of the
actual and
post intervention scenarios.
The data necessary for the implementation of a case study webpage can be classified into two macro-categories: spatial data (georeferenced) and non-spatial data. As for the spatial data, the minimum list concerns: the satellite view of the study area; map of the main urban road network; map of the foreseen intervention areas (illustrated as green boxes in
Figure 1). Further helpful spatial data concern a land use map; map of the stormwater drainage network; and digital elevation map. As for the non-spatial data, the minimum list relates to: the size and shape of the main conduits of the drainage network; main characteristics of the foreseen LID interventions; rainfall characteristics (illustrated as yellow and blue boxes in
Figure 1). Further helpful non-spatial data concern high-temporal resolution rainfall data series (i.e., 5 min); design and sizing data of the LID systems.
The configuration of the TRIG Eau case study webpage involves three sections that illustrate, respectively, the main information/results relating to: the actual scenario section (on the left side of the page), the post intervention scenario section (on the right side of the page), and the section including the corresponding performance indexes (at the bottom side of the page).
The actual scenario section consists of a georeferenced map that illustrates the planimetric configuration of the drainage network, including the diameters and slopes of the conduits and the locations of the junction and outlet section together with the subcatchment areas. In this section, the user selects the magnitude of the design storm (expressed as return period in years) from button options, then the georeferenced map is updated, reporting the subcatchment runoff coefficients and the arc flow conditions (in terms of maximum fulfilment degree). Furthermore, in the actual scenario section, a table shows the Network Stress Index (NSI) and the Node Flooding Index (NFI), which quantifies the hydraulic functioning of the storm drainage network in the selected precipitation regime. The post intervention scenario section is composed of a sub-section where the user selects the main characteristics of the intervention (e.g., the number of DRWH systems) from a drop-down menu, as well as the initial conditions of the systems (e.g., empty or full system) from button options; similarly to the actual scenario section, a georeferenced map and a table reporting the NSI and NFI are included. The georeferenced map of the post intervention scenario illustrates the arc flow conditions in terms of the subcatchment runoff coefficients and the maximum fulfilment degree corresponding to the selected design storm event with respect to the intervention scenario. Finally, the bottom section illustrates the performance indexes organised into two tables reporting, respectively, the system and the hydrologic performance. The Network Stress Reduction (NSR) and Node Flooding Reduction (NFR) indexes measure the system performance, while the Volume Reduction (VR) and Peak Reduction (PR) indexes measure the hydrologic ones. In order to provide the easily visualisation of the results, the four performance indexes (NSR, NFR, PR and VR) are illustrated by means of a radar graph.
2.3. The Performance Indexes
The TRIG Eau platform provides simple indexes quantifying the hydraulic functioning of the storm drainage network and the performance under the post intervention scenario in order to support the results analysis and stakeholder participation.
The NSI and NFI are the two non-dimensional indexes that measure the hydraulic functioning of the storm drainage network—such indexes are defined according to Ercolani et al. [
17] as follows:
where
is the number of conduits that show maximum fulfilment greater than 0.8,
is the total number of conduits,
is the number of junctions that are flooded, and
is the total number of junctions.
The NRS and NFR indexes that measure the performance of the
post intervention scenario were evaluated based on the aforementioned indexes NSI and NFI by calculating the relative percentage difference between the index values assessed in the
actual and
post intervention (including LID solutions) scenarios:
where the subscript 0 refers to the
actual scenario and the subscript LID refers to the
post intervention scenario.
Furthermore, the well-known hydrologic performance indexes, VR and PR, are evaluated as follows [
18]:
where V and Q indicate, respectively, the total runoff volume and the maximum flow rate observed at the outlet section of the catchment, where subscript 0 refers to the
actual scenario and the subscript LID refers to the
post intervention scenario.
3. The DRWH Case Studies
The use of DRWH systems as an urban flooding mitigation strategy was tested in the two selected case studies, located in Liguria and Tuscany (Italy).
The study areas are residential urban blocks characterised by a similar urban planning that includes semidetached houses with private gardens and parking areas, located in Camogli (Liguria, IT) and Campo nell’Elba (Tuscany, IT).
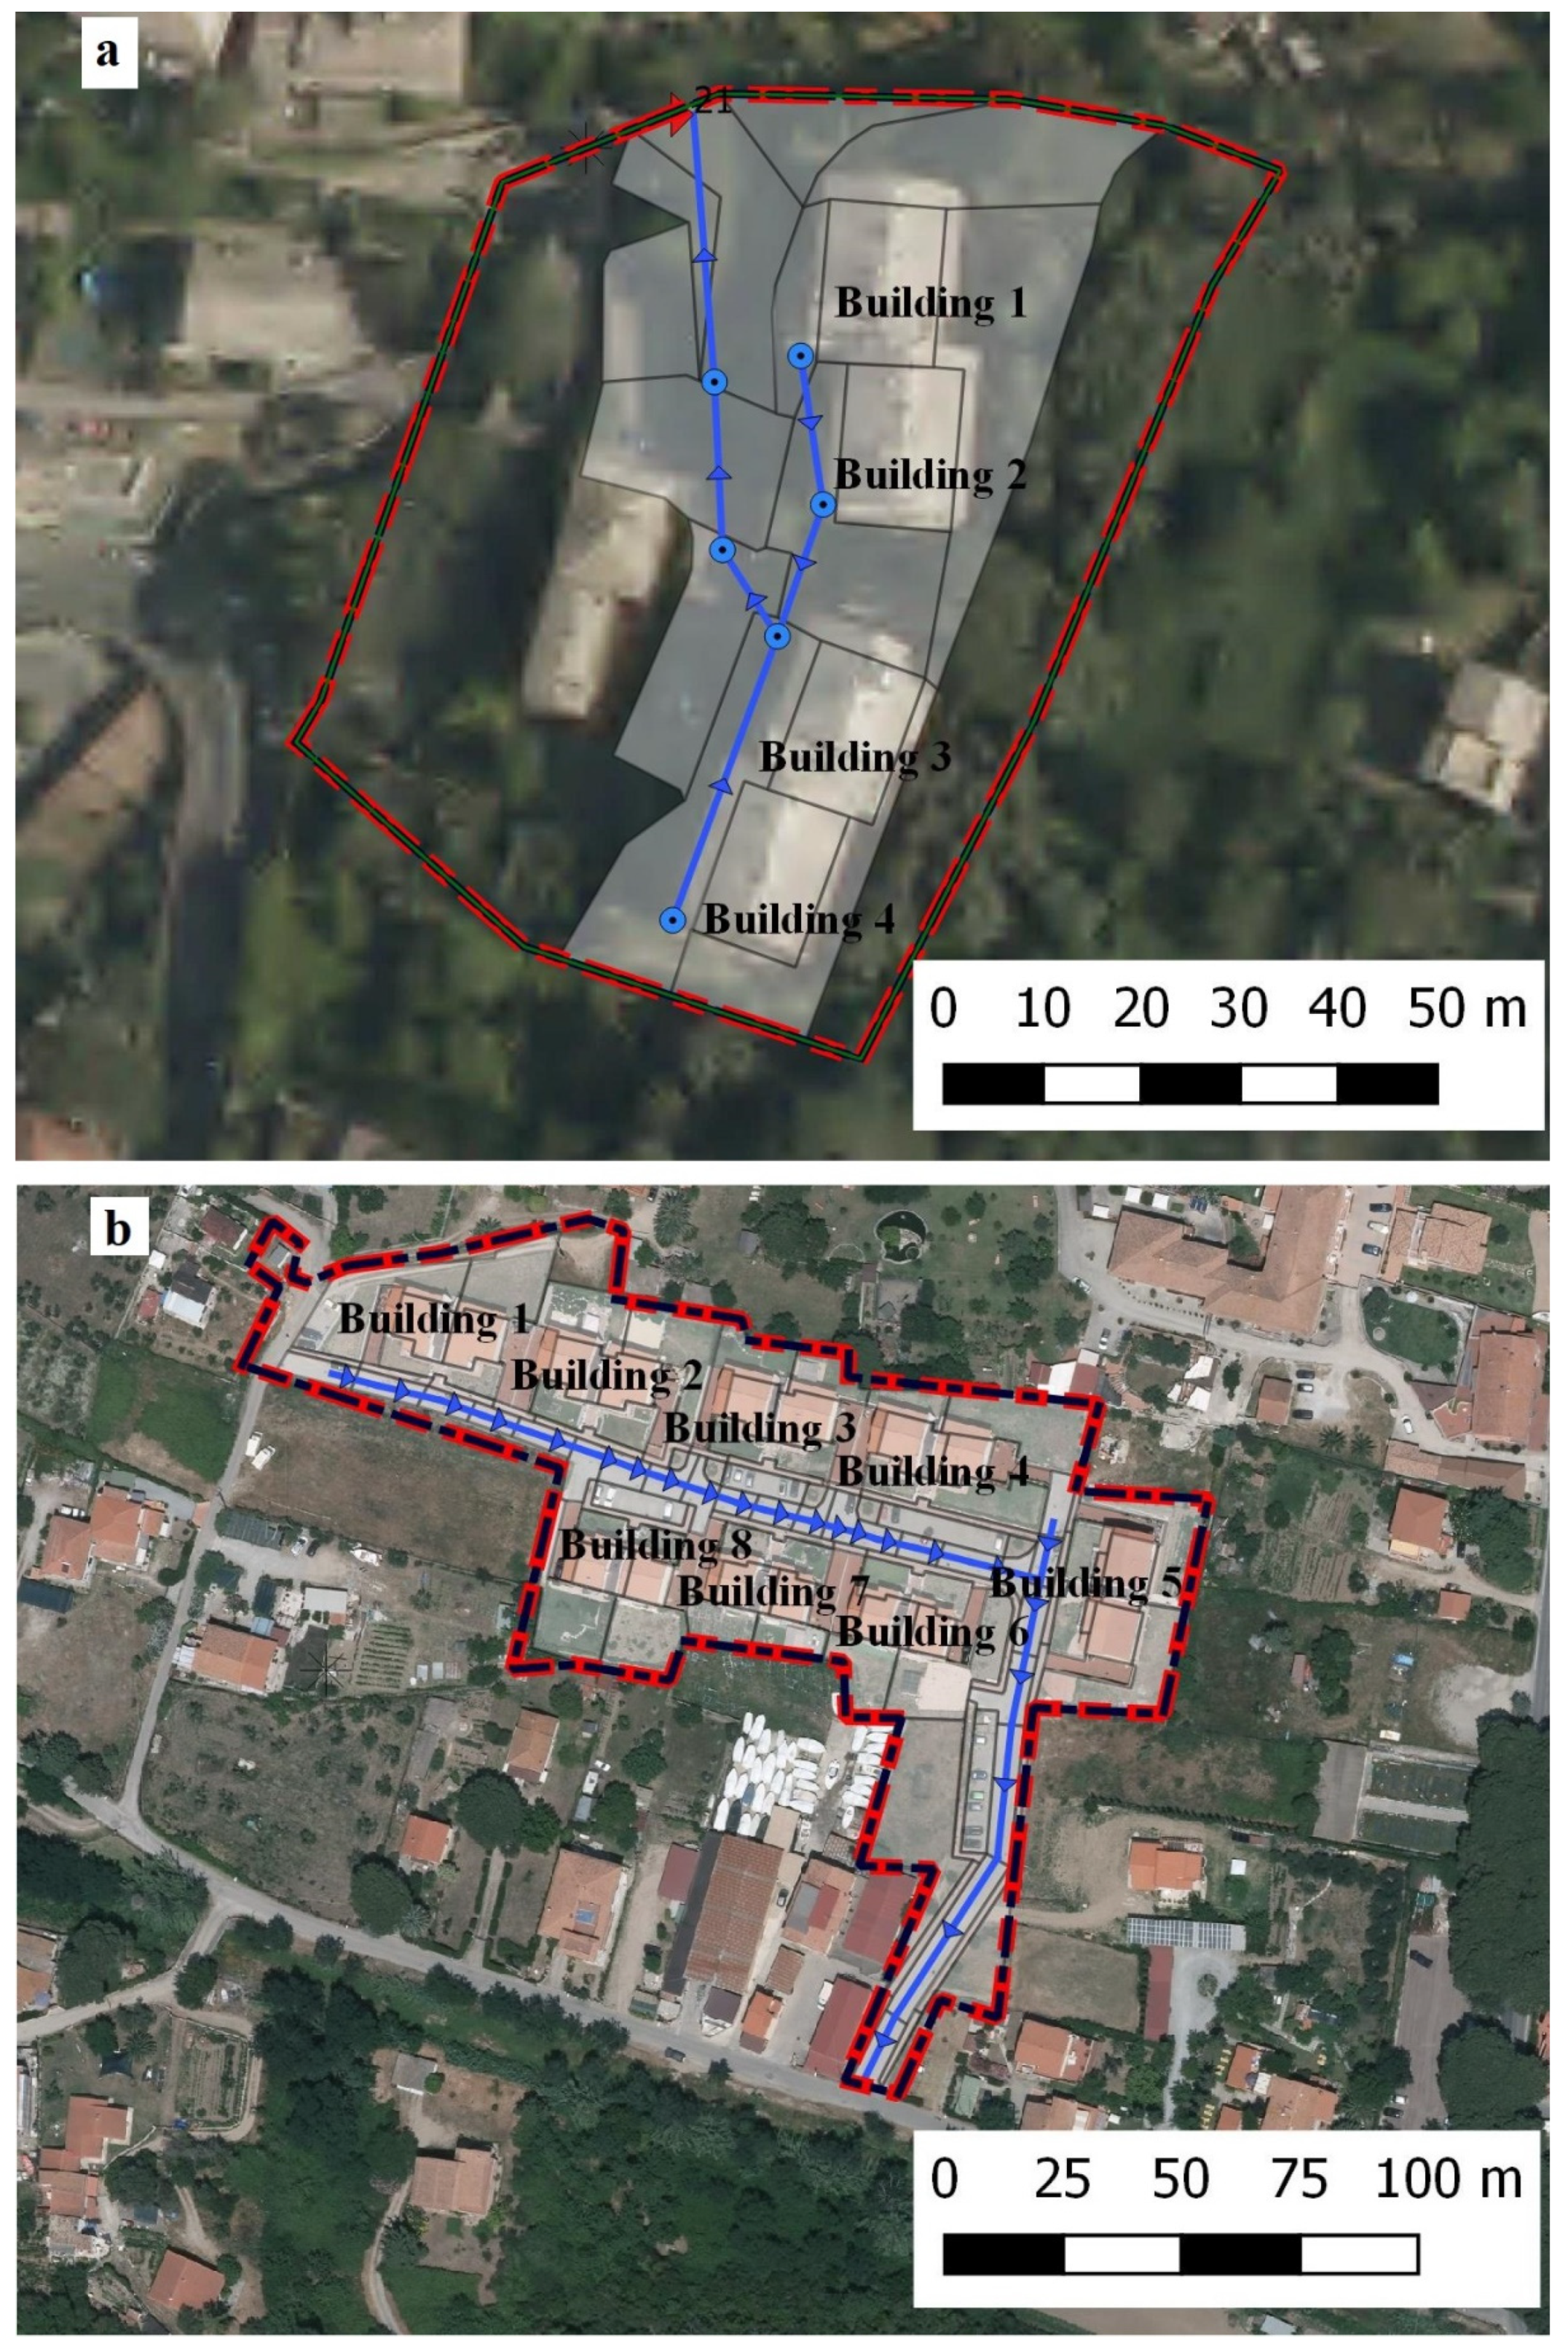
Figure 2 provides an overview of the study areas: the Camogli study area covers approximately 0.3 ha and includes four buildings while the Campo nell’Elba study area is approximately 1.12 ha and includes eight buildings. The Municipalities of Camogli and Campo nell’Elba provide the following data:
View of study areas (satellite view and orthophoto);
Map of the stormwater network including shape and diameter of the main conduits;
The digital terrain model (resolution of 2 × 2 m);
Daily rainfall depth data records;
Residential occupancy of buildings (number of inhabitants).
The provided data were analysed and organised by means of GIS WATER in order to implement the case study webpage.
The management of stormwater is separated from the sewer system and addressed according to the traditional approach; in particular, the separate sewer system (represented as blue lines in
Figure 2) consists of pipes located below the street network without any LID source control solutions apart from permeable pavements for parking areas and sidewalks for the Campo nell’Elba case study.
As illustrated in
Table 1, land uses are classified as rooftop, road and parking lot, private gardens, green areas, permeable parking, and permeable sidewalks; total impervious/pervious areas are calculated based on the orthophoto maps. The analysis of land use data reveals that the impervious surfaces cover, respectively, 50% and 33% of the total study areas for Camogli and Campo nell’Elba, respectively, while rooftops account for 23% and 16% of the total areas, thus confirming that both settlements show a low degree of soil sealing.
For the Camogli study area, the actual scenario (see
Figure 2—left side) is simplified by means of 16 subcatchments, seven junctions, six conduits, and one outfall; while for Campo nell’Elba (see
Figure 2—right side), the study area consists of 102 subcatchments, 24 junctions, 23 conduits, and 1 outfall. It has to be noticed for both case studies that the subcatchments are characterised by single-land use type and homogenous properties according to the required high-spatial discretisation.
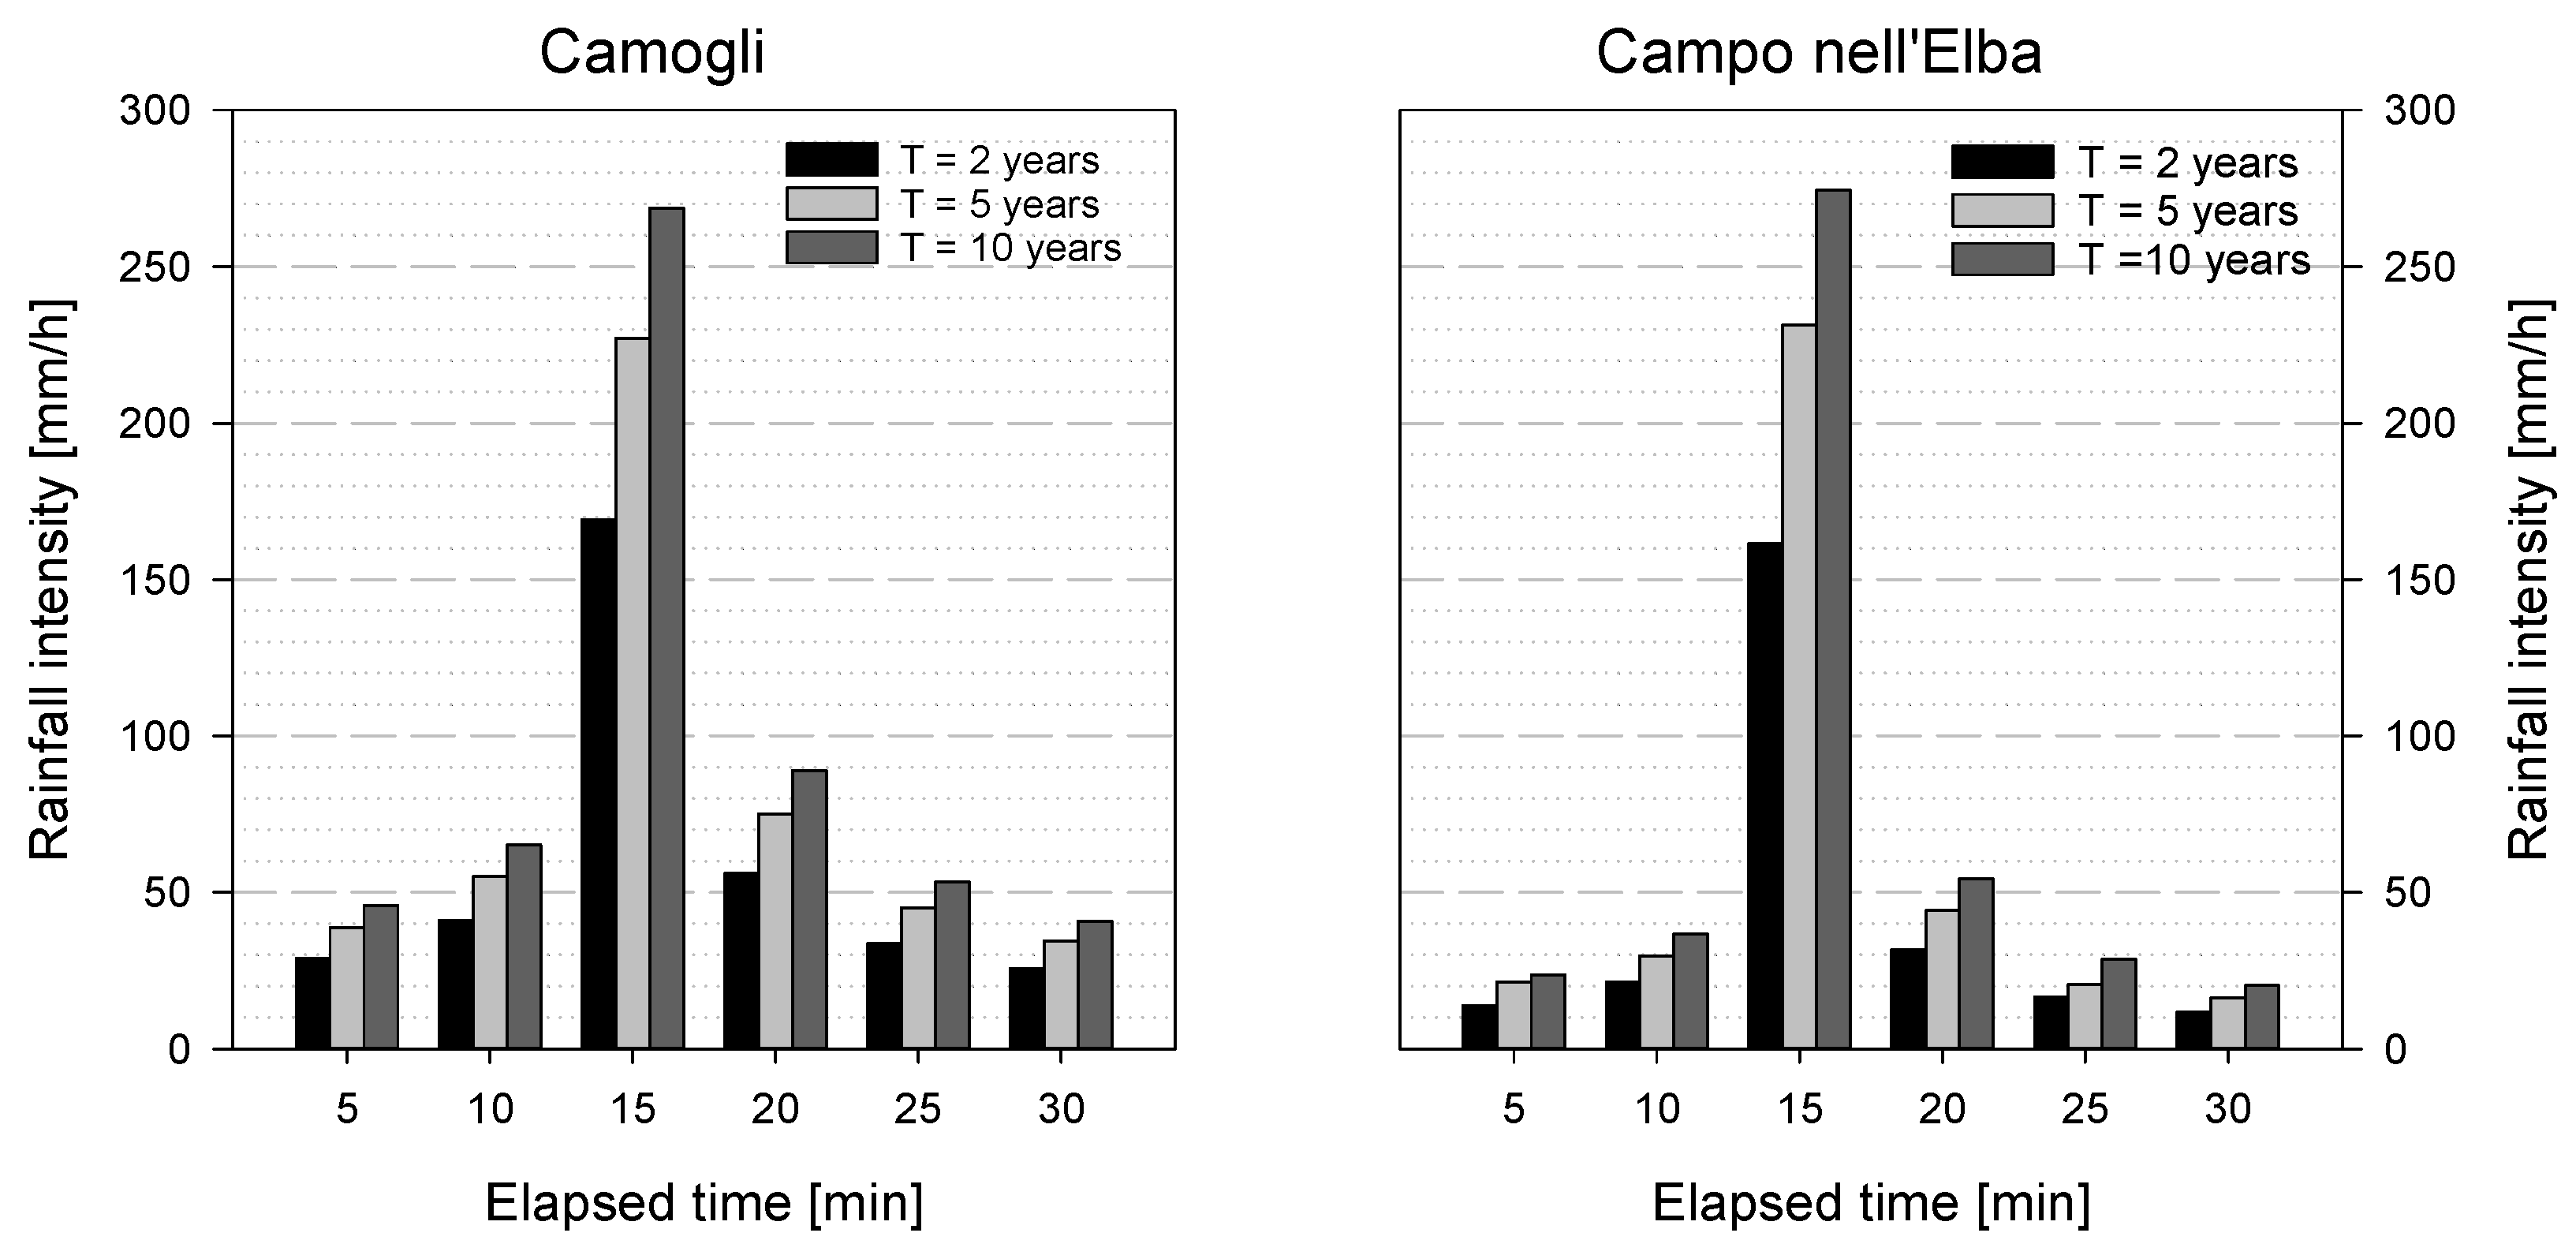
The rainfall precipitation regimes were analysed with respect to the average annual depths to the size of the DRWH systems and the maximum annual depths for the given durations to calculate the synthetic design storms. The annual depths are, respectively, examined based on rain data collected at the Colonia Arnaldi rain gauge station (Lat 44.4084; Lon 9.18148) and at the Monte Perone rain gauge station (Lat 42.775; Lon 10.191) located, respectively, in the vicinity of Camogli and Campo nell’Elba. The statistical analysis of the annual rainfall depth was based on the observed series of daily rainfall depth recorded during the period 2004–2018 for Colonia Arnaldi (Camogli) and during the period 2012–2018 for Monte Perone (Campo nell’Elba); the resulting average values of the annual rainfall are, respectively, 1145 and 825 mm. The synthetic design storm events were computed referring to the regional studies on the extreme precipitations of Liguria (DGR 359/2008) and Tuscany (DGRT 1133/2012) Region. In particular, for the Camogli case study, the estimation of the parameters of the depth–duration–frequency (DDF) curve was carried out based on the local estimation at Colonia Arnaldi, according to the Scale-Invariance Generalized Extreme Value model, while for the Campo nell’Elba case study, the DDF parameters were derived for the study area (Lat 45.388; Lon 11.726) based on a regional rainfall frequency analysis and two-component extreme value distribution. Based on the aforementioned DDF relationship, the synthetic design storm events were computed using the Chicago method for three return periods: namely 2, 5, and 10 years. The rainfall duration is assumed to be 30 min and the time-to-peak ratio is equal to 0.5.
Figure 3 shows the Chicago hyetographs evaluated for the two case studies with respect to the three selected return periods (T = 2, 5, and 10 years). Note that the Chicago method was selected in order to generate a synthetic rainfall event that shows the maximum intensity over each subevent duration [
19].
4. Results
Results are presented for each case study with respect to the selected
post intervention scenario corresponding to the DRWH system installed for each building. The results refer to the simulations performed, assuming two different initial conditions of the DRWH system: the empty or full status of the tank. Cartographic and numerical results are here presented and discussed. For further details, including other
post intervention scenario results, please refer to the TRIG Eau web-GIS application
http://www.trigeau.servergis.it/it (accessed on 28 June 2021).
4.1. Modelling and Validating the Actual Scenarios
The hydrologic response of the urban catchment was simulated using the SWMM in order to assess the hydraulic functioning of the storm drainage network. The Soil Conservation Service–Curve Number (SCS-CN) method was here used to estimate the infiltration losses and runoff was calculated using Manning’s equation. Despite some of the limitations of the use of the SCS-CN method in the continuous models, it remains the most widely used technique to determine runoff volumes and peak discharges [
16]. The main hydrologic and hydraulic parameters assigned as input values in the simulations of the
actual scenario for the Camogli and Campo nell’Elba case studies are listed in
Table 2. Note that for the percentage of impervious areas in each subcatchment, no infiltration losses are computed, while the surface interception was assigned equal to 0.5 mm. As for the flow routing computation, the kinematic wave theory was used.
Model validation strategy was based on the discussion of the predicted outflow hydrographs and network stress indicators (NFI and NSI), with stakeholders during the participatory-design table held, respectively, on 18 October 2019 at the Municipality of SanRemo and on 13 June 2019 at the Municipality of Campo nell’Elba.
4.2. Urban Flood Assessment
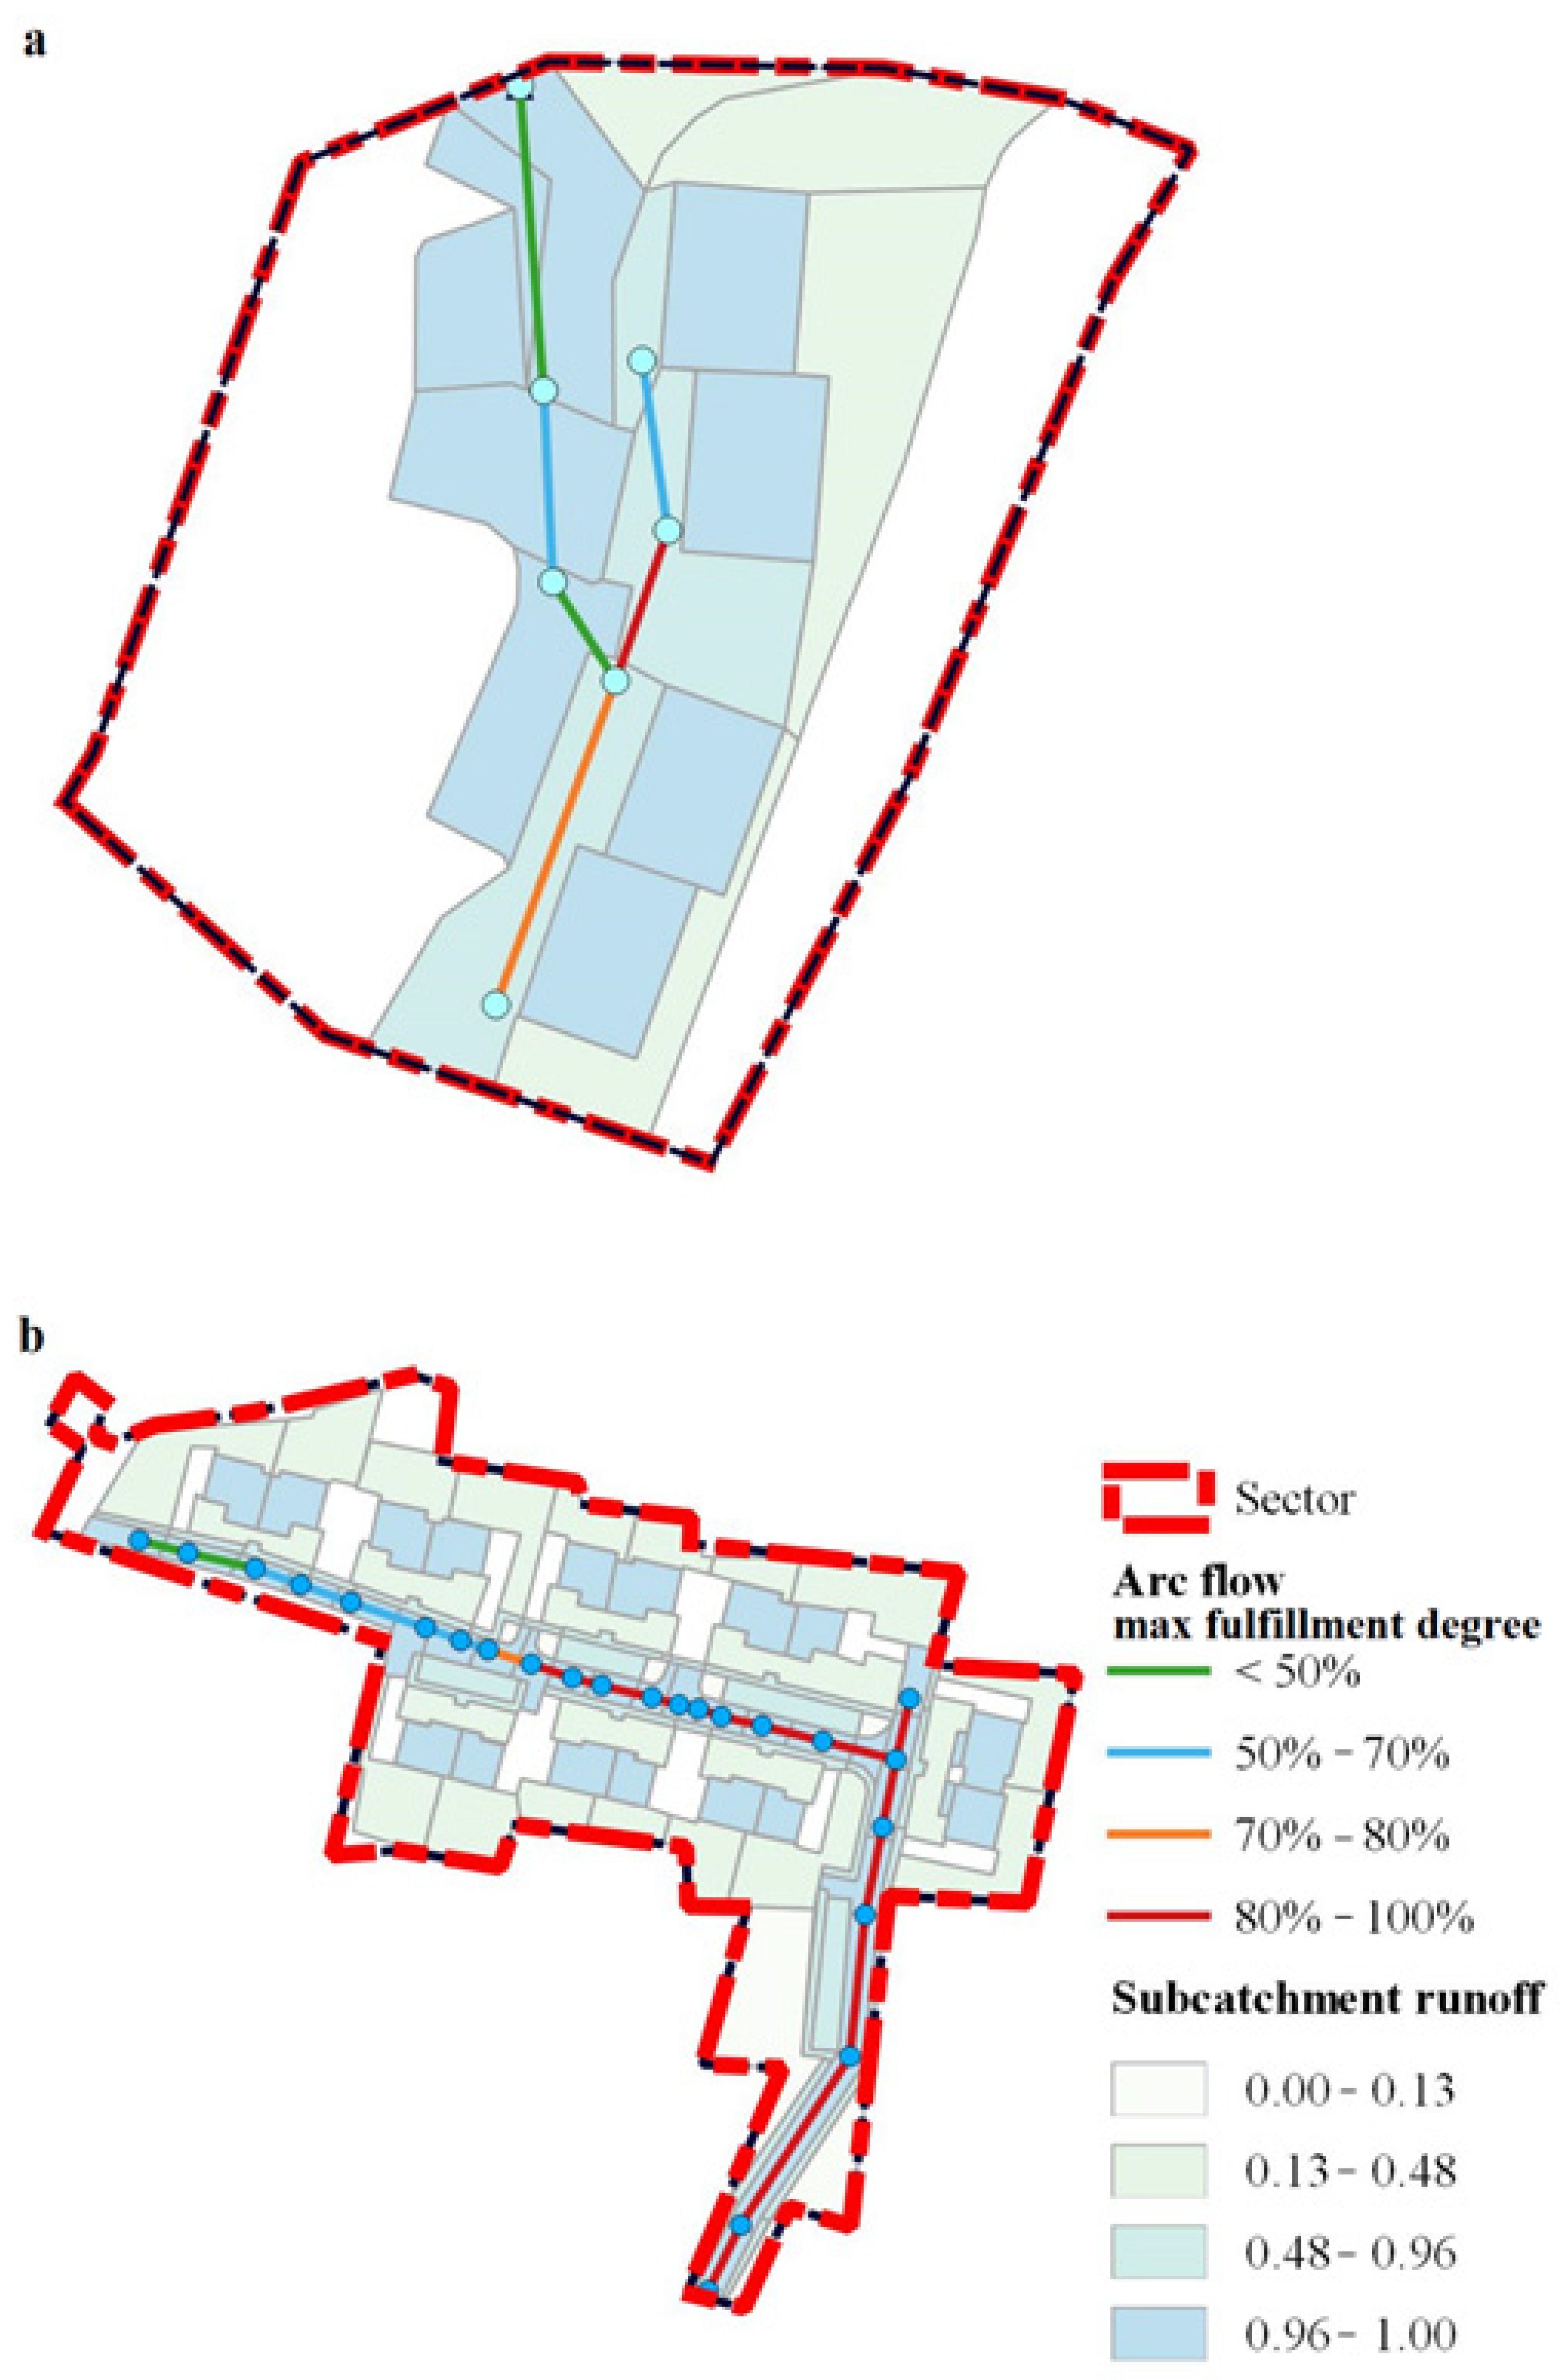
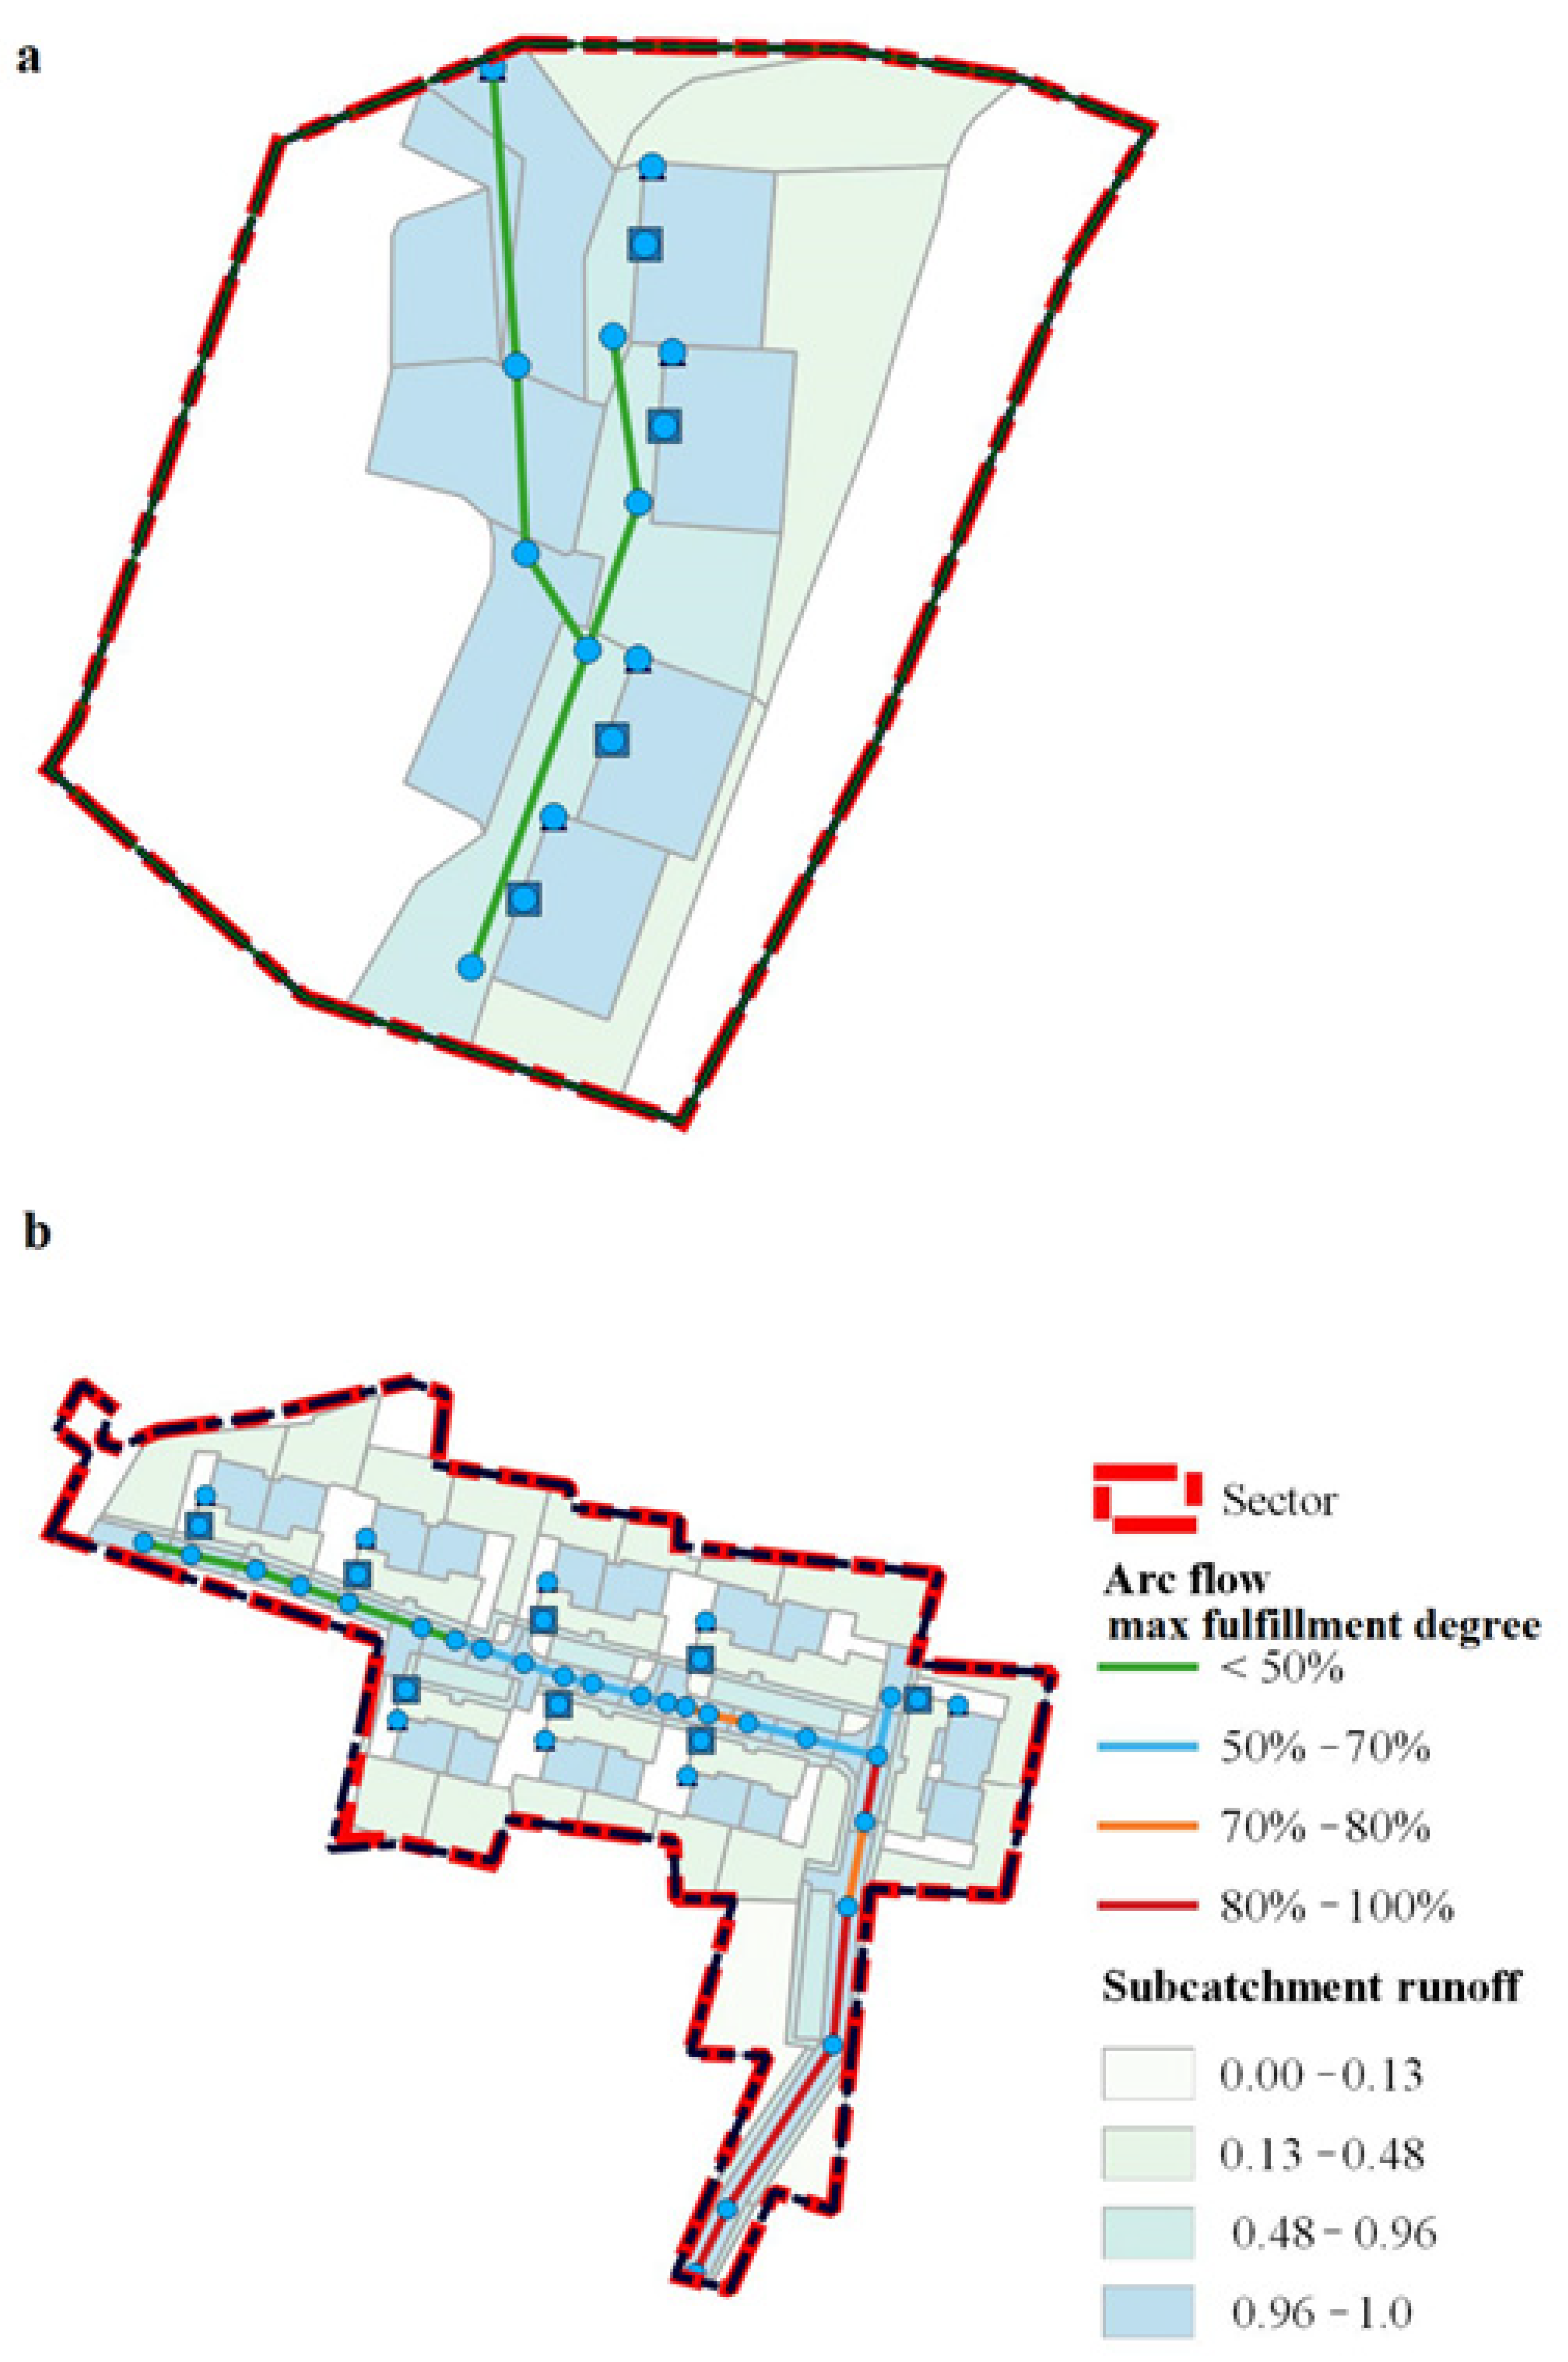
The assessment of the urban flood conditions reveals a similar behaviour for the two cases, as graphically shown in
Figure 4, where the arc flow conditions (in terms of maximum fulfilment degree) and the subcatchment runoff coefficient are reported.
The actual flooding index was low for both cases, since no node was flooded even for the 10-year design storm while the pipeline network was hydraulically stressed. In particular, the Campo nell’Elba drainage network reveals a higher hydraulic stress than the Camogli ones where it is observed that only one conduit over six shows a maximum fulfilment larger than 0.8, even with respect to the most severe event. Numerical results on the network stress and node flooding indexes for the Camogli and Campo nell’Elba case studies are listed in
Table 3 with respect to the investigated return periods (namely 2, 5, and 10 years). The Campo nell’Elba case study shows a more significant criticality of hydraulic stress of the network, as confirmed by the corresponding NSI indicator that is close to 50% for the 5-year return period event and overcomes the 60% for the 10-year return period event (as can be seen in
Table 3). Note that the quality of the input data (e.g., rainfall design storm and stormwater network characterisation) is a major issue for the urban flood risk assessment; furthermore, the availability of real-time measurements such as water levels in the stormwater drainage should improve the analysis accuracy [
20].
4.3. Implementing and Modelling the Post Intervention Scenarios
The installation of a DRWH system for each building of the urban block is herein assumed as an LID solution for mitigating the urban flooding risk. Among the different types of LID systems, the use of rainwater harvesting is planned by considering the good permeability condition of the areas and the limited availability of free surfaces on the ground; furthermore, this type of solution could be implemented within private properties and is largely accepted by communities [
2]. In each DRWH system, it is assumed that rainwater is only collected from rooftops, therefore, the occurrence of the first flush phenomenon is neglected. The roof runoff is collected in the corresponding storage tank and directly pumped to the point of use while the overflow is directly conveyed to the downstream drainage network. Furthermore, the water demand to be supplied by rainwater is limited to the toilet flushing and is assumed to occur at a constant daily rate [
21,
22]. The daily rainwater demand diagram with three different supplied periods was defined in order to reproduce the typical water consumption with well-defined peaks [
23].
The tanks were designed according to the simplified method as indicated in the Italian guideline UNI/TS 11445 [
24]. This method is based on the evaluation of two terms: the annual inflow, Q, and the annual water demand, D. In particular, the annual inflow is evaluated by multiplying the collected area with the annual runoff depth and the latter is determined by multiplying the annual rainfall depth with the discharge coefficient of the corresponding collected area, which for rooftops, is assumed to be equal to 0.8. The annual water demand for toilet flushing was evaluated by assuming a constant daily rate per person equal to 40 l/d [
24]. Based on information provided by the Municipalities of Camogli and Campo nell’Elba, the actual number of inhabitants for each building was assumed to be equal to 12 and 16 for Camogli and Campo nell’Elba, respectively. The storage volume of the tank was then assumed as 6% of the minimum value between the inflow and the water demand on an annual basis.
In
Table 4, the annual inflow volume, Q, and the water demand, D, together with the main characteristics of the DRWH systems (including storage capacity and storage fraction) are listed for the investigated buildings of the Camogli and Campo nell’Elba study areas.
Compared to the actual scenario, the post intervention scenario includes one storage unit, one weir, two pumps and one outfall for each DRWH system, thus resulting in:
Four storage units, four weirs, eight pumps and four outfalls for Camogli;
Eight storage units, eight weirs, sixteen pumps and eight outfalls for Campo nell’Elba.
The geometry of each tank is designed according to the available surface area in the vicinity of the buildings and by considering an effective maximum water depth in the tank of 2 m. The design of the weir is accordingly defined; in particular, the inlet offset is placed to a 2 m depth and the weir section is schematised as a transverse rectangular element. For each pump, a constant flow irrespective of the inlet node depth is assumed and the single flow rate is evaluated based on the duration of the three supply period of the rainwater demand daily diagram. Specific details on DRWH modelling are reported in Palla et al. [
23].
As for the initial condition of the tank, two different configurations, namely
empty tank and
full tank, are evaluated, which correspond, respectively, to an initial water depth in the tank equal to the 0.2 m–10% of the effective depth—and 1.6 m–80% of the effective depth. The empty tank initial condition implies the following management rule: each DRWH is equipped with a real-time control (RTC) technology that allows emptying the tank when a severe weather warning is expected [
25].
4.4. Urban Flood Mitigation
Results are presented for each case study with respect to the
post intervention scenario corresponding to DRWH systems installed for each building. Note that two initial conditions of the DRWH systems are examined, corresponding to the
empty or
full tank hydraulic condition. Cartographic results are presented in
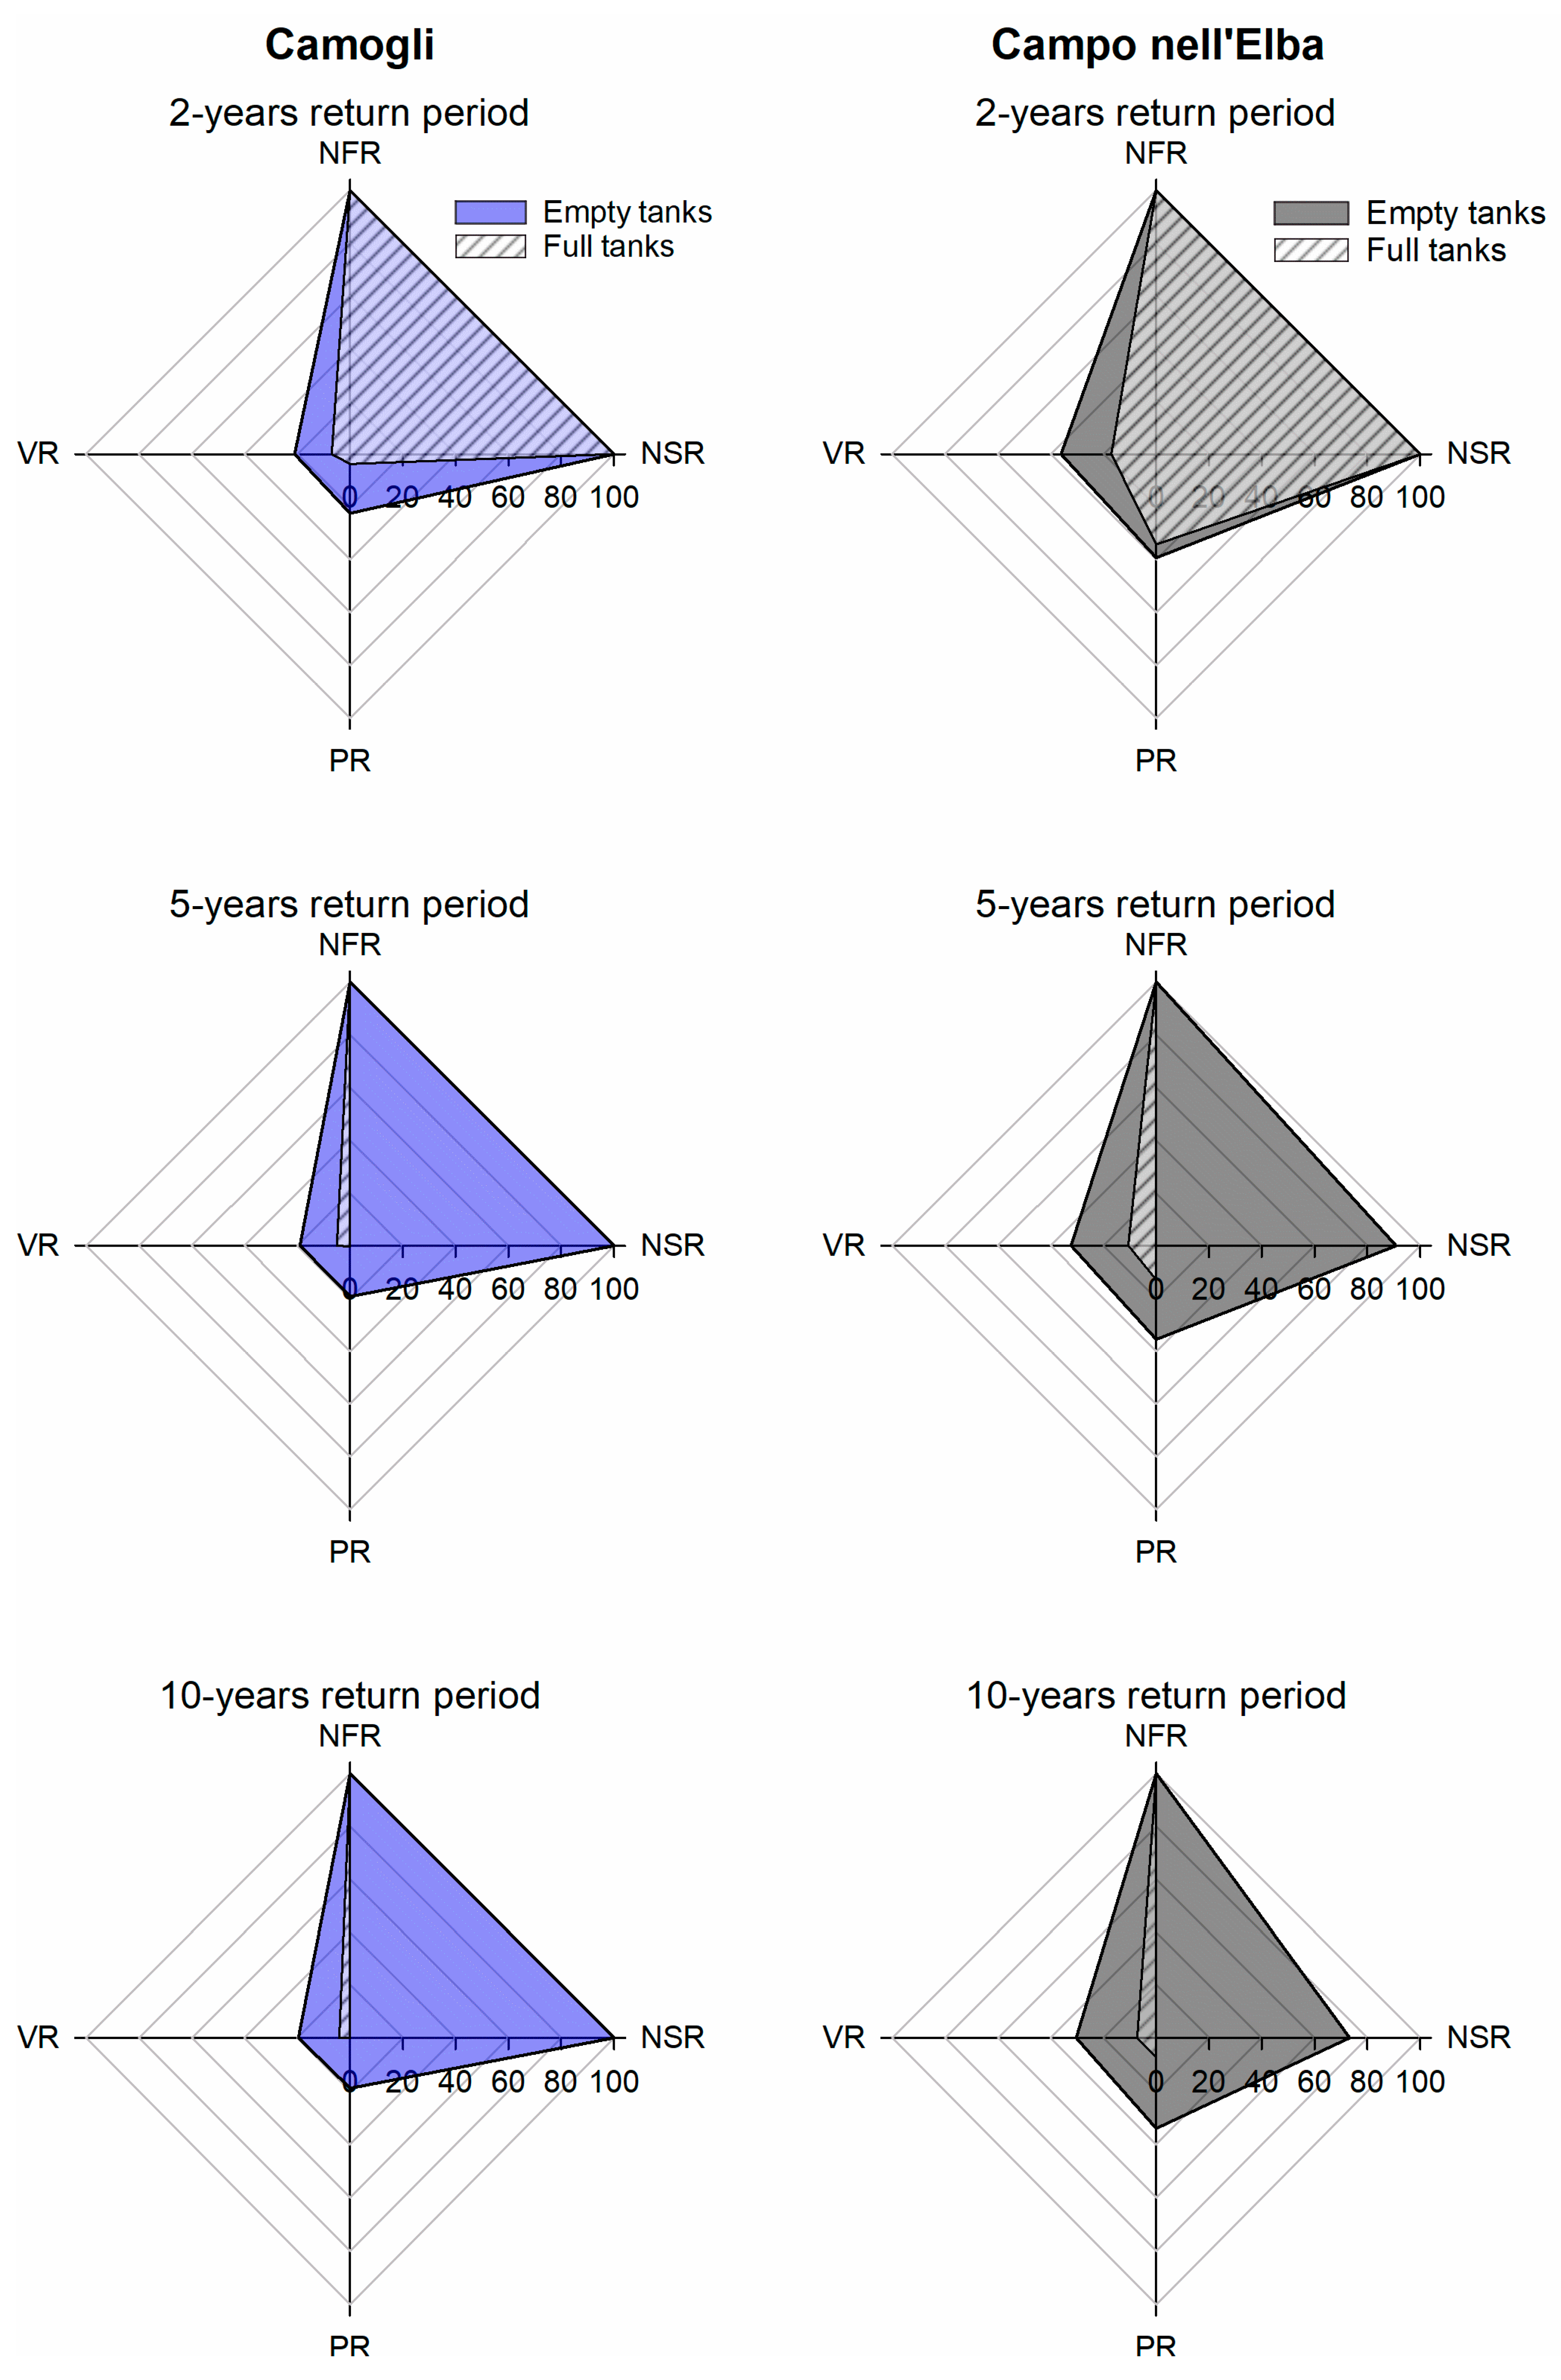
Figure 5 for the 10-year design storm event with respect to the initially empty tank condition, while numerical results, represented by means of radar plots, are shown in
Figure 6 for all the design storm events (namely 2, 5, and 10 years) and considering both initial conditions of tanks (
empty and
full).
The residual urban flooding conditions are again limited for both case studies; however, the hydraulic condition of the drainage network for the
post intervention scenario with empty tanks is significantly improved, as confirmed by the results plotted in
Figure 5. Indeed, it can be noticed that the Camogli network shows an overall condition of safety, while for the Campo nell’Elba one, only four conduits over 23 remain in critical condition—thus confirming the positive impact of DRWH systems.
Looking at the performance analysis plotted in
Figure 6, it can be assessed that the DRWH systems are able to significantly reduce urban flooding in the case of an empty tank, in contrast to the
post intervention scenarios, assuming that initially
full tanks are less effective due to the limited volume available for flood retention—as expected. Similar behaviour was observed for the hydrologic performance: indeed, when
full tanks is assumed as the initial condition, the indexes concerning the hydrologic restoration are only noticeable for the 2-year return period event. It is well known in the literature that the role of rainwater tanks in reducing peak flows will diminish if tanks are not empty before the next event [
12], since the capacity for stormwater mitigation will be less proportionate to unavailable volume.
Small differences can be detected from a comparative analysis of the two study areas: from a hydraulic point of view, the
post intervention scenario seems more effective for the Camogli case study, as confirmed by the larger NSR values; in contrast, focusing on a hydrologic perspective, the
post intervention scenario seems more effective for the Campo nell’Elba case study, as suggested by larger PR and VR values. It can be noticed that the actual conditions affect the performance analysis as much as the DRWH installation; indeed, in terms of hydraulic behaviour, the Camogli actual hydraulic stress of the network is lower than the Campo nell’Elba ones, as confirmed by the corresponding values of the NSI (see
Table 3) while in terms of hydrologic response, the Campo nell’Elba hydrologic response in the
actual scenario is more similar to that of the natural catchment with respect to the Camogli case, as confirmed by the more limited runoff coefficient (see
Figure 4) and the larger pervious area (see
Table 1).
In conclusion, these results can be very useful to promote DRWH systems between local and regional decision makers, since it introduces the quantitative assessment of their hydraulic performance and impacts on stormwater management, by providing simple, clear, and quantitative results, which are necessary to fill the existing “gap” between technical manuals and guidelines. Analytical tools that provide a spatially variable output have values in urban planning, thus providing the foundation for managers to identify locations within the area where hydrologic restoration or flood mitigation may be most beneficial. The presented spatial outputs confirm the following results previously found in the literature: that peri-urban residential areas are the most likely to benefit from residential rainwater harvesting; as well as whether rainwater harvesting in these areas can have cumulative benefits in stormwater networks farther downstream [
12]. Finally, these results could be used to compare different drainage scenarios using a simple Multi Criteria Analysis, thus completing the results according to more facilitated stakeholder involvement [
8].
5. Conclusions
The present research concerns the implementation of a GIS-based tool for supporting urban flood mitigation and assessing the impact of LID systems. In the TIRG Eau web-GIS application, specific case study webpages are implemented in order to provide reference studies in the field of urban flood risk mitigation for specific urban areas. In the present paper, two Italian case studies located, respectively, in Camogli (Liguria Region) and Campo nell’Elba (Tuscany Region) were presented to analyse the residual flood conditions if DRWH systems are proposed as mitigation strategy. Indeed, the two case studies of Camogli and Campo nell’Elba were implemented in the TRIG Eau web-GIS application. Findings of the flood analysis confirm that the DRWH systems contribute to significantly reduce the urban flooding in case of
empty tank, in contrast to the conversion scenarios where the tanks are assumed to be initially full, which are less effective due to the limited volume available for flood retention. Similar behaviour can be observed for the hydrologic performance: in the case of a
full tank as the initial condition, the indexes measuring the hydrologic restoration are only noticeable for the 2-year return period event. Therefore, it clearly emerges that in order to maximise the performance of DRWH as a flood mitigation solution, the tanks must be equipped with RTC technology that allows to pre-empty the tanks in the case of a weather alert or according to specific management rules based on rainfall forecast, accordingly, with the more actual scientific literature indications [
25].
The presented results, their visualisation, and reflected insights showcase the potential of the TRIG Eau case study webpage to improve the assessment of the urban flood and to better support the implementation of LID systems. Secondly, the TRIG Eau case study webpage facilitates the participatory planning process and public discussion by improving stakeholder awareness of the different elements of urban flood risk mitigation including the analysis of pervious/impervious areas, the role of the precipitation regime, the setting of the stormwater network, and the selection of optimal sustainable conversion scenarios.
However, some caveats remain: the availability and quality of data on surface elevation (DSM); storm drainage network configurations, rainfall conditions were shown to influence results though the uncertainty analysis on the model representation (based on the obtained data) and parametrisation is not performed yet. Furthermore, it can be argued that indications on the minimum required data to obtain reliable urban flood mitigation analysis could be included in the TRIG Eau web-GIS application as a function for instance of the extension of the study area. Finally, the platform should be updated by developing the participatory mapping including the local socio-ecological knowledge producing new data through the involvement of the population and stakeholders (in a public participatory GIS process) and resulting in a set of place-based and community-based solutions.


