Article

Teleworking and Online Shopping: Socio-Economic Factors Affecting Their Impact on Transport Demand

by
Juan Ramón López Soler
1,2,*,
Panayotis Christidis
1 and
José Manuel Vassallo
2
1
European Commission, Joint Research Centre (JRC), 41092 Seville, Spain
2
Centro de Investigación del Transporte (TRANSyT), Universidad Politécnica de Madrid, 28040 Madrid, Spain
*
Author to whom correspondence should be addressed.
Sustainability 2021, 13(13), 7211; https://doi.org/10.3390/su13137211
Submission received: 31 May 2021 / Revised: 17 June 2021 / Accepted: 23 June 2021 / Published: 28 June 2021

Abstract

:
Teleworking and online shopping became commonplace during the COVID-19 pandemic and can be expected to maintain a strong presence in the foreseeable future. They can lead to significant changes in mobility patterns and transport demand. It is still unclear, however, how extensive their adoption can be, since each individual has different preferences or constraints. The overall impact on transport depends on which segments of the population will modify their behaviour and on what the substitutes to the current patterns will be. The purpose of this work is to identify the user profiles and spatial aspects that affect the adoption of teleworking and online shopping, and to explore the potential impact on transport demand. To that end, data from an EU-wide survey on mobility were analysed using a Machine Learning methodology. The results suggest that while the take up of the new work and consumption patterns is high on average, there are significant differences among countries and across different socio-economic profiles. Teleworking appears to have a high potential mainly in certain services sectors, affecting commuting patterns predominantly in large urban areas. Online shopping activity is more uniform across the population, although differences among countries and age groups may still be relevant. The findings of this work can be useful for the analysis of policies to encourage the uptake of new technologies in transport and mobility. They can be also a good reference point for future studies on the ex-post analysis of the impacts of the pandemic on mobility.

1. Introduction

Work and shopping constitute two of the main purposes for urban mobility, and are responsible for the largest share of passenger transport activity [1]. The transport sector is the second largest source of Greenhouse Gas (GHG) emissions in Europe [2] mainly due to road transport activity [3] and—given the importance of Climate Change—is in need of solutions that minimise its environmental footprint. Teleworking and e-commerce are two technology-enabled options that can modify individual daily mobility patterns and potentially reduce total transport demand and its associated impacts (energy consumption, CO2, pollutant emissions, congestion, etc.) [4,5,6,7,8]. Understanding the characteristics of people adopting those options provides a reference point to understand the potential impact in terms of transport externalities.
Teleworking may reduce commuting and therefore transport-related congestion and emissions [9]. Moreover, under certain circumstances, online shopping may contribute to reducing the carbon footprint of mobility [7]. However, people teleworking and shopping online may travel longer distances (e.g., if they live far from face-to-face services), thereby offsetting the above-mentioned effect.
During the COVID-19 pandemic, CO2 emissions [10] and air pollutants [11,12] decreased due to confinement measures [13]. Online tools and services allowed maintaining a certain level of work and shopping activity. As soon as confinement measures were relaxed, an increase in the use of personal vehicles and active transport modes (i.e., walking or biking) was observed [14,15]. In this context, there is a high level of uncertainty regarding the future evolution of mobility. Activity patterns could return to pre-pandemic levels or even expand the use of personal vehicles in a post-pandemic recovery [16], potentially increasing the emissions associated with this type of transport.
This research is based on an extensive pre-COVID survey (2018) addressing teleworking and e-commerce. It can be a reference point for post-COVID comparison, once the present situation returns to stable levels. Thus, the current trend can be assessed to observe the importance of the pandemic in boosting both telework and online shopping, and to explore how the profile of adopters changed over time, what changed as regards mobility patterns, and how they can affect GHG emissions.
The objective of this paper is to explore the main characteristics of the individuals who adopt teleworking and online shopping and to identify the drivers of choice. In order to do so, we explore the socio-demographic characteristics, the mobility behaviour and the use of mobility-related Information and Communication Technologies (ICT) of the respondents to an EU-wide Travel Survey. We apply a machine learning classification model to identify the importance of each user characteristic as regards their likelihood to telework or shop online.
The paper is structured in four parts. Section 2 summarises the relevant research and findings on teleworking and online shopping. Section 3 describes the materials and methods used in the research, and the results are presented in Section 4. The relevance of the results and the main conclusions are discussed in Section 5.

2. Literature Review
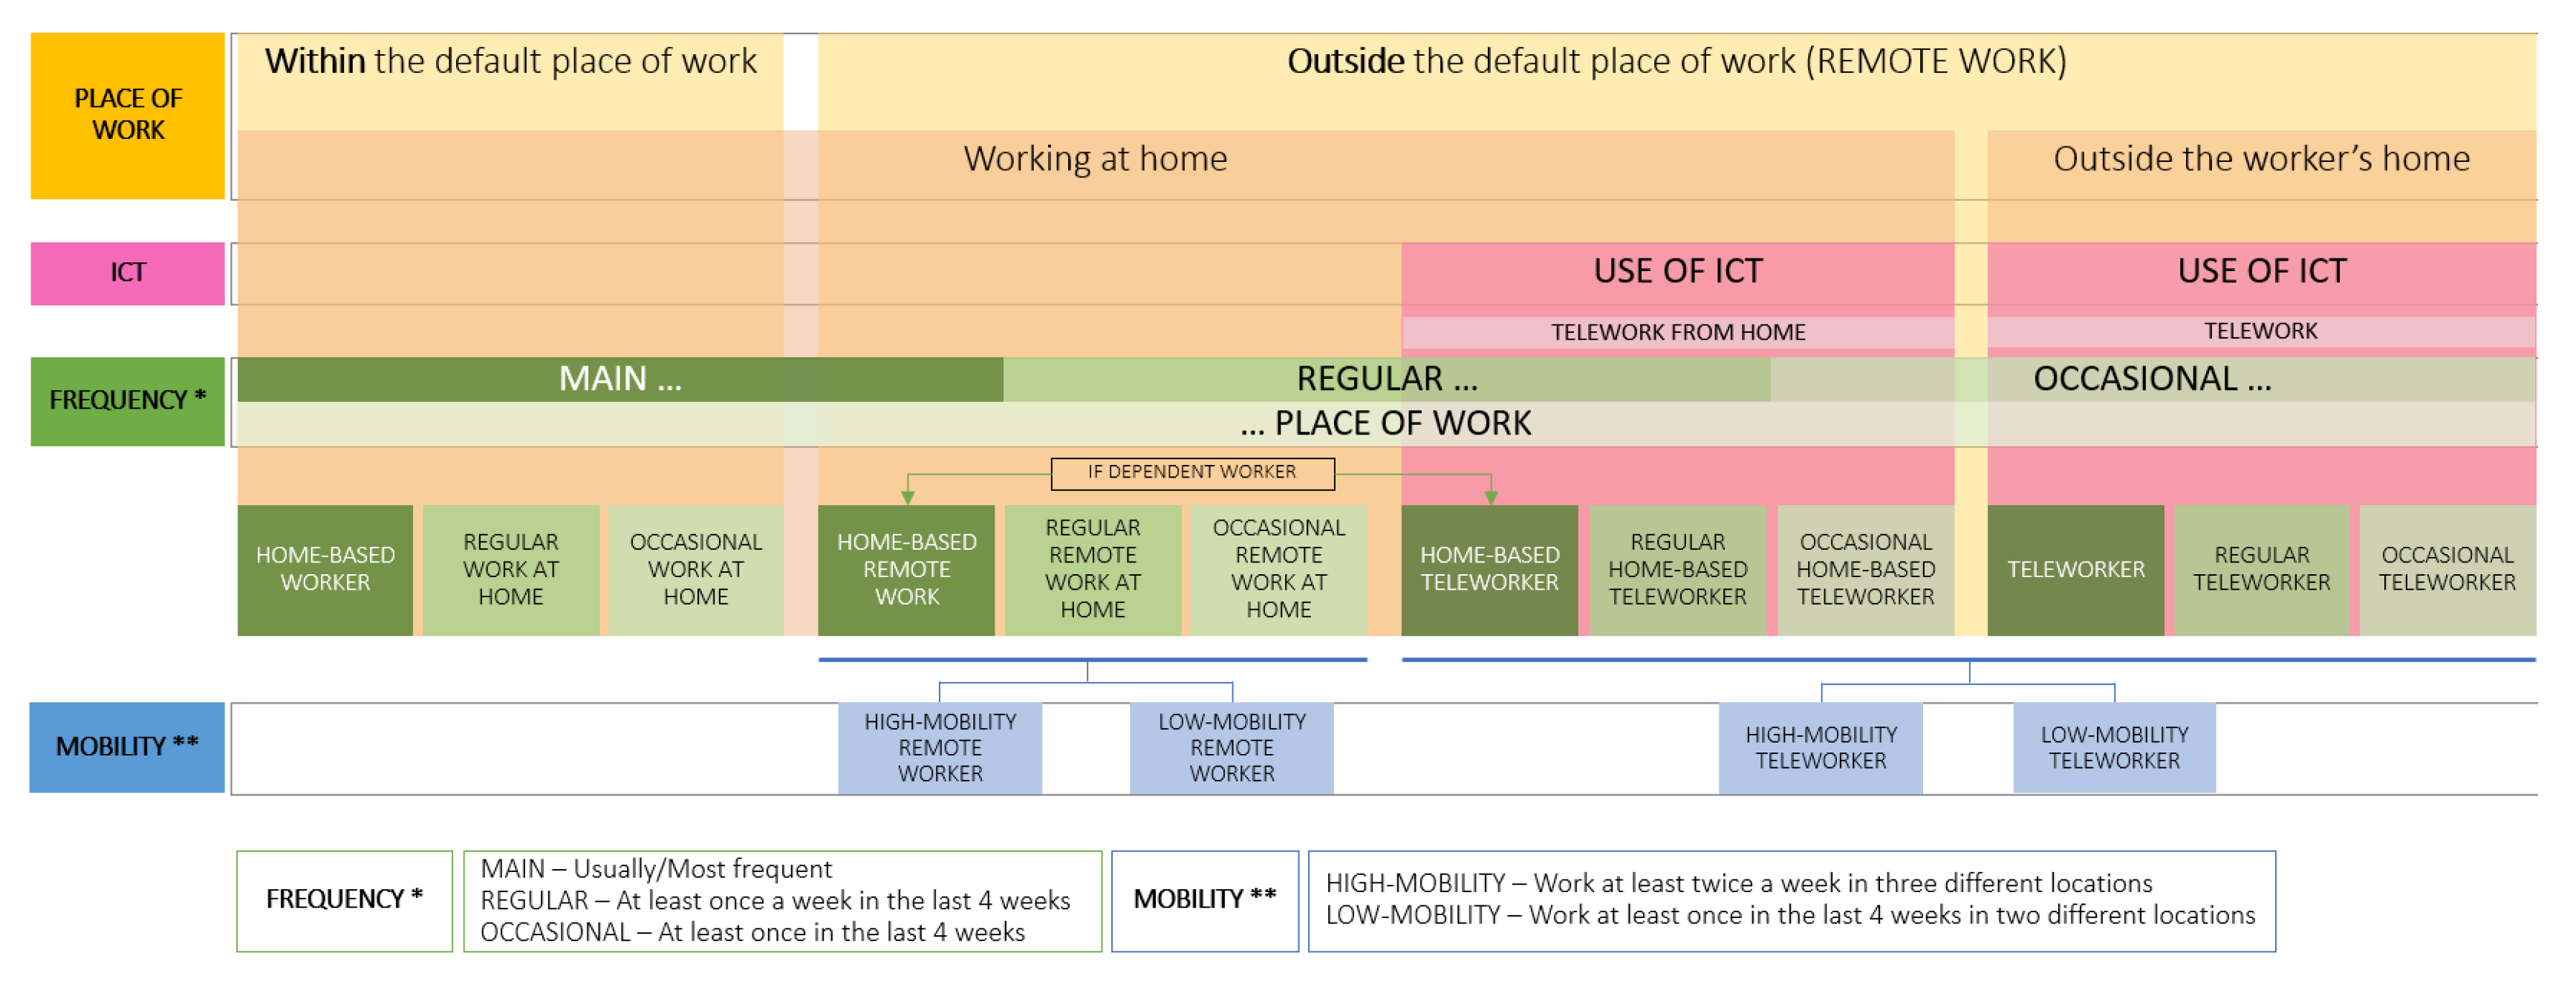
Teleworking and online shopping became widespread in recent years thanks to the massive introduction of Information and Communication Technologies (ITC). Nevertheless, these two trends follow different paths. While online shopping has already become a common practice in Europe and worldwide [17], teleworking was barely considered as a main option before 2020 [18]. The COVID-19 pandemic, however, led to teleworking being the de facto option for a considerable share of the labour force in several countries [19].
Teleworking may have a positive effect in terms of reducing the emissions of greenhouse gases, since it reduces the number of trips to work. It could nevertheless also stimulate changes in the habits of telecommuters that could reverse such savings. These include changes in lifestyles that alter the daily mobility patterns [20,21]. For example, a lower frequency of trips can be linked to a longer trip distance or a higher share of car trips, resulting in higher levels of pollution.
The urban model of European cities may change significantly if the expansion of telework encourages urban sprawl [22]. At the same time, online shopping can also influence city attractiveness, enabling wider accessibility for consumers at the benefit of low-density cities and rural areas. In this context, understanding the factors that influence the adoption of teleworking and online shopping is important for measures addressing transport demand and its consequences, but is also highly relevant for wider policy priorities in urban and regional planning.

2.1. Teleworking

The concept of telework was conceived in the 1970s as a tool to reduce petrol dependency and traffic congestion [23,24]. Since then, the concept and the technology have evolved, with new tools and business models. The options available today cover a wide range of setups, from home office to mobile office, virtual office or Telework ICT-based Mobile work (TICTM).
In this paper, the concept of telework encompasses individuals who work from outside their usual workplace (according to the International Labour Organization (ILO) [25]) and—as a result—do not need to physically make a work-related trip. The classification of remote work can be based on location, the technology used and the frequency. Work can be performed at home using ICT tools (home-based telework) or without using ICT tools (home-based remote work), but can also be carried out outside the worker’s home. The frequency and mobility may also differ within each category. Figure 1 summarises the different types of workers based on the location where the work is performed, the use of ICT tools, the frequency of use, and the corresponding mobility patterns.
The term teleworkabililty refers to the technical possibility of providing labour input remotely into a given econo mic process [19]. In Europe, according to Sostero et al. [19], around 36% of employment (employees and self-employed) is potentially teleworkable. Similarly in the USA, 37% of jobs may be performed from home [26]. The adoption of occasional or frequent teleworking grew significantly during the pandemic, from 11% in 2019 to 39% in April 2020 and 48% in June/July 2020 [27], due to lockdown in several EU countries because of the COVID-19 pandemic.
Various lines of research have explored the type of employee profile that is more likely to telework, the frequency of teleworking, the reasons for the choices and the impacts of the new behaviour [28].
In terms of who is more likely to telework, a definition of the profile of teleworkers based on socio-economic characteristics often suggests a strong correlation with high education level, high income, being male or having children [29,30,31]. Other features like household location have been associated with telework, especially in larger urban areas [29], as well as with the type of work performed, as in the case of managers or independent professionals [32]. In terms of frequency of teleworking, occasional teleworkers, for example, tend to be men, with secondary or tertiary education, self-employed and managers or professionals, while highly mobile teleworkers are more likely to hold a tertiary education level, working as an associate professional, technician or manager [32]. Nevertheless, the profile of teleworker is rapidly changing, since more employers are encouraging (at least occasional) telework and more IT tools are available [29].
Most studies suggest that telework leads to a reduction in energy use, travel distance and emissions [29,33,34,35,36,37,38]. In some cases examined teleworking may increase energy consumption [39] or have unclear impacts [20].
Regarding the distance travelled by teleworkers, some authors find a decrease in the number of vehicle-kilometres travelled [40] and congestion levels [41], while others report an overall increase taking into account commuting and non-commuting travels [21,42,43,44]. These discrepancies could be explained by the data used or the assumptions made, like the use of older data from a period when the profile of teleworker was not as heterogeneous as today [31] (typically a man with high education, high income, and a top position), the methodology, or assumptions made by the authors (as assuming teleworking just one day per week).
Considering GHG emissions avoided by telework, some authors suggest that adopting telework decreases GHG emissions [9] and the number of pollutants [41]. However, to some extent teleworking could actually increase the amount of GHG emissions according to Larson and Zhao [20] and future scenario projections made by Alonso et al. [39].
Teleworking may have a rebound effect in urban planning as we know, due to a potential dispersion of residential homes by enabling urban spreading to suburbs with lower prices and bigger houses [20,21].
Other motivations to telework usually mentioned in the literature are job satisfaction, productivity [45], or an improvement in the work-life balance [46]. However, once people telework, some drawbacks appear, as identified in several articles [47,48,49], even those firstly seen as beneficial. For instance, health issues like musculoskeletal problems, isolation, depression and stress may appear [45,47], although they can be partially solved by minimising the risks with ergonomic equipment, virtual communication or mental health support. Companies must address these problems while dealing with the work organisation under this new labour scheme.

2.2. Online Shopping

Shopping online has become more and more popular in recent years. In Europe (EU-27) 32% of individuals made an online purchase in 2009, rising to 60% in 2019 [50], growing in all age groups. On that year (2019), 49% of Europeans declared to made an online purchase in the last three months, according to Eurostat [50].
There are different types of stores regarding sales channel, depending on whether the store is selling entirely online, in the physical store or in combination. This classification is usually named as “Pure player”, “Bricks & Mortar” and “Bricks & Clicks”, respectively.
E-fulfilment methods (the entire process from receiving the order to final customer delivery) play an important role in terms of energy efficiency. The structure of the retail store regarding the delivery channel depends on how and from where the parcel is sent. For “Pure Players”, the order can be delivered from the warehouse by owned van delivery, through a parcel delivery network, or dropped-shipped directly from the supplier via a parcel delivery network. For the Bricks & Clicks case, the delivery can be done by vans from the physical store, directly from the warehouse or by the “Click & collect” system, where the customer picks up the order directly from the selected local store. Another possibility is to sell directly from the manufacturer through a parcel delivery network without the retailer intervention.
The profile of the online shopper is heterogeneous since the practice of buying online is widespread. Nonetheless, the profile is usually linked with young people, highly educated, with high income and living in dense urban areas [51,52], although this practice is expanding to rural areas as broadband internet reaches more places [53]. The use of e-commerce varies depending on the product to be bought and therefore the profile in each product category is also different. For instance, Dominici et al. [54] found that buying groceries online is more likely for women, young people, with mid-high education level, high income and living in a small family. The channel selected by the customer is also a determining factor: multichannel shoppers are on average younger than traditional shoppers and pure online shoppers younger than multichannel shoppers [55].
The main reasons to buy online are price, comfort, product offers and comparison, purchase process (order, payment and delivery time) and time-saving [52,56,57]. The drivers to buy online are related to time-saving and having health problems, while car possession seems not to be a predictor for shopping online [54].
Online shopping is getting more and more value in consumer behaviour as ICT is becoming more widespread and adopted by citizens, but usually customers use multiple channels while purchasing some types of goods [58]. This shopping modality has the potential to improve efficiency in the time we spend and the trips we make to buy, but it must be analysed in global terms to identify savings in terms of energy and emissions. Online commerce represents potential energy savings that may differ according to the modal split of the analysed city [8]. Regarding distance travelled by online shoppers, to buy online does not replace the trip to the store totally, and according to Hiselius et al. [59], people shopping online make the same number of car trips as traditional shoppers.
Shahmohammadi et al. [6] show that Bricks & Clicks reduces the GHG footprints compared with traditional shopping for Fast-Moving Consumer Goods (GMCGs), while Pure Players with parcel delivery network often have the higher GHG emissions share. Van Loon et al. [7], shows this relationship between different fulfilment methods and the basket size, being more effective as the basket size grows. This statement could change in the future when electric vehicles and other efficiency measures (larger basket size, reduction in failed deliveries, routing improvement, freight consolidation) become more widespread, changing the GHG footprint for online shopping.
The structure of the city is also essential when comparing emissions from different types of shopping channels. Car intensive cities could present a higher emission share for the brick-and-mortar channel, linked with extensive cities and inefficient public transport. On the contrary, compact cities, with a high modal split of public transport and active transport modes, could be more efficient in terms of emissions for this channel [6].

3. Materials and Methods

We use the second wave of the EU survey on issues related to transport and mobility carried out in 2018 as the primary dataset. The survey applied a CAWI (Computer Aided Web Interview) methodology [60], and includes 26,500 questionnaires from the 27 members of the European Union and the United Kingdom with 1000 respondents in each country, except Cyprus, Luxembourg, and Malta with 500. The sample was stratified by socio-economic characteristics based on age, gender, employment status, level of education, and region of residence.
The questionnaire contains information on four categories: socio-demographics and car availability questions, information on the most frequent trip, details on medium and long-distance trips, and use of Information and Communication Technologies (ICT) related to transport, where trip substitution by teleworking and online shopping is included.
The analysis is based on a classification model, made by each of the studied variables, in which the outcome, or dependent variable, takes the value explained as follows.
On the one hand, we defined a discrete dichotomous dummy variable Telework (Y) which takes the value of 1 if the individual has ever substituted the work trip by teleworking, once per month, 3–4 times per month, or more than 4 times per month. Likewise, the variable Y takes the value 0 if the respondent has substituted the trip to work only once or never.
On the other hand, and similarly to the previous one, the second analysis was made for the shopping trip substitution by e-commerce. The variable Online Shopping (Y) takes on this occasion the value 1 if the respondent has substituted the shopping trip by online commerce, rarely, sometimes, or often. Otherwise, the variable takes the value 0 if the individual has replaced the trip to the shop by buying online only once or never.
The definition of all variables can be found in Table A1 (Appendix A). Independent variables considered in the analysis, as explained before, include four categories (socio-economic and car availability, daily mobility, long trips and use of ICT). Descriptive statistics on the sample are stated in Table 1.

3.1. Survey Data Analysis

In this section, we explore the impact of individual respondent characteristics on their choices concerning telework and online shopping. The descriptive data analysis includes frequency distributions and odds ratios. Later, we use the machine learning algorithm XGBoost to obtain the relationship between the explanatory variables and the response variable, highlighting the most important factors affecting individuals’ choice and the overall impact on the outcome.

3.1.1. Trip Substitution by Teleworking

The data suggest that gender still plays an important role. Male respondents tend to telework at a higher proportion than female respondents. The odds ratio between the two genders is 1.4:1. The difference is probably due to a higher share of male respondents employed in jobs that are more suitable for teleworking. The relevance of the job type can be also induced from the correlation with education and income level. As a general trend, the ratio of teleworkers increases the higher the education and the income level of the respondent is. Respondents with a university degree (or higher) are 2.4 times more likely to telework compared to respondents with just primary education. Similarly, the group of individuals with higher-middle or high-income levels are 3.8 and 6.1 times (respectively) more likely to telework than respondents with low-income level. Furthermore, looking at the income distribution by grouping teleworkers by age, we find the same pattern, so that, the higher the income, the more the likelihood for teleworking. The teleworker profile that might be intuited, based on the above, is a male independent professional or manager with high education and high-income level.
Concerning age, the data show an inverse association with teleworking, the younger workers being more likely to telework than advanced aged ones. This association may be related to ICT skills, but possibly also to a higher share of students who combine studies and telework. The working day duration seems not to be an important factor for teleworking, nor does it seem to be for students who declare some type of telework. By contrast, people over 65 present more probability to telework when part- or full-time work is declared, probably because they are linked to liberal and managerial professions.
Regarding the household place of residence, teleworkers present a higher likelihood of teleworking when they live in metropolitan areas or big cities rather than in small cities or rural areas. This might occur because teleworking is often linked with big companies usually placed in big cities.
Other factors affecting the probability of teleworking are car-related and mobility questions. Thus, people holding a driver’s license (motorcycle or car) present a higher proportion of teleworking. Taking this into account, owning a car is also associated with a higher teleworking probability despite that this factor can be confounding and related to income level. Nevertheless, individuals with a car subscription also tend to telework more than people without a car subscription, probably because this profile is associated with young professionals with low car availability and living in metropolitan areas where this kind of service is offered.
The means of transport most used for the most frequent trip between teleworkers and not teleworkers is the car, followed by walking, private bicycle, and bus services. However, using the car, the bus, or walking, is more frequent among non-teleworkers. Furthermore, the odds of teleworking are 5.5 times greater for bike-sharing relative to private car drivers, as do car-sharing users by 2.5 times.
The destination of the most frequent trip is split, with 49% within the same urban area and 34% to another urban area. The latter is more prevalent in the group of teleworkers. On the contrary, travelling outside an urban area is more prevalent in non-teleworkers. Once more, it could be because teleworkers tend to live in metropolitan areas. Furthermore, the proportion of individuals commuting every day (or every working day) is higher in non-teleworkers compared with teleworkers. On the contrary, people travelling two to four days per week are more prevalent in the group of teleworkers, travelling longer distances compared with non-teleworkers. This could be explained by the size of the metropolitan city where teleworkers tend to live.
Another characteristic associated with teleworking is the number of long and medium distance trips. Teleworkers make more trips for work, business, and study reasons, but they also travel more for leisure and personal reasons. This behaviour may be associated with qualified jobs and the high-income level of the teleworker profile.
Teleworking varies significantly across different countries as seen in Figure 2. Countries like Sweden, Lithuania, Denmark or Austria lead the penetration in the use of this tool, Sweden and Austria being the countries with the highest use-intensive rate (13.8% and 13.6% teleworked more than 4 times per month, respectively). Conversely, Cyprus, Luxembourg and Portugal are the countries with the lowest use of teleworking, with Cyprus, where 94.4% of the sample having never used teleworking, standing out.

3.1.2. Trip Substitution by Online Shopping

E-commerce is widely extended across Europe and is frequently used by male and female respondents in the same proportion, being more prevalent in younger ages. Online shopping is used more by people with a higher educational level. For instance, graduates are 2.4 times more likely to shop online than individuals with primary education. This could be due to higher ICT education, but also because of the link with higher income level usually associated with the level of education. Respondents with high income are 2.3 times more likely to shop online than respondents with low income.
Similar to the teleworking case, online shoppers tend to live in metropolitan areas and large cities, despite having within easy reach a large product offer in the city. What is more, the biggest difference between online shoppers and traditional ones is presented in people living in the centre of a metropolitan area. This phenomenon can be explained by the gentrification in the city centre, the higher income level of the people living in central areas, or the lack of car availability. The latter assumption is reinforced by the fact that online and traditional shoppers holding a car driver’s license is similar. By contrast, the share of motorcycle license is bigger in the group of online shoppers, probably because they live in the city centre and this type of vehicles is more accessible within the town centre. Additionally, the proportion of people without a driver’s license is smaller in the group of online shoppers, hence not holding a driver’s license seems not to be a determinant for buying online.
The availability of one or two cars in the household increases the probability of buying online. Nonetheless, households with more than two cars present the same proportion between online shoppers and conventional ones. This is not the case for car sharing subscribers, where the relation is clearer, being 2.2 times more likely to buy online than non-subscribers.
The car remains the predominant means of transport for the most frequent trip in both types of purchases. Concerning other means of transport, and in line with general mobility trends, walking, going by private bike and commuting by bus services are the most used means to reach the destination in the most frequent trip. This destination is usually located in the same urban area for almost half of the interviewees and more than one third are travelling to a different urban area, presenting a similar share between both types of shoppers. Given the fact that online shopping could avoid trips, we observe that people buying online tend to commute more frequently than traditional shoppers. For instance, the odds ratio of teleworkers travelling one day per week and daily commuters is 1:1.3. In addition, online shoppers spend more time and travel longer distances in the most frequent trip than traditional shoppers. This could be due to the fact that online shoppers living in metropolitan areas are more likely to commute for more time and more distance to reach the frequent destination.
For trips other than the most frequent ones, online shoppers present a similar share of long-distance trips for work, business, or study purposes, but they are more likely to travel longer distances for personal and leisure reasons. Furthermore, online shoppers take more medium distance trips for both purposes.
The distribution among countries presents a high dispersion as seen in Figure 3. While Germany, Sweeden, Austria or Spain are the countries with the highest share of online shoppers, countries like Cyprus, Ireland or Greece present the lowest rate of e-commerce.
Austria and Germany are the Member States with the most intensive e-commerce use, with 35.5% and 35% of consumers shopping online “often”, respectively. In contrast, in Cyprus 66.2% of the population has never used this shopping mode.

3.2. Methods

The initial data analysis suggests a strong correlation between either teleworking or online shopping and certain respondent characteristics (Table A2 and Figure A1), but also suggests the existence of several confounding factors that can limit the possibility of interpreting the importance of each specific characteristic. Education level and income, for example, correlated to a certain extent, and a simple statistical analysis would not be sufficient to quantify their individual impact on the respondent’s choice.
In order to solve that, we constructed a classification model that allows the generalisation of the relationship between the variables taking into account the various collinearities. The model applied was a tree-based approach using the well-known machine learning XGBoost algorithm (see [61]). XGBoost has been tested and compared with Multinomial Logit Model in travel mode choices by Wang and Ross [62] getting better performance. Other machine learning classifiers in transport have been conducted in user choice modelling, resulting in higher precision than conventional methods [63]. Christidis and Focas analysed the uptake of electric and hybrid vehicles [64] and car use [65] within the EU using gradient boost decision trees and Random Forest, respectively.
The model is set up in three randomly split parts. The first one is selected to perform the training model with 40% of the observations. The second one is the test set, with 40% of observations, which is used to evaluate the performance of the model trained before, using the previous model to predict the outcome. The third one is the validation set (the remaining 20% of observations), which is used to ensure the generalisation of the model on unseen data. Feature engineering is applied to adapt the variables to the algorithm requirements. We used One Hot Encoding (OHE) to convert categorical variables into binary variables that correspond to each possible questionnaire answer option.
The XGBoost hyperparameters were selected based on the best AUC (Area Under the Curve) evaluation score, while the final variable election was carried out based on the outcome of the most important feature based on the predictor feature importance and Shape Values. The performance of the model has been evaluated with the AUC measure. The range for this evaluation goes from 0 to 1, being 0 when all predictions are wrong and 1 when all predictions are correct.

4. Results

We applied the XGBoost classification algorithm (tree-based Machine Learning model, non-linear model) to obtain the main factors affecting the uptake of teleworking and online shopping as a substitution of conventional working and shopping, respectively. For the teleworking model, the dependent variable takes the value 1 if the respondent is using this work system once per month or more, while it takes the value 0 if the trip has been substituted by teleworking once or never.
Similarly, for the online shopping model, the outcome variable takes the value 1 if the shopping trip is substituted rarely, sometimes, or often. If the respondent has used this service once or never, the variable takes the value 0.
In both cases, data pre-processing, feature selection, model training and evaluation has been performed. From all variables analysed, the most important features have been selected in a second analysis to obtain a better performance.
The selected variables for the classification model are Gender, Age, Education level, Employment Status, Household members, Income group, Urbanisation type, Urban situation, Driving license, Number of Vehicles per household, Car subscription, Urban frequent destination, N. of passengers in the last trip, Country, Population 2018, Vehicles per household member and Urban-Centre (combination of Urbanisation type and Urban situation). The number of observations after the data cleaning was 23,931.

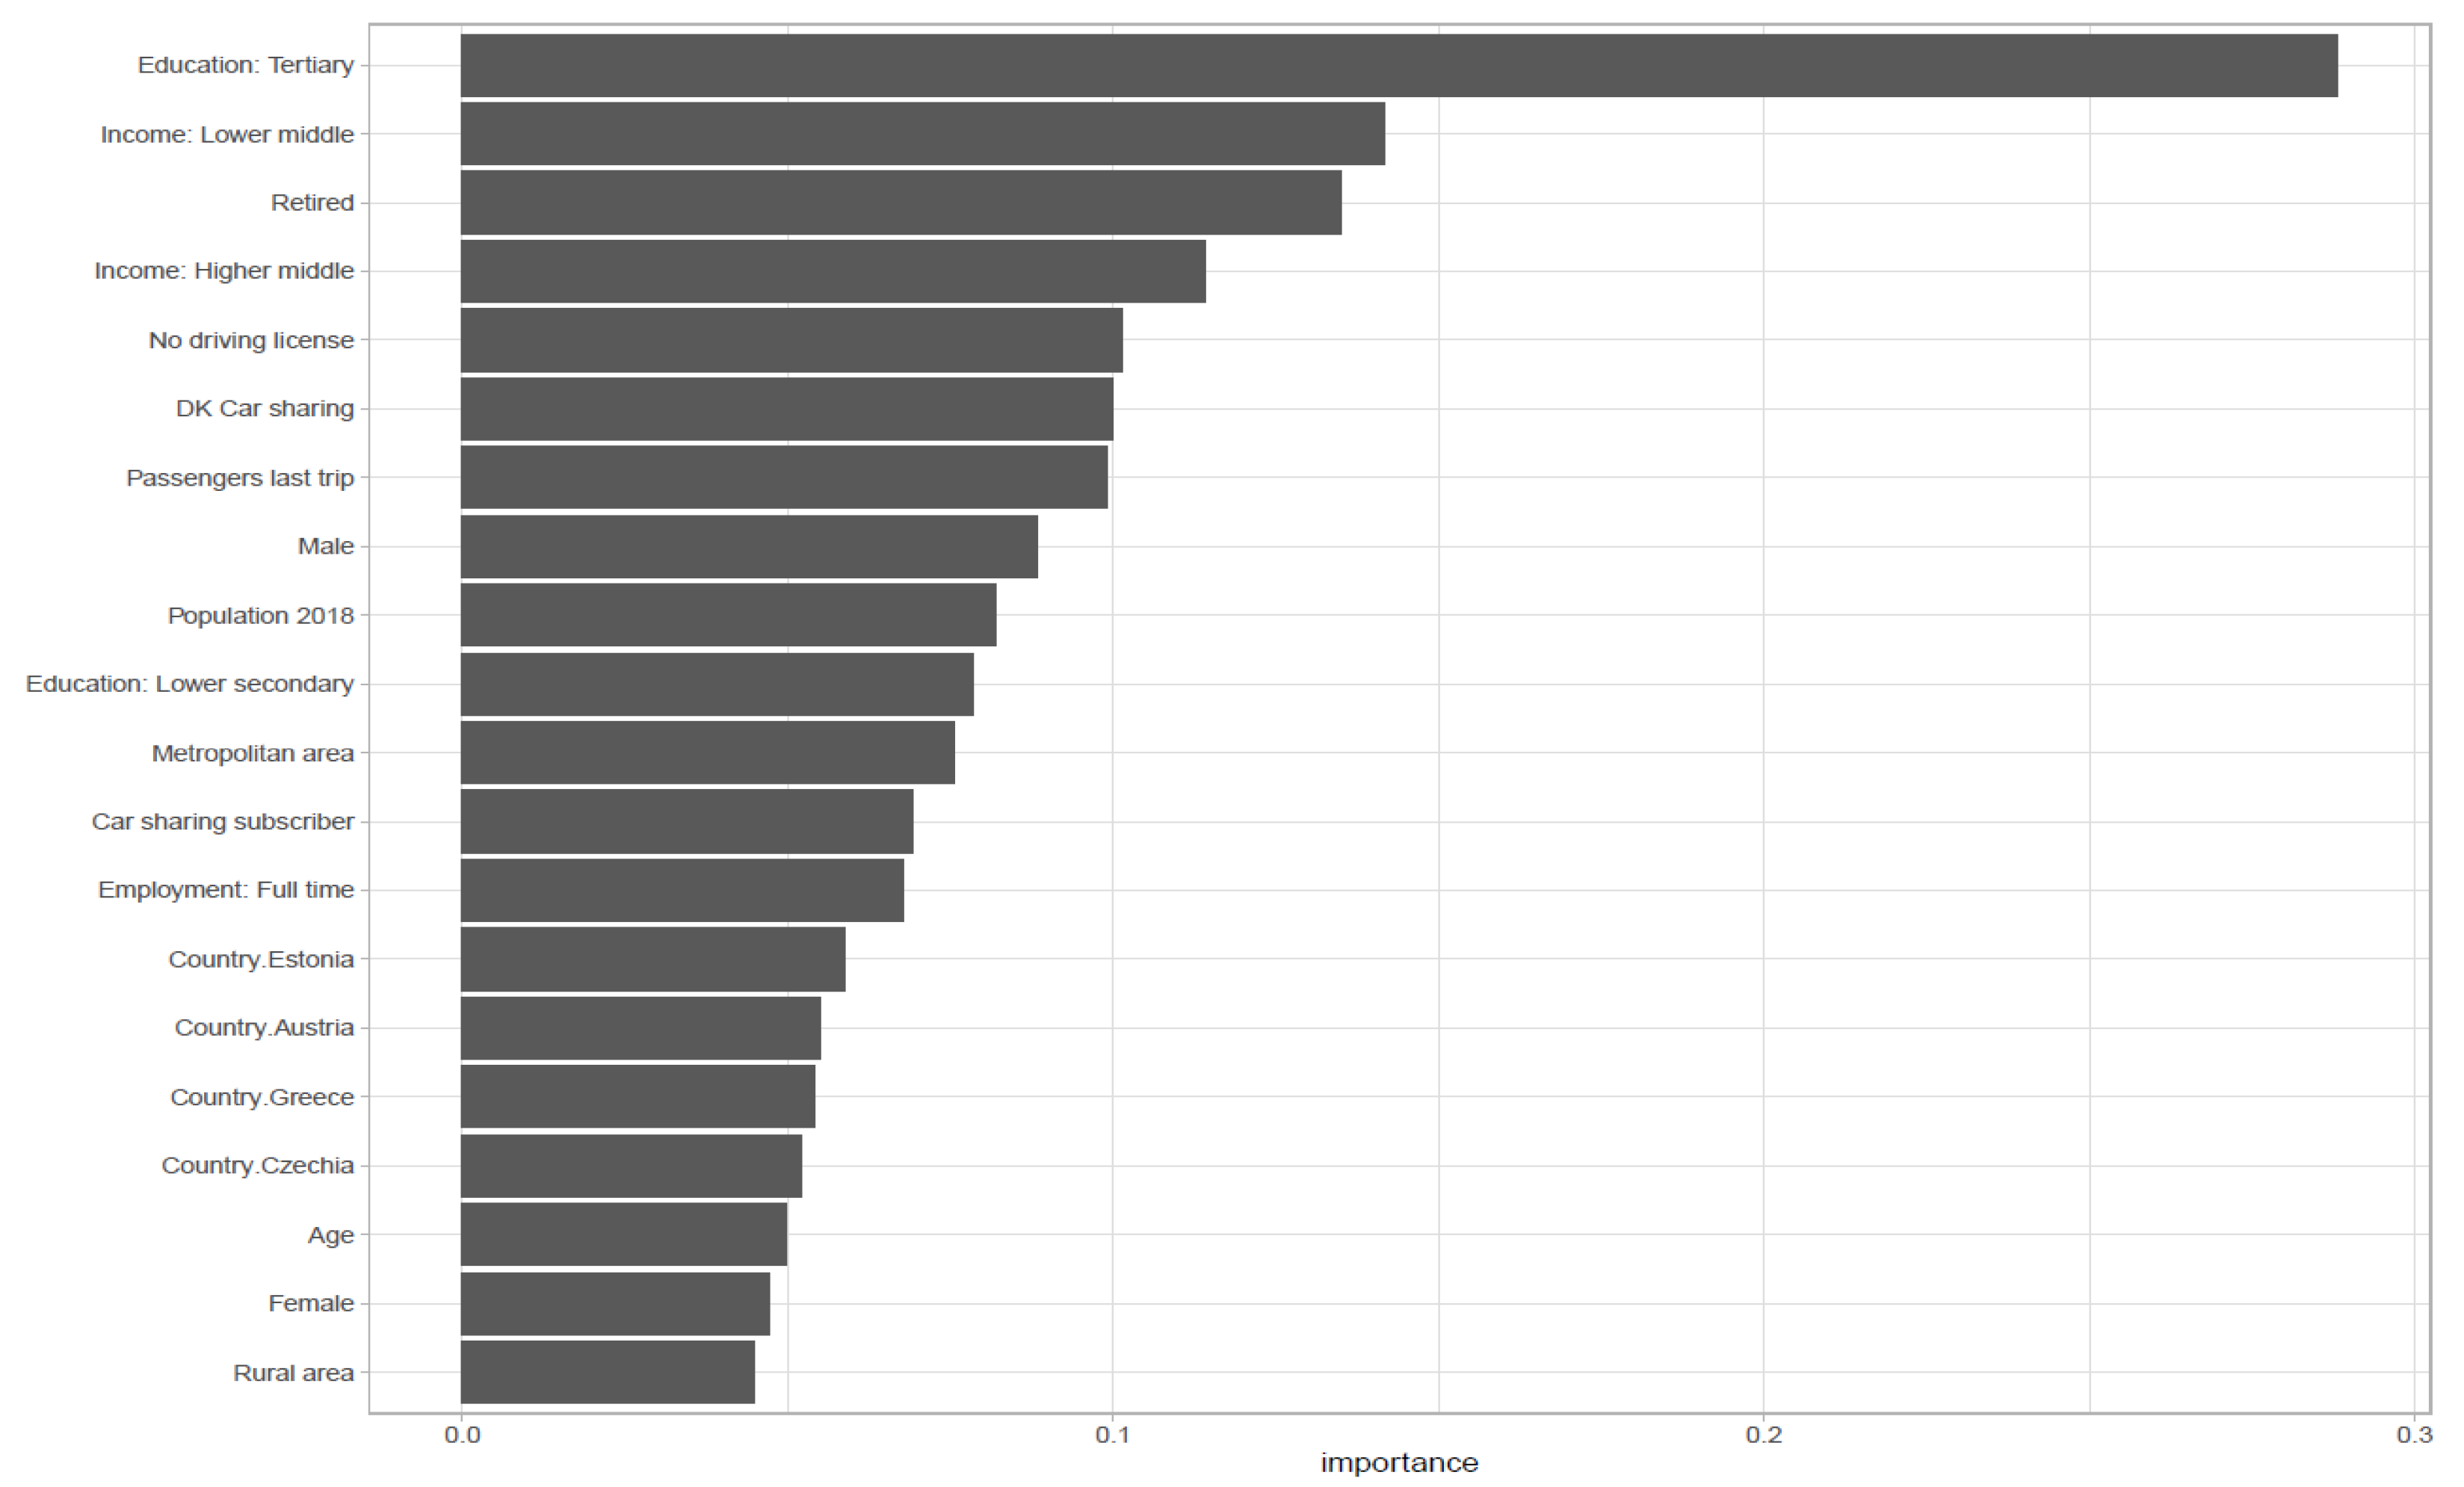
4.1. Determinants of Teleworking

Once the XGboost algorithm is applied, the main factors affecting the trip substitution by teleworking are displayed in the next figure. The graph represents the feature importance score for the most important variables ordered by how much they are helping in the prediction outcome: the more they are used to make the decision, the more relative importance the variable will have.
The probability of teleworking as a substitution of a trip to work is influenced by the respondent’s education level, income group, employment status, driver’s license, gender, location, country, and age. Figure 4 represents the main factors affecting the uptake of the trip substitution by teleworking, however, explainability is not the main feature of this kind of graphs. To resolve this, we use SHapley Additive exPlanation (SHAP), an innovative method to interpret results from tree-based models. SHAP values show the importance of each feature, the direction, and its contribution to the model outcome.
For the teleworking model, the contribution of each variable (impact on model output) is given through the SHAP value and the feature value (Figure 5). The mean SHAP value is shown next to the variable in such a way that the higher the value, the stronger the impact on the dependent variable will be. When the feature value is high the colour is presented in purple. On the contrary, when the feature value is low, the colour is yellow. For instance, the first variable shown in Figure 5 is “Education level: tertiary”. On the one hand, the mean Shape value is 0.288. On the other hand, when the feature value is one (meaning individuals having a tertiary education level), we see the blue point and the associated SHAP value in the x-axis (about 0.31). Moreover, when the variable is zero (meaning individuals without a tertiary education level) the colour is yellow, and the SHAP value is about −0.27.
The most important variable describing the likelihood for teleworking is to have a university degree (or higher) giving a positive value for the model, i.e., the model finds that people with high education level present more probabilities to telework. On the contrary, for individuals with a lower education level (lower secondary), the model finds a negative shape value, reducing in this case the teleworking likelihood.
Income level is normally linked with education level as the model captures, so those individuals with lower-middle-income present a negative shape value when replacing the working trip by teleworking and with higher-middle income present a positive shape value. In other words, people with higher-middle incomes tend to telework more frequently, while having a lower-middle-income reduces the likelihood of telework. Gender appears to be also determinant. While male workers are more likely to telework, female professionals tend to work traditionally, probably because of the type of job developed. Age presents a high variability as regards teleworking adoption, as seen in Figure 5. While young people present a higher score (i.e., more prone to telework), the likelihood decreases until around 62 years old. According to the previous analysis, young professionals tend to telework more than seniors. However, when retirement age is reached, usually just liberal and managerial workers extend their professional career, precisely those with a higher probability to telework. In fact, in the age range between 64 and 67 years, the likelihood of teleworking increases, likely linked with these types of jobs extending the professional career.
Mobility patterns may also influence teleworking. On the one hand, individuals without a driver’s license are more prone to perform traditional work. On the other hand, car sharing subscribers tend to telework more frequently, even though this profile normally is linked with high education level and living in metropolitan areas (where those services are present), which may be confounding for the model.
As for the spatial factor, in accordance with the previous analysis, our model finds a positive relationship with metropolitan areas, meaning people living there present more chances to telework. By contrast, living in rural areas reduces the probability of teleworking. In addition, countries with high population tend to telework more than countries with low population, although work culture in every country is a determinant factor regarding remote work. For instance, individuals living in Estonia, Austria and Czechia got a positive shape value, resulting in more teleworking possibilities, while on the contrary, living in Greece gives a negative outcome, meaning fewer telework probabilities.

4.2. Determinants of Online Shopping

The Figure 6 shows the main factors affecting the uptake of shopping trip substitution by online shopping.
Predictions about using or not using e-commerce as a substitution for a traditional shopping trip are influenced in the first positions by people with high education level (tertiary or higher), along with the level of population, age, and with people living in specific countries such as Austria, Sweden, Ireland, Germany, Latvia, or Czechia. The number of vehicles per household and the income level is also important.
Next, we will explain with SHAP values the contribution of each feature affecting the prediction outcome found by the model, represented in the Figure 7.
In the same way as in the teleworking case, having a high education level supports the willingness to shop online as a substitution for the shopping trip, whereas people with lower secondary education tend to buy online less frequently. Similarly, when income is higher-middle the likelihood to buy online increases. Furthermore, people between 19 and 46 years tend to shop online more frequently than individuals above and below that range; in the first case possibly because the acquisition power is lower, and in the second because of the lower digital capabilities.
Regarding individuals’ location, the model suggests that highly populated countries tend to buy online more frequently than smaller ones. Moreover, the country of residence appears to be a clear determinant factor affecting the online shopping choice. Countries like Austria, Sweden, Germany, Latvia, Czechia, Spain or Slovakia presents a higher share of e-commerce than countries like Ireland, the United Kingdom, Hungary, Portugal or Cyprus. This result is difficult to explain given that there is not a clear pattern between both country groups, but differences in economic structure, cultural and education factors, mobility schemes and accessibility or even supply chain may affect the uptake of online shopping.

4.3. Model Performance

In this section, the analysis of the XGBoost classification model performance is presented.
The most frequently used metric for classification problems is the Area Under the Curve (AUC) or area under the Receiver Operating Characteristic (ROC) curve. This aggregated measure of the model performance summarises the True Positive rate (TP), versus False Positives rate (FP), by using different probability threshold.
Table 2 presents the results of the AUC-ROC test for teleworking and Online Shopping models for the test and validation datasets.
Both models achieve a satisfactory level of precision [66]. They can explain a large part of the variation in users’ choices, but there are obviously additional factors that influence those choices but are not covered by the data available.

5. Discussion and Conclusions

This research explores the main determinants of teleworkers’ and online shoppers’ profiles, replacing the trip by online procedures. The XGBoost algorithm used identifies the most important factors and quantifies their importance, allowing us to determine the profile of individuals more likely to use these services.
Firstly, our results confirm that the most important factors to substitute the working trip by teleworking are in general terms, to have a high education level and a high-middle economic status. Gender remains determinant as men continue to be more likely to telework than women. As seen in the data analysis, living in low populated countries is associated with less probability to telework than living in high-populated countries. Furthermore, there are more telework probabilities when living in metropolitan areas over one million inhabitants. However, living in specific countries favours the adoption of teleworking as seen in the distribution chart (Figure 2) of teleworkers by country.
Secondly, our analysis shows the profile of online shoppers replacing the shopping trip by e-commerce, being more likely to perform this activity people with higher-middle education level and living in countries with high population, even though there is a high disparity among countries like in the teleworking case (see Figure 3). The age continues to be a determinant, but the range extends from young people to the middle aged population. The high dispersion among countries on teleworking and online shopping adoption shows a notable diversity among different regions.

5.1. Teleworking

According to the survey, the profile of teleworker is still linked with age. Younger respondents (16 to 45 years) have a bigger share of trip substitution by teleworking than older ones. This may be due to the older people’s training lack in ICT. Gender continues to be significant. There being a man makes telework more probable, despite some indicators pointing out that as far as telecommuting spreads, more professional categories benefit from this way of working, and more women are eligible to work remotely. Teleworking is also linked with education, since a respondent is more likely to telework as education reaches a higher level. The results suggest that high-middle income groups tend to telework more than low-income groups, although it can be confounding with the direct relationship between education level and income. This agrees with previous literature findings referring to the profile of managers and independent professionals, where men are the majority. Furthermore, telework appears to be more likely in full-time jobs. The identified socio-economic drivers are consistent with those suggested in the literature [28,29,30,31,32].
In terms of household location, teleworkers tend to live in metropolitan areas and large cities. Within these areas, they tend to live in the city centre rather than in the suburbs. This result might be surprising, but it is in line with previous results carried out by Vilhelmson and Thulin [29] or López-Igual and Rodriguez-Madroño [32]. An explanation to that the outcome might be that teleworkable employment positions and companies (or managers) are usually placed in big cities, but also because the commuting distance does not seem to be a determining factor for teleworking.
As regards mobility, teleworkers take fewer weekly trips than regular workers, but they travel longer distances than traditional workers. That result is in accordance with some previous authors [21,42,43,44] but opposed to others [40], albeit this last study is less recent and habits tend to change over time. Concerning other types of trips, differently to the most frequent one, teleworkers make more medium-distance trips (from 300 to 1000 km), but also more long-distance trips (those over 1000 km) in different categories like work, business, studies, leisure or personal. This outcome may be due to the higher income level of the people who telework.

5.2. Online Shopping

Online shopping behaviour is similar between young and middle-aged adults, but less prevalent for people over 50 years old. Regarding education level, online shoppers are positively correlated with individuals holding a university degree or higher. In the same way, employees (full or part-time) and high-middle income people are more likely to buy online. All these factors are also decisive to determine teleworking according to our model, but some of them are directly correlated, for instance, education level and income (which in turn is linked with employment). These results are consistent with previous research [51,52] but, as pointed out by Dominici et al. [54], the profile of online shoppers may change depending on the type of the purchased goods.
Similar to the teleworking case, living in urban areas, particularly in the city centre, presents a higher likelihood for shopping online than living outside urban areas or in the suburbs. People living in rural areas present the lowest share of online shoppers, probably linked with the average age of the people living in these places along with lower skills in managing digital means, and lack of supply of e-commerce services.
In terms of mobility, having or not having a car driver’s license presents a similar proportion between e-commerce adopters and traditional shoppers, but the share of motorcyclist is higher among the group of online shoppers compared with non-online shoppers, maybe because this type of vehicle is more city centre-friendly. Individuals without a driver’s license present a bigger share in the group of online shoppers relative to traditional shoppers.
Regarding mobility, individuals buying online make more weekly trips than regular shoppers, commute longer distances in the most frequent trip, and make more long-distance trips.
Online shoppers tend to use multiple channels [58], so that, if the product exploration is made in the traditional shop and the purchase is made online, the benefit of buying online loses sense in terms of energy savings and GHG emissions. We should reiterate that in accordance with Shahmohammadi et al. [6], Pure Players have the higher GHG emission share, Bricks & Clicks being the most effective purchase way.
Lastly, the preferred means of transport is similar in both profiles of shoppers, presenting almost the same share of private car use in the most frequent trip. Thus, online shopping does not seem to be a practice to reduce the use of private vehicles.

5.3. Common Patterns for Teleworking and Online Shopping

To sum up, we appreciate some similarities between the profile teleworkers, and online shoppers. Both profiles are more likely to be a man, young to middle aged, well-educated and with high-middle income level. They also tend to live in city centres and make more trips than traditional workers or shoppers.
The level of digital preparedness seems to be partially behind these results, as does the teleworkability of the employment position in the case of teleworking. Nevertheless, future research works should deal with the long-term trends of the COVID-19 pandemic on teleworking and online purchasing. Usually, young people are more open to adopting new ways of working or shopping, but the COVID-19 pandemic forced big societal changes. These changes should be monitored in the mid-long term to see the real adoption in the future. In the same way, the benefits and drawbacks associated with both practices should be considered.
Teleworking and online shopping are two practices that can help reduce transport activity. Fewer trips for work or shopping can also limit the negative effects of transport, such as energy consumption, congestion, pollution and other externalities but may also increase the dependence on private cars [16]. Teleworking and online shopping became commonplaces during the COVID-19 pandemic and it can be expected that at least part of the population will continue adopting them as part of their work and consumption patterns. There are, however, significant differences across countries and socio-economic profiles as regards the uptake of the two practices. This work may help policymakers in order to identify the gap among regions adopting these technologies and boosting the benefits associated with them (and monitor the disadvantages).
Teleworking appears to have a high potential mainly in certain services sectors, affecting commuting patterns predominantly in large urban areas. Online shopping activity is more uniform across the population, although differences among countries and age groups may still be relevant.
Not all jobs appear to be suitable for teleworking, though. In a post-pandemic context, it can be expected that a significant share of jobs will return to a primarily physical presence in the workplace, especially those that rely on face-to-face interaction.
An obvious caveat for this work is that the survey was conducted before the COVID-19 pandemic. It will be interesting to address, in future work, how the user preferences change once the pandemic is over and how an increased take up of telework or online shopping can affect user behaviour in the longer term.

Author Contributions

Conceptualization, J.R.L.S., P.C. and J.M.V.; methodology, J.R.L.S.; software, P.C.; validation, J.R.L.S., P.C. and J.M.V.; formal analysis, J.R.L.S.; investigation, P.C.; resources, J.R.L.S.; data curation, J.R.L.S.; writing—original draft preparation, J.R.L.S.; writing—review and editing, P.C. and J.M.V.; visualization, J.M.V.; supervision, J.M.V.; project administration, P.C.; funding acquisition, P.C. All authors have read and agreed to the published version of the manuscript.

Funding

This research was carried out with the collaboration of the Joint Research Centre of the European Commission within the framework of the Doctoral Collaboration Agreement No. 35364.

Institutional Review Board Statement

Not applicable.

Informed Consent Statement

Not applicable.

Data Availability Statement

The dataset used for this analysis can be made available to qualified researchers upon request.

Conflicts of Interest

The authors declare no conflict of interest.

Disclaimer

The views expressed are purely those of the authors and may not in any circumstances be regarded as stating an official position of the European Commission.

Appendix A

Table A1. Type of variables on the sample.
QuestionVariable TypeN. CategoriesCategory Value/Range
SOCIO-ECONOMIC
GENDERBinary21: Male
2: Female
AGEInteger 16–96
COUNTRYCategorical28EU-27 + UK
REGIONCategorical396NUTS 3 & NUTS 4
EDUCATION LEVELCategorical41: Primary
2: Lower Secondary
3: Upper Secondary
4: Tertiary or higher
EMPLOYMENT STATUSCategorical71: Full time
2: Part time
3: Unemployed
4: Studying
5: Retired
6: Other
7: NA
HOUSEHOLD MEMBERSCategorical71: One
2: Two
3: Three
4: Four
5: Five
6: More than five
7: NA
INCOME GROUPCategorical61: High
2: Higher-Middle
3: Middle
4: Lower-Middle
5: Low
6: NA
URBAN-CENTRECategorical71: Metrop. Area Big City > 1,000,000—CENTRE
2: Metrop. Area Big City > 1,000,000—SUBURBS
3: Large city 250,000–1,000,000—CENTRE
4: Large city 250,000–1,000,000—SUBURBS
5: Small/Medium city < 250,000—CENTRE
6: Small/Medium city < 250,000—SUBURBS
7: Rural area
CAR AVAILABILITY
DRIVING LICENCECategorical41: Yes. Car
2: Yes. Moto, Scooter, Moped
3: No, in process
4: No
N. VEHICLESInteger 0–10
PLAN TO BUY A CARCategorical51: Yes, next 6 months
2: Yes, next 12 months
3: Yes, next 2 years
4: No
5: DK/NA
PLAN TO BUY AN E-CARCategorical61: Certainly yes
2: Probably yes
3: Maybe Yes Maybe Not
4: Probably Not
5: Certainly Not
6: DK/NA
CAR SHARING SUBSCRIPTIONCategorical31: Yes
2: No
3: DK Car Subscription
EVERYDAY MOBILITY
Transport Most Frequent Trip (MFT)Categorical121: Walk
2: Private bicycle
3: Bike sharing bicycle
4: Private car—Driver
5: Private car—Passenger
6: Car sharing—Driver
7: Car sharing—Passenger
8: Train
9: Underground/Light train
10: Tram
11: Bus
12: Motorcycle/moped
Destination MFTCategorical31: Urban area—Same as where living
2: Urban area—Different as where living
3: Outside urban area
Frequency MFTCategorical31: Every day/every working day
2: 2–4 times/week
3: Once/week or less
N. people in car MFTInteger 0–7, 11, 25
Time MFTInteger 1–775
Distance MFTCategorical71: <3 km
2: 3–5 km
3: 6–10 km
4: 11–20 km
5: 21–30 km
6: 31–50 km
7: >50 km
LONG AND MEDIUM DISTANCE TRIPS
Long distance trips (>1000 km) for Work Business or Study (WBS)Integer 0–50
Long distance trips (>1000 km) Leisure or personal reasons (LP)Integer 0–50
Medium distance trips (300–1000 km) for WBSInteger 0–50
Medium distance trips (300–1000 km) for LPInteger 0–50
ICT
In-vehicle navigation systemCategorical51: Always
2: Often
3: Sometimes
4: Never
5: Not Applicable
Mobile phone Map and/or Navigation application
Online flight ticket purchasing
Online flight check-in
Flight ticket purchasing application
Flight check-in application
Online public transport ticket purchasing
Public transport ticket purchasing application
Online/mobile access to live public transport schedule information
Interoperable onboard device to pay road tolls
Online ShoppingCategorical51: Often
2: Sometimes
3: Rarely
4: Once
5: Never
TeleworkingCategorical51: More than 4 times per month
2: 3–4 times per month
3: Once per month
4: Only once
5: Never
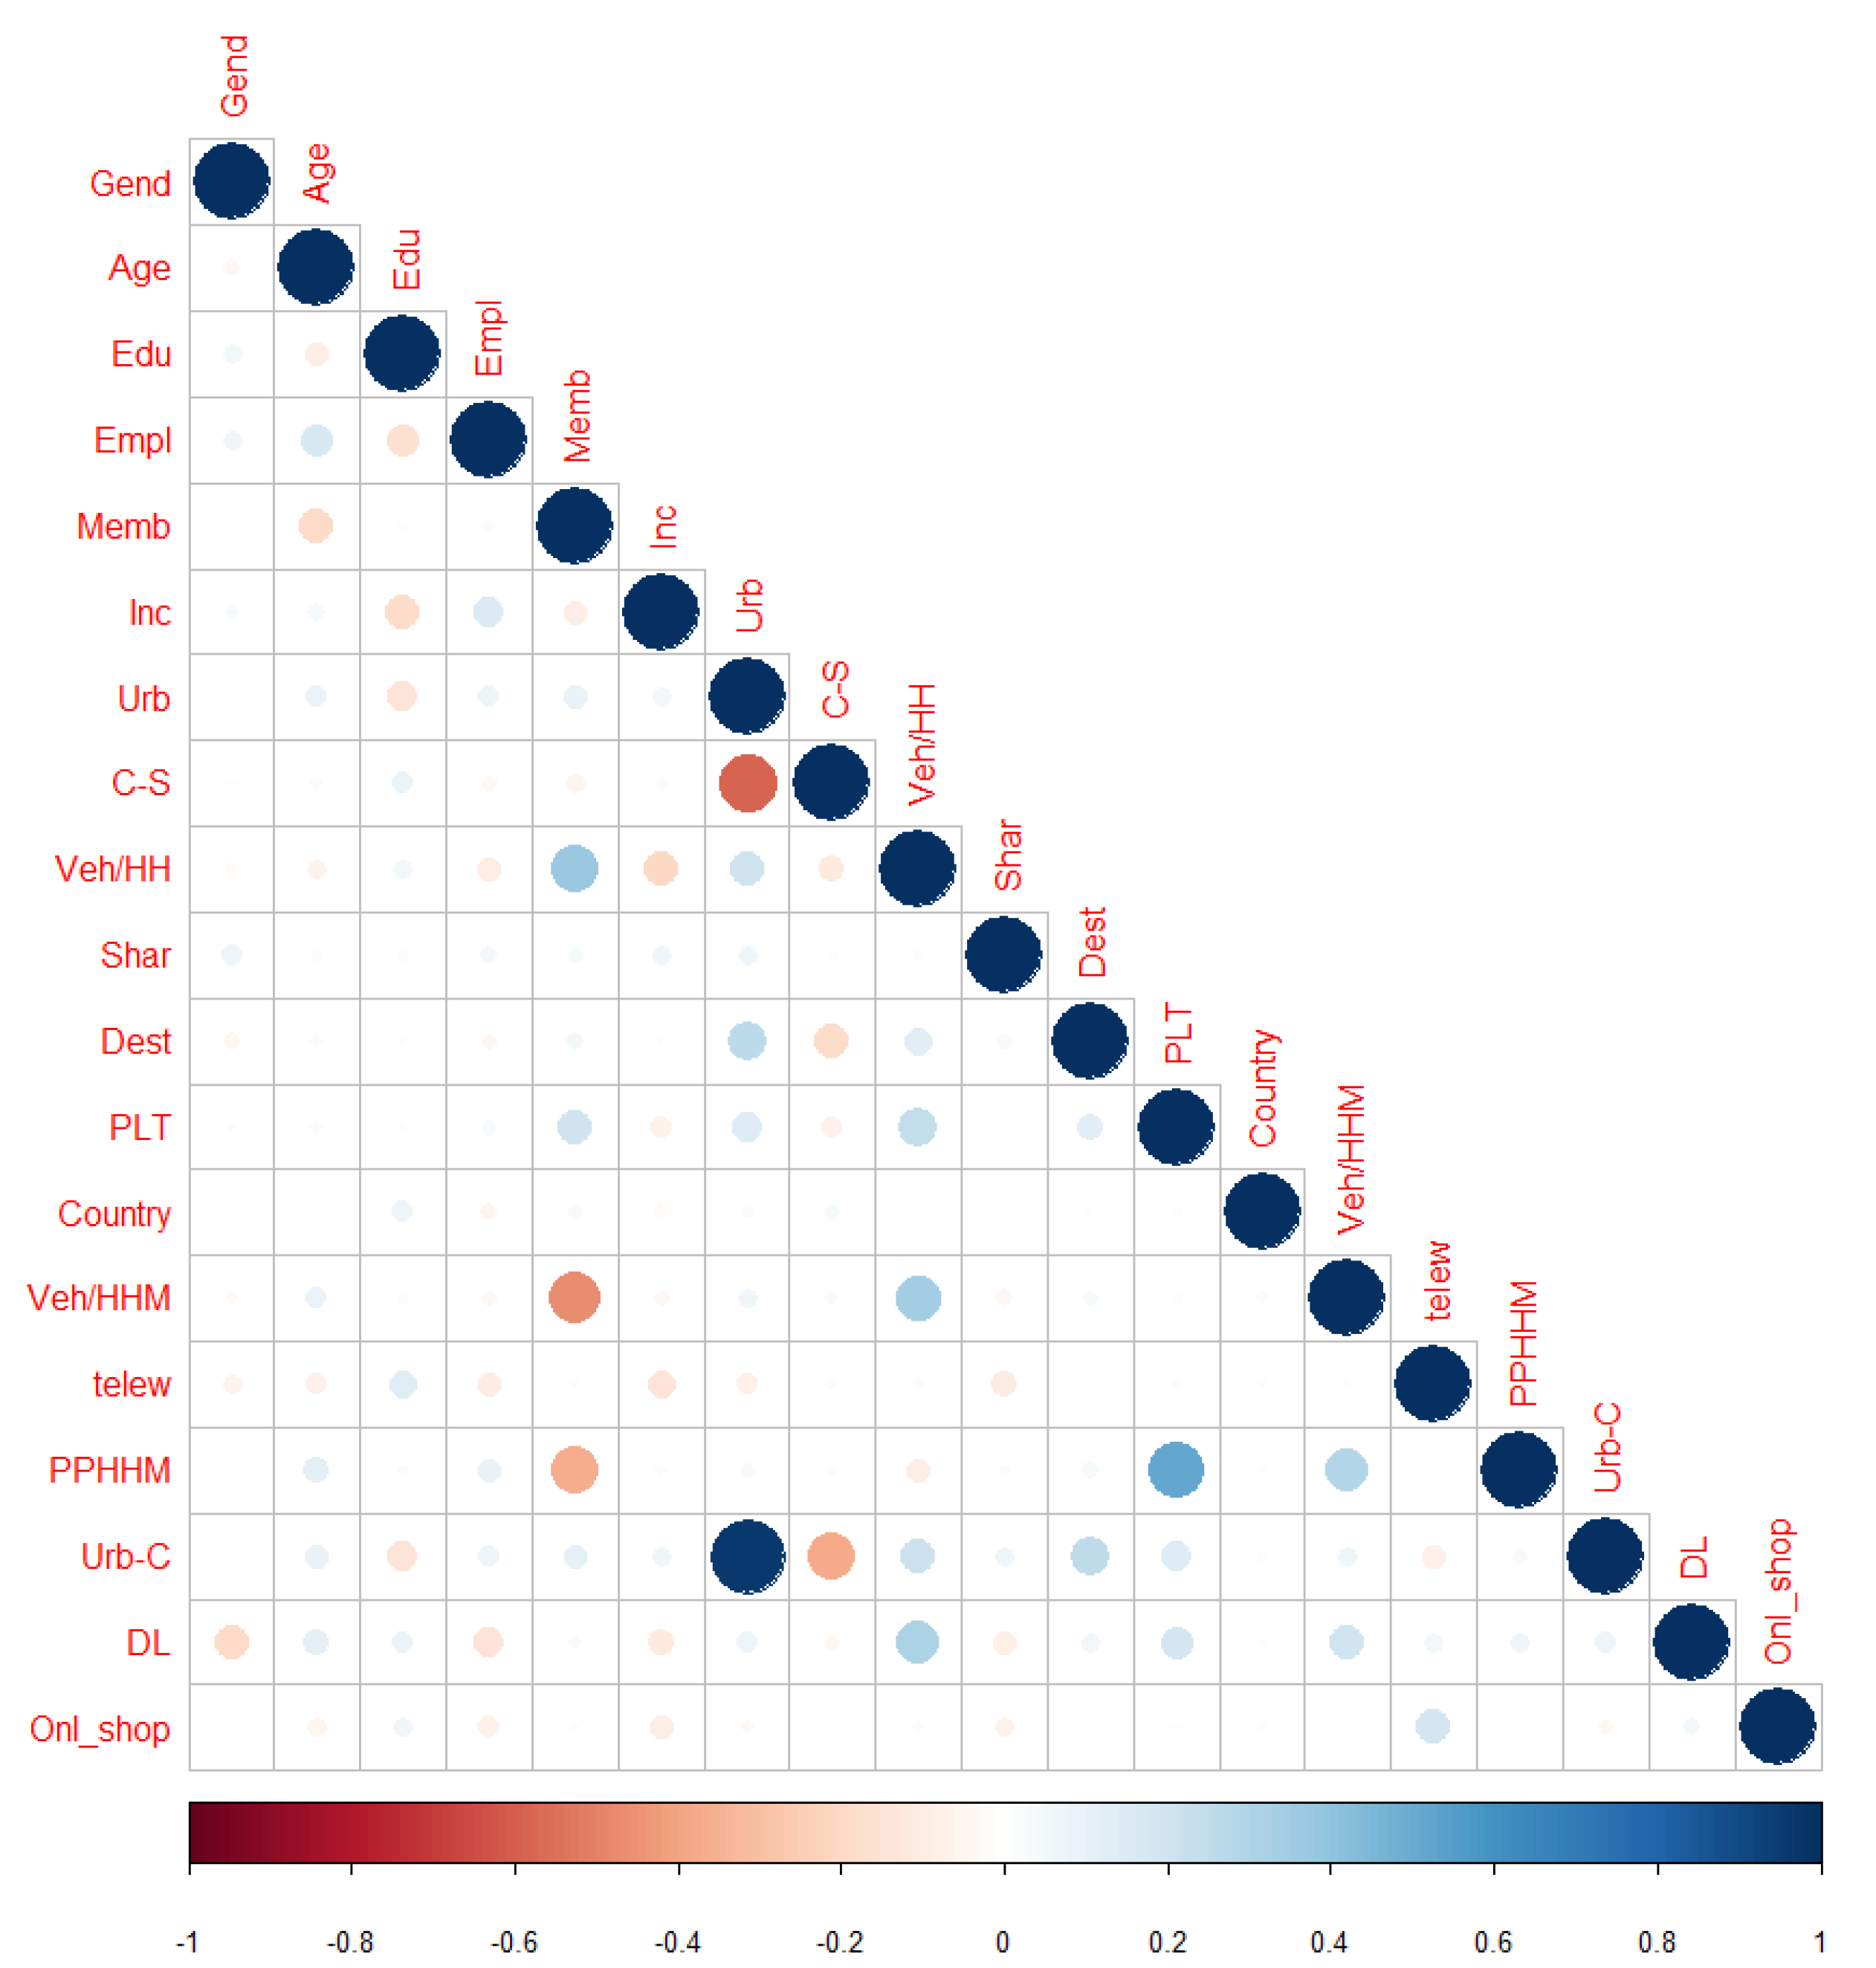
Table A2. Correlation matrix.
GendAgeEduEmplMembIncUrbC-SVeh/HHSharDestPLTCountryVeh/HHMTelewPPHHMUrb-CDLOnl_Shop
Gend1−0.040.060.060.000.03−0.01−0.01−0.030.08−0.050.010.00−0.03−0.060.00−0.01−0.200.00
Age−0.041−0.090.16−0.200.050.08−0.02−0.06−0.020.030.030.000.09−0.070.120.090.12−0.06
Edu0.06−0.091−0.170.02−0.19−0.150.090.06−0.020.010.020.070.020.13−0.02−0.140.080.07
Empl0.060.16−0.171−0.030.160.08−0.03−0.090.05−0.040.04−0.06−0.04−0.100.100.08−0.15−0.07
Memb0.00−0.200.02−0.031−0.090.10−0.060.370.040.050.200.04−0.460.02−0.360.100.030.01
Inc0.030.05−0.190.16−0.0910.06−0.02−0.200.07−0.02−0.08−0.03−0.04−0.140.020.06−0.11−0.10
Urb−0.010.08−0.150.080.100.061−0.580.210.070.260.14−0.020.07−0.080.040.970.07−0.03
C-S−0.01−0.020.09−0.03−0.06−0.02−0.581−0.11−0.02−0.19−0.070.04−0.030.03−0.02−0.37−0.040.00
Veh/HH−0.03−0.060.06−0.090.37−0.200.21−0.111−0.020.120.240.010.350.03−0.100.210.320.02
Shar0.08−0.02−0.020.050.040.070.07−0.02−0.0210.040.010.00−0.05−0.10−0.020.07−0.09−0.06
Dest−0.050.030.01−0.040.05−0.020.26−0.190.120.0410.120.010.04−0.010.050.260.06−0.01
PLT0.010.030.020.040.20−0.080.14−0.070.240.010.1210.02−0.020.020.520.140.190.01
Country0.000.000.07−0.060.04−0.03−0.020.040.010.000.010.021−0.03−0.01−0.01−0.02−0.010.01
Veh/HHM−0.030.090.02−0.04−0.46−0.040.07−0.030.35−0.050.04−0.02−0.0310.010.300.070.200.01
telew−0.06−0.070.13−0.100.02−0.14−0.080.030.03−0.10−0.010.02−0.010.0110.00−0.090.060.19
PPHHM0.000.12−0.020.10−0.360.020.04−0.02−0.10−0.020.050.52−0.010.300.0010.040.070.00
Urb-C−0.010.09−0.140.080.100.060.97−0.370.210.070.260.14−0.020.07−0.090.0410.07−0.04
DL−0.200.120.08−0.150.03−0.110.07−0.040.32−0.090.060.19−0.010.200.060.070.0710.05
Onl_shop0.00−0.060.07−0.070.01−0.10−0.030.000.02−0.06−0.010.010.010.010.190.00−0.040.051
Figure A1. Correlation matrix graph.
Sustainability 13 07211 g0a1

References

  1. EUROSTAT. Passenger Mobility Statistics. Available online: https://ec.europa.eu/eurostat/statistics-explained/index.php?title=Passenger_mobility_statistics&oldid=514852#Mobility_data_for_12_Member_States_with_different_characteristics (accessed on 12 May 2021).
  2. European Environment Agency. Annual European Union Greenhouse Gas Inventory 1990–2018 and Inventory Report 2020; European Environment Agency: Brussels, Belgium, 2020; p. 977.
  3. European Environment Agency. National Emissions Reported to the UNFCCC and to the EU Greenhouse Gas Monitoring Mechanism. Available online: https://www.eea.europa.eu/data-and-maps/data/national-emissions-reported-to-the-unfccc-and-to-the-eu-greenhouse-gas-monitoring-mechanism-16 (accessed on 24 February 2021).
  4. O’Brien, W.; Yazdani Aliabadi, F. Does Telecommuting Save Energy? A Critical Review of Quantitative Studies and Their Research Methods. Energy Build. 2020, 225, 110298. [Google Scholar] [CrossRef]
  5. Hook, A.; Court, V.; Sovacool, B.K.; Sorrell, S. A Systematic Review of the Energy and Climate Impacts of Teleworking. Environ. Res. Lett. 2020, 15, 093003. [Google Scholar] [CrossRef] [Green Version]
  6. Shahmohammadi, S.; Steinmann, Z.J.N.; Tambjerg, L.; Van Loon, P.; King, J.M.H.; Huijbregts, M.A.J. Comparative Greenhouse Gas Footprinting of Online versus Traditional Shopping for Fast-Moving Consumer Goods: A Stochastic Approach. Environ. Sci. Technol. 2020, 54, 3499–3509. [Google Scholar] [CrossRef]
  7. Van Loon, P.; Deketele, L.; Dewaele, J.; McKinnon, A.; Rutherford, C. A Comparative Analysis of Carbon Emissions from Online Retailing of Fast Moving Consumer Goods. J. Clean. Prod. 2015, 106, 478–486. [Google Scholar] [CrossRef]
  8. Jaller, M.; Pahwa, A. Evaluating the Environmental Impacts of Online Shopping: A Behavioral and Transportation Approach. Transp. Res. Part D Transp. Environ. 2020, 80, 102223. [Google Scholar] [CrossRef]
  9. O’Keefe, P.; Caulfield, B.; Brazil, W.; White, P. The Impacts of Telecommuting in Dublin. Res. Transp. Econ. 2016, 57, 13–20. [Google Scholar] [CrossRef]
  10. Le Quéré, C.; Jackson, R.B.; Jones, M.W.; Smith, A.J.P.; Abernethy, S.; Andrew, R.M.; De-Gol, A.J.; Willis, D.R.; Shan, Y.; Canadell, J.G.; et al. Temporary Reduction in Daily Global CO2 Emissions during the COVID-19 Forced Confinement. Nat. Clim. Chang. 2020, 10, 647–653. [Google Scholar] [CrossRef]
  11. Cárcel-Carrasco, J.; Pascual-Guillamón, M.; Langa-Sanchis, J. Analysis of the Effect of COVID-19 on Air Pollution: Perspective of the Spanish Case. Environ. Sci. Pollut. Res. 2021, 1–14. Available online: https://rdcu.be/cnddD (accessed on 24 May 2021). [CrossRef]
  12. Dutheil, F.; Baker, J.S.; Navel, V. COVID-19 as a Factor Influencing Air Pollution? Environ. Pollut. 2020, 263, 114466. [Google Scholar] [CrossRef]
  13. Warren, M.S.; Skillman, S.W. Mobility Changes in Response to COVID-19. arXiv 2020, arXiv:2003.14228 [cs]. [Google Scholar]
  14. Anke, J.; Francke, A.; Schaefer, L.-M.; Petzoldt, T. Impact of SARS-CoV-2 on the Mobility Behaviour in Germany. Eur. Transp. Res. Rev. 2021, 13, 10. [Google Scholar] [CrossRef]
  15. Bucsky, P. Modal Share Changes Due to COVID-19: The Case of Budapest. Transp. Res. Interdiscip. Perspect. 2020, 8, 100141. [Google Scholar] [CrossRef]
  16. Christidis, P.; Christodoulou, A.; Navajas-Cawood, E.; Ciuffo, B. The Post-Pandemic Recovery of Transport Activity: Emerging Mobility Patterns and Repercussions on Future Evolution. Sustainability 2021, 13, 6359. [Google Scholar] [CrossRef]
  17. EUROSTAT. E-Commerce Statistics for Individuals. Available online: https://ec.europa.eu/eurostat/statistics-explained/index.php?title=E-commerce_statistics_for_individuals&oldid=417477 (accessed on 15 April 2021).
  18. European Commission. Telework in the EU before and after the COVID-19: Where We Were, Where We Head To. Sci. Policy Briefs 2020, 2009, 8. [Google Scholar]
  19. Sostero, M.; Milasi, S.; Hurley, J.; Fernandez-Macías, E.; Bisello, M. Teleworkability and the COVID-19 Crisis: A New Digital Divide? European Commission: Seville, Spain, 2020; p. 74. Available online: https://ec.europa.eu/jrc/sites/default/files/jrc121193.pdf (accessed on 24 June 2021).
  20. Larson, W.; Zhao, W. Telework: Urban Form, Energy Consumption, and Greenhouse Gas Implications. Econ. Inq. 2017, 55, 714–735. [Google Scholar] [CrossRef]
  21. Ravalet, E.; Rérat, P. Teleworking: Decreasing Mobility or Increasing Tolerance of Commuting Distances? Built Environ. 2019, 45, 582–602. [Google Scholar] [CrossRef]
  22. Ahmadian, E.; Byrd, H.; Sodagar, B.; Matthewman, S.; Kenney, C.; Mills, G. Energy and the Form of Cities: The Counterintuitive Impact of Disruptive Technologies. Archit. Sci. Rev. 2019, 62, 145–151. [Google Scholar] [CrossRef] [Green Version]
  23. Goldmark, P.C. The New Rural Society through Communication Technology. Res. Manag. 1972, 15, 14–25. [Google Scholar] [CrossRef]
  24. Nilles, J.M. Telecommunications and Organizational Decentralization. IEEE Trans. Commun. 1975, 23, 1142–1147. [Google Scholar] [CrossRef] [Green Version]
  25. ILO. COVID-19: Guidance for Labour Statistics Data Collection; International Labour Organization: Geneva, Switzerland, 2020; p. 15. Available online: https://ilo.org/wcmsp5/groups/public/---dgreports/---stat/documents/publication/wcms_747075.pdf (accessed on 24 June 2021).
  26. Dingel, J.I.; Neiman, B. How Many Jobs Can Be Done at Home? J. Public Econ. 2020, 189, 104235. [Google Scholar] [CrossRef]
  27. Eurofound. Living, Working and COVID-19; COVID-19 series; Publications Office of the European Union: Luxembourg, 2020; p. 80. Available online: https://www.eurofound.europa.eu/sites/default/files/ef_publication/field_ef_document/ef20059en.pdf (accessed on 24 June 2021).
  28. Bailey, D.E.; Kurland, N.B. A Review of Telework Research: Findings, New Directions, and Lessons for the Study of Modern Work. J. Organ. Behav. 2002, 23, 383–400. [Google Scholar] [CrossRef]
  29. Vilhelmson, B.; Thulin, E. Who and Where Are the Flexible Workers? Exploring the Current Diffusion of Telework in Sweden. New Technol. Work Employ. 2016, 31, 77–96. [Google Scholar] [CrossRef]
  30. Haddon, L.; Brynin, M. The Character of Telework and the Characteristics of Teleworkers. New Technol. Work Employ. 2005, 20, 34–46. [Google Scholar] [CrossRef] [Green Version]
  31. Elldér, E. Who Is Eligible for Telework? Exploring the Fast-Growing Acceptance of and Ability to Telework in Sweden, 2005–2006 to 2011–2014. Soc. Sci. 2019, 8, 200. [Google Scholar] [CrossRef] [Green Version]
  32. López-Igual, P.; Rodríguez-Modroño, P. Who Is Teleworking and Where from? Exploring the Main Determinants of Telework in Europe. Sustainability 2020, 12, 8797. [Google Scholar] [CrossRef]
  33. Balepur, P.N.; Varma, K.V.; Mokhtarian, P.L. Transportation Impacts of Center-Based Telecommuting: Interim Findings from the Neighborhood Telecenters Project. Transportation 1998, 25, 287–306. [Google Scholar] [CrossRef]
  34. Choo, S.; Mokhtarian, P.L.; Salomon, I. Does Telecommuting Reduce Vehicle-Miles Traveled? An Aggregate Time Series Analysis for the U.S. Transportation 2005, 32, 37–64. [Google Scholar] [CrossRef] [Green Version]
  35. Mokhtarian, P.L.; Salomon, I.; Choo, S. Measuring the Measurable: Why Can’t We Agree on the Number of Telecommuters in the U.S.? Qual. Quant. 2005, 39, 423–452. [Google Scholar] [CrossRef]
  36. Mokhtarian, P.L.; Collantes, G.O.; Gertz, C. Telecommuting, Residential Location, and Commute-Distance Traveled: Evidence from State of California Employees. Environ. Plan A 2004, 36, 1877–1897. [Google Scholar] [CrossRef]
  37. Koenig, B.E.; Henderson, D.K.; Mokhtarian, P.L. The Travel and Emissions Impacts of Telecommuting for the State of California Telecommuting Pilot Project. Transp. Res. Part C Emerg. Technol. 1996, 4, 13–32. [Google Scholar] [CrossRef] [Green Version]
  38. Fu, M.; Andrew Kelly, J.; Peter Clinch, J.; King, F. Environmental Policy Implications of Working from Home: Modelling the Impacts of Land-Use, Infrastructure and Socio-Demographics. Energy Policy 2012, 47, 416–423. [Google Scholar] [CrossRef]
  39. Alonso, A.; Monzón, A.; Wang, Y. Modelling Land Use and Transport Policies to Measure Their Contribution to Urban Challenges: The Case of Madrid. Sustainability 2017, 9, 378. [Google Scholar] [CrossRef] [Green Version]
  40. Helminen, V.; Ristimäki, M. Relationships between Commuting Distance, Frequency and Telework in Finland. J. Transp. Geogr. 2007, 15, 331–342. [Google Scholar] [CrossRef]
  41. Giovanis, E. The Relationship between Teleworking, Traffic and Air Pollution. Atmos. Pollut. Res. 2018, 9, 1–14. [Google Scholar] [CrossRef] [Green Version]
  42. De Abreu e Silva, J.; Melo, P.C. Does Home-Based Telework Reduce Household Total Travel? A Path Analysis Using Single and Two Worker British Households. J. Transp. Geogr. 2018, 73, 148–162. [Google Scholar] [CrossRef]
  43. Chakrabarti, S. Does Telecommuting Promote Sustainable Travel and Physical Activity? J. Transp. Health 2018, 9, 19–33. [Google Scholar] [CrossRef]
  44. Elldér, E. Does Telework Weaken Urban Structure-Travel Relationships? J. Transp. Land Use 2017, 10, 187–210. [Google Scholar] [CrossRef]
  45. Moretti, A.; Menna, F.; Aulicino, M.; Paoletta, M.; Liguori, S.; Iolascon, G. Characterization of Home Working Population during COVID-19 Emergency: A Cross-Sectional Analysis. Int. J. Environ. Res. Public Health 2020, 17, 6284. [Google Scholar] [CrossRef]
  46. Hilbrecht, M.; Shaw, S.M.; Johnson, L.C.; Andrey, J. Remixing Work, Family and Leisure: Teleworkers’ Experiences of Everyday Life: Remixing Work, Family and Leisure. New Technol. Work Employ. 2013, 28, 130–144. [Google Scholar] [CrossRef]
  47. Tavares, A.I. Telework and Health Effects Review. Int. J. Healthc. 2017, 3, 30. [Google Scholar] [CrossRef] [Green Version]
  48. Aguilera, A.; Lethiais, V.; Rallet, A.; Proulhac, L. Home-Based Telework in France: Characteristics, Barriers and Perspectives. Transp. Res. Part A Policy Pract. 2016, 92, 1–11. [Google Scholar] [CrossRef]
  49. Thulin, E.; Vilhelmson, B.; Johansson, M. New Telework, Time Pressure, and Time Use Control in Everyday Life. Sustainability 2019, 11, 3067. [Google Scholar] [CrossRef] [Green Version]
  50. Eurostat. Internet Purchases by Individuals; 2021. Available online: https://ec.europa.eu/eurostat/databrowser/view/isoc_ec_ibuy/default/table?lang=en (accessed on 24 June 2021).
  51. Beckers, J.; Cárdenas, I.; Verhetsel, A. Identifying the Geography of Online Shopping Adoption in Belgium. J. Retail. Consum. Serv. 2018, 45, 33–41. [Google Scholar] [CrossRef]
  52. Farag, S.; Schwanen, T.; Dijst, M.; Faber, J. Shopping Online and/or in-Store? A Structural Equation Model of the Relationships between e-Shopping and in-Store Shopping. Transp. Res. Part A Policy Pract. 2007, 41, 125–141. [Google Scholar] [CrossRef] [Green Version]
  53. Clarke, G.; Thompson, C.; Birkin, M. The Emerging Geography of E-Commerce in British Retailing. Reg. Stud. Reg. Sci. 2015, 2, 371–391. [Google Scholar] [CrossRef]
  54. Dominici, A.; Boncinelli, F.; Gerini, F.; Marone, E. Determinants of Online Food Purchasing: The Impact of Socio-Demographic and Situational Factors. J. Retail. Consum. Serv. 2021, 60, 102473. [Google Scholar] [CrossRef]
  55. Chocarro, R.; Cortiñas, M.; Villanueva, M.-L. Situational Variables in Online versus Offline Channel Choice. Electron. Commer. Res. Appl. 2013, 12, 347–361. [Google Scholar] [CrossRef] [Green Version]
  56. Li, Z.; Lu, Q.; Talebian, M. Online versus Bricks-and-Mortar Retailing: A Comparison of Price, Assortment and Delivery Time. Int. J. Prod. Res. 2015, 53, 3823–3835. [Google Scholar] [CrossRef]
  57. Bauerová, R.; Braciníková, V. Customer’s Choice of Purchasing Channel: Do Channel Characteristic, Brand, and Loyalty Matter When Shopping in Hybrid Retailers? Sustainability 2021, 13, 2453. [Google Scholar] [CrossRef]
  58. Ma, J. Does Greater Online Assortment Pay? An Empirical Study Using Matched Online and Catalog Shoppers. J. Retail. 2016, 92, 373–382. [Google Scholar] [CrossRef]
  59. Hiselius, L.W.; Rosqvist, L.S.; Adell, E. Travel Behaviour of Online Shoppers in Sweden. Transp. Telecommun. 2015, 16, 21–30. [Google Scholar] [CrossRef] [Green Version]
  60. Fiorello, D.; Martino, A.; Zani, L.; Christidis, P.; Navajas-Cawood, E. Mobility Data across the EU 28 Member States: Results from an Extensive CAWI Survey. Transp. Res. Procedia 2016, 14, 1104–1113. [Google Scholar] [CrossRef] [Green Version]
  61. Chen, T.; Guestrin, C. XGBoost: A Scalable Tree Boosting System. In Proceedings of the the 22nd ACM SIGKDD International Conference on Knowledge Discovery and Data Mining, San Francisco, CA, USA, 13 August 2016; pp. 785–794. [Google Scholar]
  62. Wang, F.; Ross, C.L. Machine Learning Travel Mode Choices: Comparing the Performance of an Extreme Gradient Boosting Model with a Multinomial Logit Model. Transp. Res. Rec. 2018, 2672, 35–45. [Google Scholar] [CrossRef] [Green Version]
  63. Hagenauer, J.; Helbich, M. A Comparative Study of Machine Learning Classifiers for Modeling Travel Mode Choice. Expert Syst. Appl. 2017, 78, 273–282. [Google Scholar] [CrossRef]
  64. Christidis, P.; Focas, C. Factors Affecting the Uptake of Hybrid and Electric. Energies 2019, 12, 3414. [Google Scholar] [CrossRef] [Green Version]
  65. Focas, C.; Christidis, P. Peak Car in Europe? Transp. Res. Procedia 2017, 25, 531–550. [Google Scholar] [CrossRef]
  66. Hosmer, D.W.; Lemeshow, S.; Sturdivant, R.X. Applied Logistic Regression, 3rd ed.; Wiley series in probability and statistics; Wiley: Hoboken, NJ, USA, 2013. [Google Scholar]
Figure 1. Types of teleworkers. Source ILO [25].
Sustainability 13 07211 g001
Figure 2. Teleworking distribution by country.
Sustainability 13 07211 g002
Figure 3. Online shopping distribution by country.
Sustainability 13 07211 g003
Figure 4. Predictor Feature importance. Teleworking.
Sustainability 13 07211 g004
Figure 5. SHAP values. Teleworking.
Sustainability 13 07211 g005
Figure 6. Predictor Feature importance. Online shopping.
Sustainability 13 07211 g006
Figure 7. SHAP values. Online shopping.
Sustainability 13 07211 g007
Table 1. Statistic description on the sample.
ObservationTotalTeleworkOnline Shopping
n26,4991010
5035
19.00%
21,464
81.00%
18,059
31.85%
8440
68.15%
SOCIO-ECONOMIC
Gender
Female51.00%44.09%52.62%50.92%51.17%
Male49.00%55.91%47.38%49.08%48.83%
Age
16–25
26–35
36–45
46–55
56–65
>65
13.55%
24.34%
24.35%
20.63%
12.56%
4.57%
15.51%
29.85%
24.65%
18.69%
9.04%
2.26%
13.09%
23.04%
24.28%
21.09%
13.39%
5.11%
13.44%
25.63%
25.20%
20.41%
11.66%
3.67%
13.79%
21.58%
22.55%
21.11%
14.49%
6.48%
Education Level
Primary
Lower Secondary
Upper Secondary
Tertiary
2.79%
11.95%
42.88%
42.38%
2.11%
6.93%
34.80%
56.17%
2.94%
13.13%
44.78%
39.14%
2.59%
11.32%
41.14%
44.95%
3.20%
13.29%
46.62%
36.88%
Employment Status
Full-time
Part-time
Unemployed
Studying
Retired
Other & NA
60.21%
10.74%
6.40%
7.29%
9.39%
5.97%
69.31%
11.64%
3.83%
7.55%
3.73%
3.93%
58.07%
10.52%
7.00%
7.24%
10.72%
6.45%
62.56%
11.03%
5.43%
7.17%
8.25%
5.57%
55.17%
10.11%
8.47%
7.57%
11.85%
6.84%
Household Members
One
Two
Three
Four
Five
More than five
NA
15.10%
31.86%
23.95%
20.22%
6.11%
2.40%
0.36%
14.46%
30.88%
23.61%
21.55%
6.65%
2.58%
0.26%
15.25%
32.09%
24.03%
19.90%
5.99%
2.35%
0.39%
15.09%
30.98%
24.36%
20.55%
6.27%
2.45%
0.29%
15.12%
33.74%
23.06%
19.50%
5.77%
2.29%
0.52%
Income Group
High
Higher middle
Middle
Lower-middle
Low
N/A
1.92%
12.36%
52.90%
22.48%
6.72%
3.62%
4.87%
20.60%
53.33%
14.90%
3.75%
2.56%
1.23%
10.43%
52.80%
24.26%
7.41%
3.87%
2.24%
13.83%
53.98%
21.08%
5.81%
3.06%
1.23%
9.22%
50.58%
25.49%
8.65%
4.83%
Urban-Centre
Metrop. > 1 M Centre
Metrop. > 1 M Suburbs
Large City 0.25–1 M Centre
Large City 0.25–1 M Suburbs
Small Medium < 0.25 M Centre
Small Medium < 0.25 M Suburbs
Rural
6.53%
6.36%
9.54%
9.49%
20.38%
23.87%
23.84%
10.07%
7.92%
12.53%
10.21%
19.25%
20.64%
19.38%
5.70%
6.00%
8.83%
9.32%
20.64%
24.63%
24.88%
7.09%
6.60%
9.78%
9.58%
20.19%
23.20%
23.55%
5.33%
5.85%
9.00%
9.29%
20.77%
25.30%
24.45%
ObservationTotalTeleworkOnline Shopping
CAR AVAILABILITY
Driving Licence
Yes—Car
Yes—Moto/Scooter/Moped
No—In the process
No
66.63%
17.37%
2.97%
13.04%
67.71%
21.45%
3.54%
7.31%
66.37%
16.41%
2.84%
14.38%
66.65%
18.49%
2.99%
11.87%
66.56%
14.96%
2.93%
15.55%
N. Vehicles
0
1
2
3
≥4
11.47%
45.51%
31.17%
8.14%
3.70%
9.04%
43.87%
34.12%
8.38%
4.59%
12.04%
45.90%
30.48%
8.08%
3.49%
10.90%
44.90%
32.37%
8.02%
3.81%
12.69%
46.84%
28.60%
8.40%
3.47%
Buy Car
Yes—Next 6 months
Yes—Next 12 months
Yes—Next 2 years
No
DK/NA
8.28%
12.38%
25.56%
42.59%
11.20%
13.72%
19.25%
28.50%
31.24%
7.29%
7.00%
10.77%
24.87%
45.25%
12.11%
9.07%
13.51%
27.13%
39.76%
10.53%
6.58%
9.96%
22.20%
48.64%
12.62%
Buy e-car
Certainly yes
Probably yes
Maybe Yes/Maybe Not
Probably not
Certainly not
DK/NA
13.44%
23.92%
29.19%
16.66%
9.03%
7.76%
18.53%
30.33%
27.71%
14.50%
5.70%
3.24%
12.25%
22.42%
29.53%
17.16%
9.81%
8.82%
14.60%
25.42%
29.64%
16.50%
7.88%
5.97%
10.97%
20.71%
28.22%
17.00%
11.49%
11.60%
Car Sharing
Yes
No
Do not know Car Sharing
3.72%
78.43%
17.85%
10.82%
76.13%
13.05%
2.05%
78.97%
18.97%
4.65%
78.78%
16.57%
1.73%
77.69%
20.58%
ICT
Online Shopping
Often
Sometimes
Rarely
Once
Never
18.97%
31.24%
17.94%
2.83%
29.02%
28.82%
39.42%
19.07%
2.74%
9.95%
16.66%
29.32%
17.67%
2.85%
33.50%
Teleworking
More than 4 times/month
3–4 times/month
Once/month
Only Once
Never
6.45%
5.52%
7.02%
6.77%
74.23%
8.20%
7.28%
8.87%
7.81%
67.84%
2.71%
1.78%
3.08%
4.54%
87.89%
Table 2. Summary of model performance.
ModelAUC TestAUC Validation
Teleworking0.7120.710
Online Shopping0.7060.706
Publisher’s Note: MDPI stays neutral with regard to jurisdictional claims in published maps and institutional affiliations.

