Article

Optimization of the Biomethane Production Process by Anaerobic Digestion of Wheat Straw Using Chemical Pretreatments Coupled with Ultrasonic Disintegration

by
Yasmine Ryma Ouahabi
1,2,
Kenza Bensadok
1 and
Abdeldjalil Ouahabi
3,4,*
1
Laboratoire des Sciences du Génie des Procédés et Environnement, Université des Sciences et de la Technologie Houari Boumediene, Algiers 16111, Algeria
2
Centre de Recherche Scientifique & Technique en Analyse Physico-Chimique (CRAPS), Tipaza 42415, Algeria
3
UMR 1253, iBrain, Université de Tours, Inserm, 37000 Tours, France
4
Department of Computer Science, LIMPAF, University of Bouira, Bouira 10000, Algeria
*
Author to whom correspondence should be addressed.
Sustainability 2021, 13(13), 7202; https://doi.org/10.3390/su13137202
Submission received: 11 April 2021 / Revised: 18 June 2021 / Accepted: 23 June 2021 / Published: 27 June 2021
(This article belongs to the Special Issue Feature Papers in Energy Sustainability)

Abstract

:
Biomass is an attractive energy source that can be used for production of heat, power, and transport fuels and when produced and used on a sustainable basis, can make a large contribution to reducing greenhouse gas emissions. Anaerobic digestion (AD) is a suitable technology for reducing organic matter and generating bioenergy in the form of biogas. This study investigated the factors allowing the optimization of the process of biogas production from the digestion of wheat straw (WS). The statistical analysis of the experiments carried out showed that ultrasonic processing plays a fundamental role with the sonication density and solids concentration leading to improved characteristics of WS, reducing particle size, and increasing concentration of soluble chemical oxygen demand. The higher the sonicating power used, the more the waste particles are disrupted. The optimality obtained under mesophilic conditions for WS pretreated with 4% w/w (weight by weight) H2O2 at temperature 36 °C under 10 min of ultrasonication at 24 kHz with a power of 200 W improves the methane yield by 64%.

1. Introduction

Anaerobic digestion (AD) is widely used as a renewable energy source. AD produces biogas that can be used directly as a fuel, in combined heat and power gas engines, or converted into natural gas quality biomethane. The nutrient-rich digestate also produced can be used as fertilizer. AD of biomass residues is considered one of the sustainable options for producing green energy to meet global demand and ensure an adequate future supply of clean energy and fuel [1,2]. Methanization, or the production of biogas from agricultural waste and residues, as part of a circular economy approach, meets two major challenges: the production of renewable energy to replace fossil fuels and contribute to a future 100% renewable energy system and support for the transition of the agricultural sector through the implementation of agro-ecological practices.
Figure 1 shows the methanization process. It consists of the degradation, under the action of bacteria, of organic materials (or substrates) such as agricultural materials and livestock effluents (plant biomass, manure, slurry), green and household bio-waste, waste from the food industry, and sludge from wastewater treatment plants. This reaction, called anaerobic digestion (in the absence of oxygen), produces biogas and digestate. Biomass is the latest renewable energy to be exploited, subject to sustainability criteria. More than 10% of the EU (European Union) final energy consumption would come from biomass, which would then represent half of the total renewable energy consumption in Europe. According to the European Union [3], in 2030, the use of biomass (final energy) will be 19 EJ (1 EJ = 10 18 joules), which represents 19% of the total energy consumption, all sources combined. At that time, the proportion of energy consumption from renewable sources will be 41%.
The world’s energy production has entered a transitional phase that will require us to significantly reduce our consumption of fossil fuels, which are sources of greenhouse gases and whose resources are not inexhaustible.
Today, the only renewable alternative to fossil fuels for the production of liquid fuels, lubricants, and basic molecules for chemistry is biomass.
Some countries, such as the Netherlands, have reservations about the sustainability of this energy source [4]. However, we must defend the renewable character of biomass when it is managed intelligently. This resource uses cheap and widespread primary energy. It can therefore be collected locally (wood, vegetable, and food waste). In fact, it has the advantage of being dependent on a local market, unlike oil and gas (of fossil origin) which are dependent on international markets.
The future of biogas must be seen in the context of the global energy system. Several directions can be considered depending on the pace of technological innovation, the ambition of energy policies, market dynamics, and societal trends.
Agricultural biomass, such as wheat straw (WS), is abundantly found in nature. However, WS is used as livestock feed, discarded carelessly, or burnt in an open field which involves serious environmental problems [5]. WS can be effectively treated by anaerobic digestion, which is one of the most promising technologies for converting biomass into biogas [6]. However, since the lignocellulosic material in WS is resistant to microbial attack, the AD process is significantly slowed down [7].
Therefore, a WS pretreatment is necessary to improve its biodegradability by hydrolysis of its lignocellulosic recalcitrant components [8]. Pretreatment aims to enhance accessibility to the three main components of lignocellulose (cellulose, lignin, and hemicelluloses) and increase biodegradation rate and overall main product yield in AD [9].
The impact of different pretreatment methods on biomass degradability is extremely different and mostly depends on the feedstock characteristics [8,9]. Several biomass pretreatments have been studied such as grinding [10], ultrasound [11,12], chemical processes [5,13,14], biological technique [15,16], and thermal methods [1,17].
Due to the crystallinity reduction and mass transfer increase, grinding involves the breakdown of biomass size and crystallinity which improves the hydrolysis process [12]. Chemical reagents are predominantly used for pretreatment of lignocellulosic materials because of their low cost and high efficacy [18].
Alkaline pretreatment involves the addition of bases to biomass, such as sodium and potassium hydroxide, which lead to an increase in the internal surface of biomass, a decrease in crystallinity, a destruction of links between lignin and other polymers, and a lignin breakdown. Alkaline pretreatment can delignify biomass by oxidation with high carbohydrate retention. This allows the breaking of the ester and ether bonds between lignin and carbohydrates [19]. Up to now, NaOH and KOH are the most effective alkali-treatments for improving biomass digestibility. NaOH pretreatment has proven to be effective to improve digestibility and increase the methane yield [7]. However, concerns over sodium discharge in the process effluent, which is difficult to be recycled, may limit its application on a commercial scale [11].
To improve biogas production, hydrogen peroxide which is a strong oxidant has been used for biomass pretreatment [19]. It has a significant advantage of leaving no residues in the biomass because it degrades into oxygen and water and hardly forms secondary products [20]. H2O2 promotes the production of HOO anion, which in turn promotes the production of hydroxyl OH and superoxide O2− radicals leading to high delignification [12].
Ultrasound disintegration pretreatment disrupts the cell wall structure, increases the specific surface area, and reduces the degree of polymerization by compression and cavitation effects [21]. The cavitation produced due to the pulsating high-frequency ultrasonic waves penetrates the polysaccharides and disrupts the mesh of cross-linking polymers that facilitate biomass degradation [19]. Cavitation is the formation of a violent collapse of bubbles in the liquid, which can induce several transformations. The main effects of cavitation phenomena include the free radical formation, such as hydroxyl radical generated due to the decomposition of water molecules [22].
The aim of the study was to improve the methane production from wheat straw by coupling several pretreatments. In particular, the coupling of ultrasonic disintegration and chemical pretreatment with NaOH and H2O2 solutions for lignocellulose degradation aimed to optimize biogas and biomethane production.

2. Materials and Methods

This section describes in detail the components of the experiments and the experimental set-up and procedure, as well as the tests and pretreatments considered. The end of this section presents the method and the tools allowing a statistical analysis of the obtained results.

2.1. Substrate and Inocula

Wheat straw (WS) was taken from the stables of Hussein Dey slaughterhouse in Algiers, Algeria. WS was air-dried and ground using a coffee grinder; the fine powder was collected using a series of superimposed sieves. The dry WS with a diameter of 0.65–1.25 mm was collected and stored in a plastic bag at ambient temperature (around 25 °C) until further experimentation. Fresh bovine manure was taken from the stable of bovine of the same slaughterhouse. Sewage sludge was taken from mixed sludge basin of wastewater treatment plant of Baraki, Algiers. The main characteristics of these materials are summarized in Table 1.

2.2. Biochemical Methane Potential (BMP) Tests

Biochemical methane potential (BMP) tests were performed under mesophilic conditions (36 °C) in batch digester of 500 mL as a working volume. Figure 2 shows the experimental set-up used for this purpose. At the beginning of each experiment, the digester was flushed with N2 gas for 4 min to ensure anaerobic conditions.
The biomethane production was measured daily by the liquid displacement method, with the use of acidic solution at pH2 (bottle 5 in Figure 2) to prevent the possible dissolution of CO2 and 3M NaOH solution (bottle 4 in Figure 2) to capture CO2.
AD was conducted at mesophilic conditions (36 °C) thanks to a thermostatic bath.
The digester contents were mechanically mixed for 24 h per day using an electrically powered agitator at a speed of 60 rpm.

2.3. Ultrasound Pretreatment

An ultrasonic wave is a mechanical and elastic wave that propagates through fluid, solid, gaseous, or liquid media. The frequency range of ultrasound is between 20 kHz and 10 THz ( One   Tera   Hertz = 1   THZ = 1000   GHz   = 10 12   Hz ).
Depending on the application, two criteria for classification of ultrasonic waves can be considered: the ultrasonic power and the frequency of the wave.
For a low power (less than 1 W), there is no interaction other than vibratory with the matter, and ultrasound does not induce changes in the medium through which it passes. This concerns all applications of non-destructive testing [23] for frequencies ranging from 20 kHz to 10 MHz and medical diagnosis, as well as ultrasound imaging [24,25,26,27] and Doppler [28] for frequencies above 1 MHz.
When the ultrasonic power is sufficient (a few Watts) and at relatively low frequencies, the passage of the ultrasonic wave is accompanied by non-linear physical phenomena and associated chemical transformations. We speak then of power ultrasound whose emission is likely to modify the medium through which it passes.
These ultrasounds are also used in the medical field but with a therapeutic aim to destroy benign or malignant lesions (tumors, calcifications, stones…) and, in the industrial field, as for example the disintegration of waste. It is this last application that is used, in our work, as a very effective pretreatment of disintegration at a frequency of 24 kHz with a power of 200 W: it is what we call ultrasonication disintegration.
Ultrasound disintegration (US) pretreatment allows material to be broken down on a finer scale than grinding. US involves creating pressure waves, resulting in the formation of cavitation bubbles in the liquid which disrupts the cell wall structure and increases the specific surface area [21,22].
The ultrasonic equipment used in our experiments was the Hielscher ultrasonics UP400S, Berlin, Germany, which is a powerful and reliable ultrasonic device for sonication of large samples in the laboratory.

2.4. Experimental Procedure

Different chemical solutions were experimented on for the pretreatment of wheat straw (WS): NaOH (0.5, 1, 2, 4% w/w), H2O2 (1, 2, 4, 8% w/w), and H2O solely. The experiment with H2O solely was blank experiment; WS was hydrolysis with only distilled water H2O without any chemical reagents. In each experiment, 2 g of biomass sample was added to 200 mL of solution stirred with moderate agitation (250 rpm) for 1h. The methodology adopted in several of our experiments was to study NaOH and H2O2 pretreatment coupled with ultrasonic pretreatment, with the objective of determining the optimal concentrations to achieve the highest chemical oxygen demand (COD). In this context, 2 g of biomass sample was added to 200 mL of water subjected to 30 min of ultrasound in different configurations and concentrations of NaOH (0.5, 1, 2, 4% w/w), H2O2 (1, 2, 4, 8% w/w), H2O alone (WS with only distilled H2O), and H2O with US (WS with only distilled water and US). Once the optimal concentration was determined, we performed new experiments, this time varying the ultrasound exposure time from 5 to 45 min. The evaluation of pretreatments was measured by the quantity of dissolved organic matter COD. After pretreatments of WS, samples were centrifuged, and we recovered the liquid phase for COD analyses.
Regarding BMP tests:
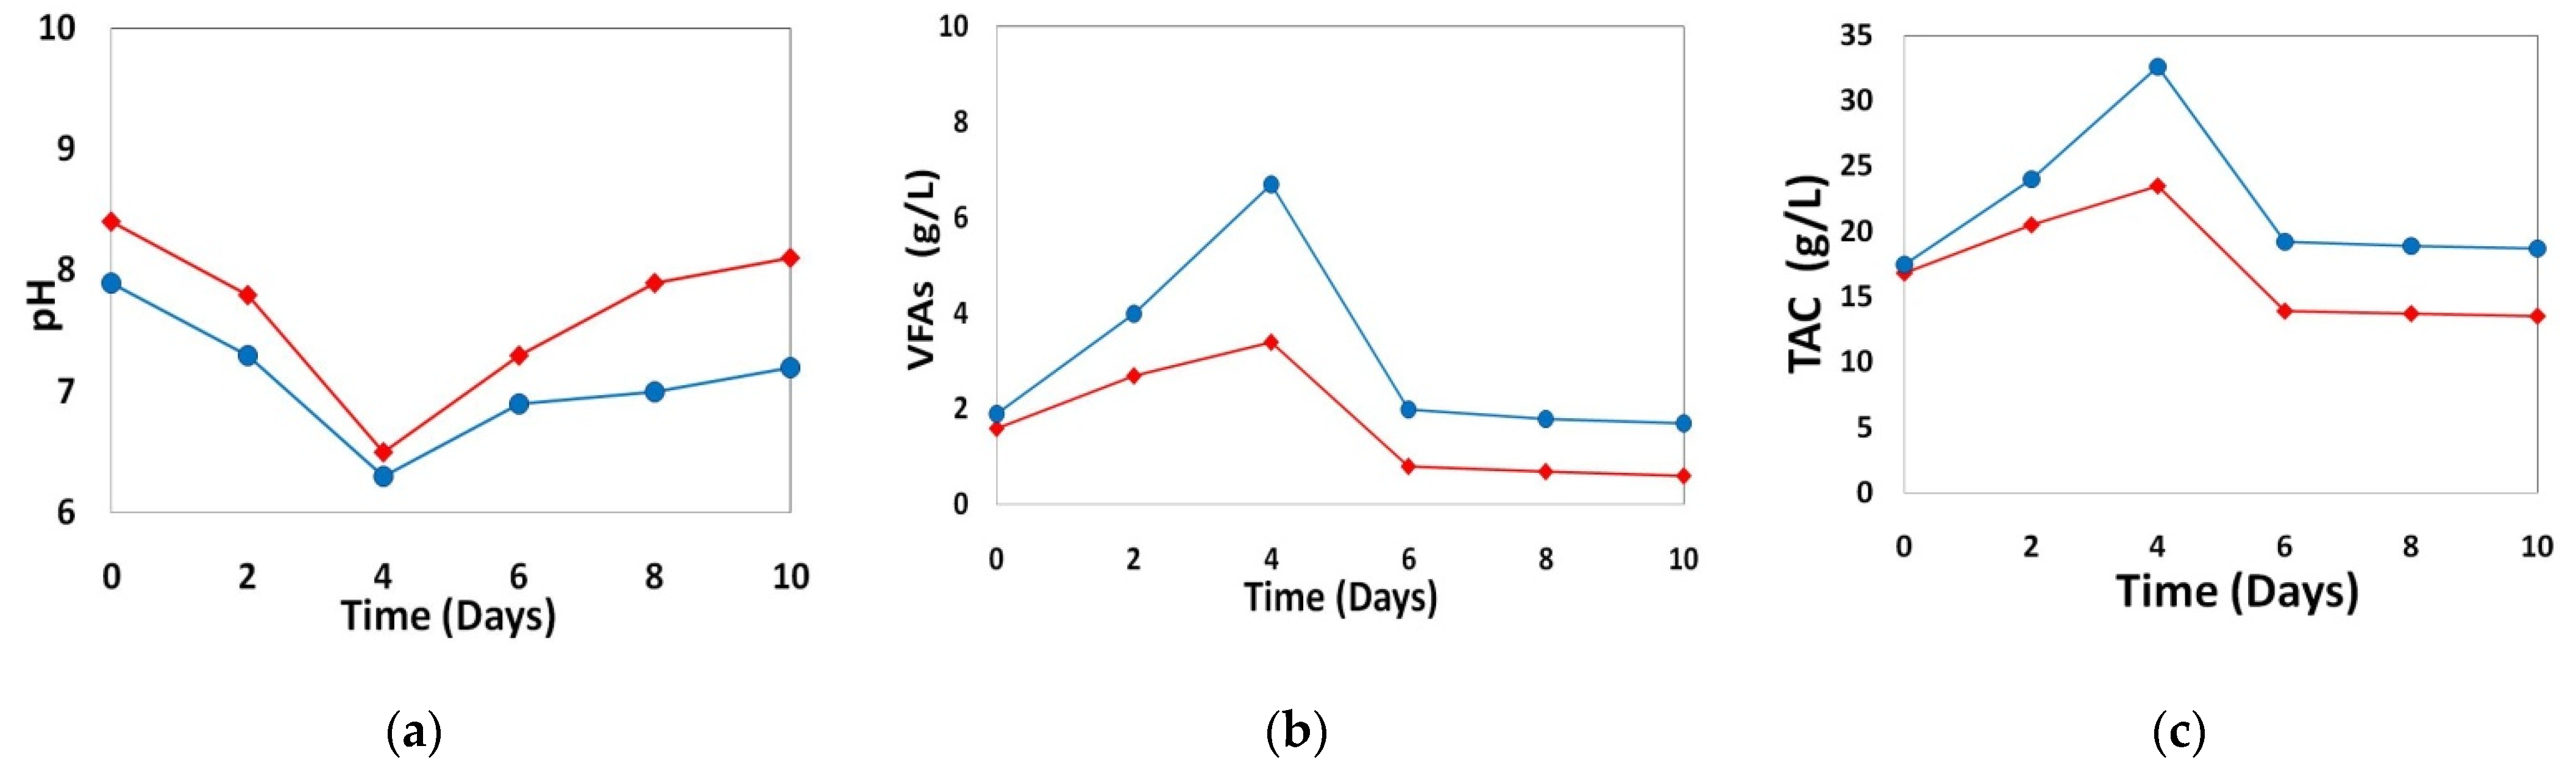
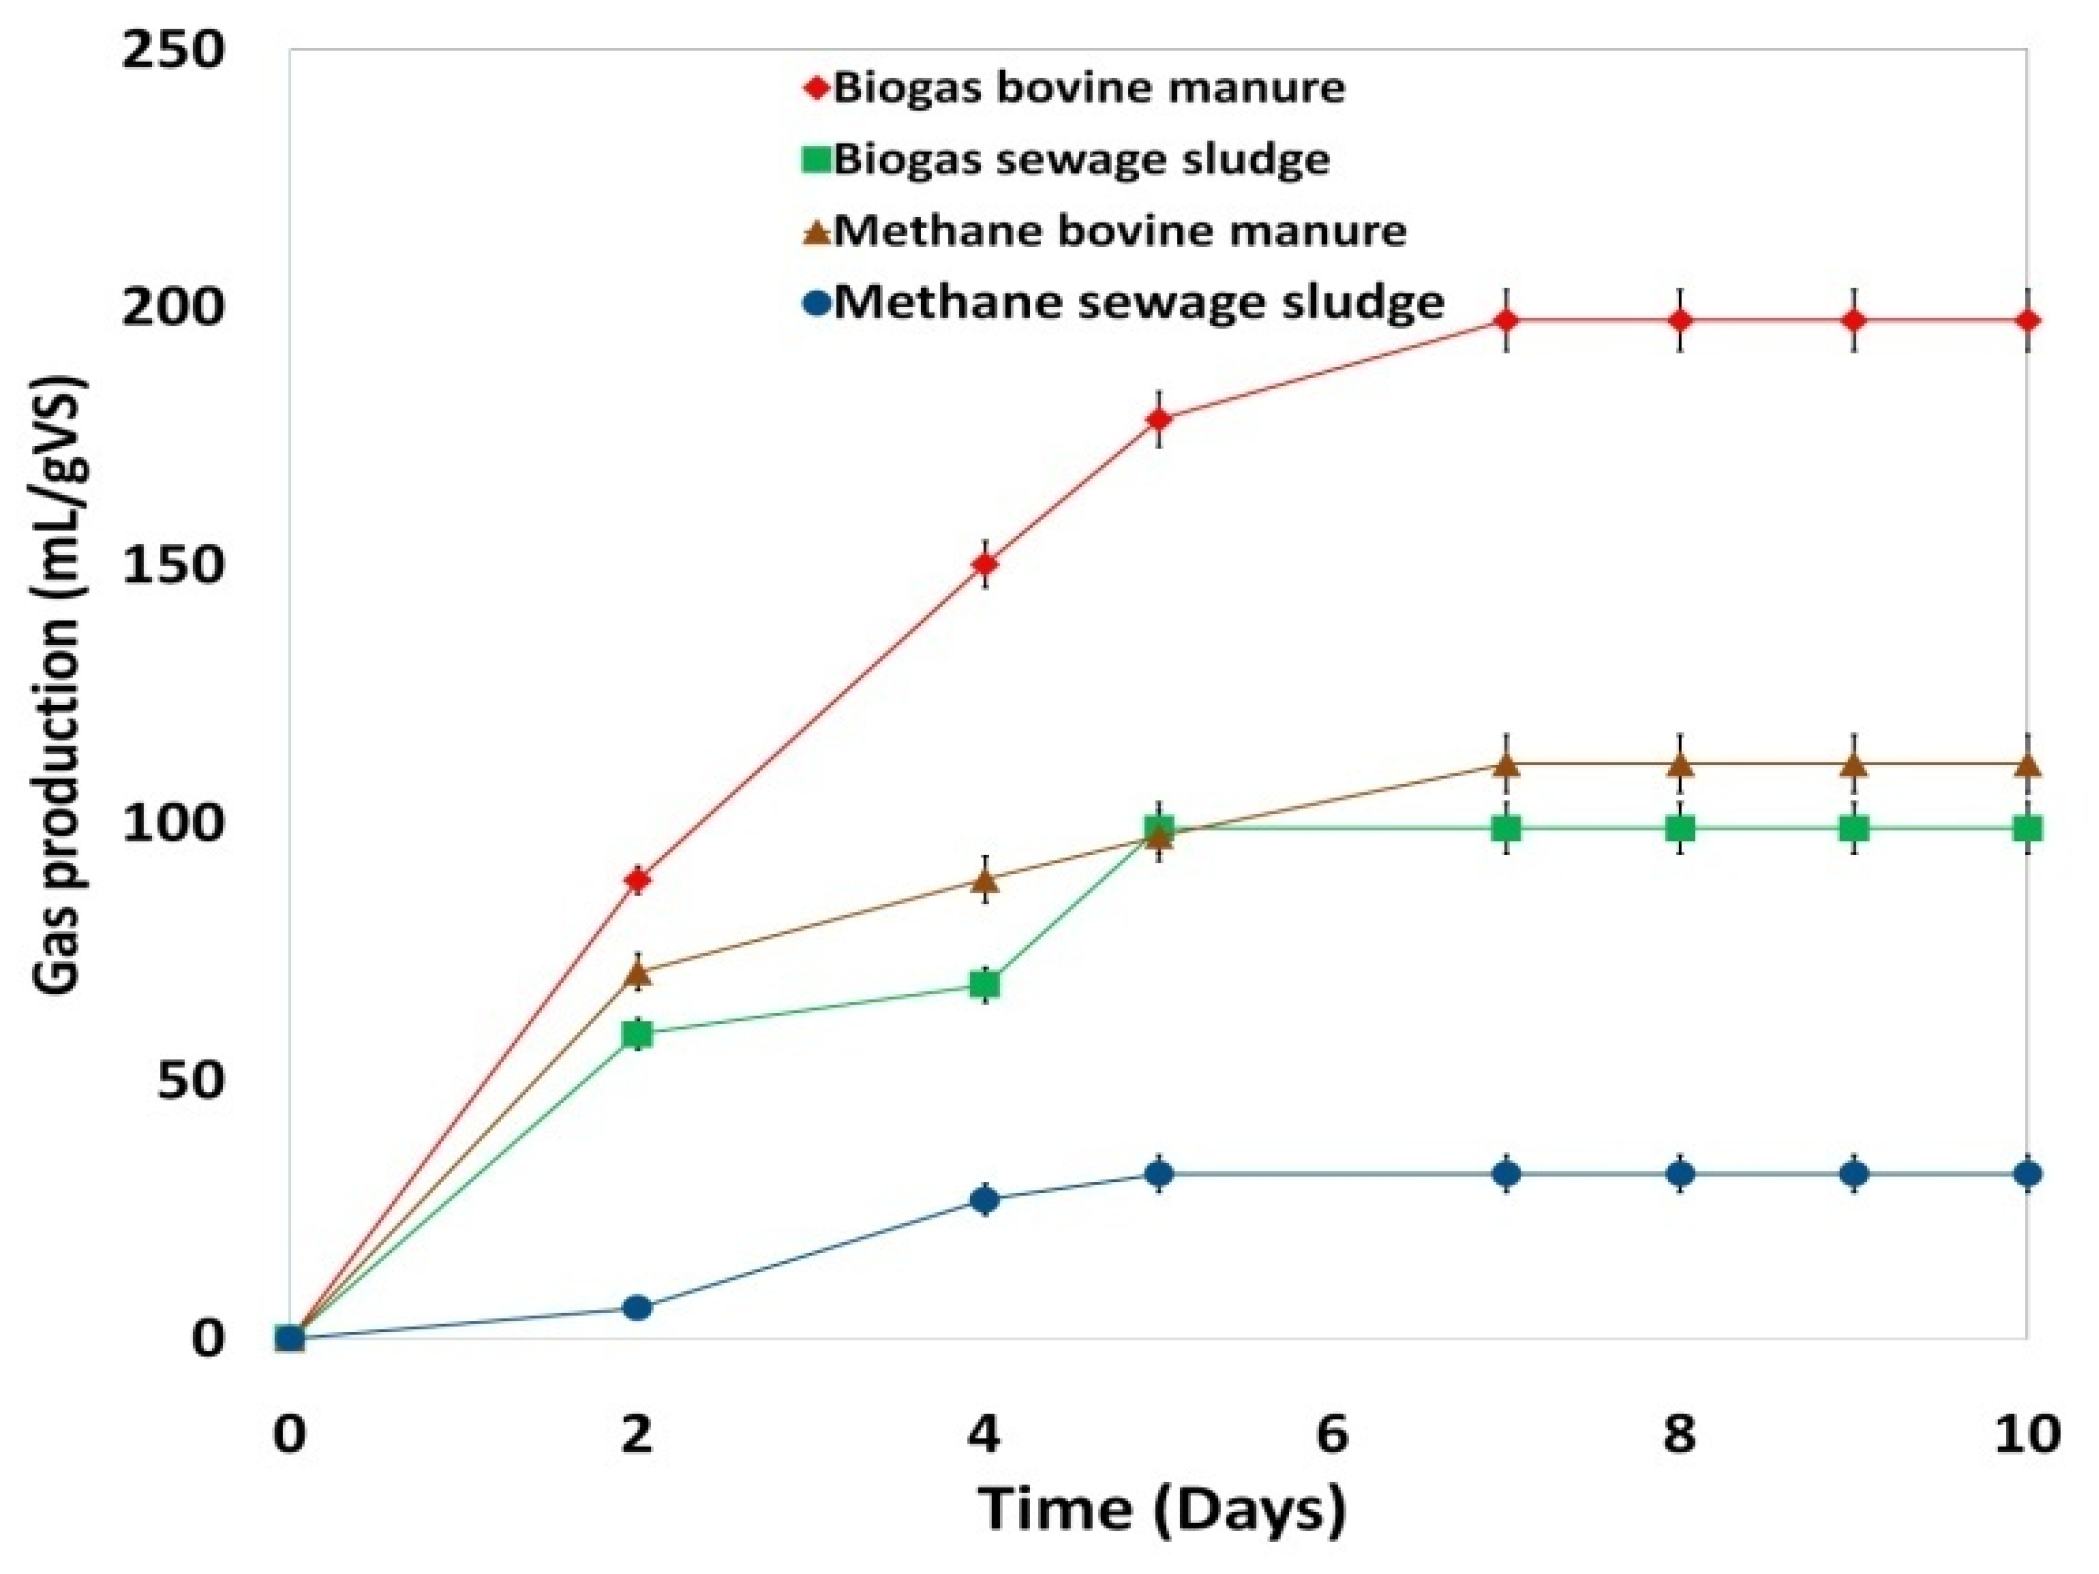
  • First, for bovine manure and sewage sludge, we performed two BMP tests. AD was monitored daily by measuring biogas and methane volume, pH, volatile fatty acids (VFA), and total alkalinity (TA).
  • Then, two BMP tests were performed with treated and untreated WS as substrate and cattle manure as inoculum.
  • We used a ratio VS inoculum/VS substrate = 2.
  • Finally, we performed two BMP tests with filter-treated WS and unfiltered WS under the same conditions as the previous BMP tests, with the filtrate being the liquid residue from the WS pretreatment.
BMP tests were conducted for 10 days. AD was monitored daily by measuring biogas and methane volumes, calculated at standard temperature and pressure (STP) conditions.
Chemical oxygen demand (COD), total solids (TS), volatile solids (VS), volatile fatty acids (VFAs), total alkalinity (TA), and pH were determined according to the Standard Methods of the American Public Health Association (APHA) [29].
Heavy metals are present in municipal sludge in significant concentrations, and the most frequently found are copper (Cu), zinc (Zn), lead (Pb), iron (Fe), and nickel (Ni). Heavy metals are not biodegradable and can accumulate in the substrate to a toxic concentration. If heavy metals are present in excessive quantities, they can cause inhibition of anaerobic microorganisms, hence the interest in determining their concentration.
Before analyzing heavy metals contained in bovine manure and sewage sludge, the samples were mineralized by microwave Milestone ETHOS One Sk-10 High-Pressure Rotor. The equipment was produced in Italy.
Analyses of heavy metals for both bovine manure and sewage sludge were carried out using spectrometry atomic absorption flame 240FS Agilent. This equipment was produced in Malaysia.
The WS morphologies were observed using FEI Quanta 250 Scanning Electron Microscope (SEM). The equipment was produced in Spain.
The contents of hemicellulose, cellulose, and lignin were analyzed according to the method described by Van Soest et al. [30].

2.5. Statistical Analysis

All data were presented as mean ± standard deviation, and all experiments were performed in triplicates. Statistical analysis was conducted using a one-way analysis of variance (ANOVA), and the pairwise differences were evaluated using Tukey’s range test to identify significant differences between each sample group [31]. The difference between the results was considered significant if the p -value was less than 0.05.
ANOVA was carried out with a confidence level of 95%. Error bars in Figures 4–7 and Figures 10–12 represent standard deviations σ of triplicate measurements.
In this analysis, we used the unbiased variance estimator, defined as:
σ 2 = 1 N 1 i = 1 N ( x i m ) 2  
where x i and m represent, respectively, the i th sample and an estimate of the mean of x i ( i = 1   to   N ) with N the size of the samples analyzed:
m = 1 N i = 1 N x i  

3. Results and Discussions

This section describes in detail the effects of heavy metals in the AD inocula and then quantifies the effects of the different pretreatments on methane production. This section concludes with considerations on the ultrasonic pretreatment with a focus on the energy provided.

3.1. Effect of Heavy Metals Present in the Considered Inocula on Anaerobic Digestion

Firstly, heavy metal concentrations were determined in the inocula. Table 2 shows the observed metals’ concentrations in bovine manure (BM) and sewage sludge (SS), compared to those required for AD microorganisms.
It appears in Table 2 that for the sewage sludge, Cu and Zn values (72.50 and 491.24 mg/kg, respectively) exceed the necessary concentrations for the growth of the methanogenic microorganisms. Methanogens are a key group in AD because when methanogenic activity is inhibited, the process is blocked at the acidogenesis step leading to incomplete degradation of the organic matter and accumulation of VFAs [9]. In addition, heavy metal toxicity is one of the main causes of bioreactor problems leading to significant AD inhibition [37,38,39]. Many essential metals (e.g., Cu and Zn) are required for the activation or functioning of many enzymes and coenzymes in AD. Heavy metals are not biodegradable, but they can accumulate in the substrate in a toxic concentration amount. Otherwise, excessive amounts of heavy metals can lead to the inhibition of anaerobic microorganisms [40,41].
Secondly, to identify if there is any inhibition caused by these metals, two ADs were carried out with bovine manure and sewage sludge, during which biogas, methane, pH, VFAs, and TA were measured. The results are given in Figure 3 and Figure 4.
The pH is one of the most significant parameters for the stability of AD, which could affect the activity of acidogenic and methanogenic microorganisms [42].
For both inocula, Figure 3a shows that during the first step of the AD process (first to fourth day), pH decreases from 8.4 to 6.5 and 7.9 to 6.3, respectively, for BM and SS. This is due to the increased production of VFAs from 1.6 to 3.4 g/L and 1.9 to 6.7 g/L, respectively, for BM and SS (Figure 3b). This result is in agreement with those obtained by Nandi et al. [42] and Mota et al. [43].
Indeed, at the beginning of the process (hydrolysis step), the extracellular enzymes, which are produced by hydrolytic microbes, decompose complex organic polymers into simple soluble monomers. Proteins, lipids, and carbohydrates are hydrolyzed to amino acids, long-chain fatty acids, and sugars, respectively. These small molecules are then converted by acetogenic bacteria to a mixture of VFAs and other minor products such as alcohol [44]. The main VFAs present during the AD process are acetic, butyric, and propionic acids, which are commonly accumulated during the start-up period in the AD [45]. In the second step of AD (fifth to sixth day), we observed an increase in pH value to 7.3 for BM and 6.9 for SS and diminution of VFAs to 0.8 for BM and 1.8 g/L for SS. This complies with the results obtained by Blasco et al. [46]. This is explained by increasing the pH value and the consumption of the VFAs by bacteria [47]. During this step, the acetogenic bacteria convert the VFAs to acetate, carbon dioxide, and hydrogen. These provide direct substrates for methanogenesis which correspond to the last step for the AD process for methane production. Finally, during the third step (7th–10th) of the AD process, we noted a pH value stabilization around 8 and 7, respectively, for BM and SS. The equilibrium values of VFAs were about 0.65 and 1.75 CH3COOH g/Lfor BM and SS. These results are in agreement with those observed by Rinco et al. [47].
Compared to bovine manure, sewage sludge showed a lower pH value and more significant VFAs production. As theVFAs production in the hydrolysis step occurs at a faster rate than their assimilation in acetogenesis or methanogenesis step, the methanogenic activity of microorganisms is inhibited [18,40]. Of all microorganisms in the overall consortium for the anaerobic conversion of organic matter to methane, Archaea is commonly considered as the most sensitive to toxicity [48].
As it can be seen in Figure 3c, the TA variation is inversely proportional to pH. The first step of AD (first to fourth day) is characterized by an increase in the TA values (expressed in CaCO3 concentration) from 16.8 to 23.5 g/L and 17.5 to 32.6 g/L, respectively, for BM and SS. In addition, for BM and SS, pH decreases to restore the alkalinity conditions which lead to the outbreak of the methanogenesis step [49]. During the methanogenesis step (fifth to sixth day), the TA value decreases to 13.9 g/L for BM and 19.2 g/L for SS. Alkalinity is known to be a critical buffering factor for neutralizing VFAs during methanogenesis by VFAs consumption [42].
In the third step (7th–10th), the TA stabilization occurred and final values were around 13.6 g/L and 18.8 g/L for BM and SS, respectively, indicating that the AD process already reached stability. These results confirm those observed by Komemoto et al. [50].
Table 3 indicates that bovine manure produces 56% methane, and sewage sludge produces only 32%. Based on the results obtained above that showed significant inhibition of AD due to the high concentration of Cu and Zn in sewage sludge, we maintained bovine manure as inoculum for the rest of the study.

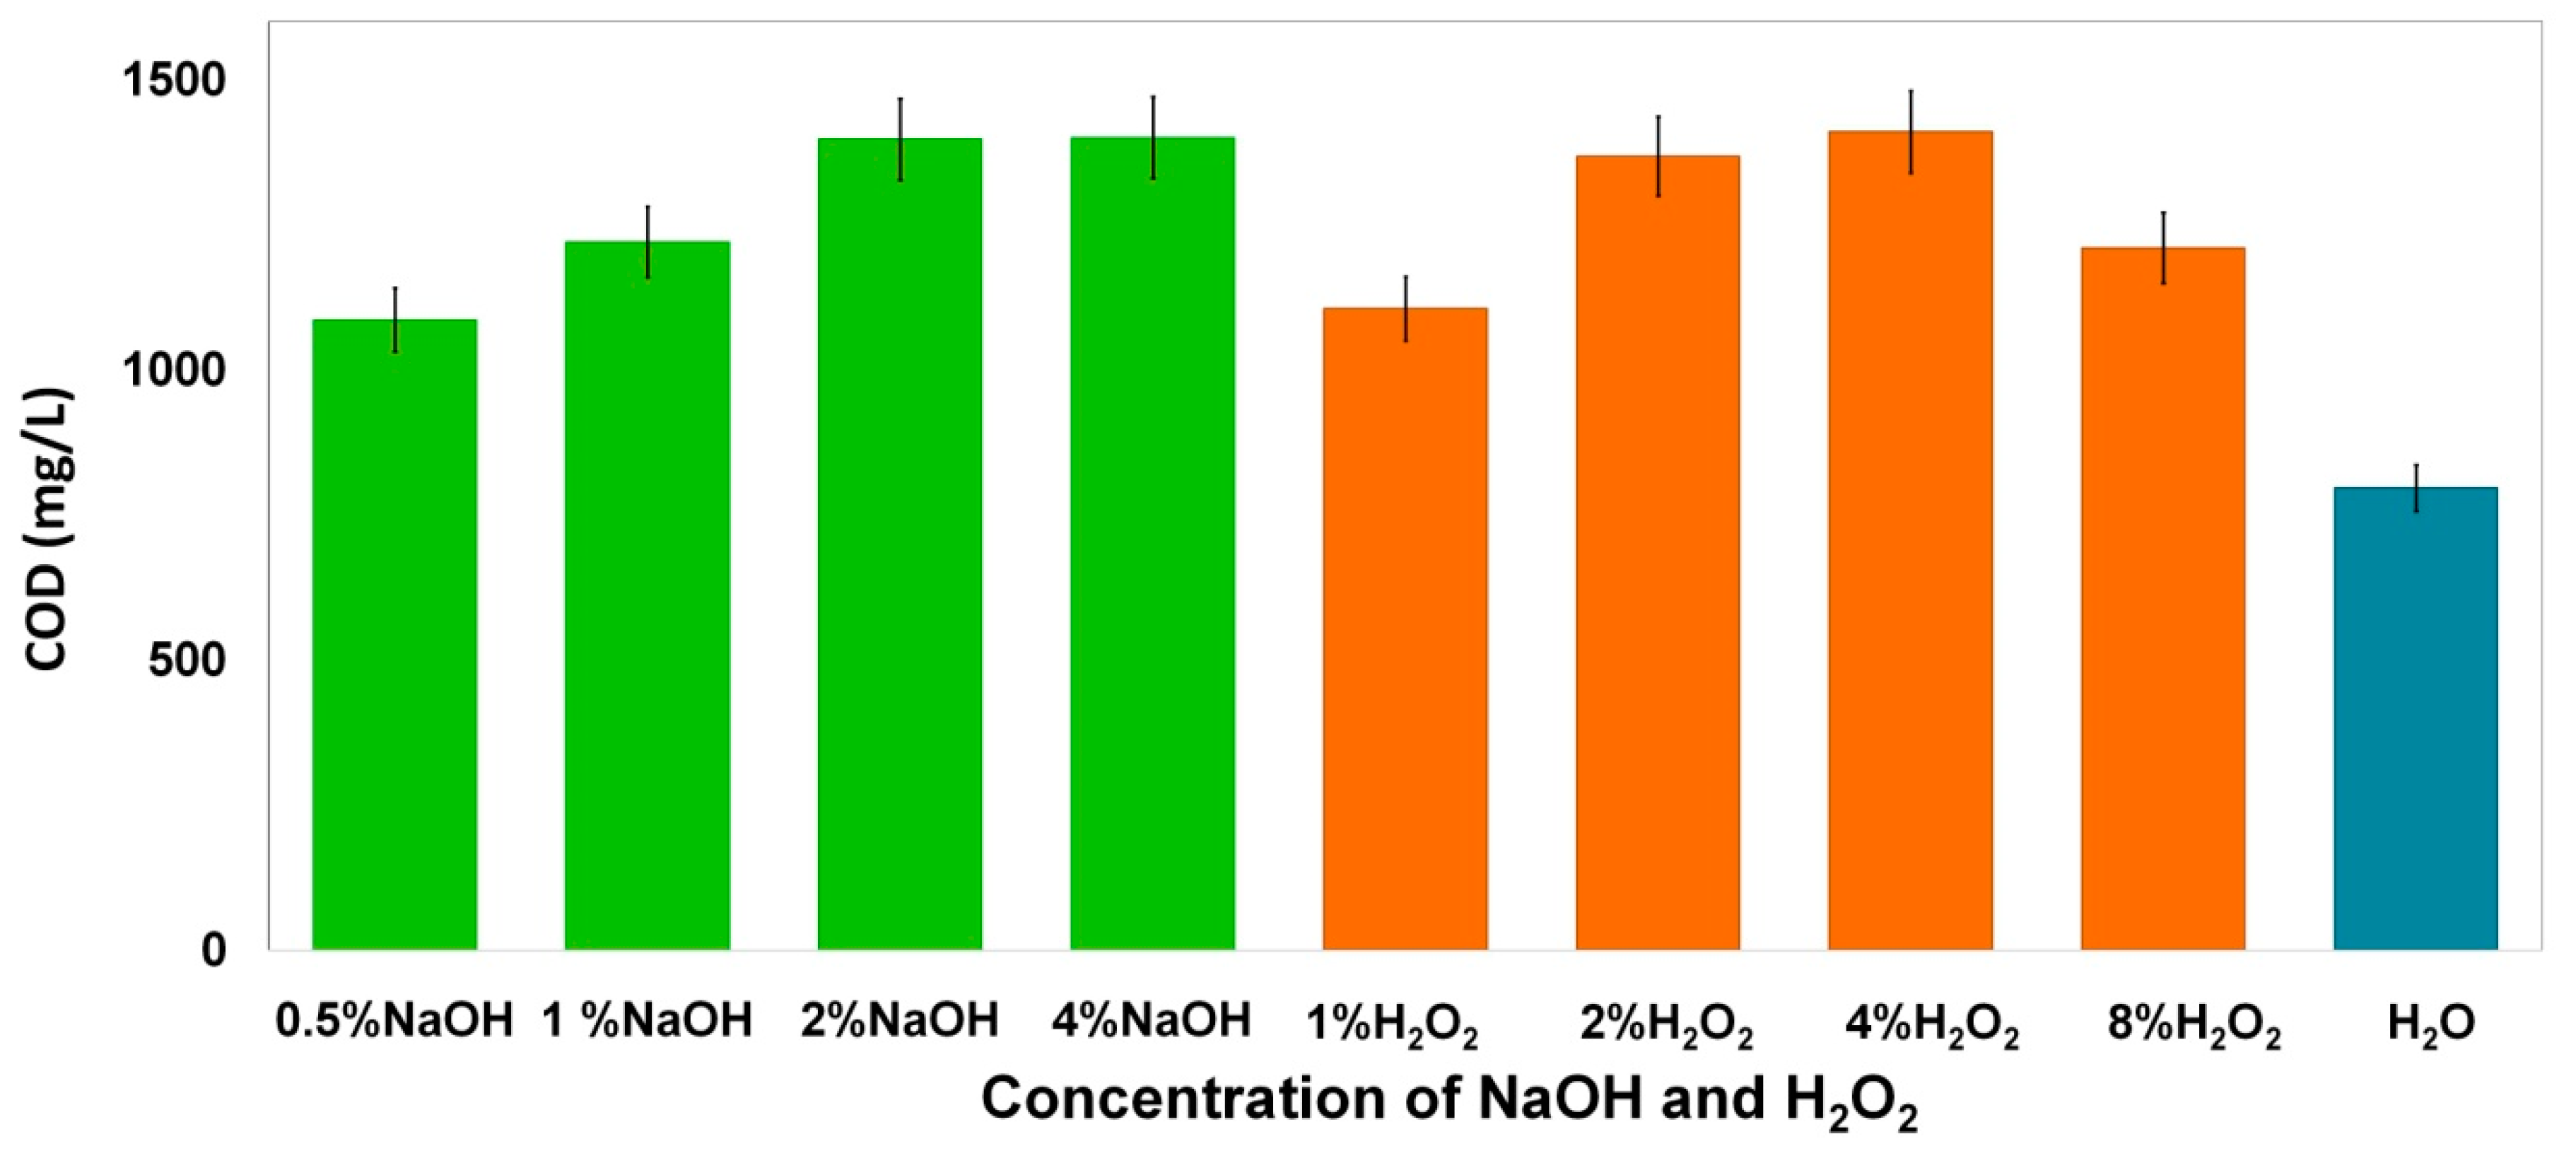
3.2. Effect of NaOH and H2O2 Concentration on WS Pretreatment

In order to evaluate the effect of WS pretreatment on the AD, NaOH (0.5, 1, 2, 4% w/w) and H2O2 (1, 2, 4, 8% w/w) solutions were tested. According to the solution concentration, results illustrated in Figure 5 show that, compared to WS hydrolysis with water, the pretreatments with NaOH and H2O2 improve the amount of dissolved organic matter. However, it seems that a 4% H2O2 solution corresponds to the optimal value which leads to 1410 mg/L of COD. However, higher H2O2 concentrations influence negatively the decomposition process. H2O2 pretreatment of lignocellulosic biomass breaks down lignin and hemicellulose and releases a cellulose fraction with high degradability to the anaerobic microorganisms [48]. Otherwise, H2O2 has a significant advantage because it avoids toxic residues in the biomass and it degrades into oxygen and water [20]. Even NaOH pretreatment can degrade the carbohydrates, cellulose, and hemicelluloses improving the biomass digestibility, and it generates Na as residue that can be toxic for methanogenic microorganisms [7,21].

3.3. Effect of Coupling US with NaOH and H2O2 Pretreatment

US pretreatment employs ultrasonic radiation to break down the complex network of polymerization in biomass. Cavitations produced due to the pulsating high-frequency ultrasonic waves penetrate polysaccharides and disrupt the mesh of cross-linking polymers facilitating better biodegradation [19]. The pretreatment results of the coupling 30 min of the US with NaOH and H2O2 are illustrated in Figure 6.
Compared to the chemical pretreatment solely, for low concentrations of NaOH and H2O2, the exposition of the substrate to the US significantly increases its decomposition. Indeed the US has various effects on the organic matter such as mechanical effects and creation of free radicals with very high oxidant capacity. The attack of the WS lignocellulose by hydrogen peroxide seems better than that with sodium hydroxide. However, for strong concentrations of both NaOH and H2O2, the US decreases this decomposition because the solubilized organic matter is mineralized by hydroxyl radicals produced. US pretreatment augments the oxidative power of H2O2 [11].
Thus, a mass concentration of 4% w/w of H2O2 seems the optimal value with a COD value of 2200 mg/L. The delignification of WS with a low concentration of H2O24% w/w was promoted due to the production of the HOO anion, which in turn promoted the production of hydroxyl (OH) and superoxide (O2) radicals. Similarly, the promotion of radicals with ultrasound enhanced solubilized lignin degradation [5,19].

3.4. Effect of Reaction Time for H2O2 Coupled with US Pretreatment

Figure 7 depicts the effect of the reaction time according to released COD under the optimal conditions previously determined as 4%w/w H2O2 coupled with the US while varying the treatment time from 5 to 45 min.
The obtained results show that the solubilized organic matter of the substrate depends on the pretreatment time. The optimal COD value of 2675 mg/L was reached after 10 min of pretreatment, which implies that the discharges imposed on the substrate are powerful and rapidly degrade the lignocellulosic biomass. Beyond 10 min, the COD value decreased and reached 1829 mg/L after 45 min. This result could be explained by the degradation of the COD solubilized by the hydroxyl radicals present in the solution [12].

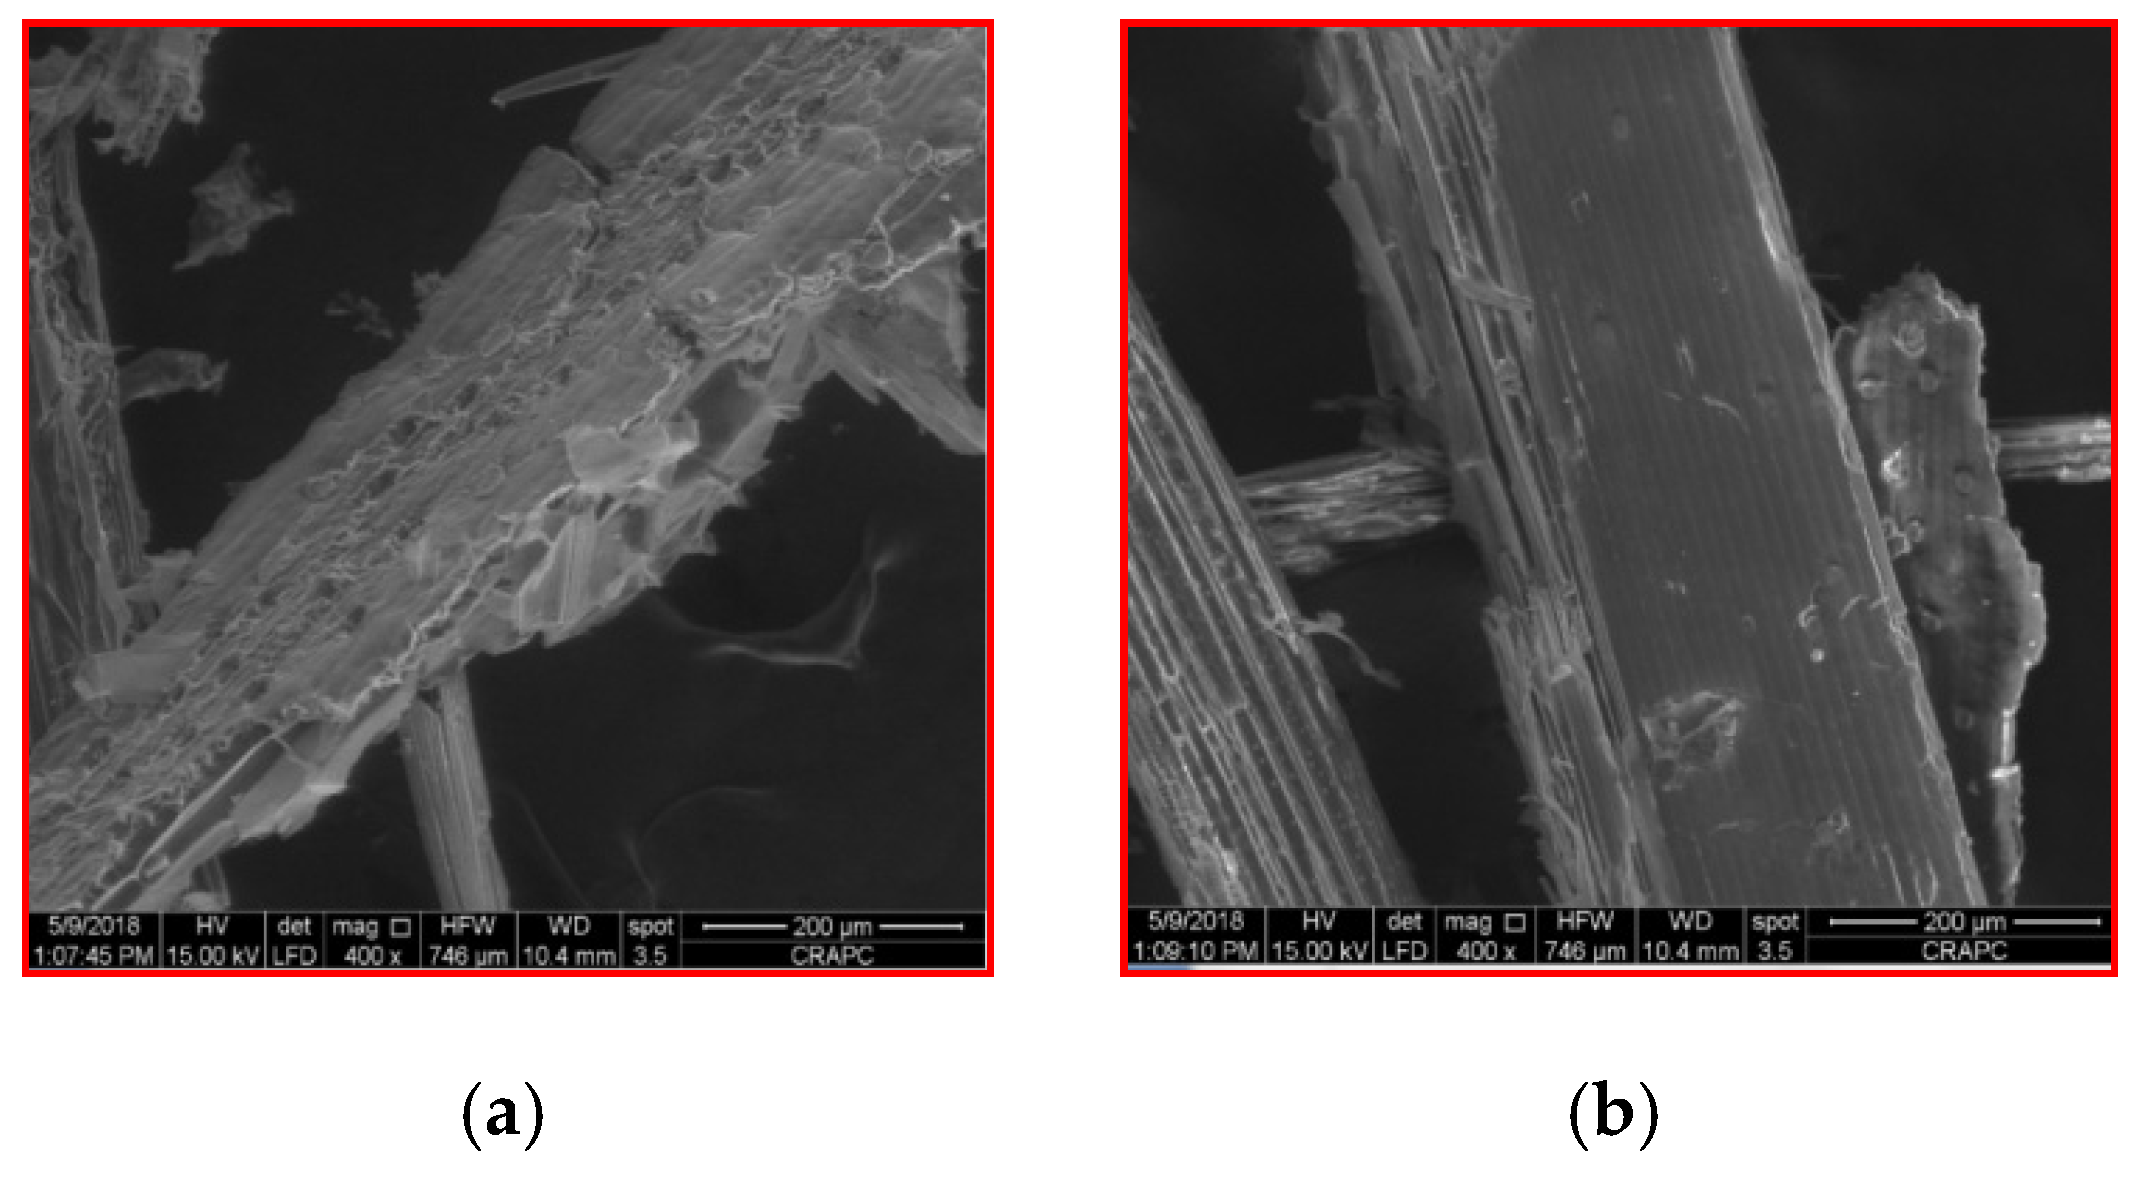
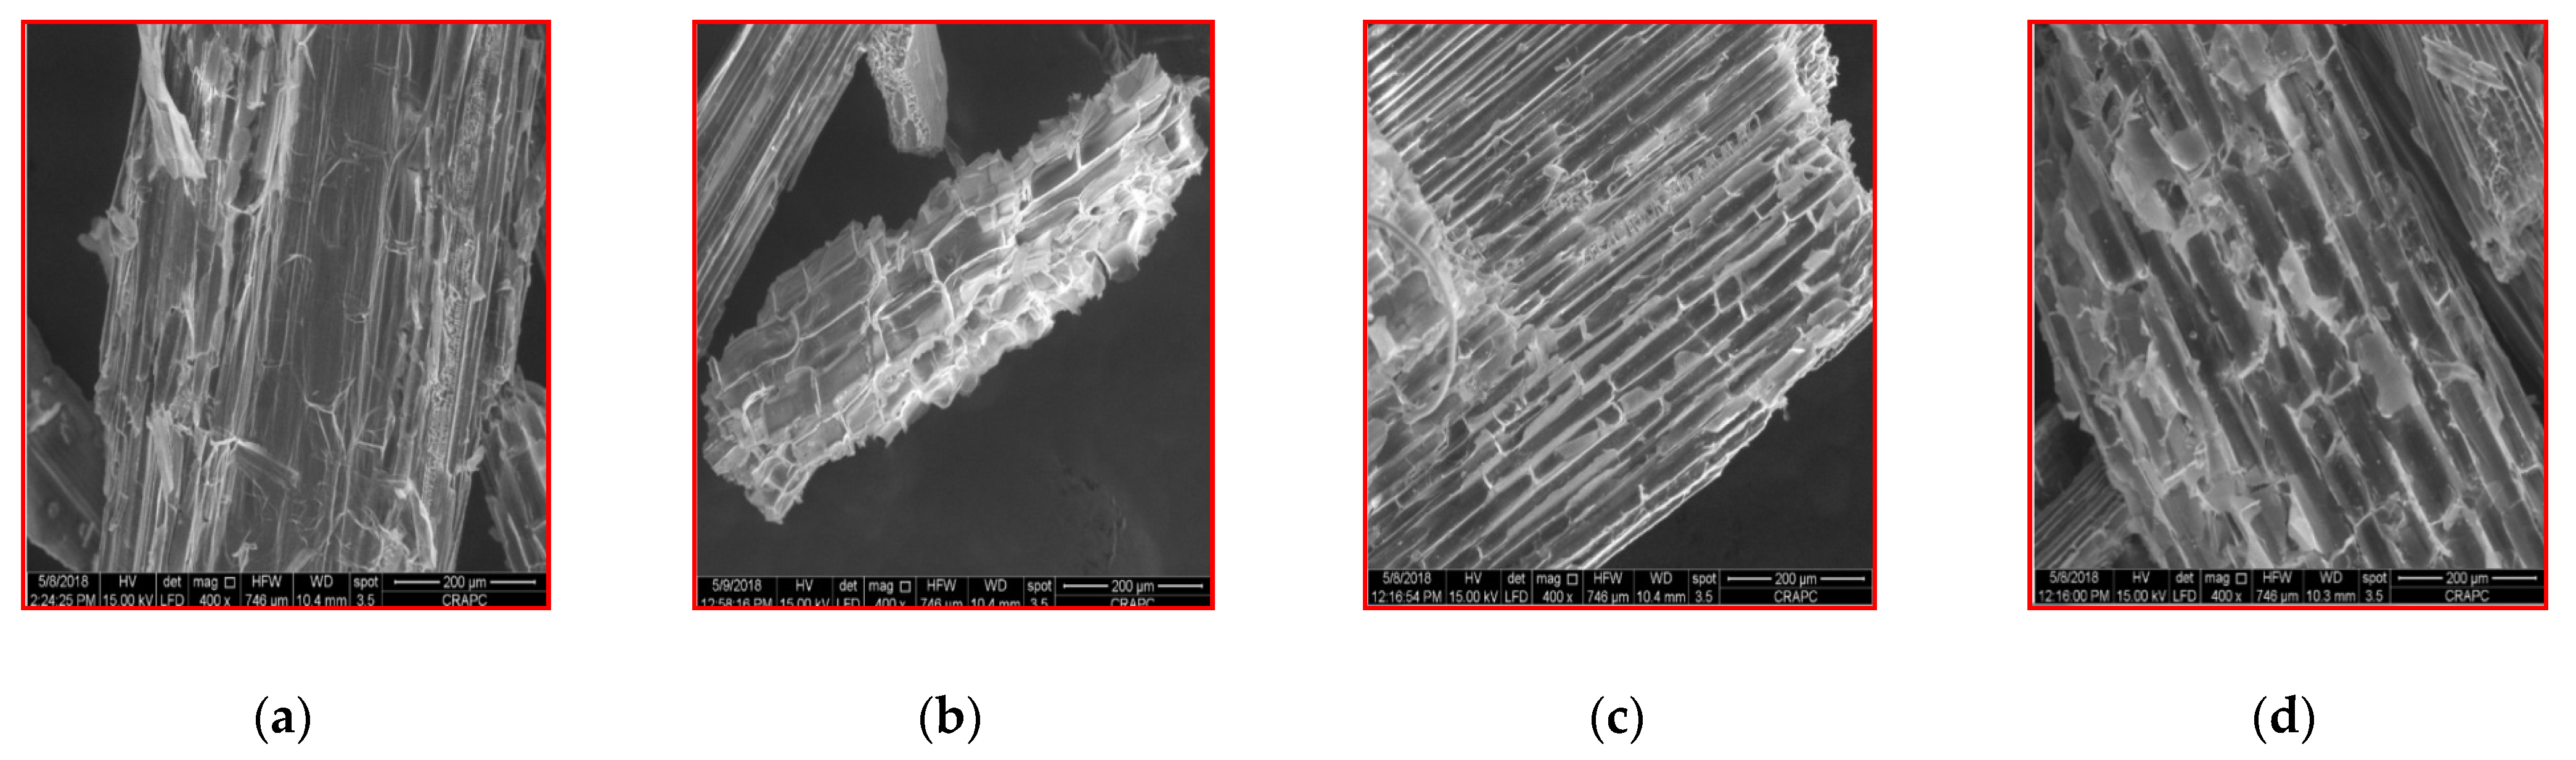
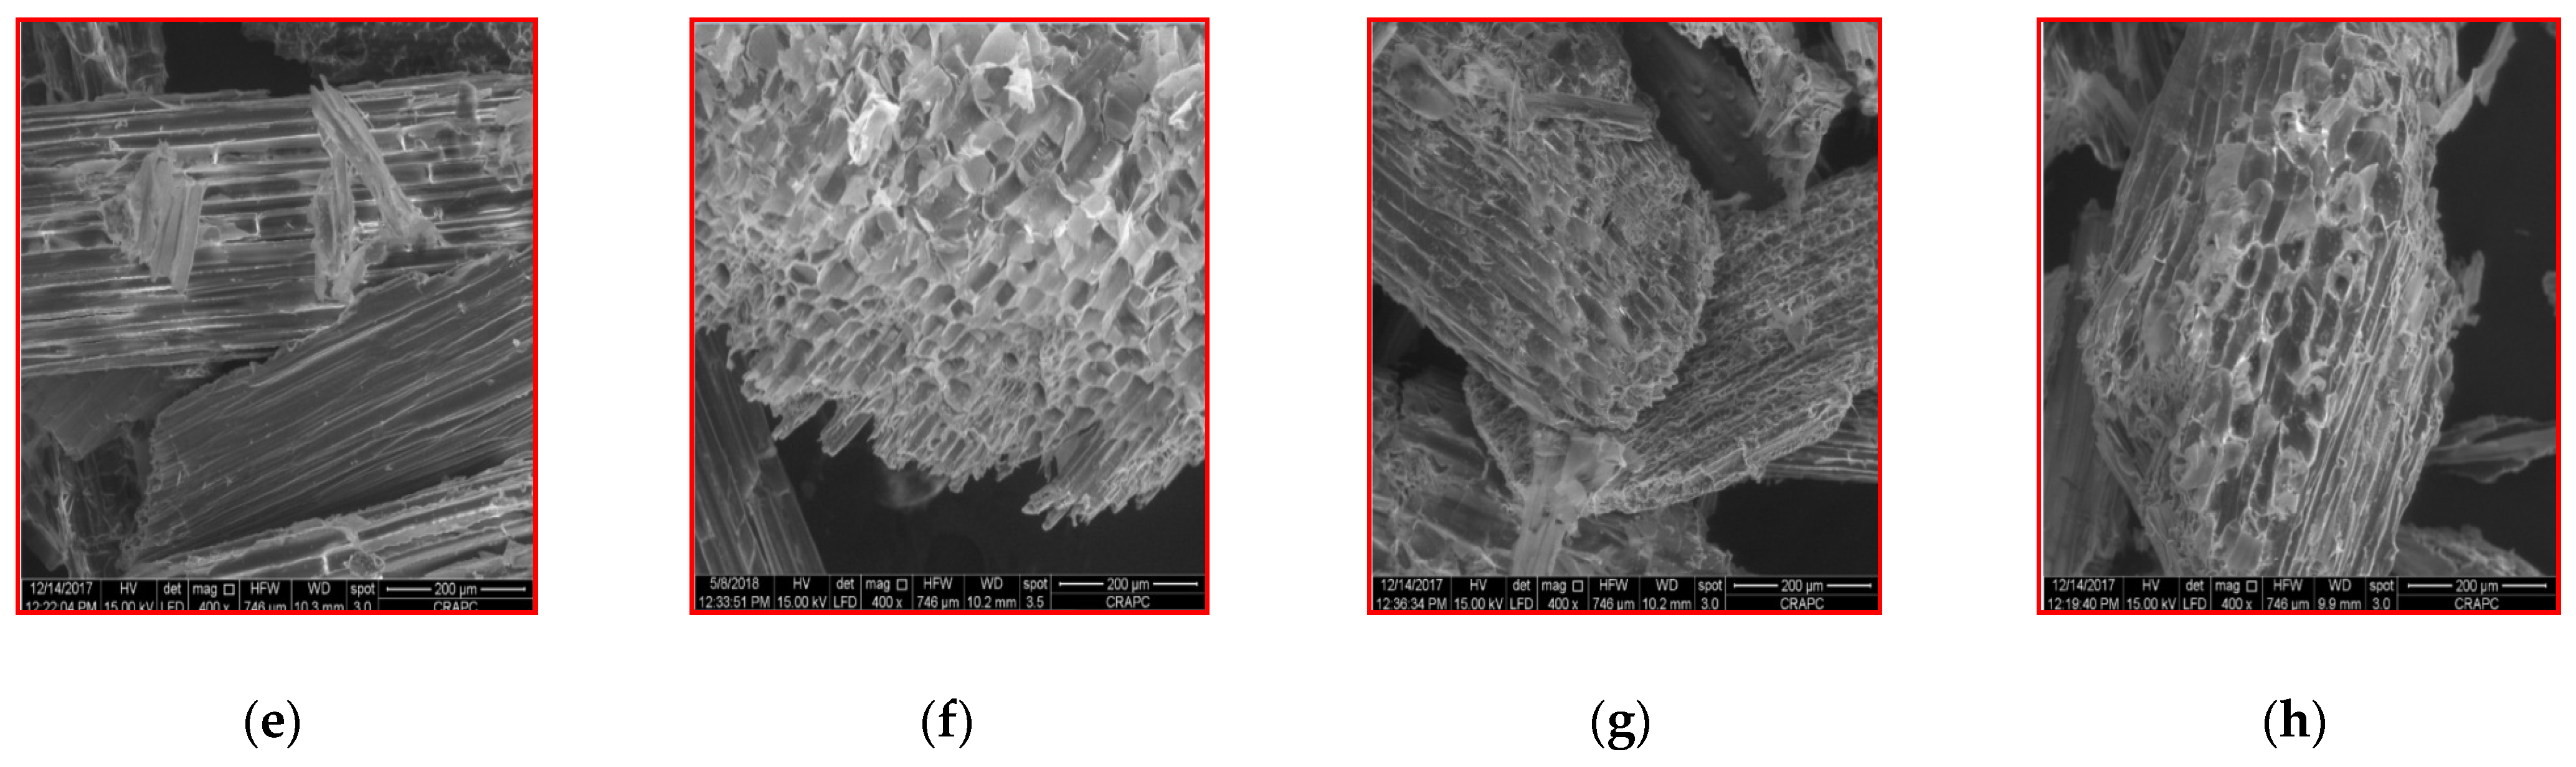
3.5. Scanning Electron Microscope (SEM) Observations

To observe the structural changes of WS after the pretreatments, SEM analysis was conducted. The morphological features of raw WS (Figure 8a) showed a regular and compact surface structure with fibers arranged in bundles. After both NaOH and H2O2 pretreatments coupled with ultrasound (Figure 9), the surface of the WS samples, which is mainly composed of lignin and hemicellulose, was destroyed. The lignin and hemicellulose of pretreated WS samples were partially removed and broken, resulting in the exposure of internal structures. After that, WS became loose and scattered and exhibited fiber porosity on its surface compared to the raw WS. These observed results demonstrate that pretreatment could destroy the cellulose, hemicellulose, and lignin network, removing some of the external fibers and thereby accelerating the biodegradation process [20,49]. The hydrolysis with the only H2O coupled with the US (Figure 8b) caused minimal changes on the surface of the WS samples. The surface was relatively smooth and showed minimal destruction compared to that using both NaOH and H2O2 pretreatments coupled with the US. The WS structures of samples after both NaOH and H2O2 pretreatments coupled with the US were destroyed indicating the efficiency of these pretreatments. However, despite the efficiency of NaOH pretreatment coupled with the US, this pretreatment generates residues that can probably oxidize the desirable structures such as sugars, VFAs, and alcohols that inhibit the AD process [42].

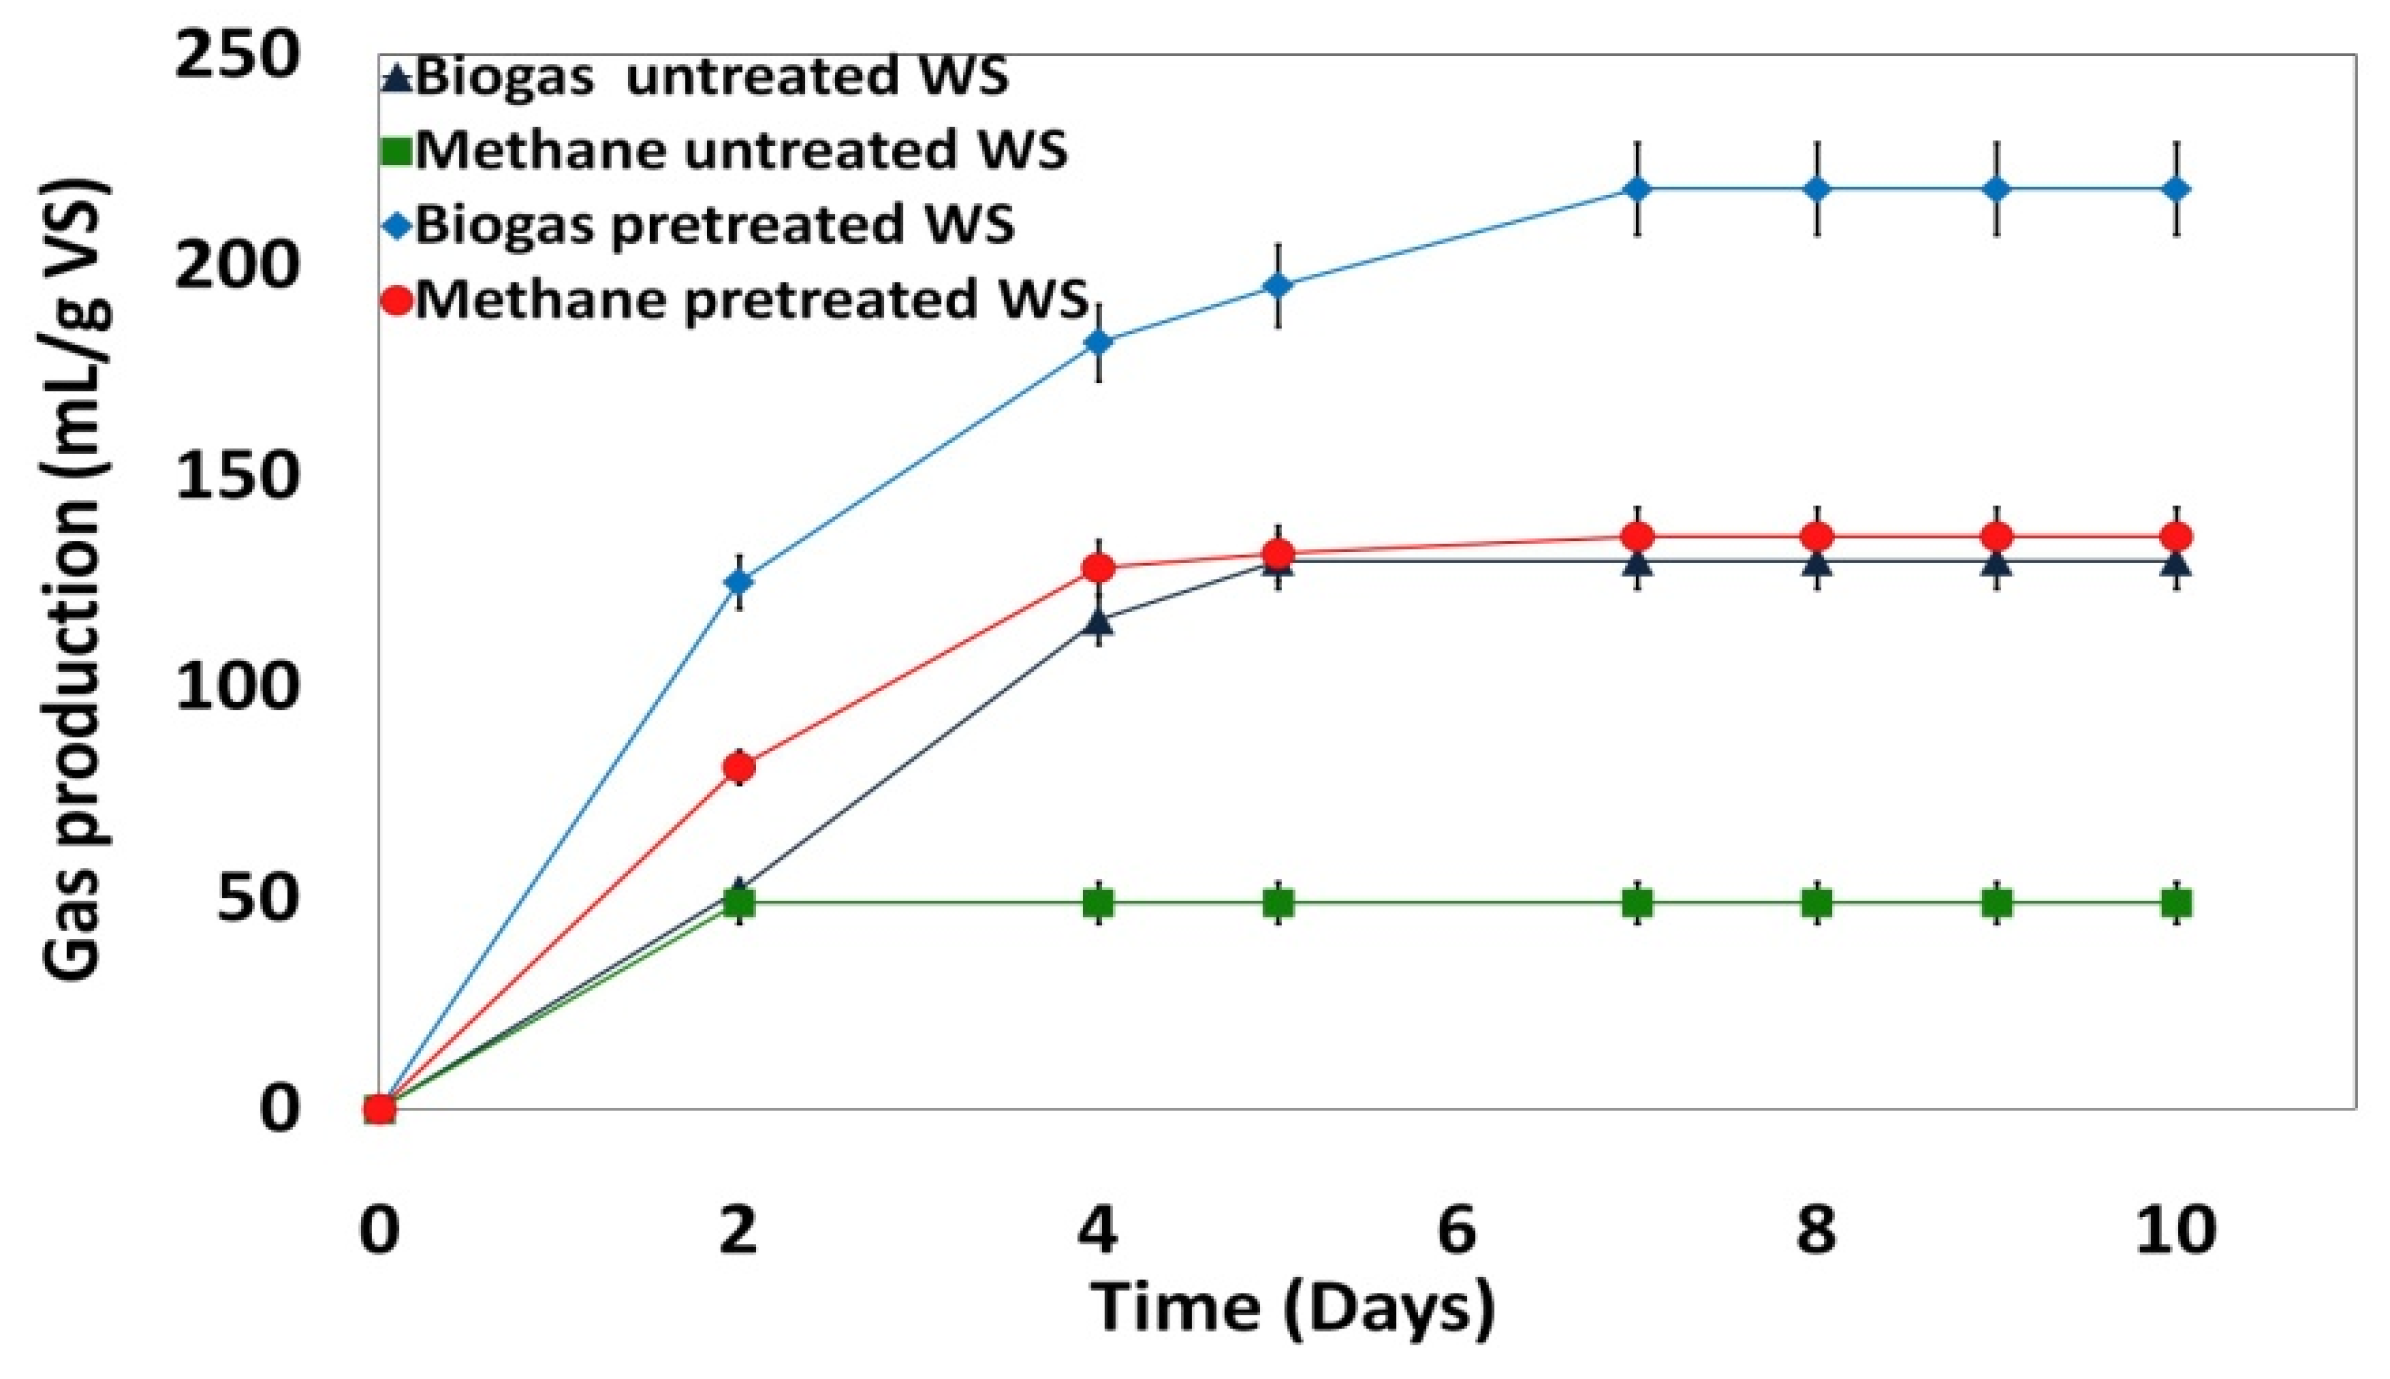
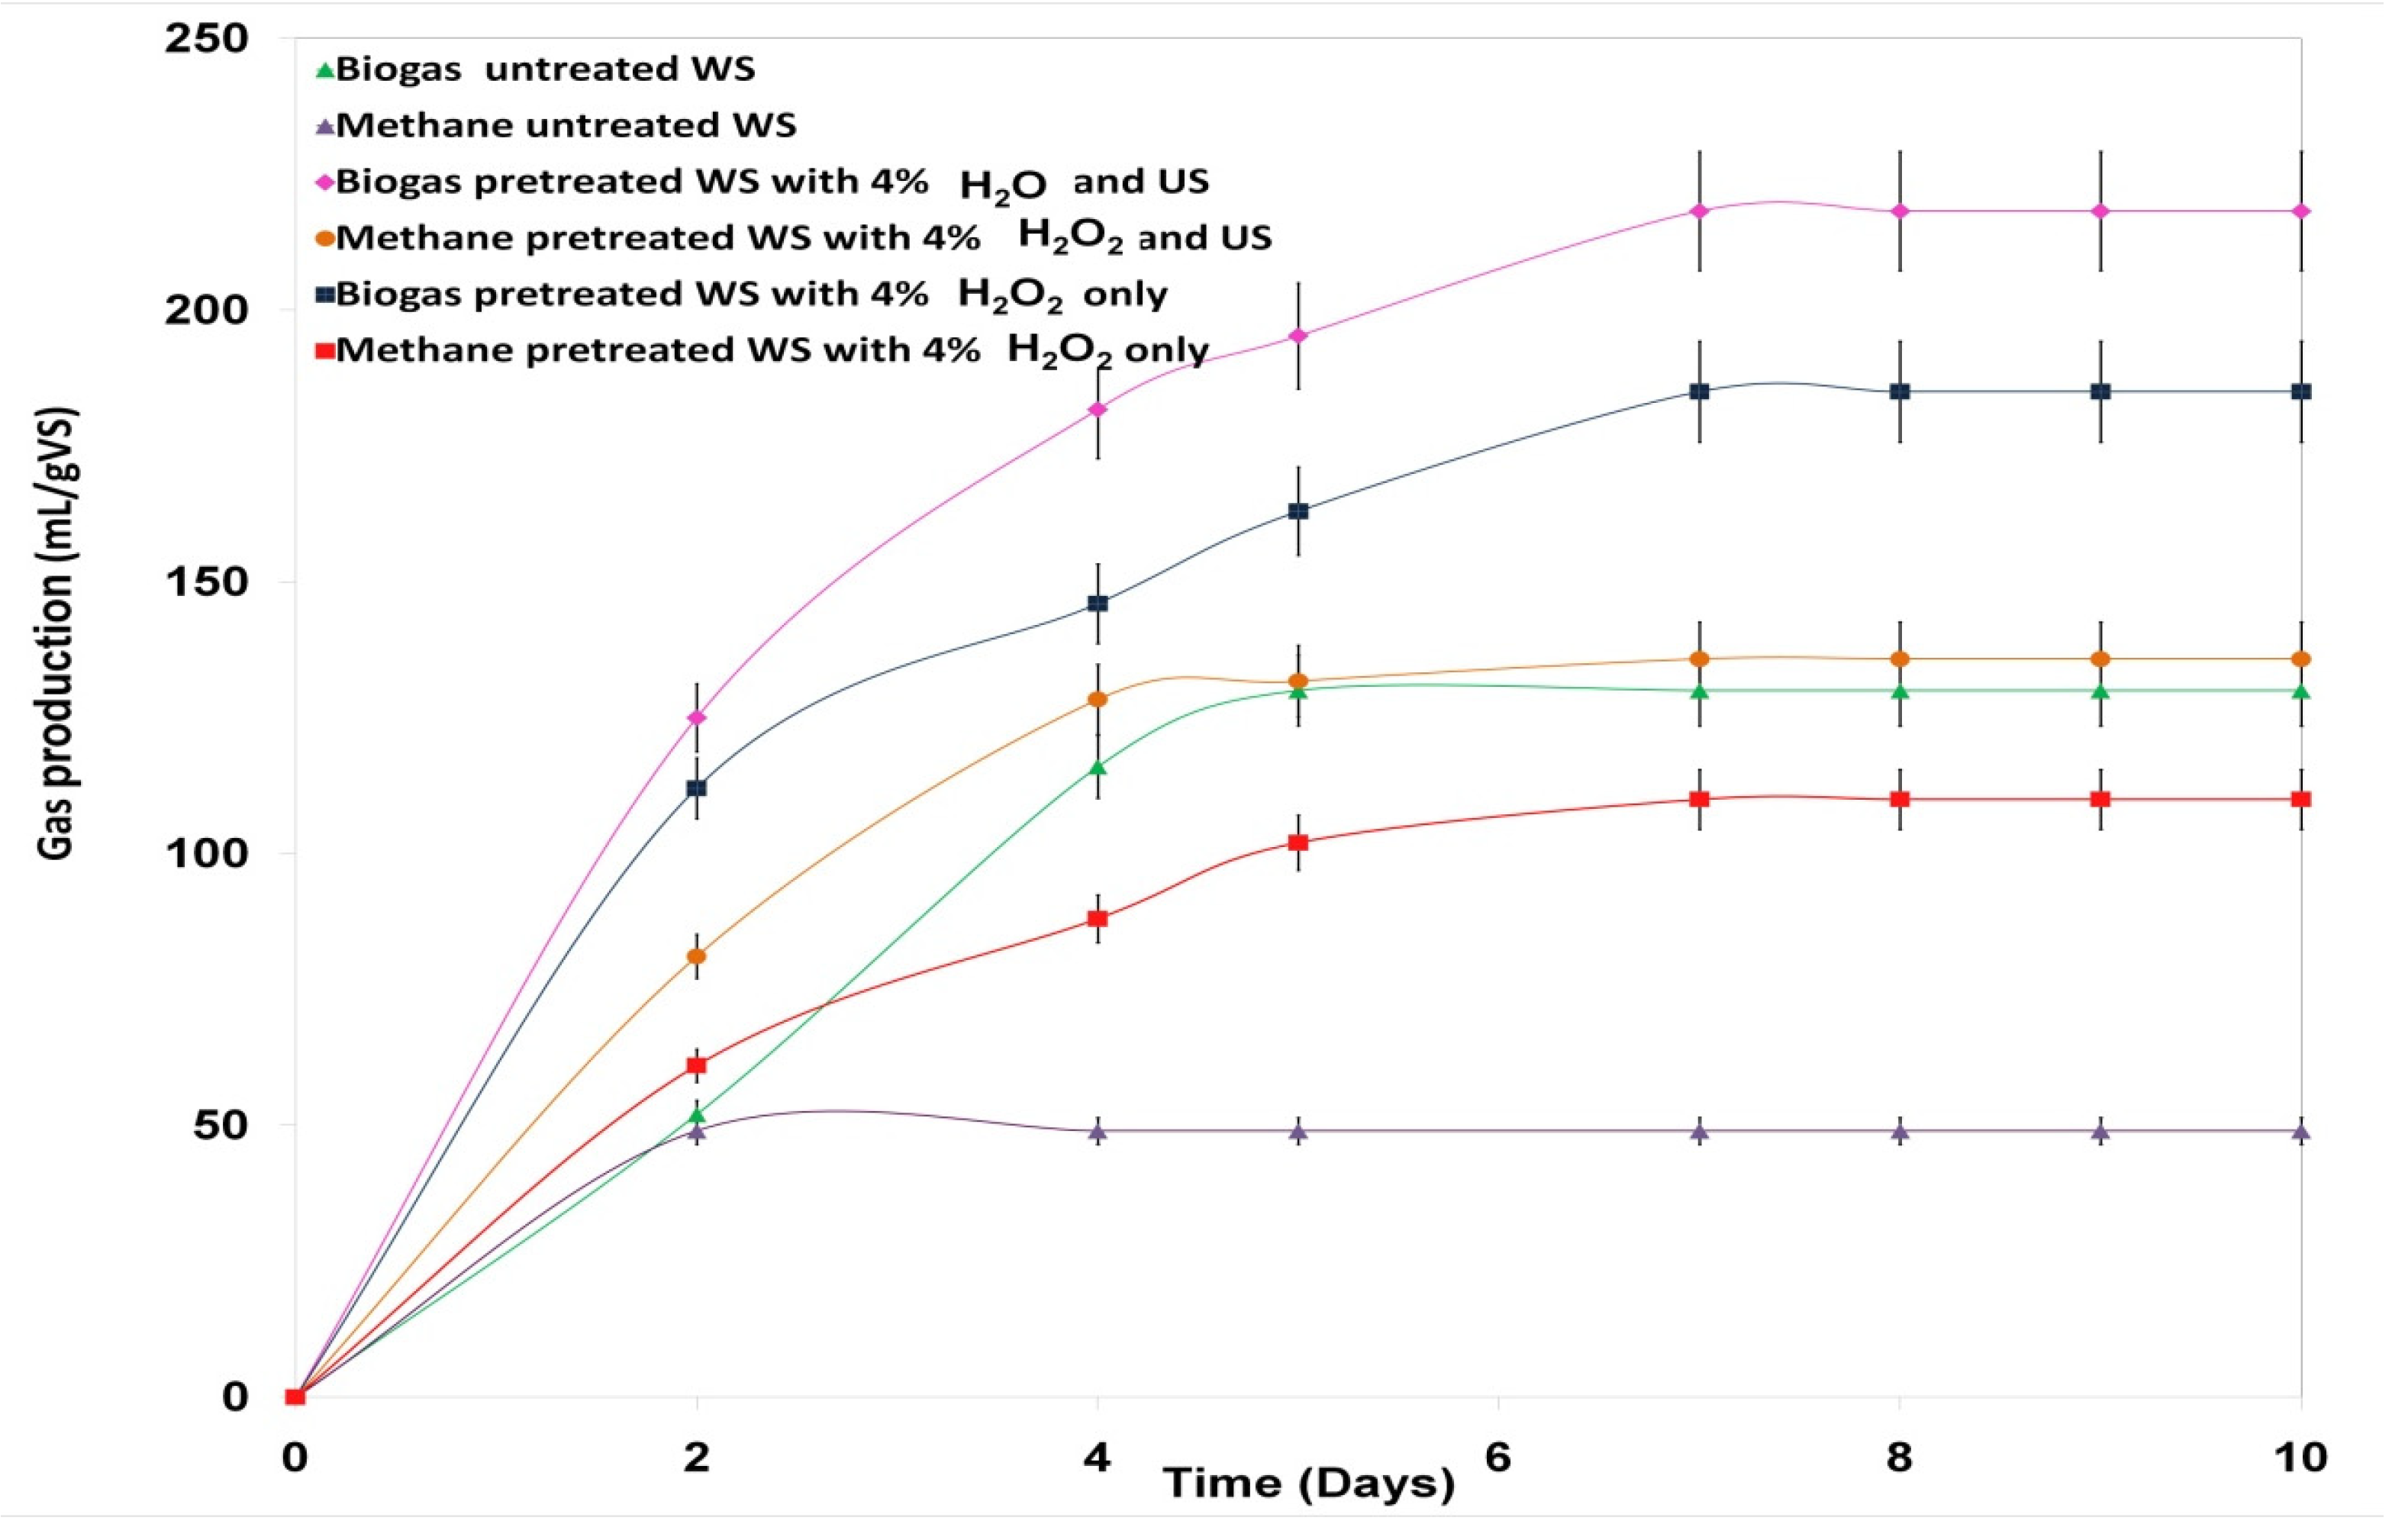
3.6. Impact of H2O2 Pretreatment Coupled with the US on Biogas Production

To determine the influence of coupling H2O2 to the US pretreatment on biogas and methane production, we carried out two AD experiments: an experiment with treated WS under the optimal conditions determined previously (4% w/w H2O2 and 10 min of US) and another with raw WS. The results are presented in Figure 10 and Table 4 and Table 5.
The US mechanically disrupts the cell structure of WS and promotes the release of free radicals such as OH, HO2, and H [20,21]. As hydrogen peroxide is a strong oxidant, it degrades lignin to soluble compounds with low molecular weights. As these are more accessible to the anaerobic microorganisms, the biogas and the biomethane production is improved [48].
During the first step of AD (first to fourth day), Figure 10 shows that for both treated and untreated WS, the volume of biogas and methane produced increases. This corresponds to the beginning of the AD process (hydrolysis phase) during which large polymer molecules are broken down into simple soluble monomers. Proteins, lipids, and carbohydrates are hydrolyzed to amino acids, long-chain fatty acids, and sugars. As lignin is a hydrophobic heteropolymer in nature, it degrades very slowly and most of its degradation remains incomplete. This phase is followed by acetogenesis during which different monomers (sugar, long-chain fatty acids, and glycerol) are converted into alcohols and short-chain fatty acids by the acidogenic microorganism. Throughout this period, alcohol and short chains of fatty acids are converted into acetate, carbon dioxide, and hydrogen. After that, the produced acetate is used as a substrate by methanogenic bacteria for methane production during the methanogenesis phase. The last step (fifth to sixth day) shows the stabilization of biogas production and the end of the methane production.
The accumulation of hydrogen develops significant pressure which blocks the activity of acetogenic bacteria that stop acetate production. Due to the symbiotic relation between acetogenic and methanogenic bacteria, these utilize this hydrogen in methane production and significant hydrogen pressure does not occur [42,49].
Consequently of what was explained above and compared to the untreated WS, Table 2 indicates that pretreated WS produces more biogas and biomethane than untreated WS. This corresponds to an improvement of 40% and 64%, respectively, for biogas and methane production. In addition, it appears that treated WS produces more methane, 62%, than untreated one, 37%. It appears that the treatment of WS accelerates the hydrolysis rate which depends on the nature of the substrate and the size of a substrate particle [51]. Indeed, WS pretreatment with 4% w/w H2O2 coupled with 10 min of US allowed releasing the organic matter contained in the biomass to make it accessible to microorganisms. This leads to the performance improvement of AD and the increase in methane production yield [7]. Otherwise, untreated WS inhibits the AD process due to its high content of lignocellulosic material which makes it resistant to microbial attack [7,43]. In addition, the degradation of hemicellulose, cellulose, and lignin reaches 55, 38, and 16%, respectively.

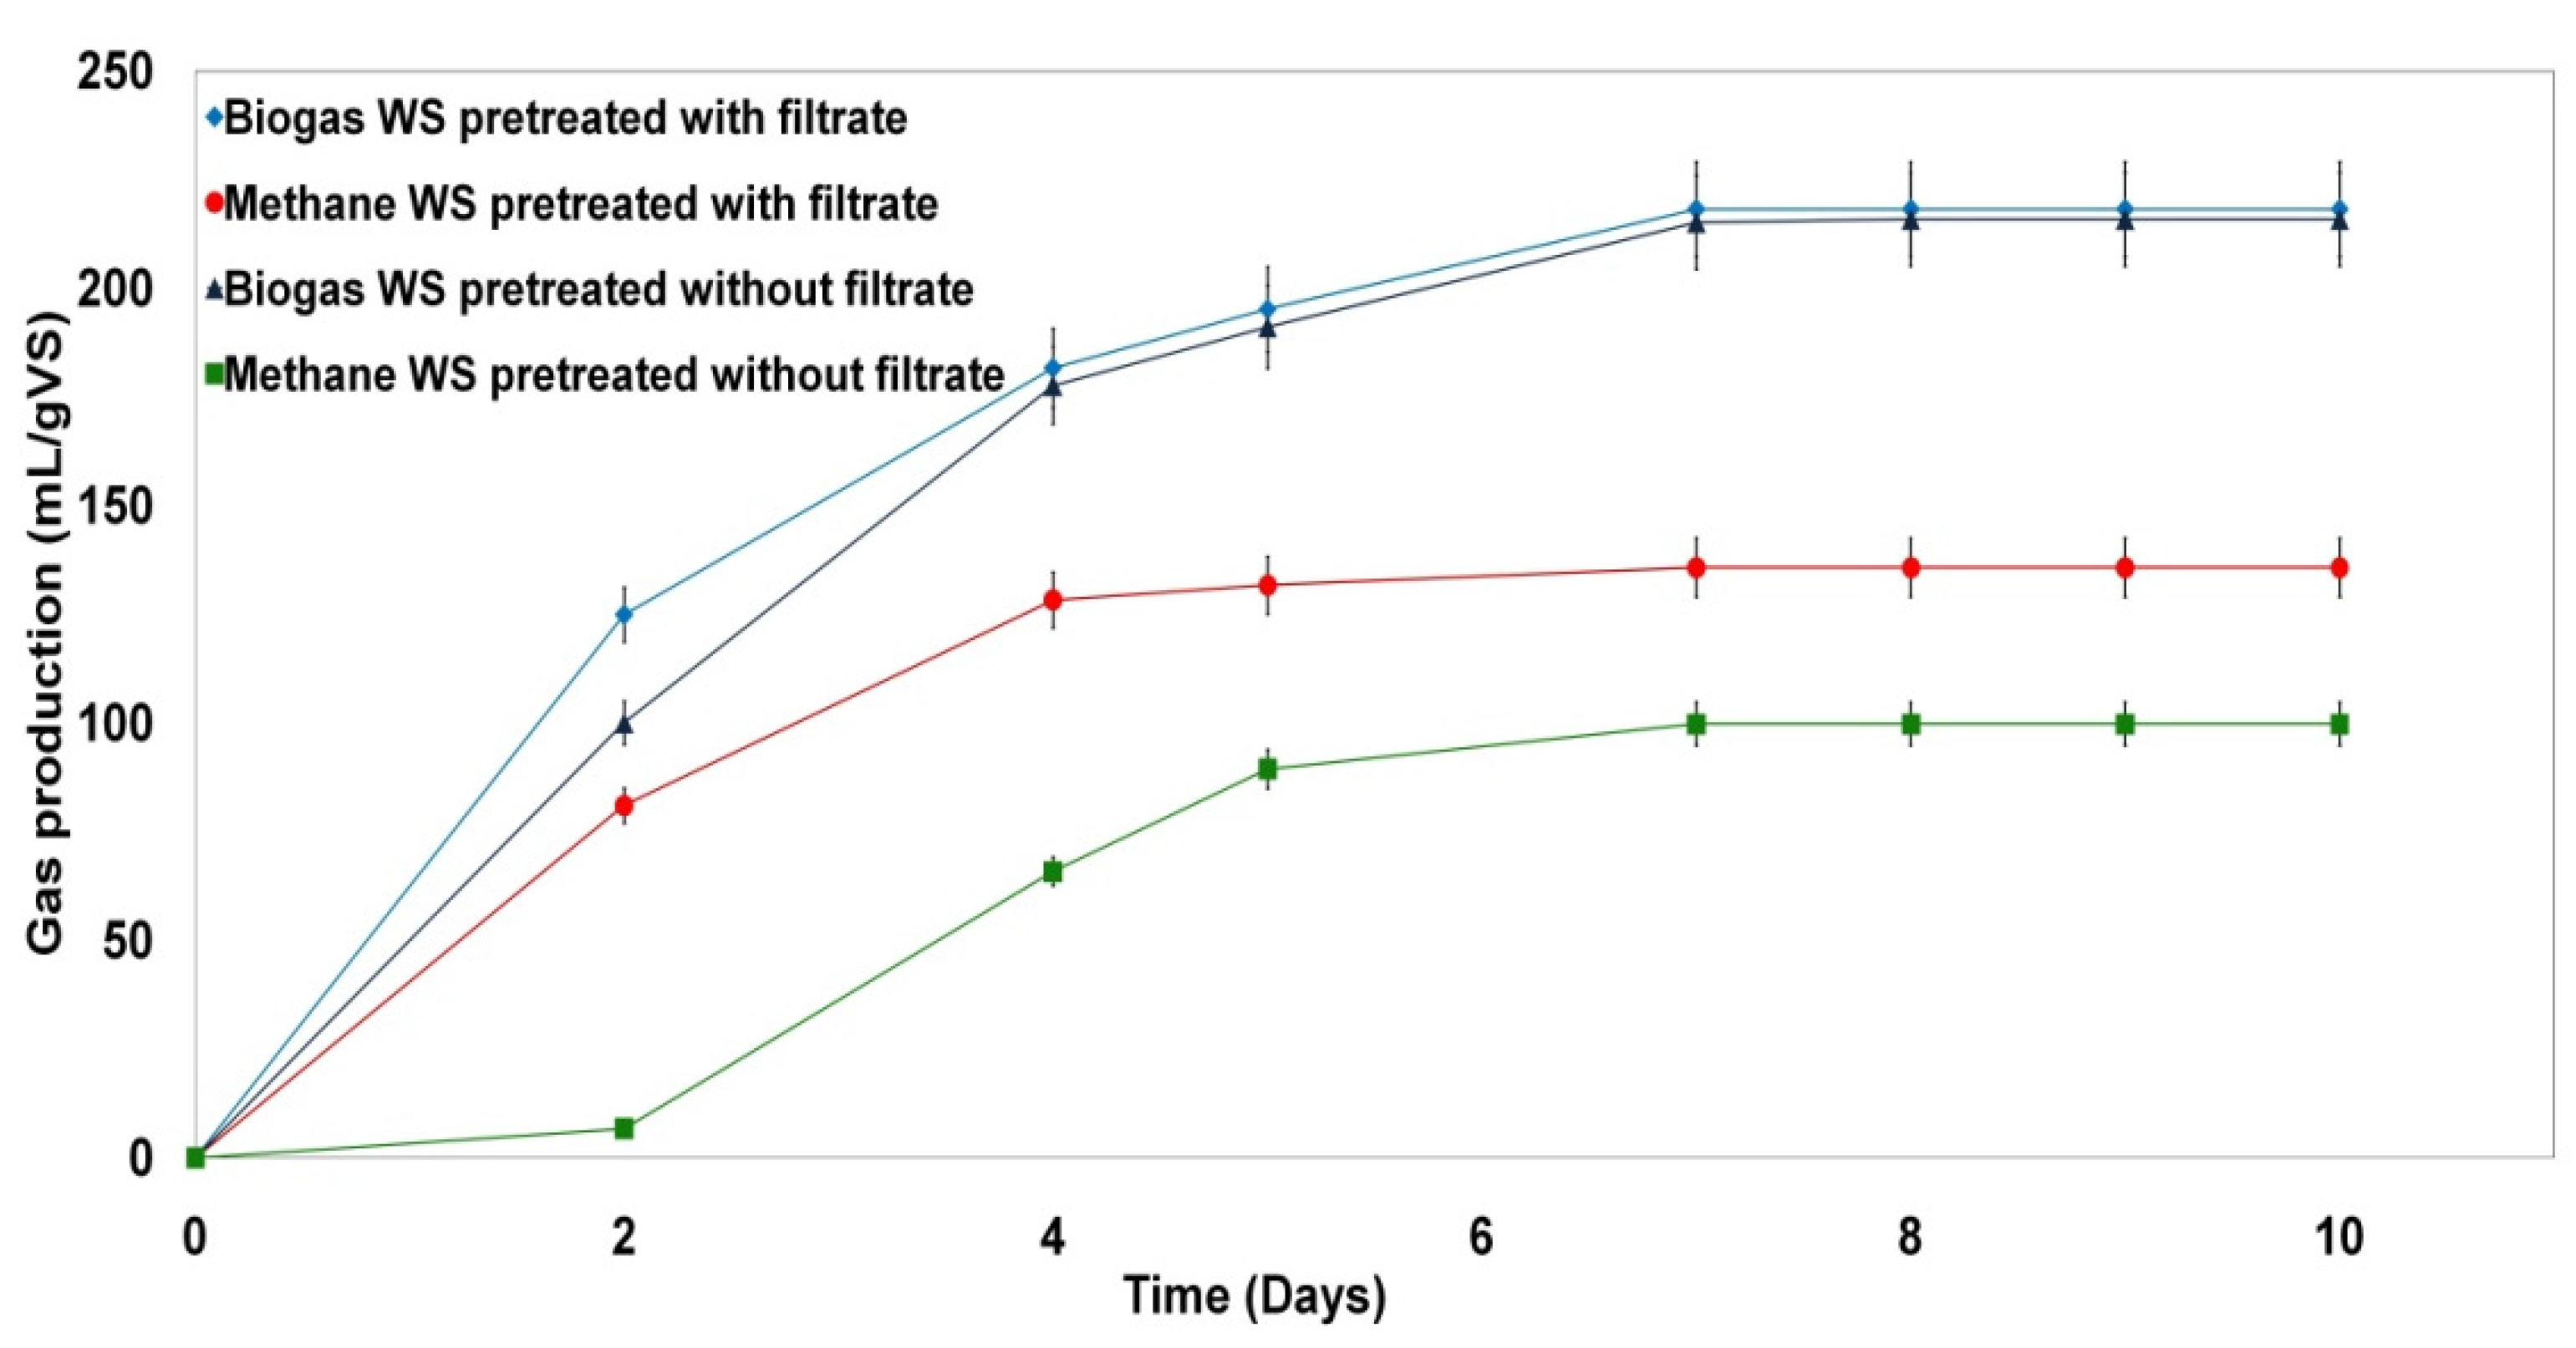
3.7. Effect of the Filtrate Resulting from the Pretreatment of WS with H2O2 Coupled with the US on the Biogas Production

In this part of our work, we studied under the optimal conditions (4% H2O2 and 10 min US) the use of the filtrate from the WS pretreatment for biogas and methane production. Figure 11 and Table 6 show the results obtained.
It appears in Figure 11 that the biogas production is almost the same for both cases, while methane production is more important when the filtrate is used. Indeed, Table 6 and Figure 12 show that pretreatment of WS with filtrate leads to an increase in methane production of more than 26%. This is explained by the presence in the filtrate of solubilized organic matter resulting from the WS pretreatment: this partially breaks down lignin and hemicelluloses and releases to the microorganisms cellulose fraction with high degradability [5].

3.8. Some Considerations about Ultrasonic Pretreatment

The Hielscher UP400S is the ultrasonic device that was used for sonication of samples in our experiments. Its operation requires a standard probe, an operating frequency of 24 kHz, and a power supply of approximately 400 W.
Typical applications of this device include homogenization, deagglomeration, cell lysis and disintegration, protein extraction, and liquid emulsification.
The batch experiments were performed in beakers without temperature control. The treated samples had a volume of 0.5 L. The specific energy supplied was defined by the following relationship:
E s = P v T S t  
where P , t , v , and T S represent the ultrasonic power, sonication time, sample volume, and total solid concentration, respectively.
The parameters allowing to obtain an optimal biomethane production are:
P = 200 W, t = 10 min, v = 500 mL, and T S = 25 g/L.
The optimum ultrasonic energy is
E s = 200 500 × 10 3 × 25 × 10 3 10 × 60 = 96 × 10 6   J / kg   TS = 9600   kJ / kg   TS
We performed three AD experiments: one experiment with WS treated under the optimal conditions determined previously at 4% w/w H2O2 and 10 min of US, another with WS treated with 4% w/w H2O2 only, i.e., without ultrasonic pretreatment, and the last experiment with only raw WS and thus without any pretreatment.
The results of these experiments obtained after 10 days are shown in Figure 12 and Table 7: the production of biogas and methane increases clearly when there is an ultrasonic pretreatment; nevertheless, beyond the seventh day, no increase of biogas and methane is perceptible.

4. Conclusions and Perspective

Renewable bioenergy sources are playing a major role as sustainable fossil fuel. AD is a main treatment for reducing the organic matter contained in WS and generating, at the same time, methane-rich biogas. The present study indicates that excessive amounts of heavy metals are present in sewage sludge, especially Cu and Zn with values of 72.50 and 491.24 mg/kg, respectively, which exceed the necessary concentrations for the growth of the methanogenic microorganisms (60 mg/kg and 64 mg/kg for Cu and Zn, respectively), leading to significant inhibition of methane production. Through optimization of various WS pretreatments, we observed that pretreatment with 4% w/w H2O2 under 10 min of ultrasonic at 24 kHz with a maximum power of 200 W is the most effective. Hence, the optimum energy supplied is 9600 kJ/kg TS. This led to the optimal solubilization of recalcitrant matter constituting the WS and corresponding to the COD value of 2675 mg/L. The BMP tests carried out in mesophilic conditions resulted in an increase of methane content by 62% in the biogas for pretreated WS with 4% w/w H2O2 with 10 min of US. BMP tests showed also that this pretreatment improved the methane yield by 64%. In addition, the degradation of hemicellulose, cellulose, and lignin reached 55, 38, and 16%, respectively. The use of the filtrate from the ultrasonic pretreatment results in an increase in methane production of 62% in the biogas.
In this work, we showed the feasibility of an optimized biomethane production but on a laboratory scale. However, industrial-scale biogas production, for example, for a European city, is a very complex process that can only be optimized by using a non-linear and multi-parameter model. Conventional implemented methods at the biogas plants are not adequate for monitoring the operational parameters and finding the correlation between them. The short-term solution is the use of the concept of artificial intelligence [52,53,54] where, for example, from deep neural networks (with several hidden layers) it is possible to optimize and predict the biogas production.

Author Contributions

Conceptualization, writing original draft, methodology, Y.R.O.; supervision, validation, K.B.; validation, review and editing, project administration, A.O. All authors have read and agreed to the published version of the manuscript.

Funding

This research received no external funding.

Institutional Review Board Statement

Not applicable.

Informed Consent Statement

Not applicable.

Data Availability Statement

Not applicable.

Conflicts of Interest

The authors declare no conflict of interest.

References

  1. Song, X.; Wachemo, A.C.; Zhang, L.; Bai, T.; Li, X.; Zuo, X.; Yuan, H. Effect of hydrothermal pretreatment severity on the pretreatment characteristics and anaerobic digestion performance of corn stove. Bioresour. Technol. 2019, 289, 121646. [Google Scholar] [CrossRef] [PubMed]
  2. Marks-Bielska, R.; Bielski, S.; Novikova, A.; Romaneckas, K. Straw Stocks as a Source of Renewable Energy. A Case Study of a District in Poland. Sustainability 2019, 11, 4714. [Google Scholar] [CrossRef] [Green Version]
  3. Available online: https://ec.europa.eu/eurostat/fr/web/energy/data/energy-balances (accessed on 25 March 2021).
  4. Negro, S.O.; Hekkert, M.P.; Smits, R.E. Explaining the failure of the Dutch innovation system for biomass digestion—A functional analysis. Energy Policy 2007, 2, 925–938. [Google Scholar] [CrossRef] [Green Version]
  5. Zheng, Q.; Zhou, T.; Wang, Y.; Cao, X.; Wu, S.; Zhao, M.; Wang, H.; Xu, M.; Zheng, B.; Zheng, J.; et al. Pretreatment of wheat straw leads to structural changes and improved enzymatic hydrolysis. Sci. Rep. 2018, 8, 1321–1330. [Google Scholar] [CrossRef] [PubMed] [Green Version]
  6. Sprafke, J.; Ekanthalu, V.S.; Nelles, M. Continuous Anaerobic Co-Digestion of Biowaste with Crude Glycerol under Mesophilic Conditions. Sustainability 2020, 12, 9512. [Google Scholar] [CrossRef]
  7. Farrukh, R.A.; Habiba, K.; Han, Z.; Sajidu, R.; Ruihong, Z.; Guangqing, L.; Chang, C. Pretreatment methods of lignocellulosic biomass for anaerobic digestion. AMB Express 2017, 7, 72–84. [Google Scholar]
  8. Paul, S.; Dutta, A. Challenges and opportunities of lignocellulosic biomass for anaerobic digestion. Resour. Conserv. Recycl. 2018, 130, 164–174. [Google Scholar] [CrossRef]
  9. Molaey, R.; Bayrakdar, A.; Sürmeli, R.Ö.; Çalli, B. Anaerobic digestion of chicken manure: Influence of trace element supplementation. Eng. Life Sci. 2019, 19, 143–150. [Google Scholar] [CrossRef] [Green Version]
  10. Silva, G.G.; Couturier, M.; Berrin, J.G.; Buléon, A.; Rouau, X. Effects of grinding processes on enzymatic degradation of wheat straw. Bioresour. Technol. 2012, 1, 192–200. [Google Scholar] [CrossRef]
  11. Zhang, Y.Q.; Fu, E.H.; Liang, J.H. Effect of Ultrasonic Waves on the Saccharification Processes of Lignocellulose. Chem. Eng. Technol. 2008, 10, 1510–1515. [Google Scholar] [CrossRef]
  12. Bussemaker, J.M.; Zhang, D. Ultrasonic Pretreatment of Wheat Straw in Oxidative and Nonoxidative Conditions Aided with Microwave Heating. Ind. Eng. Chem. Res. 2013, 52, 12514–12522. [Google Scholar] [CrossRef]
  13. Maamir, W.; Ouahabi, Y.R.; Poncin, S.; Li, H.Z.; Bensadok, K. Effect of Fenton Pretreatment on Anaerobic Digestion of Olive Mill Wastewater and Olive Mill Solid Waste in Mesophilic Conditions. Int. J. Green Energy 2017, 14, 555–560. [Google Scholar] [CrossRef]
  14. Mancini, G.; Papirio, S.; Lens, P.; Esposito, G. Increased biogas production from wheat straw by chemical pretreatments. Renew. Energy 2018, 119, 608–614. [Google Scholar] [CrossRef]
  15. Guan, R.; Li, X.; Wachemo, A.C.; Yuan, H.; Liu, Y.; Zou, D.; Zuo, X.; Gu, J. Enhancing anaerobic digestion performance and degradation of lignocellulosic components of rice straw by combined biological and chemical pretreatment. Sci. Total Environ. 2018, 17, 637–638. [Google Scholar] [CrossRef]
  16. Rouches, E.; Escudié, R.; Latrille, E.; Carrère, H. Solid-state anaerobic digestion of wheat straw: Impact of S/I ratio and pilot scale fungal pretreatment. Waste Manag. 2019, 85, 464–476. [Google Scholar] [CrossRef] [PubMed]
  17. Wang, Z.W.; Zhu, M.Q.; Li, M.F.; Wei, Q.; Sun, R.C. Effects of hydrothermal treatment on enhancing enzymatic hydrolysis of rapeseed straw. Renew. Energy 2019, 134, 446–452. [Google Scholar] [CrossRef]
  18. Barakat, A.; Mayer-Laigle, C.; Solhy, A.; Arancon, R.A.D.; De Vries, H.; Luque, R. Mechanical pretreatments of lignocellulosic biomass: Towards facile and environmentally sound technologies for biofuels production. RSC Adv. 2014, 4, 48109–48127. [Google Scholar] [CrossRef]
  19. Jaffar, M.; Pang, Y.; Yuan, H.; Zou, D.; Liu, Y.; Zhu, B.; Korai, M.R.; Li, X. Wheat straw pretreatment with KOH for enhancing biomethane production and fertilizer value in anaerobic digestion. Energy Resour. Environ. Technol. 2016, 3, 404–409. [Google Scholar] [CrossRef]
  20. Ravindran, R.; Jaiswal, A.K. A comprehensive review on pretreatment strategy for lignocellulosic food industry waste: Challenges and opportunities. Bioresour. Technol. 2016, 199, 92–102. [Google Scholar] [CrossRef] [Green Version]
  21. Song, Z.; Yag, G.; Feng, Y.; Ren, G.; Han, X. Pretreatment of rice straw by hydrogen peroxide for enhanced methane yield. J. Integr. Agric. 2013, 7, 1258–1266. [Google Scholar] [CrossRef]
  22. Jeon, Y.; Kim, H.; Shin, M.; Pak, S. Ultrasonic treatment of waste livestock blood for enhancement of solubilization. Environ. Eng. Res. 2016, 1, 22–28. [Google Scholar] [CrossRef]
  23. Arbaoui, A.; Ouahabi, A.; Jacques, S.; Hamiane, M. Concrete Cracks Monitoring using Deep Learning-based Multiresolution Analysis. Electronics 2021. [Google Scholar] [CrossRef]
  24. Labat, V.; Remenieras, J.P.; Matar, O.B.; Ouahabi, A.; Patat, F. Harmonic propagation of finite amplitude sound beams: Experimental determination of the nonlinearity parameter B/A. Ultrasonics 2000, 38, 292–296. [Google Scholar] [CrossRef]
  25. Ouahabi, A.; Femmam, S. Wavelet-based multifractal analysis of 1-D and 2-D signals: New results. Analog Integr. Circuits Signal Process. 2011, 69, 3–15. [Google Scholar] [CrossRef]
  26. Girault, J.M.; Ossant, F.; Ouahabi, A.; Kouame, D.; Patat, F. Time-varying autoregressive spectral estimation for ultrasound attenuation in tissue characterization. IEEE Trans. Ultrason. Ferroelectr. Freq. Control. 1998, 45, 650–659. [Google Scholar] [CrossRef] [PubMed] [Green Version]
  27. Djeddi, M.; Ouahabi, A.; Batatia, H.; Basarab, A.; Kouamé, D. Discrete wavelet transform for multifractal texture classification: Application to ultrasound imaging. In Proceedings of the IEEE International Conference on Image Processing (IEEE ICIP 2010), Hong Kong, China, 12–15 September 2010; pp. 637–640. [Google Scholar]
  28. Girault, J.M.; Kouamé, D.; Ouahabi, A.; Patat, F. Estimation of the blood Doppler frequency shift by a time-varying parametric approach. Ultrasonics 2000, 38, 682–687. [Google Scholar] [CrossRef] [Green Version]
  29. APHA Association; Federation, Water Environmental. Standards Methods for the Examination of Water and Wastewater; United Book Press Inc.: Baltimor, MD, USA, 1998. [Google Scholar]
  30. Van Soest, J.; Robertson, J.B.; Lewis, B.A. Methods for dietary fiber, neutral detergent fiber, and non-starch polysaccharides in relation to animal nutrition. J. Dairy Sci. 1991, 74, 3583–3597. [Google Scholar] [CrossRef]
  31. Brown, A.M. A new software for carrying out one-way ANOVA post hoc tests. Comput. Methods Programs Biomed. 2005, 79, 89–95. [Google Scholar] [CrossRef]
  32. Bolan, N.; Adriano, D.; Mahimairaja, S. Distribution and Bioavailability of Trace Elements in Livestock and Poultry Manure By-Products. Crit. Rev. Environ. Sci. Technol. 2004, 34, 291–338. [Google Scholar] [CrossRef]
  33. Zhang, F.; Li, Y.; Yang, M.; Wei, L. Content of Heavy Metals in Animal Feeds and Manures from Farms of Different Scales in Northeast China. Int. J. Environ. Public Health 2012, 9, 2658–2668. [Google Scholar] [CrossRef] [Green Version]
  34. Mudhoo, A.; Kumar, S. Effects of heavy metals as stress factors on anaerobic digestion processes and biogas production from biomass. Int. J. Environ. Sci. Technol. 2013, 6, 1383–1398. [Google Scholar] [CrossRef] [Green Version]
  35. Schattauer, A.; Abdoun, E.; Weiland, P.; Plochl, M.; Heiermann, M. Abundance of trace elements in demonstration biogas plants. Biosyst. Eng. 2011, 108, 57–65. [Google Scholar] [CrossRef]
  36. Chernicharo, C.A.L. Anaerobic Reactors. In Biological Wastewater Treatment Series; IWA Publishing: London, UK, 2007. [Google Scholar]
  37. Montusiewicz, A.; Szaja, A.; Musielewicz, I.; Cydzik-Kwiatkowska, A.; Lebiocka, M. Effect of bioaugmentation on digestate metal concentrations in anaerobic digestion of sewage sludge. PLoS ONE 2020, 7, 15–31. [Google Scholar] [CrossRef] [PubMed]
  38. Paulo, L.M.; Stams, A.J.M.; Sousa, D.Z. Methanogens, sulphate and heavy metals: A complex system. Rev. Environ. Sci. Biotechnol. 2015, 14, 537–553. [Google Scholar] [CrossRef] [Green Version]
  39. Atlas, L. Inhibitory effect of heavy metals on methane-producing anaerobic granular sludge. J. Hazard. Mater. 2009, 162, 1551–1556. [Google Scholar]
  40. Chen, J.L.; Ortiz, R.; Steele, T.; Stuckey, D.C. Toxicants Inhibiting Anaerobic Digestion: A Review. Biotechnol. Adv. 2014, 8, 1523–1534. [Google Scholar] [CrossRef] [PubMed]
  41. Dokulilová, T.; Koutný, T.; Vítěz, T. Effect of Zinc and Copper on Anaerobic Stabilization of Sewage Sludge. Acta Univ. Agric. Silvic. Mendel. Brun. 2018, 2, 357–363. [Google Scholar] [CrossRef] [Green Version]
  42. Nandi, R.; Saha, C.K.; Sarker, S.; Huda, M.S.; Alam, M.M. Optimization of Reactor Temperature for Continuous Anaerobic Digestion of Cow Manure: Bangladesh Perspective. Sustainability 2020, 12, 8772. [Google Scholar] [CrossRef]
  43. Mota, V.T.; Zaiat, M. Two- vs. single-stage anaerobic reactors: Evaluation of effluent quality and energy production potential using sucrose-based wastewater. Water Sci. Technol. 2018, 9, 1966–1979. [Google Scholar] [CrossRef]
  44. Zhai, N.; Zhang, T.; Yin, D.; Yang, G.; Wang, X.; Ren, G.; Feng, Y. Effect of initial pH on anaerobic co-digestion of kitchen waste and cow manure. Waste Manag. 2015, 38, 126–131. [Google Scholar] [CrossRef]
  45. Rocamora, I.; Wagland, S.T.; Villa, R.; Simpson, E.W.; Fernández, O.; Bajón-Fernández, Y. Dry anaerobic digestion of organic waste: A review of operational parameters and their impact on process performance. Bioresour. Technol. 2020, 299, 122681. [Google Scholar] [CrossRef] [PubMed]
  46. Blasco, L.; Kahala, M.; Tampio, E.; Vainio, M.; Ervasti, S.; Rasi, S. Effect of inoculum pretreatment on the composition of microbial communities in anaerobic digesters producing volatile fatty acids. Microorganisms 2020, 8, 581. [Google Scholar] [CrossRef] [PubMed] [Green Version]
  47. Rinco, B.; Heaven, S.; Banks, C.J.; Zhang, Y. Anaerobic digestion of whole-crop winter wheat silage for renewable energy production. Energy Fuel 2012, 26, 2357–2364. [Google Scholar] [CrossRef] [Green Version]
  48. Gallegos, D.; Wedwitschk, H.; Moeller, L.; Zehnsdorf, A.; Stinner, W. Effects of particle size reduction and ensiling fermentation on biogas formation and silage quality of wheat straw. Bioresour. Technol. 2017, 245, 216–224. [Google Scholar] [CrossRef] [PubMed]
  49. Taherdanak, M.; Zilouei, H. Improving biogas production from wheat plant using alkaline pretreatment. Fuel 2014, 115, 714–719. [Google Scholar] [CrossRef]
  50. Komemoto, K.; Lim, Y.G.; Nagao, N.; Onoue, Y.; Niwa, C.; Toda, T. Effect of temperature on VFA’s and biogas production in anaerobic solubilization of food waste. Waste Manag. 2009, 29, 2950–2955. [Google Scholar] [CrossRef]
  51. Kumar, S.; Paritosh, K.; Pareek, N.; Chawade, A.; Vivekanand, V. De-construction of major Indian cereal crop residues through chemical pretreatment for improved biogas production: An overview. Renew. Sustain. Energy Rev. 2018, 90, 160–170. [Google Scholar] [CrossRef]
  52. Cinar, S.; Cinar, S.O.; Wieczorek, N.; Sohoo, I.; Kuchta, K. Integration of Artificial Intelligence into Biogas Plant Operation. Processes 2021, 9, 85. [Google Scholar] [CrossRef]
  53. Sakiewicz, P.; Piotrowski, K.; Ober, J.; Karwot, J. Innovative artificial neural network approach for integrated biogas—Wastewater treatment system modelling: Effect of plant operating parameters on process intensification. Renew. Sustain. Energy Rev. 2020, 124, 109784. [Google Scholar] [CrossRef]
  54. Ramachandran, A.; Rustum, R.; Adeloye, A.J. Review of Anaerobic Digestion Modeling and Optimization Using Nature-Inspired Techniques. Processes 2019, 7, 953. [Google Scholar] [CrossRef] [Green Version]
Figure 1. Methanization process.
Sustainability 13 07202 g001
Figure 2. The experimental set-up used for biochemical methane potential tests: (1) thermostatic digester; (2) agitator; (3) pipe for biogas transport; (4) acidic solution to avoid CO2 dissolution; (5) NaOH solution for CO2 capture; (6) and (7) outlet of displaced liquid.
Sustainability 13 07202 g002
Figure 3. (a) pH; (b) VFAs and (c) TAC variation for bovine manure (♦) and sewage sludge (●) during anaerobic digestion.
Sustainability 13 07202 g003
Figure 4. Cumulative volumes of biogas and methane for bovine manure and sewage sludge during anaerobic digestion.
Sustainability 13 07202 g004
Figure 5. Effect of NaOH and H2O2 concentration on COD released.
Sustainability 13 07202 g005
Figure 6. Effect of coupling US pretreatement with NaOH and H2O2 on COD released.
Sustainability 13 07202 g006
Figure 7. Effect of reaction time for H2O2 coupled with US pretreatement on COD released.
Sustainability 13 07202 g007
Figure 8. (a) SEM photo of raw WS; (b) SEM photo of pretreated WS with H2O and US solely.
Sustainability 13 07202 g008
Figure 9. SEM photo for pretreated WS with chemical solution and 10 min of US: (a) 0.5% NaOH; (b) 1% NaOH; (c) 2% NaOH; (d) 4% NaOH; (e) 1% H2O2; (f) 2% H2O2; (g) 4% H2O2; and (h) 8 % H2O2.
Sustainability 13 07202 g009aSustainability 13 07202 g009b
Figure 10. Cumulative volumes of biogas and methane for pretreated and untreated WS, during the AD process.
Sustainability 13 07202 g010
Figure 11. Cumulative volumes of biogas and methane for AD of pretreated WS with and without filtrate.
Sustainability 13 07202 g011
Figure 12. Influence of ultrasonic treatment on gas production.
Sustainability 13 07202 g012
Table 1. Wheat straw, bovine manure, and sewage sludge features.
ParameterRaw Wheat StrawBovine ManureSewage Sludge
Total solids (TS) (g/L)91.3324.1482.02
Volatile solids (VS) (g/L)6.1520.102.50
pH//7.90
Volatile fatty acid (VFA) (g/L)0.05/1.60
Total alkalinity (TA) (g/L)0.01/1.00
Hemicellulose (%)51.60//
Cellulose (%)41.30//
Lignin (%)10.30//
Table 2. Metal concentrations for bovine manure and sewage sludge compared with the concentrations of metals required for anaerobic digestion.
Metal Concentrations mg/kgBovine Manure
Our Study
Bovine Manure
Bolan et al. [32]
Bovine Manure
Zhang et al. [33]
Sewage Sludge
Our study
Sewage Sludge
Bolan et al. [32]
Sewage Sludge Mudhoo et al. [34]Required for AD Schattauer et al. [35]Required for AD Chernicharo et al. [36]
Cu18.2721.0031.0472.5054.7044.706410
Zn43.40115.00126.33491.24294.00360.00-60
Pb2.012.102.245.002.4710.40200-
Ni12.099.00-15.7615.003.8030100
Mn25.88111.00-30.14142.00136.00553
Cr32.6420.001.0950.4075.108.0052-
Co2.341.70-2.114.101.802075
Table 3. Methane production yield for bovine manure and sewage sludge.
Bovine ManureSewage Sludge
Biogas (mL/gVS)197.5099.00
Methane (mL/gVS)111.5032.00
Methane (%) in biogas56.4632.32
Table 4. Methane production yield for pretreated and untreated wheat straw.
Pretreated Wheat StrawUntreated Wheat Straw
Biogas (mL/g VS)218130
Methane (mL/g VS)13649
Methane (%) in biogas6238
Methane improvement (%) for pretreated WS64/
Table 5. Wheat straw composition before and after pretreatment and degradation rate.
Pretreated Wheat StrawUntreated Wheat StrawDegradation Rate
Hemicellulose (%)51.6023.2055.04
Cellulose (%)41.3025.4038.50
Lignin (%)10.308.6016.50
Table 6. Methane product yield for AD of WS pretreated with filtrate and WS pretreated without filtrate.
Pretreated Wheat Straw with FiltratePretreated Wheat Straw without Filtrate
Biogas (mL/g VS)218215
Methane (mL/g VS)136100
Methane (%) in biogas6246
Methane improvement (%) for pretreated WS with filtrate26/
Table 7. Effect of ultrasonic pretreatment.
Pretreated Wheat Straw with 4% w/w H2O2 and USPretreated Wheat Straw with 4% w/w H2O2 onlyUntreated Wheat Straw
Biogas (mL/g VS)218185130
Methane (mL/g VS)13611049
Methane (%) in biogas625938
Methane improvement (%) for pretreated WS6455/
Publisher’s Note: MDPI stays neutral with regard to jurisdictional claims in published maps and institutional affiliations.

