Article

The Impact of B Corp Certification on Growth

Department of Accounting, Corporate Finance and Taxation, Ghent University, 9000 Ghent, Belgium
*
Author to whom correspondence should be addressed.
Sustainability 2021, 13(13), 7191; https://doi.org/10.3390/su13137191
Submission received: 1 June 2021 / Revised: 16 June 2021 / Accepted: 22 June 2021 / Published: 26 June 2021
(This article belongs to the Collection Business Performance and Socio-environmental Sustainability)

Abstract

:
We empirically test whether B Corp certification affects the short- and medium-term growth rates of sustainable enterprises. These businesses are growing in popularity and prevalence but, due to their hybrid nature, often suffer from external credibility issues and competing internal logics. Because of the rigorous and time-involving audit procedure, B Corp certification potentially sends a credible signal about the sustainable nature of the enterprise to its stakeholders. In addition, the B Corp label could help to straighten out internal tensions and align the company towards its dual purpose. Hence, B Corp certification could contribute to company success. We observe 129 firms that were certified between 2013 and 2018 over a period between six years prior and five years post-certification. Using propensity score matching, we identify 129 non-certified matching companies. On this sample, we conduct a difference-in-differences panel regression analysis to investigate the effect of certification. Our dataset allows us to study how the effects of B Corp certification evolve over time, which was previously untested. Our study documents a positive effect of B Corp certification on turnover growth and also that this effect increases with the time since certification, implying that certification requires some time for its full effect to become apparent.

1. Introduction

The research objective of this paper is to empirically assess the short- and medium-term effects of B Corp certification on the financial success of European sustainable enterprises. Sustainable enterprises are hybrid enterprises that pursue sustainability (social and/or environmental) goals in addition to their financial goals [1]. The increase in stakeholder attention towards the sustainability practices of companies has contributed to their recent popularity [2]. A problem typical of hybrid enterprises is that they experience tensions from their dual nature [3]. These tensions arise because the dual targets are often internally competing and also hinder the credibility towards internal and external stakeholders [4], which may impair hybrid companies’ financial growth [5]. According to signaling theory, external sustainability certification might serve as a credible signal of the sustainable nature of the company, enhancing its external credibility [6]. In addition, the internal changes that are implemented due to the intensive non-financial audit procedure might result in the reinforcement of the commercial and social/environmental logics, which could in turn mitigate the internal tensions [4].
One such provider of external sustainability certification is B Lab. Founded in the U.S. in 2006, the number of companies that received B Lab certification, the so-called B Corps, has grown worldwide to more than 3900 to date [7]. In order to be eligible for certification, a business has to demonstrate that it adheres to “the highest standards of verified social and environmental performance, public transparency and legal accountability to balance profit and purpose” [8]. The rigorous audit procedure by B Lab adds credibility to the certification. Hence, based on signaling theory and the internal changes that the certification process might entail, we argue that B Lab certification positively affects financial success, as measured by company growth. In a second instance, we consider the question of whether the effect of certification varies over time. Parker et al. [9] suggest that there are organizational costs of certification to be considered and that these costs are situated in the short term, more specifically during the process of certification. On the other hand, the benefits of certification in terms of increased customer loyalty, enhanced reputation, organizational alignment, etc., might take some time to materialize and are therefore probably situated more in the medium term. Therefore, we formulate the second hypothesis that the effect of B Lab certification on firm growth increases over time.
To test our hypotheses, we observe 129 European B Corps that were certified between 2013 and 2018 over a period between six years prior and five years post-certification. Using propensity score matching (PSM), we also select 129 non-certified companies as a control group. On this matched sample, we conduct a difference-in-differences (DiD) panel data regression analysis in which we compare the growth rates of B Corps before and after certification and compare this difference with the corresponding difference that is observed in the control group. This combination of approaches allows us to control for selection bias (on both observable and unobservable firm characteristics) and attribute any observed effect to certification. Due to the panel structure and richness of the dataset, we are able to test and confirm that the parallel trend assumption, crucial for the application of the DiD analysis, holds for our sample.
Our empirical results indicate that B Corp certification positively affects company growth rates. In addition, our evidence suggests that the size of this effect increases over the number of years since certification.
Our study contributes to the literature on sustainable enterprises and B Corp certification in several ways. First, only little is known about the factors that influence the success of sustainable enterprises. These factors are not necessarily the same as those affecting the success of traditional companies [1]. Moreover, the hybrid firm growth literature is characterized by case-based research, lacking a clear overview of how sustainable enterprises are performing in general [1]. Our study adds to this field of knowledge by empirically investigating the impact of B Lab certification on the success of sustainable enterprises. Second, while various studies examine the effects of B Corp certification on companies’ pro-social efforts and pathways [10,11,12,13,14,15], few studies look into the financial implications of obtaining such certification [9,16,17,18]. Although entrepreneurs are concerned with the market advantage of obtaining certification [15], only a handful of papers aim to empirically investigate the effect of B Lab certification on growth. Chen and Kelly [16], Romi et al. [17] and Paelman et al. [18] find a positive effect of certification. Parker et al. [9], on the other hand, find a negative effect. They attribute this finding to the presumed attentional deficit and internal organizational disruption that the B Lab audit procedure entails. However, due to data constraints, these aforementioned studies suffer from two serious limitations: (1) they are unable to disentangle the extent to which the observed changes in growth are due to the sustainable nature of the companies or to the B Corp certification [16,17] and (2) they can only investigate the effect of B Lab certification on company growth in the short run [9,18]. Due to the richness of our dataset and the techniques employed, our paper is able to address both shortcomings. Consistent with studies that examined the effects of other types of voluntary certification [19,20], the application of PSM and the DiD analysis allows us to attribute any observed effect on firm growth to B Corp certification. The size of our panel dataset, on the other hand, allows us to investigate how this effect evolves over time and to assess whether the parallel trend assumption holds.
The remainder of this paper is structured as follows. In Section 2, we elaborate on the previous literature and develop our hypotheses. Section 3 provides an overview of our research design. Section 4 presents our results. In Section 5, we discuss our findings. Section 6 concludes.

2. Literature and Hypotheses

The increasing awareness among stakeholders worldwide about the social and environmental responsibilities of companies has contributed to the success of sustainable enterprises, which pursue both financial and societal (environmental and/or social) goals [2,21]. The hybrid nature of these companies creates challenges and tensions [3,22,23], which might impede their growth [5]. These challenges include more complicated performance measurement and evaluation (financial performance does not necessarily go along with social/environmental performance, the latter in itself being more challenging to measure), more accountability requirements and difficult communication with diverse stakeholder groups (as stakeholders have trouble making sense of sustainable companies) [5,24,25]. Additionally, internal tensions arise due to competition between social and financial goals [25]. Sustainable firms risk (temporarily) prioritizing one set of goals over the other, resulting in mission drift [25].
On the other hand, the social value creation could be conceived as a differentiation strategy [5,26]. In this view, sustainable enterprises could have an advantage compared to regular businesses [3] as sustainability-oriented stakeholders might interact on a more positive stance with them. Socially responsible customers could seek to improve their societal impact by purchasing from sustainable enterprises [27]. Shared values could increase brand loyalty and word-of-mouth promotion [26,28]. Sustainable companies’ strategic advantages often result from enhanced relationships with these customers [29]. Nevertheless, in their relations with other stakeholders, such as shareholders, creditors and employees, sustainable enterprises might also benefit from the growing awareness about societal aspects of business [30].
A prerequisite for sustainable enterprises to capitalize on their societal goals is that stakeholders are aware of them [6]. Taking into account the internal struggles of sustainable enterprises with their duality, convincing (outside) stakeholders of their sustainability might not be straightforward. In addition, stakeholders are flooded with signals of sustainability, also from less-than-sustainable companies, resulting in problems of credibility for genuinely sustainable enterprises [25]. In such a context, external sustainability certification could be a solution to this problem of information asymmetry. For certification to provide a credible signal, the cost of becoming certified must be sufficiently high [31] so that only truly socially motivated enterprises have an incentive to pursue certification [9,32].
One such form of certification is provided by B Lab. B Corp certificates are granted by the independent non-profit organization B Lab, founded in the United States in 2006 [33]. In order to be eligible for B Corp certification, a firm must first assess its societal and environmental impact using the B Impact Assessment (BIA). The BIA provides feedback in the form of a B Impact Report, which can be used to compare scores in several domains with other businesses [34]. The following domains are covered: Governance (Mission and Engagement; Ethics and Transparency), Workers (Financial Security, Health, Wellness and Safety, Career Development, Engagement and Satisfaction), Environment (Environmental Management, Air and Climate, Water, Land and Life) and, finally, Customers (Customer Stewardship) [35]. If the BIA equals or exceeds the threshold score of 80 on 200, B Lab verifies this score during a rigorous audit procedure. If the verification is successful, a company can become a B Corp by paying an annual fee to B Lab, signing an agreement which states that the company will take into account the interests of all stakeholders in the decision-making process and amend its corporate charters accordingly [36]. The company has to be recertified every three years to maintain its certification.
Due to the comprehensive nature of the B Corp certification process, certification by B Lab can be considered a costly signal and offers the potential to enhance the credibility of companies’ social claims. Hence, B Corp certification could unlock the sustainable enterprises’ strategic advantages. In addition, the B Corp label could help to straighten out internal tensions and align the company towards its dual purpose. In a survey of B Corp managers, Chauhan and O’Neill [4] report that the certification brings about internal changes, such as a profound rearticulation of the duality of the company’s mission, involvement of the employees, new human resource approaches and internal changes in organization and practice that harmonize the enterprise with its dual purpose nature. We propose that the enhanced credibility and the internal alignment resulting from B Lab certification have a positive impact on financial success, as measured by company growth. There already exist a few papers that compare the growth rates of certified B Corps with those of non-certified competitors and conclude that B Corps outperform their peers [16,17]. These studies are, however, unable to disentangle the extent to which the observed changes in growth are due to the sustainable nature of the companies or to the B Corp certification per se. Other studies attempt to examine the effect the certification per se but focus on the short-term effect of B Corp certification on firm growth, i.e., one year post-certification. While Parker et al. [9] find a negative effect for young and small firms, Paelman et al. [18] document a positive effect on turnover growth. Our goal is to add to this discussion by empirically testing whether B Corp certification per se enhances firm growth at a longer-term horizon. Consequently, we advance the following (alternative) hypothesis:
Hypothesis 1.
B Lab certification has a positive effect on growth.
A common characteristic of previous studies that compared the turnover growth of B Corps to non-B Corp counterparts [9,16,17,18] is that they, probably due to data limitations, only investigate short-term associations. In this paper, we argue that the strength of the effect of certification on financial success might increase over time. First of all, the bulk of the organizational effort to obtain certification is situated before or during the year of certification and probably burdens the organization less after certification. Given that B Corp certification should be renewed every three years, one can reasonably expect that the efforts involved in recertification will be lower. Regarding the benefits of certification, we expect that these will increase over time. According to signaling theory, the length of the signal positively affects its strength [31]. Moreover, recertification would imply that the signal is confirmed and that the frequency of the signal increases, which could further enhance customers’ positive reaction. Hence, based on signaling theory, one could expect that the effect of B Corp certification on turnover growth evolves positively over time. Parker et al. [9] argue that the effects of stakeholders’ reaction on this signal take time and that, in the longer term, the short-term negative effects might reverse. From a networking point of view, there might also exist a delay in the positive results from networking with like-minded businesses on growth [37]. Based on these arguments, we advance the following (alternative) hypothesis:
Hypothesis 2.
The effect of B Lab certification on growth increases with the time since certification.

3. Research Design

3.1. Methodology

3.1.1. Motivation

To test our hypotheses, we wish to find a counterfactual that represents a company’s growth if it had not obtained a B Corp certificate. To this end, we conduct a DiD analysis. In such an analysis, one compares the change in outcome of a treatment group, before and after the treatment, with the change in the outcome of a control group over the same time period. In the context of this paper, treatment represents the certification from B Lab. In line with other studies looking at the financial success of B Corps, we choose turnover growth, a popular measure for financial success [38], as our outcome measure.
The parallel trend assumption, i.e., the assumption that, in the absence of the treatment, the outcome variable would evolve similarly for the treatment and control groups, is crucial for an accurate estimation of the treatment effect [39]. To increase the plausibility of this assumption, we select a control group that is very similar to the treatment group based on observable pre-treatment characteristics. To select this control group, we use a PSM procedure. This combination of matching to construct an appropriate control group and performing a DiD analysis afterwards to estimate the treatment effect has proven to be very effective in controlling for self-selection on both observable and unobservable characteristics [40]. A schematic diagram of our research procedure is provided in Figure 1.

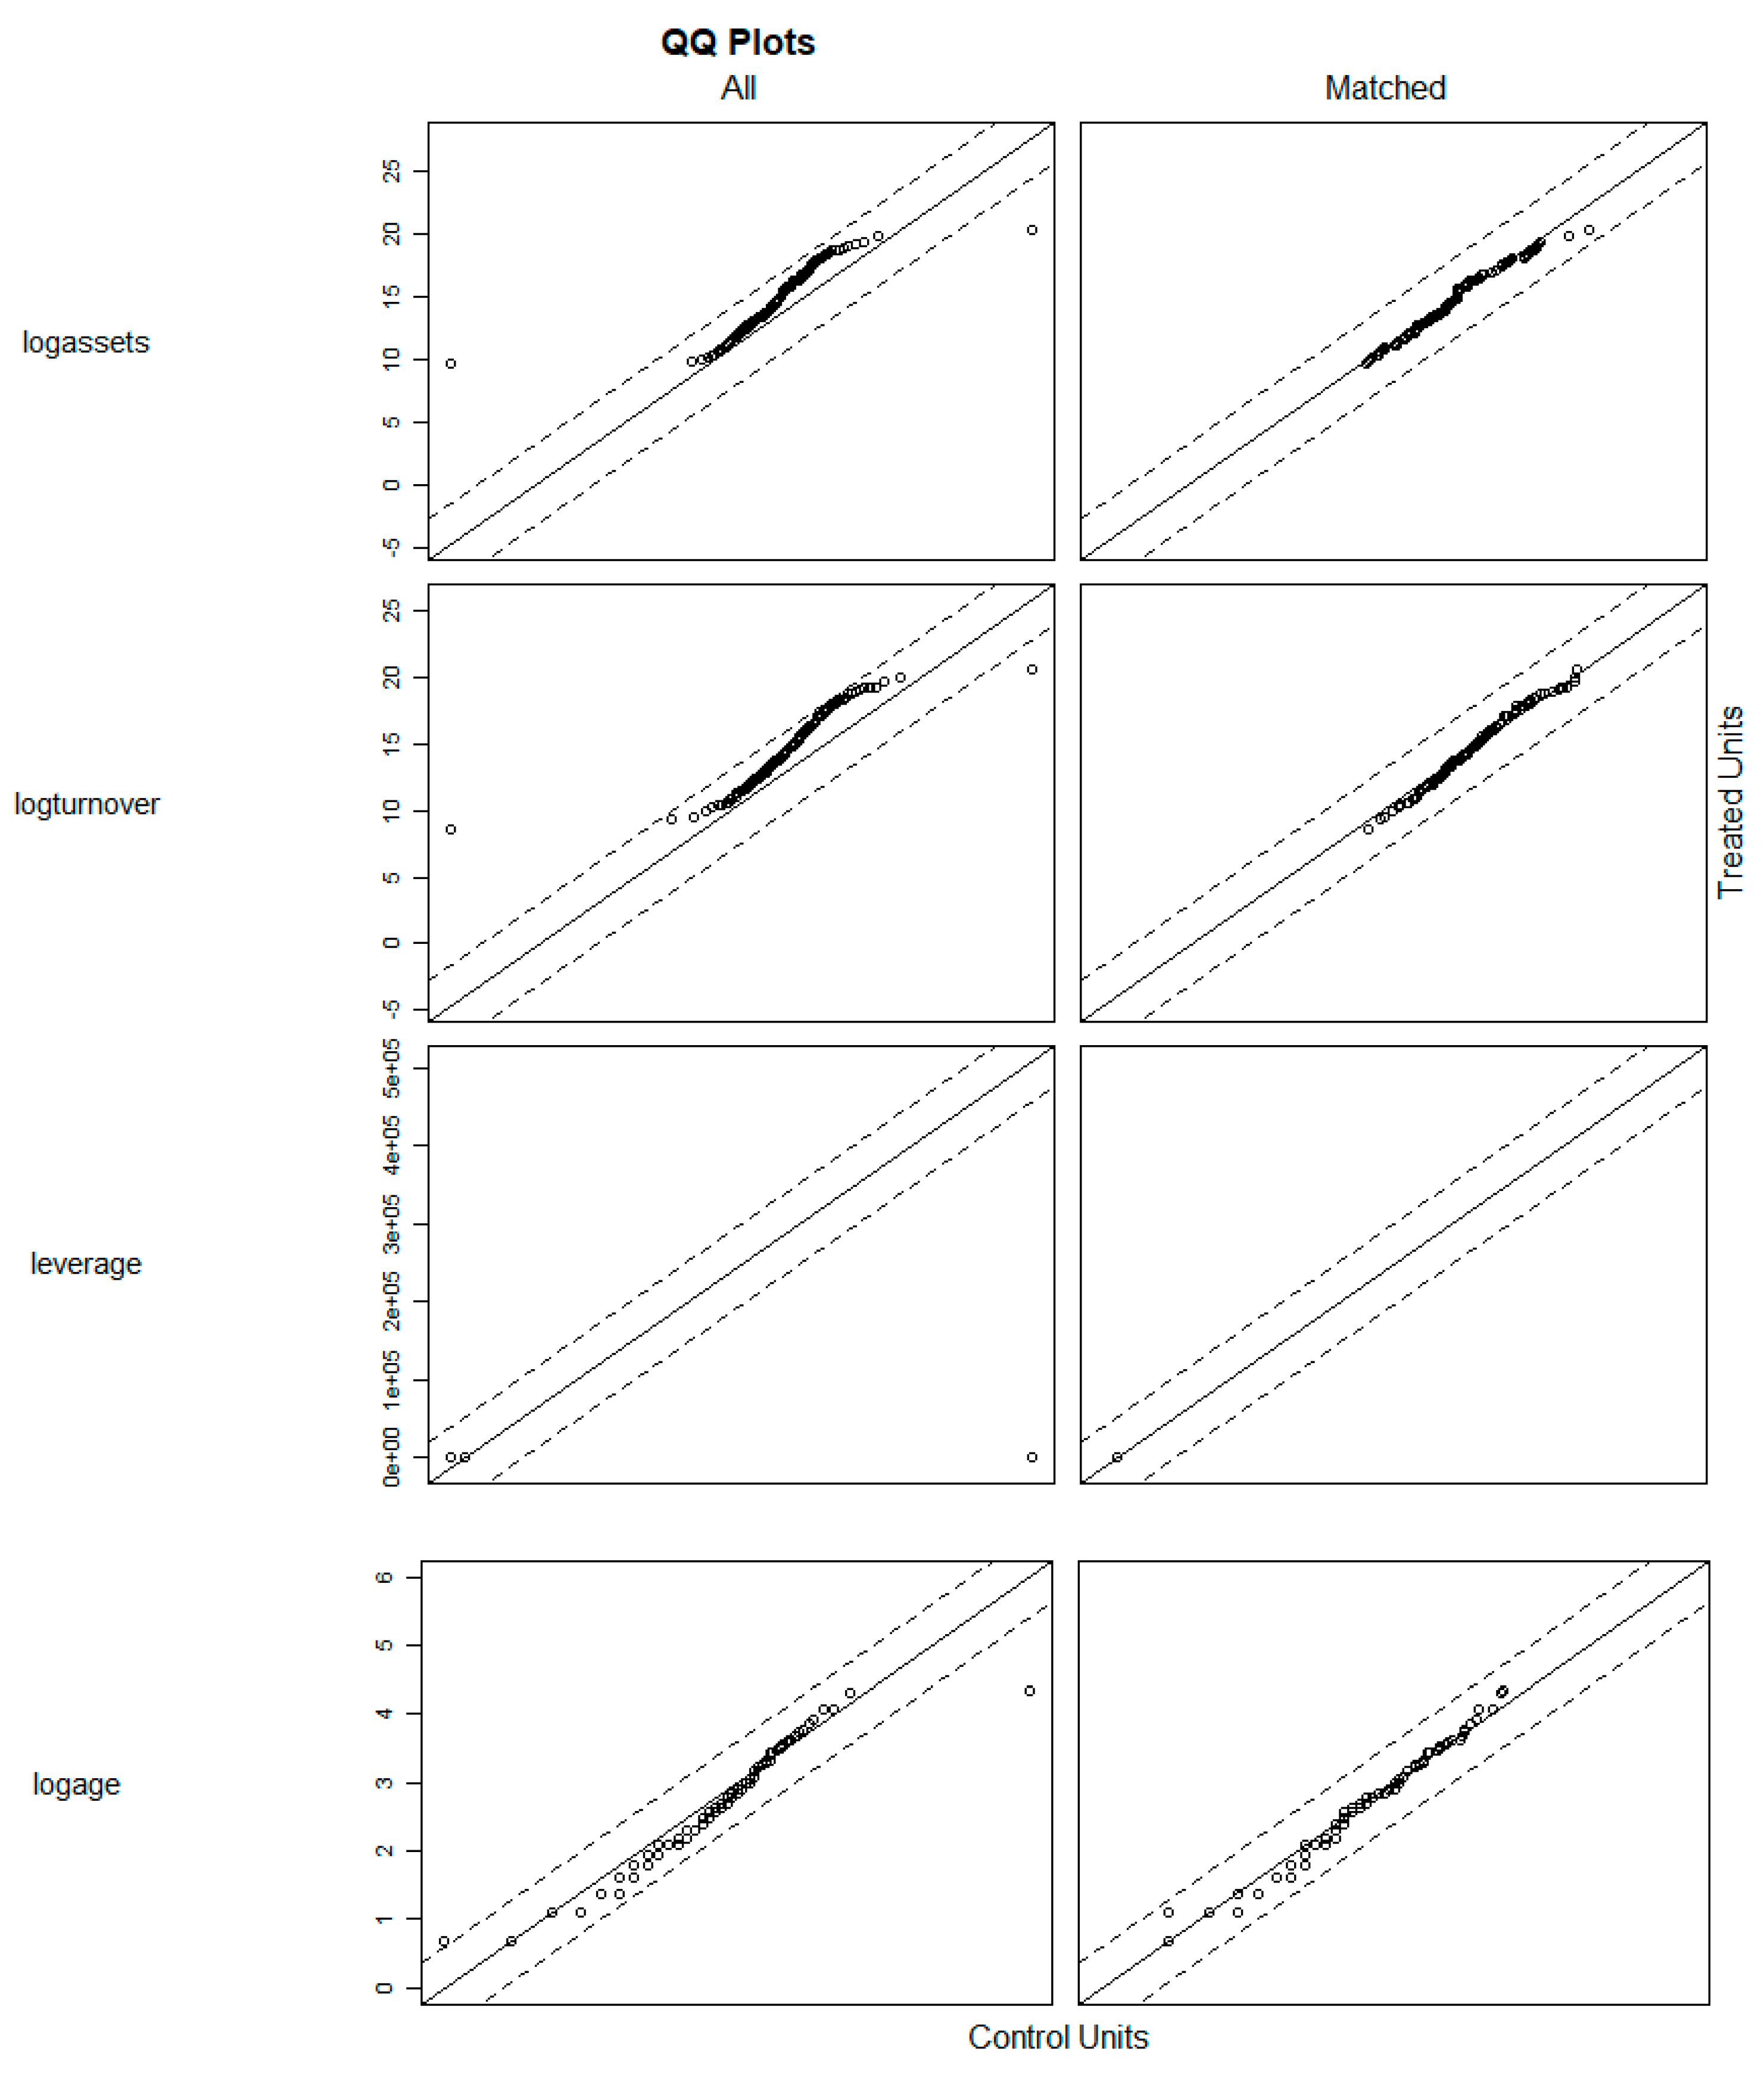
3.1.2. Propensity Score Matching

A non-parametric approach often used to assess treatment effects is matching on observable characteristics that might affect both the decision to opt into a treatment and the outcome variable. However, when matching on several continuous variables, it might become challenging, if not impossible, to find an exact match on all dimensions for each treated firm. PSM is a technique that tries to overcome this ‘curse of dimensionality’ by transforming the problem of matching on multiple dimensions to a unidimensional concept [41].
In the first stage of the PSM procedure, a logit regression is estimated in which the dependent binary variable reflects whether a firm is treated or not and the independent variables are observable characteristics (based on data of the year preceding treatment). We select a set of firm characteristics that potentially impact both the decision to certify and the outcome variable turnover growth. Firstly, we control for size as B Corp certification is especially popular among small and medium-sized companies [42,43]. In addition, previous research has shown that firm size is associated with growth rate [44,45,46]. We include two operational measures of Size, i.e., the natural logarithms of total assets and turnover. Secondly, we account for firm age, as B Corps are typically young [47] and a relationship between firm age and growth has been empirically shown [46,48,49]. Age is measured by the natural logarithm of the firm age in years plus one. Thirdly, Leverage, calculated as total debt, divided by total assets, is included in the logit regression. For-profit companies with a social purpose often have lower leverage ratios than commercial enterprises [50]. At the same time, leverage has been shown to be associated with firm growth [51,52].
The binary dependent variable of this regression takes a value of 1 if the observation concerns a company that will obtain a B Corp certificate in the following year and a value of 0 if the observation concerns a company that is part of the universe of potential controls. Treated firms are only included for one year, i.e., the year before the certification year, when estimating the logit regression. The predicted dependent variables from this regression reflect the propensity scores (PS), i.e., estimated probabilities that firms obtain treatment of both the sample of treated firms and the universe of potential control firms.
In a second stage, we perform 1-on-1 nearest neighbor matching in which each treated company is matched with the untreated control company with the nearest PS. Hence, the different dimensions on which the matching is performed are captured by a single index. In our matching procedure, we also request an exact match on the observation year as well as on country and industry (based on NACE 2 Rev. 3-digit score) as we wish for both the control and the treated firms to be subject to the same macroeconomic and institutional environment, which might affect the outcome variable of the DiD analysis. Moreover, several researchers have identified country- and industry-specific characteristics that may encourage companies to pursue certification [33,53,54]. Hence, the aim is to find matched pairs of firm–year observations of treated companies and non-treated companies from the same observation year, active in the same industry and country with the closest PS. We restricted our sample to firms that fall within the area of common support, meaning that we delete all observations with a PS larger than the smallest maximum and smaller than the largest minimum of both sub-samples, i.e., treatment observations and control group. Given that the universe of potential controls is much larger than the number of B Corps for which we try to find a match, we do not allow replacement of the controls, nor do we impose a caliper width.

3.1.3. Difference-in-Differences Analysis

There are unobservable company characteristics that conceivably affect both the decision to obtain B Corp certification and turnover growth, one of these being the sustainable nature of a company. Although, a priori, the allocation to the treatment among control and treated firms cannot be considered completely random, we can still estimate the effect of the treatment by conducting a DiD analysis to estimate the treatment effect [39]. In this DiD analysis, the average change over time of the outcome variable for the treatment group is compared with the average change over time for the matched control group. The DiD method allows us to eliminate both biases arising from time trends that are unrelated to the treatment and permanent differences in characteristics between the treated and the control firms.
To verify Hypothesis 1, we estimate a multivariate panel data regression, where we regress turnover growth on a dummy variable indicating certification, combined with a set of control variables. More precisely, we estimate the following regression model:
G r o w t h i , t = β i + β t + β j + β 1 C e r t i f i e d i , t + β 2 ln ( T u r n o v e r ) i , t 1 + β 3 ( ln ( T u r n o v e r ) i , t 1 ) 2 + β 4 ln ( A g e ) i , t 1 + β 5 ( ln ( A g e ) i , t 1 ) 2 + β 6 [ ln ( T u r n o v e r ) i , t 1 × ln ( A g e ) i , t 1 ] + β 7 L e v e r a g e i , t 1 + ε i , t
with subscripts i and t representing, respectively, firms and years, the latter ranging from 2012 to 2019, and j representing time relative to the treatment year (ranging from −6 to 5), i.e., the year in which the (matched) B Corp obtains certification. Hence, βi, βt and βj represent firm fixed effects, year fixed effects and fixed effects reflecting time relative to the treatment. Including these fixed effects allows us to eliminate permanent differences in characteristics between the treated and the control firms, as well as biases arising from time trends that are unrelated to the treatment, i.e., obtaining B Corp certification.
The independent variable Growth is calculated as follows:
G r o w t h i , t = ln ( T u r n o v e r i , t ) ln ( T u r n o v e r i , t 1 )
The DiD term Certified is our variable of interest and is calculated as follows:
C e r t i f i e d i , t = [ T r e a t m e n t i × P o s t t ]
with Treatmenti indicating whether firm i is part of the treatment group (value 1) or the control group (value 0). The indicator variable Postt takes a value of 1 for observations of both the treated firms and their matched counterparts in the year of or after treatment, i.e., if, at year-end, the (matched) B Corp is certified, and a value of 0 otherwise. Hence, the indicator variable Certifiedi,t takes a value of 1 if the observation concerns a company that is certified as a B Corp during that year or was already certified earlier. The variables Treatmenti and Postt are not included as such in the regression equation as these are captured by the fixed effects.
We also include a set of time-varying and firm-specific control variables that often appear in the firm growth literature [44,46,49]. Firstly, the natural logarithm of Turnover, lagged by one year, is included in the regression equation to account for the effect of firm size on growth. Various empirical studies documented a negative relation between size and firm growth [44,45,46], contradicting Gibrat’s ‘Law of Proportionate Effect’, which states that, in a given industry, growth rates are independent of size. Secondly, we include the lagged value of company Age, measured as the natural logarithm of years since incorporation plus one. The empirical evidence on the association between age and growth is mixed. On the one hand, customer awareness and firm reputation can strengthen over time, resulting in a positive association between growth and age. This reasoning is supported by several empirical studies [48,49]. On the other hand, Jovanovic’s [55] ‘learning model’ argues that firms learn about their efficiency once they are operating, providing young firms with more opportunities to tackle inefficiencies. In support of this model, Evans [46] found a negative relationship between growth and age. Quadratic terms of size and age ((ln(Turnover))2 and ((ln(Age))2 as well as an interaction term (ln(Turnover) x ln(Age)) are included in the model to control for the non-linearities that have been demonstrated in preceding studies [44,46]. Finally, the lagged value of Leverage, measured as total debt divided by total assets, is included in the analysis. Positive as well as negative effects of leverage on firm growth are possible. Higher degrees of leverage might be associated with faster growth because of the increased ability to invest [51]. However, high leverage could also impede additional financing [52].
To verify Hypothesis 2, we make a slight adjustment to Equation (1), resulting in the following regression equation:
G r o w t h i , t = β i + β t + β j + β 1   C e r t i f i e d i , t + β 2   C e r t i f i e d i , t × Y e a r s T o T r e a t m e n t i , t + β 3   T r e a t m e n t t × Y e a r s T o T r e a t m e n t i , t + β 4 ln ( T u r n o v e r ) i , t 1 + β 5 ( ln ( T u r n o v e r ) i , t 1 ) 2 + β 6 ln ( A g e ) i , t 1 + β 7 ( ln ( A g e ) i , t 1 ) 2 + β 8 [ ln ( T u r n o v e r ) i , t 1 × ln ( A g e ) i , t 1 ] + β 9 L e v e r a g e i , t 1 + ε i , t
To assess the time-varying effect of certification, we create a discrete variable YearsToTreatment ranging from −6 to +5, representing the number of years before or since certification. By including the interaction between Certified, i.e., Treatment × Post, and YearsToTreatment, and inspecting its coefficient, we can estimate how the effect of certification evolves over time. Hence, the coefficient β2 reflects the yearly change in the effect of certification. For completeness, we should also include lower-order interactions, Post × YearsToTreatment, Treatment × YearsToTreatment and the main effect YearsToTreatment in the regression equation. However, YearsToTreatment and Post × YearsToTreatment are dropped as these are captured by the fixed effects representing the observation year and time relative to treatment.

3.2. Sample Selection and Data Collection

To obtain a list of European companies that attained B Corp certification, we consulted the B Corp Impact Data that are provided by B Lab on the data.world website (https://data.world/blab/b-corp-impact-data, accessed on 30 April 2020). This database contains information on the certification dates, certification cycles and publicly accessible BIA scores, together with basic information on the companies that were or are certified. At the moment of data collection (April 2020), 756 European companies were granted a B Corp certificate at a certain point in time. To collect financial data on these companies, the companies in B Lab’s database were manually linked with those in the Orbis Europe database using the company name, country and city. If available in both databases, companies’ industries and websites were also used to ensure the quality of the linking procedure. This manual linking process was independently conducted by one of the authors and one of the authors’ Master’s thesis students. Companies for which discrepancies between both coders were found were further discussed until a consensus was reached. Companies for which no unambiguous link was possible were left out of the analysis. In total, 736 B Corps were linked to the Orbis Europe database in this way. In the next step, we excluded companies which had less than four years of available financial accounts or had no known value for Turnover, Total Assets or (Non-)Current Liabilities for at least one year between 2011 and 2019. After eliminating these companies, 287 B Corps could potentially be used for the DiD analysis.
Potential control companies that were selected for the PSM procedure were obtained from the Orbis Europe database. We restricted the universe of potential controls to companies that were active in the same industry (based on NACE 2 Rev. 3-digit code) and country combination of at least 1 of the 287 candidate treatment firms and had—similarly to the potential treatment group—sufficient data on the required financial variables. In order to reduce overlap in data from treatment and control firms, we excluded all firms which have obtained B Corp certification up to April 2020 from the sample of potential control firms.
After selecting the potential treatment and control companies, we requested the financial variables on these firms that were required for the PSM procedure and the DiD regression for the financial years 2011 up to 2019. To prepare the sample for the matching and DiD procedure, firm-years whose financial reporting period was different from one year or had missing data for one or more variables were excluded from the sample. The sample years for the matching procedure were bound by the years that European firms obtained B Corp certificates. In 2012, the first B Corp certificates were granted; however, we had insufficient data on these firms. Hence, 2011 was not included as a sample year for the matching procedure. Similarly, as we only had access to data up to 2019, the last year in which we matched B Corps was 2017; for firms that obtained their certification in 2019 or 2020, we lacked post-treatment data. After the matching procedure was conducted, observations regarding non-matched firms were dropped.
For the DiD analysis, we used all data on the matched firms from financial years 2011 to 2019; however, we excluded firm-year observations of B Corps and their matched counterparts if the company was no longer certified in that year—for instance, because the certification was not renewed. Likewise, observations of pairs were excluded if, for that year, the matched firm had missing values for one or more variables of the regression equation. Lastly, we excluded observations if there was no pre- or post-treatment observation for either the treatment or control firm. To mitigate the effect of outliers on the DiD regression results, we winsorized all continuous variables at the 2.5 and 97.5 percentile.

4. Results

4.1. Propensity Score Matching

The sample that was used for the matching procedure consisted of 2,995,223 observations of potential control firms and 147 observations of treated firms, both covering the years 2012 to 2017. (Each firm that had obtained B Corp certification was included in the matching procedure once, i.e., the year before it obtained certification. Potential control firms were included for each year that they had sufficient data to estimate the PS.) After estimating the PS, 91,597 observations of potential control firms were discarded from the sample when performing the nearest-neighbor matching, as their PS did not fall within the area of common support.
To assess the quality of the matching procedure, we examined whether the covariates we had matched on were balanced by comparing the distribution of these variables among both groups. Table 1 shows the mean value of each covariate for the treated and control group before and after matching. The standardized mean differences indicate that there are no signs of imbalance, as none of the absolute values of the matched sample exceed the threshold value of 0.25 [56]. Figure 2 provides the empirical quantile–quantile plot of each continuous covariate to check the balance of the marginal distributions. The closer the datapoints are to the 45° line, the more identical the marginal distributions [57]. Hence, the QQ plots of the matched sample also do not show any signs of imbalance. To conclude, the results from Table 1 and Figure 2 indicate that the quality of the matching procedure is satisfactory.

4.2. Difference-in-Differences Analysis

4.2.1. Descriptive Statistics

Table 2 provides the descriptive statistics of the variables on the 1362 firm-year observations (on 258 companies) in the DiD regression model. The difference in the number of matched companies and companies that were included in the final DiD analysis was the result of dropping pairs that lacked a post-treatment measurement. Consistent with our sampling strategy, half of the firm-year observations concerned companies that had been a B Corp for at least one year during the sample period, while the other half concerned matched control firms that had never obtained B Corp certification. The average firm in our sample generated a turnover of EUR 2.05 million and a growth rate of 11.47%. On average, the companies that we studied were 10 years old and financed 65.2% of their assets with debt.

4.2.2. Correlations

Table 3 shows the pairwise correlations of the variables included in the regression analysis. There is a small positive correlation between the variables of interest Certified and Growth; however, this correlation is insignificant. As the independent variables are only moderately correlated, there are no signs of serious multicollinearity issues.

4.2.3. Regression Analysis

The regression results are presented in Table 4. The coefficients were estimated using the Ordinary Least Squares method and the standard errors are clustered at firm level, which provides consistent estimates in the presence of serially correlated and heteroscedastic residuals [58]. In line with expectations, the estimation results of both Equations (1) and (4) show a moderately significant negative association between size (represented by Turnover) and Growth. This implies that smaller firms grow faster. Consistent with Evans [46], there is a statistically significant negative association between Age and Growth in both analyses. Moreover, as reflected in the coefficient of the squared age term, this relationship is convex. In regression (a), the coefficient of our variable of interest, Certified, is positive and highly significant. This result supports Hypothesis 1, stating that turnover growth is positively affected by B Corp certification. The estimation results from regression (b) indicate that time has a positive effect on the association between B Corp certification and growth. Hence, these results support Hypothesis 2.

4.2.4. Parallel Trend Assumption

The validity of the results of the DiD analysis critically depends on the parallel trend assumption, the plausibility of which has increased by matching the treatment and control firms based on observable pre-treatment characteristics. Since we have data on several years before the treatment, we can check whether the parallel trend assumption is not violated. As the treatment year differs across treatment firms and we also control for time-varying variables, visual inspection of the pre-treatment trends of the outcome variable is not straightforward [39]. An intuitive method that could help in assessing the parallel trend assumption was adopted by Autor [59]: by including the leads and lags of the treatment indicator instead of the single treatment indicator (Certifiedi,t) in Equation (1), i.e., interacting the dummy variables representing the time relative to the treatment (βj) with the indicator variable Treatmenti, it is possible to check whether the parallel trend assumption holds. The results of this test are presented in Table 5. The coefficients of these interactions represent the effect difference between the treated and control firms relative to the year of matching.
If the parallel trend assumption holds, one would expect the coefficients of the leads of the treatment indicator to be zero [39]. In particular, the coefficients of the interactions between the Treatment variable and the dummies representing the years prior to the year that certification was obtained should not differ significantly from zero. As shown in Table 5, none of the leads of the treatment indicator (T − 6 to T − 1) differ significantly from zero at conventional significance levels. This strengthens the validity of the parallel trend assumption.
In their works, Parker et al. [9] as well as Paelman et al. [18] also conduct a DiD analysis; however, they only compare one year prior to certification and one post-certification. Hence, in our study, the coefficient of T + 1 × Treatmenti is eligible for comparison with the two aforementioned studies. While this coefficient is significantly positive, Parker et al. [9] document a negative effect one year post-certification (compared to the year prior to certification). Paelman et al. [18], on the other hand, report a positive effect. The effect size in the present study is also positive; however, it is larger.

5. Discussion

In this study, we investigate the effect of B Corp certification on the growth rates of European sustainable companies and also study the evolution of this effect over time. In line with Chauhan and O’Neill [4], we argue that, due to the rigorous nature of the B Corp certification procedure, the certificate provides a credible signal of sustainability to external stakeholders, and the audit procedure invokes a process of internal change that helps the sustainable enterprise to internally align with its dual nature. Moreover, the BIA tool and its indicators can support companies in their decision-making processes and planning and control systems [34]. Using DiD estimation on a matched sample of 258 firms, our results show that B Corp certification has a positive impact on turnover growth and that this impact increases over time.

5.1. Contributions to the Literature

While sustainable enterprises have increased in popularity and prevalence, knowledge on the factors that determine their success is scarce [1]. Some prior studies [16,17] show that B Corps experience higher turnover growth rates than their non-B Corp competitors, but these studies are not able to disentangle the extent to which the observed changes in growth are due to the sustainable nature of the companies or to the B Corp certification per se. Paelman et al. [18] and Parker et al. [9] attempt to investigate the effect of certification per se, but they limit their investigation to the short-term effect, i.e., one year post-certification. While Paelman et al. [18] conclude that B Corp certification significantly contributes to this higher turnover growth, Parker et al. [9] conclude that there is a negative effect for small and young firms, explaining their findings by the drain on company resources from the certification audit procedure. In comparison to these previous empirical papers, the main contribution of our paper lies in the richness of the dataset and the sophistication of the sampling and estimation procedure that we use, which allows us to (1) separate the effect of certification from the effect of the sustainable character of the firm and (2) to examine the effects at a longer-term scale and gauge the evolution from certification over the time since certification. Moreover, within the broader stream of research on hybrid organizing, there is a knowledge gap regarding conditions under which companies can successfully pursue conflicting objectives and secure a competitive advantage [21]. In addition, knowledge on how the resource requirements of hybrid organizations are satisfied is scarce [21]. Our findings add to this stream of literature by concluding that companies that choose to actively monitor and secure their non-financial mission by obtaining B Corp certification might benefit from this financially. Certification could generate an inward flow of resources in the form of turnover, which could in turn be reinvested in the social and environmental mission of the company [21].

5.2. Implications for Practice

Our study contains very relevant information for prospective B Corp candidates and B Lab. The positive short- and medium-term effects reported in this study might persuade companies that are uncertain about the financial impact of obtaining such a certificate. Sustainable companies might use B Corp certification as part of a market differentiation strategy. For some companies, strategic growth and scaling of the business might enable them to maximize their societal/environmental impact as well [21,60], while others opt to remain small to avoid compromises and demands that are associated with growth [60]. Hence, given the conclusions of our study regarding the growth implications of obtaining B Corp certification, sustainable companies can take into account whether they have the resources and capacity to grow and whether this would contribute to their social/environmental impact [24].
B Lab might further inform prospective candidates and B Corps about the generally rewarding effect of their certification on turnover growth.

6. Concluding Remarks

We have investigated the short- to medium-term effects of B Corp certification on financial success in terms of turnover growth and found a positive effect that increases with the time since certification. Our research suggests that B Corp certification might serve as a credible signal of the sustainable nature of the company and mitigate internal tensions, resulting in positive effects on financial growth.
This study also has some limitations. Firstly, our study only focuses on one type of sustainability certification, while the effect of other certification types might differ. Other studies might consider the effects of other certification types. Secondly, as the B Corp certificate is rather young (especially in Europe), we could only look at the short- to medium-term effects of B Corp certification (up to 5 years post-certification). Further research might focus on the longer-term effects. In order to do so, one would have to examine a sample of companies that are active in countries where the B Corp certificate is more mature or collect data at a later point in time. Thirdly, the institutional context might affect the observed effects. To assess this potential impact, future studies could focus on other geographical areas or explicitly examine the impact of institutional settings.

Author Contributions

Conceptualization, V.P., P.V.C. and H.V.B.; methodology, V.P., P.V.C. and H.V.B.; software, V.P.; validation, V.P., P.V.C. and H.V.B.; formal analysis, V.P., P.V.C. and H.V.B.; investigation, V.P., P.V.C. and H.V.B.; resources, V.P.; data curation, V.P.; writing—original draft preparation, V.P.; writing—review and editing, V.P., P.V.C. and H.V.B.; supervision, P.V.C. and H.V.B.; project administration, V.P., P.V.C. and H.V.B. All authors have read and agreed to the published version of the manuscript.

Funding

This work was supported by Hercules Foundation, grant number AUGE/17/01.

Institutional Review Board Statement

Not applicable.

Informed Consent Statement

Not applicable.

Data Availability Statement

Data sharing not applicable.

Conflicts of Interest

The authors declare no conflict of interest.

References

  1. Saebi, T.; Foss, N.J.; Linder, S. Social Entrepreneurship Research: Past Achievements and Future Promises. J. Manag. 2018, 45, 70–95. [Google Scholar] [CrossRef]
  2. Haigh, N.; Walker, J.; Bacq, S.; Kickul, J. Hybrid Organizations: Origins, Strategies, Impacts, and Implications. Calif. Manag. Rev. 2015, 57, 5–12. [Google Scholar] [CrossRef] [Green Version]
  3. Muñoz, P.; Kimmitt, J. Social mission as competitive advantage: A configurational analysis of the strategic conditions of social entrepreneurship. J. Bus. Res. 2019, 101, 854–861. [Google Scholar] [CrossRef]
  4. Chauhan, Y.; O’Neill, H.M. Strategic Advantages through Social Responsiveness: The Case of Certified B-Corps; SSRN: Rochester, NY, USA, 2020. [Google Scholar] [CrossRef]
  5. Hynes, B. Growing the social enterprise—Issues and challenges. Soc. Enterp. J. 2009, 5, 114–125. [Google Scholar] [CrossRef]
  6. Moratis, L. Signalling Responsibility? Applying Signalling Theory to the ISO 26000 Standard for Social Responsibility. Sustainability 2018, 10, 4172. [Google Scholar] [CrossRef] [Green Version]
  7. B Lab. A Global Community of Leaders. Available online: https://bcorporation.net (accessed on 26 May 2021).
  8. B Lab. About B Corps. Available online: https://bcorporation.net/about-b-corps (accessed on 24 November 2020).
  9. Parker, S.C.; Gamble, E.N.; Moroz, P.W.; Branzei, O. The Impact of B Lab Certification on Firm Growth. Acad. Manag. Discov. 2019, 5, 57–77. [Google Scholar] [CrossRef]
  10. Conger, M.; McMullen, J.S.; Bergman, B.J.; York, J.G. Category membership, identity control, and the reevaluation of prosocial opportunities. J. Bus. Ventur. 2018, 33, 179–206. [Google Scholar] [CrossRef]
  11. Gamble, E.N.; Parker, S.C.; Moroz, P.W. Measuring the Integration of Social and Environmental Missions in Hybrid Organizations. J. Bus. Ethics 2020, 167, 271–284. [Google Scholar] [CrossRef] [Green Version]
  12. Moroz, P.W.; Gamble, E.N. Business model innovation as a window into adaptive tensions: Five paths on the B Corp journey. J. Bus. Res. 2021, 125, 672–683. [Google Scholar] [CrossRef]
  13. Muñoz, P.; Cacciotti, G.; Cohen, B. The double-edged sword of purpose-driven behavior in sustainable venturing. J. Bus. Ventur. 2018, 33, 149–178. [Google Scholar] [CrossRef] [Green Version]
  14. Sharma, G.; Beveridge, A.J.; Haigh, N. A configural framework of practice change for B corporations. J. Bus. Ventur. 2018, 33, 207–224. [Google Scholar] [CrossRef]
  15. Villela, M.; Bulgacov, S.; Morgan, G. B Corp Certification and Its Impact on Organizations Over Time. J. Bus. Ethics 2021, 170, 343–357. [Google Scholar] [CrossRef]
  16. Chen, X.; Kelly, T.F. B-Corps—A Growing Form of Social Enterprise. J. Leadersh. Organ. Stud. 2015, 22, 102–114. [Google Scholar] [CrossRef]
  17. Romi, A.; Cook, K.A.; Dixon-Fowler, H.R. The influence of social responsibility on employee productivity and sales growth. Sustain. Account. Manag. Policy J. 2018, 9, 392–421. [Google Scholar] [CrossRef]
  18. Paelman, V.; Van Cauwenberge, P.; Bauwhede, H.V. Effect of B Corp Certification on Short-Term Growth: European Evidence. Sustainability 2020, 12, 8459. [Google Scholar] [CrossRef]
  19. Toffel, M.W. Voluntary Environmental Management Initiatives: Smoke Signals or Smoke Screens? Ph.D. Thesis, University of California, Berkeley, CA, USA, 2005. [Google Scholar]
  20. Ye, Y.; Yeung, A.C.; Huo, B. Maintaining stability while boosting growth? The long-term impact of environmental accreditations on firms’ financial risk and sales growth. Int. J. Oper. Prod. Manag. 2020, 40, 1829–1856. [Google Scholar] [CrossRef]
  21. Doherty, B.; Haugh, H.; Lyon, F. Social Enterprises as Hybrid Organizations: A Review and Research Agenda. Int. J. Manag. Rev. 2014, 16, 417–436. [Google Scholar] [CrossRef] [Green Version]
  22. Dufays, F. Exploring the drivers of tensions in social innovation management in the context of social entrepreneurial teams. Manag. Decis. 2019, 57, 1344–1361. [Google Scholar] [CrossRef]
  23. Yin, J.; Chen, H. Dual-goal management in social enterprises: Evidence from China. Manag. Decis. 2019, 57, 1362–1381. [Google Scholar] [CrossRef]
  24. Austin, J.; Stevenson, H.; Wei–Skillern, J. Social and Commercial Entrepreneurship: Same, Different, or Both? Entrep. Theory Pract. 2006, 30, 1–22. [Google Scholar] [CrossRef] [Green Version]
  25. Park, K. B the Change: Social Companies, B Corps, and Benefit Corporations. Ph.D. Thesis, Princeton University, Princeton, NJ, USA, 2018. [Google Scholar]
  26. Lee, M.; Jay, J. Strategic Responses to Hybrid Social Ventures. Calif. Manag. Rev. 2015, 57, 126–147. [Google Scholar] [CrossRef]
  27. Bianchi, C.; Reyes, V.; Devenin, V. Consumer motivations to purchase from benefit corporations (B Corps). Corp. Soc. Responsib. Environ. Manag. 2020, 27, 1445–1453. [Google Scholar] [CrossRef]
  28. Fosfuri, A.; Giarratana, M.; Roca, E. Social Business Hybrids: Demand Externalities, Competitive Advantage, and Growth Through Diversification. Organ. Sci. 2016, 27, 1275–1289. [Google Scholar] [CrossRef]
  29. Rowley, T.; Berman, S. A Brand New Brand of Corporate Social Performance. Bus. Soc. 2000, 39, 397–418. [Google Scholar] [CrossRef]
  30. Kim, M.; Kim, J. Corporate social responsibility, employee engagement, well-being and the task performance of frontline employees. Manag. Decis. 2020. ahead of print. [Google Scholar] [CrossRef]
  31. Connelly, B.L.; Certo, S.T.; Ireland, R.D.; Reutzel, C.R. Signaling Theory: A Review and Assessment. J. Manag. 2010, 37, 39–67. [Google Scholar] [CrossRef]
  32. Bergh, D.D.; Connelly, B.L.; Ketchen, D.J.; Shannon, L.M. Signalling Theory and Equilibrium in Strategic Management Research: An Assessment and a Research Agenda. J. Manag. Stud. 2014, 51, 1334–1360. [Google Scholar] [CrossRef]
  33. Cao, K.; Gehman, J.; Grimes, M.G. Standing out and fitting in: Charting the emergence of Certified B Corporations by industry and region. In Hybrid Ventures; Emerald Publishing Limited: Bingley, UK, 2017; pp. 1–38. [Google Scholar]
  34. Nigri, G.; Del Baldo, M. Sustainability Reporting and Performance Measurement Systems: How do Small- and Medium-Sized Benefit Corporations Manage Integration? Sustainability 2018, 10, 4499. [Google Scholar] [CrossRef] [Green Version]
  35. B Lab. B Impact Report. Available online: https://bcorporation.net/directory/sep-jordan (accessed on 26 November 2020).
  36. B Lab. Certification. Available online: https://bcorporation.net/certification (accessed on 5 June 2020).
  37. Havnes, P.-A.; Senneseth, K. A Panel Study of Firm Growth among SMEs in Networks. Small Bus. Econ. 2001, 16, 293–302. [Google Scholar] [CrossRef]
  38. Mauboussein, M.J. The True Measures of Success; Harvard Business Review: Cambridge, MA, USA, 2012. [Google Scholar]
  39. Pischke, J.S. Empirical Methods in Applied Economics: Lecture Notes; MIT: Cambridge, MA, USA, 2005. [Google Scholar]
  40. Heckman, J.J.; Ichimura, H.; Todd, P.E. Matching as an Econometric Evaluation Estimator: Evidence from Evaluating a Job Training Programme. Rev. Econ. Stud. 1997, 64, 605–654. [Google Scholar] [CrossRef]
  41. Rosenbaum, P.R.; Rubin, D.B. The central role of the propensity score in observational studies for causal effects. Biometrika 1983, 70, 41–55. [Google Scholar] [CrossRef]
  42. Harjoto, M.; Laksmana, I.; Yang, Y.-W. Why do companies obtain the B corporation certification? Soc. Responsib. J. 2019, 15, 621–639. [Google Scholar] [CrossRef]
  43. Wilburn, K.; Wilburn, R. The double bottom line: Profit and social benefit. Bus. Horiz. 2014, 57, 11–20. [Google Scholar] [CrossRef]
  44. Almus, M.; Nerlinger, E.A. Growth of New Technology-Based Firms: Which Factors Matter? Small Bus. Econ. 1999, 13, 141–154. [Google Scholar] [CrossRef]
  45. Becchetti, L.; Trovato, G. The Determinants of Growth for Small and Medium Sized Firms. The Role of the Availability of External Finance. Small Bus. Econ. 2002, 19, 291–306. [Google Scholar] [CrossRef]
  46. Evans, D.S. Tests of Alternative Theories of Firm Growth. J. Political Econ. 1987, 95, 657–674. [Google Scholar] [CrossRef]
  47. B Lab. B Corp Index Report 2012; B Lab: Berwyn, PA, USA, 2012. [Google Scholar]
  48. Das, S. Size, age and firm growth in an infant industry: The computer hardware industry in India. Int. J. Ind. Organ. 1995, 13, 111–126. [Google Scholar] [CrossRef]
  49. Heshmati, A. On the Growth of Micro and Small Firms: Evidence from Sweden. Small Bus. Econ. 2001, 17, 213–228. [Google Scholar] [CrossRef]
  50. Siqueira, A.C.O.; Guenster, N.; Vanacker, T.; Crucke, S. A longitudinal comparison of capital structure between young for-profit social and commercial enterprises. J. Bus. Ventur. 2018, 33, 225–240. [Google Scholar] [CrossRef] [Green Version]
  51. Huynh, K.P.; Petrunia, R.J. Age effects, leverage and firm growth. J. Econ. Dyn. Control 2010, 34, 1003–1013. [Google Scholar] [CrossRef]
  52. Lang, L.; Ofek, E.; Stulz, R. Leverage, investment, and firm growth. J. Financ. Econ. 1996, 40, 3–29. [Google Scholar] [CrossRef] [Green Version]
  53. Hickman, L.; Byrd, J.; Hickman, K. Explaining the Location of Mission-Driven Businesses: An Examination of B-Corps. J. Corp. Citizsh. 2014, 2014, 13–25. [Google Scholar] [CrossRef]
  54. Lacmanovic, S.; Milec, D. The relevance and distribution of certified B Corporations in the European Union economy. In Proceedings of the Economic and Social Development: 36th International Scientific Conference on Economic and Social Development—“Building Resilient Society”: Book of Proceedings, Zagreb, Croatia, 14 December 2016; pp. 337–346. [Google Scholar]
  55. Jovanovic, B. Selection and the Evolution of Industry. Econometrica 1982, 50, 649. [Google Scholar] [CrossRef]
  56. Stuart, E.A. Matching Methods for Causal Inference: A Review and a Look Forward. Stat. Sci. 2010, 25, 1–21. [Google Scholar] [CrossRef] [PubMed] [Green Version]
  57. Ho, D.E.; Imai, K.; King, G.; Stuart, E.A. MatchIt: Nonparametric Preprocessing for Parametric Causal Inference. J. Stat. Softw. 2011, 42, 1–28. [Google Scholar] [CrossRef] [Green Version]
  58. StataCorp LLC. Stata Statistical Software: Release 15; StataCorp LLC: College Station, TX, USA, 2017. [Google Scholar]
  59. Autor, D.H. Outsourcing at Will: The Contribution of Unjust Dismissal Doctrine to the Growth of Employment Outsourcing. J. Labor Econ. 2003, 21, 1–42. [Google Scholar] [CrossRef] [Green Version]
  60. Vickers, I.; Lyon, F. Beyond green niches? Growth strategies of environmentally-motivated social enterprises. Int. Small Bus. J. Res. Entrep. 2012, 32, 449–470. [Google Scholar] [CrossRef]
Figure 1. Research procedure.
Sustainability 13 07191 g001
Figure 2. QQ-plots. The exact matching variables of country, NACE 2,3-digit sectors and year dummies omitted from graph for parsimony.
Sustainability 13 07191 g002
Table 1. Balance statistics , .
Before MatchingAfter Matching
Means TreatedMeans ControlSMDMeans TreatedMeans ControlSMD
Ln(Assets)14.452313.20350.522014.452314.5553−0.0431
Ln(Turnover)14.512212.90550.640114.512214.5689−0.0226
Leverage0.72242.2844−2.59510.72240.65420.1134
Ln(Age)2.33352.4810−0.17362.33352.3940−0.0712
Observations1472,995,223 147147
For variable definitions: see text. SMD = Standardized mean differences, defined as (µX|T = 1 − µX|T = 0)/sx|T = 1 [57]. The exact matching variables of country, NACE 2, 3-digit sectors and year dummies were omitted from the table for parsimony.
Table 2. Descriptive statistics .
MeanS.D.MinQ25MedianQ75Max
Growth0.11470.3741−0.7846−0.4260.06580.22701.3862
Treatment0.50.5002000.511
Post0.44640.497300011
Certified 0.22320.416500001
Ln(Turnover)14.53442.39509.900212.838114.363716.056119.4936
Ln(Age)2.43380.73421.09861.94592.39792.94443.8501
Leverage0.65170.26460.09680.46510.69370.84381.1950
For variable definitions: see text.
Table 3. Pairwise correlations .
n = 13621.2.3.4.5.
1. Growth1
2. Certified 0.02481
3. Ln(Turnover)−0.2168 ***0.02831
4. Ln(Age)−0.2900 ***0.0581 **0.5756 ***1
5. Leverage0.00880.01680.0635 **−0.0464 *1
For variable definitions: see text. ***, **, * indicate statistical significance at the 1%, 5% and 10% level, respectively.
Table 4. Regression results †, ‡.
(a) Hypothesis 1(b) Hypothesis 2
Expected SignDependent Variable
Turnover Growth
Dependent Variable
Turnover Growth
Test variables
Certifiedi,t+0.1430 ***
(0.0381)
0.0675 *
(0.0518)
Certifiedi,t × YearsToTreatmenti,t+ 0.0617 **
(0.0323)
Control variables
Treatmenti,t × YearsToTreatmenti,t? 0.0091
(0.0174)
Ln(Turnover)i,t−1-−0.3416 *
(0.2044)
−0.3429 *
(0.2006)
(Ln(Turnover)i,t−1)2?−0.0020
(0.0090)
−0.0020
(0.088)
Ln(Age)i,t−1?−0.9384 **
(0.4768)
−0.8674 *
(0.4705)
(Ln(Age)i,t−1)2?0.2423 *
(0.1289)
0.2359 *
(0.1285)
Ln(Turnover)i,t−1 × Ln(Age)i,t−1?0.0382
(0.0350)
0.0348
(0.0346)
Leveragei,t−1?−0.0724
(0.1035)
−0.0851
(0.1021)
Firm Fixed Effects YesYes
Year Fixed Effects YesYes
Time Fixed Effects YesYes
R-squared 0.3261 ***0.3317 ***
Observations 13621362
Number of firms 258258
For variable definitions: see text. Robust standard errors clustered by firm in parentheses. ***, **, * indicate statistical significance at the 1%, 5% and 10% level, respectively. The p-values of Certified and Certified × YearsToTreatment were calculated using a one-tailed t-test; for the other variables, a two-tailed t-test was conducted.
Table 5. Regression results †, ‡.
Expected SignDependent Variable
Turnover Growth
Test variables Coef.
T − 6 × Treatmenti?−0.1713(0.1466)
T − 5 × Treatmenti?0.0154(0.0901)
T − 4 × Treatmenti?−0.0101(0.0811)
T − 3 × Treatmenti?0.0100(0.0550)
T − 2 × Treatmenti?0.0275(0.0519)
T − 1 × Treatmenti = Base year
T0 × Treatmenti+0.1003 *(0.0525)
T + 1 × Treatmenti+0.1744 ***(0.0530)
T + 2 × Treatmenti+0.1695 **(0.0777)
T + 3 × Treatmenti+0.3348 ***(0.1177)
T + 4 × Treatmenti+0.6016 ***(0.1724)
T + 5 × Treatmenti+0.3923 ***(0.1188)
Control variables
Ln(Turnover)i,t−1-−0.3405 *(0.1992)
(Ln(Turnover)i,t−1)2?−0.0021(0.0088)
Ln(Age)i,t−1?−0.8718 *(0.4727)
(Ln(Age)i,t−1)2?0.2414 *(0.1302)
Ln(Turnover)i,t−1 × Ln(Age)i,t−1?0.0342(0.0343)
Leveragei,t−1?−0.0892(0.1014)
Firm Fixed Effects Yes
Year Fixed Effects Yes
Time Fixed Effects Yes
R-squared 0.3353 ***
Observations 1362
Number of firms 258
For variable definitions: see text. Robust standard errors clustered by firm in parentheses. ***, **, * indicate statistical significance at the 1%, 5% and 10% level, respectively. The p-values were calculated using a two-tailed t-test.
Publisher’s Note: MDPI stays neutral with regard to jurisdictional claims in published maps and institutional affiliations.

