Abstract
Teaching and learning are significantly influenced by information and communications technology (ICT). The goal of this study was to develop a new model and conduct confirmatory factor analysis to learn more about how students use ICT for digital learning as sustainability. The purpose of this research project was to investigate computer self-efficacy, computer anxiety, perceived enjoyment and acceptance of digital learning as sustainability at Saudi universities, based on students’ satisfaction with actual ICT usage for digital learning as sustainability. This research project made use of structural equation modelling with SEM-AMOS and an expanded variant of the technology acceptance model as the research model. A questionnaire based on the technology acceptance model and social cognitive theory was employed as the main data collection method and was distributed to 684 students from students at two universities. Students’ answers were categorized into seven categories and evaluated to determine how satisfied students were with ICT and how likely they were to continue using it for digital learning as sustainability. The findings revealed a connection between computer self-efficacy, computer anxiety and perceived enjoyment, factors which all played a significant role in perceived usefulness and ease of use. Perceived usefulness and ease of use also had an impact on students’ continued intention to use and satisfaction. This research-built model was effective in explaining students’ continued desire to use ICT and their satisfaction with it.
1. Introduction
For the effective incorporation of emerging technologies in education and learning environments, teachers’ digital competence and beliefs about information and communications technology (ICT) are critical [1,2,3,4]. Teachers’ perceptions of their willingness to deal with ICT are linked to ICT application in school-related learning environments [1,5,6]. A significant body of research has looked at basic aspects of teachers’ ICT skills and values in relation to instructing and educating [7,8]. Nevertheless, there has been little investigation of teachers’ perceptions of their basic ICT skills (see [1,9] for more information). While research has established several dimensions of basic ICT skills of teachers in relation to the use of digital tools and emerging technology [10,11], this kind of multidimensionality is not commonly used to measure teachers’ perceptions of their abilities. However, it is important to look at the multidimensional nature of basic ICT competence beliefs among teachers, as this allows for a more accurate comprehension of these convictions as a necessary precondition for the incorporation of ICT in the classroom [5]. In today’s world, ICT is a critical component of almost every company [12]. Computers were first used in classrooms in the early 1980s and some researchers believe that ICT will play an important role in education for the next generation [13,14]. Current technology provides a variety of ways to improve classroom teaching and learning [15].
Problem Background
A disparity results from students’ use of their own digital technology resources and their understanding of the universities’ guidelines for using digital learning technology as sustainability. It is important to explore digital literacy and the use of technology to increase student participation [16,17]. As a result, this study contributes to the ongoing debate in the information society about digital learning technologies as sustainability, ICT use and learning across contexts [18,19,20,21]. The implementation and use of educational technology in the education systems of developing countries have been fraught with problems and do not always result in directly proportional improvements in student learning outcomes. Therefore, it is important to investigate and comprehend the critical success factors in order to maximise student outcomes from the use of ICT and digital learning technology in universities [22,23]. Higher education and sustainability are now commonly acknowledged as two ideas that are inextricably linked. Higher education, in today’s society, has a responsibility and a key role to play in reframing education for the sake of sustainability, in addition to its two conventional duties of research and teaching. Technology, on the other hand, has made it much easier for people from all across the country and the globe to gain access to resources. Technology-assisted learning has been rapidly expanding [24]. As a result, education regarding sustainable development aims to inspire learners and those they affect to adopt sustainable practices [25]. The use of ICT has expanded globally as a result of lower computer technology prices, improved Internet connectivity and enhanced digital infrastructure in many regions. Nonetheless, it was stated, at an early point, that digital learning offers the underdeveloped world an opportunity to multiply education and give fair educational access at lower marginal costs [26,27]. As a result, they are important components of digital learning for long-term growth [28]. The relationship between ICT use and student performance in higher education is unclear and existing research contains contradicting findings. A previous study has failed to reach a clear conclusion about the impact on student success [29]. Some studies, on the other hand, suggest that ICT has a genuine influence on student success [30,31,32,33]. The research problem revolves around the rapid advancement in educational technology and information systems. Thus, in this study, the factors of ICT in digital learning for sustainable development among university students are identified and examined in this paper. Therefore, the research question is—what are the factors of ICT in digital learning for sustainable development among university students?
2. Research Model and Hypotheses Development
Davis et al. [34] developed the technology approval model (TAM), which measures user acceptance of various technological instruments [35,36]. Furthermore, the computer self-efficacy concept is based on Bandura’s [37] self-efficacy construct and its significance in the social cognitive theory (SCT) [38]. Self-efficacy is defined as a person’s belief in their own ability to do things successfully. Self-efficacy is not a measure of one’s talents or talent in and of itself; rather, it symbolizes what people feel they can do based on their talents or skills. The TAM and SCT were used as the underpinning study framework in this study to address the subject of how university students embrace and utilise digital learning for sustainable development. ICT has revolutionised technology, higher education, teaching and learning. Research has established a variety of complementary and contrasting models for exploring the adoption of information systems (IS), such as ICT. The technology acceptance model (TAM) [39] is the most influential theoretical contribution to the adoption research and it is widely used by scholars to examine technology adoption. In this study, seven factors influencing the adoption of ICT for digital learning as sustainability were examined: computer self-efficacy (CSE), computer anxiety (CA), perceived enjoyment (PE), perceived usefulness (PU), perceived ease of use (PEU), students’ satisfaction (SS) and students’ continuing intention to use (SCU), as shown in Figure 1.
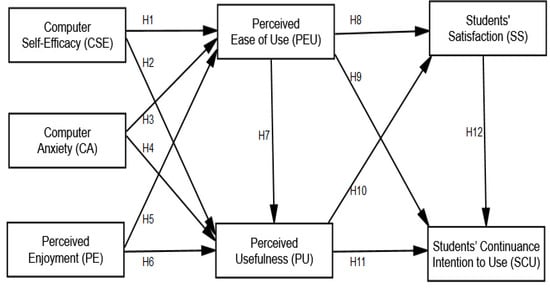
Figure 1.
Research model.
2.1. Computer Self-Efficacy
CSE is a concept that refers to a person’s ability to use a computer to significant effect based on the person’s desire to use computers [40]. People who do not consider themselves to be skilled computer users are less likely to use them [41]. CSE enhances performance and decreases computer-induced anxiety, according to research conducted in the workplace [42,43]. Teachers’ CSE, according to [44], is a major factor in their patterns of computer use. It was discovered that CSE is a strong predictor of pre-service teachers’ ability to incorporate technology in the classroom [45,46]. According to research, CSE has a positive impact on PEU and PU [47,48]. The proposed hypothesis for this construct is that PU and PEU affect CSE when it comes to using ICT for digital learning as sustainability.
2.2. Computer Anxiety
CA refers to “an individual’s anxiety, if not outright fear, when confronted with the prospect of using a computer” [49]. CA is a phenomenon that has been widely researched since the start of the Digital Revolution in the 1980s and is still important today [50,51]. Powell [52] presented a systematic analysis of the key principles of CA, proposing multiple variables as predictors of CA. CA is a response to perceived risks from a technology that may be too difficult to use and whose performance advantages are outweighed by the effort involved in using it. The proposed hypothesis for this construct is that PU and PEU affect CA when it comes to using ICT for digital learning as sustainability.
2.3. Perceived Enjoyment
PE refers to how enjoyable an operation provided by ICT is, regardless of anticipated output outcomes [53]. This can be thought of as a bi-perspective process, where pleasure is derived from using ICT for digital learning with peers and assisting others [54]. The degree to which students enjoy using ICT for digital learning is described as PE in this study. The proposed hypothesis for this construct is that PU and PEU affect PE of ICT use for digital learning as sustainability.
2.4. Perceived Ease of Use
The extent to which a customer feels that using ICT is painless is known as PEU. According to [39,55], when a technology is considered to be simple to use, people are more likely to cultivate a positive attitude toward it [56,57]. In this analysis, PEU refers to a student’s belief that using ICT is both simple and beneficial. While PU is concerned with the impact of technology on job performance, PEU is concerned with the impact of technology on performance processes [39]. The proposed hypothesis for this construct is that PEU of ICT for digital learning is positively affected by PU, SS and SCU ICT for digital learning as sustainability in the future.
2.5. Perceived Usefulness
The level of confidence that using technology can boost one’s job efficiency is referred to as PU [39]. In this research project, PU refers to how much students believe that ICT can enhance their digital learning experience. In recent research, PU has been shown to affect students’ attitudes toward technology and their intention to use it in the future [56,57,58]. Since the PU of something has a direct impact on SS and their intention to use ICT for digital learning as sustainability, it is believed that it will have an indirect impact on SCU ICT for digital learning as sustainability. The hypothesis suggested for this construct is that SS with ICT usage for digital learning is positively affected by SCU ICT for digital learning as sustainability in the future.
2.6. Students’ Satisfaction and Digital Learning as Sustainability
SS with technology usage in this study relates to how well a technology matches their existing beliefs, desires and experiences [59]. SS with using ICT for digital learning as sustainability, in this study, arises as a result of the enrichment of such learning. PU and PEU were the most important factors in people’s acceptance of technology, according to the TAM model [39]. Furthermore, these two antecedents have been shown to be effective enough to calculate SS using the TAM model [59]. More specifically, both PU and PEU were found to be essential post-adoption beliefs among users, leading to high levels of satisfaction and continued use intentions [60]. In this regard, Kim [61] discovered that people who use ICT have more positive device experiences and higher intentions to use ICT for digital learning as sustainability in the future. Perceived satisfaction, perceived usefulness and interactive learning settings were all found to influence perceived self-regulation in online learning settings, according to Liaw and Huang [62]. According to Umek et al. [63], combining blended learning with a learning management system (LMS) platform can improve students’ success and satisfaction while utilizing an online learning platform. Students’ evaluations of instructors are one of the most often utilized markers of teaching quality in higher education institutions across the world [64]. Furthermore, the transition to online learning reduces course and instructor satisfaction [65]. Thus, ICT is critical in the early phases of developing a behavioral evaluation instrument for assessing instructional efficiency in online modalities [66]. SS with ICT usage for digital learning is positively affected by SCU ICT for digital learning as sustainability, according to the hypothesis suggested for this construct.
2.7. Students’ Continuing Intention to Use ICT
Continuing intention to use ICT refers to an individual’s ability to use and continue using ICT. SCU ICT is a factor that influences how people use technology [67,68]. The intention of students to use ICT in this study was their desire to use ICT to improve their learning satisfaction. Learning with ICT is a main component of developmental technology usage models [39,55]. In the literature on technology adoption, the phrase “intention to use” refers to a person’s willingness to put technology to use in the near future. Because of its accuracy in forecasting real technology use, in this analysis, it was used as an outcome variable [56].
3. Research Methodology
Many universities around the world, including those in Saudi Arabia, have promoted the use of available ICT for digital learning as sustainability. As a product of an observational study of students’ adoption of ICT for digital learning as sustainability, this research project aims to create a blueprint for evaluating students’ abilities, continuing intention to use and satisfaction. Undergraduate and postgraduate students who used ICT for digital learning as sustainability made up the study group. For objects containing the TAM constructs and demographic characteristics, a five-point Likert scale was used, with 1 being “strongly disagree” and 5 being “strongly agree”. Self-administration was used for survey delivery. Respondents were asked to provide input on their use of ICT for digital learning as sustainability, how it affected their continuing intention to use ICT for digital learning as sustainability and how satisfied they were. The data were then analysed using the Statistical Package for the Social Sciences (SPSS) and structural equation modelling (SEM-AMOS) to validate the validity and reliability of the measurement model. Factor loadings were used to ensure construct validity, composite reliability, Cronbach’s alpha and other measures of reliability and convergent validity for the model goodness of fit, as recommended by [69]. Based on standardised products, Cronbach’s alpha was found to be 0.917. The reliability coefficients (Cronbach’s alpha) for both pilot and final test constructs are shown in Table 1. All variables were found to be accurate and reasonable.

Table 1.
Reliability coefficient for all constructs in pilot test and final test.
3.1. Sample Characteristics and Data Collection
This study was conducted online from January to March 2021, when universities were closed due to the COVID-19 pandemic. Before starting the main data collection, a survey instrument was developed and validated to measure factors predicting student use of ICT for digital learning as sustainability. We distributed 737 questionnaires as part of the analysis. However, 26 participants’ responses contained incomplete answers and were not included in the analysis. A total of 18 participants’ responses were missing data and 9 participants’ responses were removed after the normality test. Such exclusions were suggested by [69], who claimed that outliers would lead to incorrect statistical results and should be omitted. As a result, 684 participants’ responses were imported into the SPSS program. This study focused on postgraduate and undergraduate students at Bisha University and King Faisal University who are active users of ICT for digital learning as sustainability during the COVID-19 pandemic. To ensure the model’s validity, confirmatory factor analysis was used.
3.2. Measurement Instruments
The build items adopted from previous studies verified the measurement scales material validity. The research questionnaire had two sections: basic demographic data (gender, age, educational level, etc.) and items measuring CSE adapted from [40], CA adapted from [49], PE adapted from [53], PU adapted from [39], PEU adapted from [39], SS adapted from [59] and SCU adapted from [67]. All the instruments were adapted from trustworthy sources. Self-report using multi-item scales based on previous research was used to assess the variables. All of the measures were graded on a five-point Likert scale, with 1 indicating “strongly disagree” and 5 indicating “strongly agree”. In Table 2, all the items are identified.
Table 2.
Measurement model, item loadings, reliability and validity.
4. Results and Analysis
The conceptual model of this paper was tested using covariance-based structural equation modelling (CB-SEM). CB-SEM has several advantages. The maximum likelihood approach was used for parameter estimation [69]. The data were analysed using SEM-AMOS. The calculation model and the structural model were two methodological measures that were considered. The structural model deals with hypotheses concerning ICT usage for digital learning as sustainability, while the measurement model covers construct reliability, validity and overall model fitness.
4.1. Demographic Information
The demographic data are presented in Table 3. There were 420 female respondents (61.4%) and 264 male respondents (38.6%) among the 684 usable questionnaires. Furthermore, 229 (33.5%) of respondents were 18–21 years old, 176 (25.7%) were 22–25 years old, 94 (13.7%) were 26–29 years old, 58 (8.5%) were 30–33 years old and 127 (18.6%) were more than 34 years old. A total of 347 (50.7%) of the responses were from Bisha University and 337 (49.5%) were from King Faisal University. Undergraduate students accounted for 330 (48.2%) of the respondents, while postgraduate students accounted for 354 (51.8%). A total of 294 (43.1%) of the students were from the faculty of education, 82 (12.0%) were from the faculty of science, 211 (30.8%) were from the faculty of art and humanities, 39 (5.7%) were from the faculty of medical science and 58 (8.5%) were from the faculty of computer science. A total of 408 respondents (59.6%) were full-time students, while 276 (40.4%) were part-time students. A total of 343 respondents (50.1%) had used ICT for digital learning as sustainability for less than 5 years, 210 respondents (30.7%) had used ICT for 5–10 years and 131 respondents (19.2%) had used ICT for more than 10 years. A total of 470 respondents (68.7%) used ICT for digital learning as sustainability all of the time, 192 respondents (28.1%) used ICT for digital learning as sustainability some of the time and 22 respondents (3.2%) did not use ICT for digital learning as sustainability at all.
Table 3.
Demographic information.
4.2. Reliability, Validity and Measurement Model Interventions
For each construct to be measured by SEM-AMOS, the measurement model has certain reliability and validity properties. The structural model was used to test the intensity of the relationship direction using confirmatory factor analysis and model health indices for individuals from the measurement model. The measurement elements are shown in Table 2. The results show no significant issues with item reliability, as most of the products meet the recommended 0.707 standard [69]. We used composite reliability to assess the constructs internal consistency; it ranged from 0.883 to 0.932, which was higher than the cut-off value of 0.70 [69]. The constructs average variance extracted (AVE) ranged from 0.732 to 0.557, well above the threshold of 0.50 [69], indicating convergent validity. The square root of AVE, average shared variance (ASV) and maximum shared variance (MSV) tests are all examples of cross-loading and were used to assess discriminant validity. The value of the diagonal is greater than the value of the corresponding row and column numbers (in Table 4, the values are bolded). This means that the connection between the construct and other constructs is higher. Similarly, MSV is lower than ASV but higher than AVE (Table 4). Therefore, the measurement variables are distinct from one another.
Table 4.
Discriminant validity.
4.3. Model Fit Assessment
The chi-square (CMN) and degree of freedom (DF) (CMN/DF) value in Table 5 was 3.630, which is less than the threshold value (5.00). GFI (0.952) is a decent standard, CFI (0.941) is excellent, TLI (0.930) is excellent and IFI (0.921) is excellent. The model badness measures were satisfactory, with RMR and RMSEA of 0.39 (0.05) and 0.033 (0.08), respectively, less than the cut-off [69]. Figure 2 shows the overall results, which showed that the model of measurement matched well and was suitable for the structural model.
Table 5.
Results of hypotheses testing.
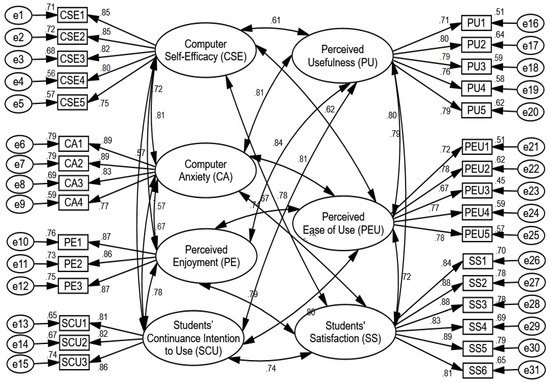
Figure 2.
Measurement model.
4.4. Structural Model and Direction Coefficient
The interaction as well as the influence of independent variables on the dependent variable are defined by the structural model (path coefficient). The SEM method, particularly the maximum likelihood method, can rigorously test complex models and uncover many relationships between multi-item variables, as well as the impact of moderating and mediating [70]. Figure 3 and Figure 4 display the direct effect of the vector with latent predictors on expected variables using the β path coefficient.
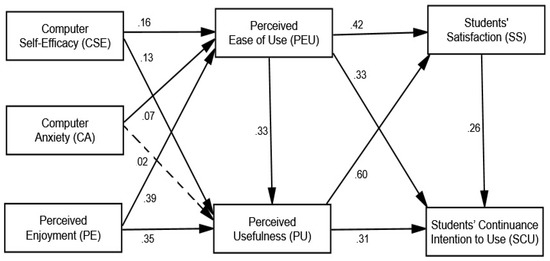
Figure 3.
Path coefficient.
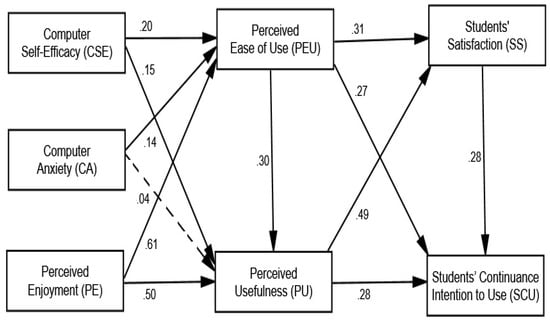
Figure 4.
Structural model (p value).
Table 5 illustrates that CSE (= 0.156, CR = 5.811, p = 0.001) has a positive and important influence on PEU, which supports Hypothesis 1. CSE (= 0.135, CR = 5.044, p = 0.001) has a positive and important impact on PU, supporting Hypothesis 2. CA (= 0.065, CR = 4.768, p = 0.001) has a positive and important impact on PEU, supporting Hypothesis 3. However, CA (= 0.022, CR = 1.619, p = 0.001) has a negative impact on PU, contradicting Hypothesis 4. PE (= 0.390, CR = 18.220, p = 0.001) has a positive and important impact on PEU, providing support for Hypothesis 5. Similarly, PE (= 0.351, CR = 13.854, p = 0.001) has a positive and important impact on PU, in agreement with Hypothesis 6. PEU (= 0.332, CR = 8.934, p = 0.001) has a positive and important impact on PU, which supports Hypothesis 7. Similarly, PEU (= 0.423, CR = 9.305, p = 0.001) has a positive and meaningful impact on SS, supporting Hypothesis 8. In addition, PEU (= 0.328, CR = 7.372, p = 0.001) has a positive and important impact on SCU ICT for digital learning as sustainability, which Hypothesis 9 predicted. PU (= 0.596, CR = 14.949, p = 0.001) has a positive and important effect on SS, as purported in Hypothesis 10. Additionally, PU (= 0.312, CR = 7.358, p = 0.001) has a positive and significant effect on SCU ICT for digital learning as sustainability, as hypothesised in Hypothesis 11. Finally, SS (= 0.260, CR = 7.382, p = 0.001) has a positive and important impact on SCU ICT for digital learning as sustainability, as Hypothesis 12 hypothesised.
5. Factors Identified and Evaluated
The mean and standard deviation (SD) are two numbers that describe how measurements for a population differ from a mean (average) or predicted value. The SD is poor, indicating that the majority of the data points are similar to the mean. A high SD indicates that the data are more dispersed. Therefore, all values were embraced, as seen in Table 6, Table 7, Table 8, Table 9, Table 10, Table 11 and Table 12 (where 1 = “strongly disagree”; 2 = “disagree”; 3 = “neutral”; 4 = “agree”; 5 = “strongly agree”; f = “frequency”). This implies that university students’ use of available ICT improved their digital learning as sustainability. The findings indicate that the majority of students support or strongly agree with PU and PEU when it comes to CSE. As a result, in this study, CSE is described as the degree to which students believe that using ICT will enhance their digital learning as sustainability (see Table 6).
Table 6.
Measuring computer self-efficacy.
Table 7.
Measuring computer anxiety.
Table 8.
Measuring perceived enjoyment.
Table 9.
Measuring perceived ease of use.
Table 10.
Measuring perceived usefulness.
Table 11.
Measuring students’ satisfaction.
Table 12.
Measuring students’ continuing intention to use ICT.
Table 7 shows the effects of the final measurement; the majority of students support or strongly agree on CA, as well as PU and PEU. As a result, CA is described in this study as a test of how strongly students believe that using ICT will enhance their digital learning as sustainability.
Table 8 shows the effects of the final measurement; the majority of students approve or strongly agree on PE, PU and PEU. As a result, in this study, PE is described as the degree to which students believe that using ICT will enhance their digital learning as sustainability.
Table 9 shows the final measurement results, which show that the vast majority of students support or strongly agree on PEU, PU, SCU and SS. As a result, in this study, PEU is described as the degree to which students believe that using ICT will enhance their digital learning as sustainability.
Table 10 shows the effects of the final measurement; the majority of students support and strongly agree on PU, SCU and SS. As a result, in this study, PU is defined as the degree to which students believe that using ICT will enhance their digital learning as sustainability.
Table 11 indicates the results of the final measurement; the majority of students agree or strongly agree that they are happy with their continued intention to use ICT. As a result, in this analysis, SS is described as a test of how strongly students believe that using ICT will enhance their digital learning as sustainability.
Table 12 displays the final assessment results; the majority of students support or strongly agree that they will use ICT in the future for digital learning. As a result, in this analysis, SCU ICT is described as a test of how strongly students believe that using ICT will enrich their digital learning as sustainability.
6. Discussion and Implications
This study aimed to explore ICT usage for digital learning as sustainability using the TAM model in Saudi Arabia. The findings showed that CSE, CA and PE all had a substantial effect on PEU and PU, according to the proposed model. Moreover, PEU and PU had a substantial impact on SS and students’ intention to use ICT for digital learning as sustainability in the future. The constructs explained 66.8% of the variance in SS with ICT usage for digital learning as sustainability and 79.3% of the variance in SCU ICT for digital learning as sustainability. The findings supported the proposed hypotheses and the research model that was developed. The results shed light on how the TAM constructs of CSE, CA and PE are used (independent variables) in the calculation of SS and SCU ICT for digital learning as sustainability, as well as PEU and PU (mediating variables). Several constructs, such as CSE, PE, PU and PEU, were found to have a positive and significant relationship with SS and students’ intention to continue using ICT for digital learning as sustainability. Although CA had a negative relationship with PU, it had a positive and important relationship with PEU of ICT for digital learning as sustainability, suggesting an improvement in SS and students’ intention to use ICT for digital learning as sustainability in the future. Prior research has shown that CSE, PE, PU, PEU, SS and SCU ICT for digital learning as sustainability have major positive effects. As a result of these findings, it can be deduced that before students decide to use ICT for digital learning, they assess its ability to meet their needs and determine CSE, CA, PE, PEU and PU. Students are more likely to consider technology to be easy to use and useful when they interpret SCU ICT for digital learning as sustainability and that it is capable of meeting those requirements [71,72,73,74]. Without a doubt, the use of ICT for digital learning as sustainability is well known and widely used in education sustainability, particularly among students who are already familiar with technology. SS, as well as SCU ICT for digital learning, is influenced by CSE, CA, PE, PU and PEU. Table 5 presents the statistical analysis findings, which indicate that 11 hypothesised relationships were supported and one was rejected. Some of the hypothesis findings contradicted previous research, such as the reference [56], which found that CSE, PE and PEU all have a strong and positive effect on PU. As a result of the mixed results, further research on the relationships between the constructs is required. Moreover, CSE, CA and PE all had a significant and positive effect on PEU and CSE and PE also had a significant and positive effect on PU. CA, however, had a negative effect on PU, while PEU and PU had a large and positive impact on SS and SCU ICT for digital learning as sustainability. Previous research [56,59,73,74,75] supports this. According to the TAM, PEU and PU have a positive and direct effect on SS and students’ intention to continue using ICT for digital learning as sustainability. This was demonstrated in this research project, which found that ICT users claimed that higher PEU and PU led to higher SS with ICT use, which increased SCU ICT for digital learning as sustainability. References [49,76] support the research finding that there is a strong and direct relationship between PEU and PU. Furthermore, students consider ICT to be quick to use if it is helpful to their learning. If students are given chances to use ICT, they are more likely to think of it as simple and useful. As a result, ICT developers should build systems that are easy to use and important to the long-term success of student education in order to increase PEU. Managers can also provide assistance to students in using ICT for digital learning as sustainability. The findings about clearly defined system characteristics suggested that ICT developers, designers and buyers (universities, schools and higher education institutions) should address user needs and values to ensure that the system is able to meet the needs of students. This perception of a good fit between system features and student needs will help ICT adoption for digital learning as sustainability. Indirectly, factors such as CSE, CA and PE affect SS and students’ intention to continue using ICT for digital learning as sustainability. In terms of the implications of this study, the previously recognised value of belief constructs in that PEU affected PU is confirmed, with both belief constructs serving as determinants of SS and potential intention to use ICT for digital learning as sustainability. In other words, ICT must be considered as simple to use and useful in order for it to be embraced for digital learning by university students. ICT should be easy to use and have simple instructions. The findings also demonstrated the value of faculty in explaining how students should use ICT to learn course material, as well as SS and SCU ICT for digital learning as sustainability. Three main empirical results emerge from this study: ICT usage for digital learning as sustainability is influenced by CSE, CA and PE, all of which influence PEU and PU. SS and SCU ICT for digital learning as sustainability are often affected by PEU and PU. The results also contribute significantly to the TAM in terms of educational sustainability and ICT usage for digital learning [39,56,57,59,73,74]. Furthermore, in today’s world, several ICT resources are available that can be used to build and disseminate information [77,78]. Students were most satisfied with the help offered by teaching staff and their institutions’ public relations during the worldwide lockdown and transition to online learning, according to the report. Despite this, they were unable to recognize their own enhanced performance in the new educational environment due to a lack of computer skills and the sense of a larger burden [79]. At the undergraduate level, the use of different digital technologies was also highlighted to boost student behavioural and emotional involvement, whilst graduate students’ cognitive and emotional engagement was primarily addressed through experience-sharing and learning co-construction online [80]. High achievers were happier with their mixed course than low achievers, would take one again and favoured the blended approach over entirely face-to-face or online learning [81]. As a result, certain key teaching-related aspects of blended learning models, such as teacher–student communication, learning resources, course design and teacher technical competencies, have been under focus [82]. Many of the techniques used in the learning process for both teachers and students are evolving and will continue to do so as ICT becomes more commonly used as an educational medium [83]. Using accessible ICT can help teachers and students solve problems and learn about current events and can provide global communication and competitiveness [84], which is in line with the findings of this study. In conclusion, the following are the research contributions:
- Integrating ICT into instructional strategies could improve SS and students’ intention to continue using ICT for digital learning as sustainability. Furthermore, lecturers and supervisors should encourage students to use ICT to solve problems, share knowledge and provide information in order to enhance students’ learning, success and research skills.
- In a recent paradigm of ICT use for digital learning as sustainability, the TAM model is linked to CSE and CA factors.
- It is recommended that higher education institutions recognise students who are comfortable with using ICT in the classroom rather than pressuring those who are not. This is due to the fact that students must incorporate ICT components and resources into their learning process.
- Both technology and resources are essential to SS and SCU ICT for digital learning as sustainability. Students should take advantage of opportunities to use ICT for digital learning as sustainability.
This research project, regardless of the perspectives it provides, has limitations. First, since this study only included two universities, its results should be viewed with caution, as activities at other universities (private universities and other schools) could vary. Another drawback is that this analysis uses quantitative data; therefore, future research should use a qualitative approach (interviews or observations) to avoid overlooking discrepancies between research fields. Future research should re-create this analysis in other settings, countries and cultures to address its weaknesses and broaden its results.
Conclusions and Future Work
This study validated the TAM model in terms of educational sustainability and presented data on student expectations of using ICT for digital learning as sustainability. Theoretical and functional elements of the research implications were discussed. The benefits of the TAM were highlighted in this report, which also revealed new knowledge about user acceptance and adoption of ICT for digital learning as sustainability. ICT contributes significantly to enhancing the quality of learning and study activities for high school and university students in the twenty-first century. However, no previous research has assessed SS with ICT and SCU ICT for digital learning as sustainability. The TAM is found to be sufficiently stable to provide results for the studied phenomenon, which is how CSE, CA, PE, PU and PEU affect SS and students’ intention to continue using ICT for digital learning as sustainability. This study makes a significant contribution in that it can serve as a guideline for researchers, practitioners, system developers, service providers, suppliers and academics to consider systematic research approaches for model validation in education sustainability, especially when using structural equation modelling on the use of ICT for digital learning as sustainability. Seven novel TAM model characteristics were used as important determinants of ICT adoption for digital learning as sustainability in this research project. In addition, the research model was constructed around 12 hypotheses and focused on analysing the relationships between the following factors: CSE, CA, PE, PU, PEU, SS and SCU ICT for digital learning as sustainability. However, the literature mixed findings call for further research on the relationship between CSE and CA and PU and PEU. In light of the study design limitations and the qualitative approach chosen, future studies might use interview methods to learn more about students’ and educators’ perspectives on the use of ICT for digital learning as sustainability. Furthermore, future researchers should incorporate cultural aspects into this model to enable cross validating these areas across cultures.
Author Contributions
Conceptualization, A.M.S., M.A.A., M.M.A., and W.M.A.-R.; methodology, A.M.S., M.A.A., M.M.A., and W.M.A.-R.; software, M.M.A., and W.M.A.-R.; validation, A.M.S., M.A.A., and W.M.A.-R.; formal analysis, M.A.A., and W.M.A.-R.; investigation, A.M.S., M.A.A., M.M.A., and W.M.A.-R.; resources, A.M.S., M.A.A., M.M.A., and W.M.A.-R.; data curation, A.M.S., M.A.A., M.M.A., and W.M.A.-R.; writing—original draft preparation, A.M.S., M.A.A., M.M.A., and W.M.A.-R.; writing—review and editing, A.M.S., M.A.A., M.M.A., and W.M.A.-R.; visualization, A.M.S., M.A.A., M.M.A., and W.M.A.-R.; supervision, A.M.S., M.A.A., M.M.A., and W.M.A.-R.; project administration, A.M.S., and M.A.A.; funding acquisition, A.M.S., and M.A.A. All authors have read and agreed to the published version of the manuscript.
Funding
The authors extend their appreciation to the Deputyship for Research & Innovation, Ministry of Education in Saudi Arabia for funding this research work through the project number (UB-45-1442).
Institutional Review Board Statement
No applicable.
Informed Consent Statement
No applicable.
Data Availability Statement
No applicable.
Conflicts of Interest
The authors declare no conflict of interest.
References
- Hatlevik, O.E. Examining the Relationship between Teachers’ Self-Efficacy, their Digital Competence, Strategies to Evaluate Information, and use of ICT at School. Scand. J. Educ. Res. 2017, 61, 555–567. (In English) [Google Scholar] [CrossRef]
- Knezek, G.; Christensen, R. Extending the will, skill, tool model of technology integration: Adding pedagogy as a new model construct. J. Comput. High. Educ. 2016, 28, 307–325. (In English) [Google Scholar] [CrossRef]
- Petko, D.; Prasse, D.; Cantieni, A. The Interplay of School Readiness and Teacher Readiness for Educational Technology Integration: A Structural Equation Model. Comput. Sch. 2018, 35, 1–18. [Google Scholar] [CrossRef]
- Al-Rahmi, W.; Aldraiweesh, A.; Yahaya, N.; Kamin, Y.B.; Zeki, A.M. Massive Open Online Courses (MOOCs): Data on higher education. Data Brief 2019, 22, 118–125. [Google Scholar] [CrossRef] [PubMed]
- Roblin, N.P.; Tondeur, J.; Voogt, J.; Bruggeman, B.; Mathieu, G.; van Braak, J. Practical considerations informing teachers’ technology integration decisions: The case of tablet PCs. Technol. Pedagog. Educ. 2018, 27, 165–181. (In English) [Google Scholar] [CrossRef]
- Alamri, M.M.; Almaiah, M.A.; Al-Rahmi, W.M. Social media applications affecting students’ academic performance: A model developed for sustainability in higher education. Sustainability 2020, 12, 6471. (In English) [Google Scholar] [CrossRef]
- Elstad, E.; Christophersen, K.A. Perceptions of digital competency among student teachers: Contributing to the development of student teachers’ instructional self-efficacy in technology-rich classrooms. Educ. Sci. 2017, 7, 27. (In English) [Google Scholar] [CrossRef]
- Knezek, G.; Christensen, R.; Furuta, T. Validation of a teacher educator technology competencies survey. Validation of a teacher educator technology competencies survey. J. Technol. Teach. Educ. 2019, 27, 465–498. [Google Scholar]
- Rubach, C.; Lazarides, R. Eine Skala zur Selbsteinschätzung digitaler Kompetenzen bei Lehramtsstudierenden: Entwicklung eines Instrumentes und die Validierung durch Konstrukte zur Mediennutzung und Werteüberzeugungen zur Nutzung digitaler Medien im Unterricht. (German). A measure for teacher students’ self-evaluated digital competencies scale: Development of an instrument and validation through measures for using media and values regarding the use of digital media in teaching. Z. Für Bild. 2019, 9, 345–374. (In English) [Google Scholar]
- Tourón, J.; Martín, D.; Asencio, N.; Pradas, S.; Íñigo, V. Validación De Constructo De Un Instrumento Para Medir La Competencia Digital Docente De Los Profesores (CDD) / Construct Validation of a Questionnaire to Measure Teachers’ Digital Competence (TDC). Rev. Española Pedagog. 2018, 76, 25–54. [Google Scholar]
- Wei, L.M.; Piaw, C.Y.; Kannan, S.; Moulod, A.S. Relationship between Teacher ICT Competency and Teacher Acceptance and Use of School Management System (SMS). Malays. Online J. Educ. Technol. 2016, 4, 36–52. [Google Scholar]
- Zhang, P.; Aikman, S. Attitudes in ICT acceptance and use. In International Conference on Human-Computer Interaction; Springer: Berlin/Heidelberg, Germany, 2007; pp. 1021–1030. [Google Scholar]
- Bransford, J.; Brown, A.L.; Cocking, R.R. National Research Council. National Research, How People Learn: Brain, Mind, Experience, and School; National Academies Press: Washington, DC, USA, 1999. (In English) [Google Scholar]
- Yelland, N. Teaching and Learning with Information and Communication Technologies (ICT) for Numeracy in the Early Childhood and Primary Years of Schooling/Nicola Yelland. [Canberra]: Dept. of Education, Training and Youth Affairs. 2001. Available online: https://nla.gov.au/nla.cat-vn1154620 (accessed on 11 June 2001).
- Ghavifekr, S.; Razak, A.Z.A.; Ghani, M.F.A.; Ran, N.Y.; Meixi, Y.; Tengyue, Z. ICT Integration in Education: Incorporation for Teaching & Learning Improvement. Malays. Online J. Educ. Technol. 2014, 2, 24–45. [Google Scholar]
- Bergdahl, N.; Fors, U.; Hernvall, P.; Knutsson, O. The Use of Learning Technologies and Student Engagement in Learning Activities. Nord. J. Digit. Lit. 2018, 13, 113–130. [Google Scholar] [CrossRef]
- Langset, I.D.; Jacobsen, D.Y.; Haugsbakken, H. Digital professional development: Towards a collaborative learning approach for taking higher education into the digitalized age. Nord. J. Digit. Lit. 2018, 13, 24–39. (In English) [Google Scholar] [CrossRef]
- Erstad, O. Educating the digital generation: Exploring media literacy for the 21st century. Nord. J. Digit. Lit. 2015, 5, 85–102. (In English) [Google Scholar] [CrossRef]
- Alenazy, W.M.; Al-Rahmi, W.M.; Khan, M.S. Validation of TAM Model on Social Media Use for Collaborative Learning to Enhance Collaborative Authoring. Ieee Access 2019, 7, 71550–71562. (In English) [Google Scholar] [CrossRef]
- Krumsvik, R.J.; Berrum, E.; Jones, L.Ø. Everyday digital schooling—Implementing tablets in Norwegian primary school: Examining outcome measures in the first cohort. Nord. J. Digit. Lit. 2018, 13, 3. (In English) [Google Scholar]
- Lillejord, S.; Børte, K.; Nesje, K.; Ruud, E. Learning and Teaching with Technology in Higher Education–A Systematic Review; Knowledge Centre for Education: Oslo, Norway, 2018. [Google Scholar]
- Al-Gahtani, S.S. Empirical investigation of e-learning acceptance and assimilation: A structural equation model. Appl. Comput. Inform. 2016, 12, 27–50. (In English) [Google Scholar] [CrossRef]
- Alalwan, N.; Al-Rahmi, W.M.; Alfarraj, O.; Alzahrani, A.; Yahaya, N.; Al-Rahmi, A.M. Integrated three theories to develop a model of factors affecting students’ academic performance in higher education. Ieee Access 2019, 7, 98725–98742. (In English) [Google Scholar] [CrossRef]
- Jenkins, M.; Browne, T.; Walker, R.; Hewitt, R. The development of technology enhanced learning: Findings from a 2008 survey of UK higher education institutions. Interact. Learn. Environ. 2011, 19, 447–465. [Google Scholar] [CrossRef]
- Ballantyne, R.; Packer, J. Promoting environmentally sustainable attitudes and behaviour through free-choice learning experiences: What is the state of the game? Environ. Educ. Res. 2005, 11, 281–295. [Google Scholar] [CrossRef]
- Capper, J. E-learning growth and promise for the developing world. TechKnowLogia 2001, 2, 7–10. [Google Scholar]
- Lee, R.M. E-Learning Prospects for the Developing World. In The Digital Economy—Anspruch und Wirklichkeit; Springer: Berlin/Heidelberg, Germany, 2004; pp. 363–378. [Google Scholar]
- Bell, S.; Douce, C.; Caeiro, S.; Teixeira, A.; Martín-Aranda, R.; Otto, D. Sustainability and distance learning: A diverse European experience? Openlearn. J. Open Distance E-Learn. 2017, 32, 95–102. [Google Scholar] [CrossRef]
- Youssef, A.B.; Dahmani, M. The impact of ICT on student performance in higher education: Direct effects, indirect effects and organisational change. Rusc Univ. Knowl. Soc. J. 2008, 5, 45–56. [Google Scholar]
- Hassan, M.U.; Iqbal, Z.; Shakir, K. Impact of ICT training and education on women’s employability and entrepreneurial skills: Achieving the sustainable development goals. Int. J. Bus. Forecast. Mark. Intell. 2020, 6, 157–166. [Google Scholar] [CrossRef]
- Festus, A.F.; Kazeem, K.O.; Ayodeji, O.B. Information and Communication Technology and Sustainable Performance of Selected Listed Deposits Money Banks in Lagos State, Nigeria. Int. J. Sustain. Manag. Inf. Technol. 2020, 6, 18. [Google Scholar]
- Al-Rahmi, W.M.; Alzahrani, A.I.; Yahaya, N.; Alalwan, N.; Kamin, Y.B. Digital communication: Information and communication technology (ICT) usage for education sustainability. Sustainability 2020, 12, 5052. [Google Scholar] [CrossRef]
- Ali, H.; Gueyié, J.P.; Okou, C. Assessing the impact of information and communication technologies on the performance of microfinance institutions in Niger. J. Small Bus. Entrep. 2021, 33, 71–91. [Google Scholar] [CrossRef]
- Davis, F.D.; Bagozzi, R.P.; Warshaw, P.R. User acceptance of computer technology: A comparison of two theoretical models. Manag. Sci. 1989, 35, 982–1003. [Google Scholar] [CrossRef]
- Rauniar, R.; Rawski, G.; Yang, J.; Johnson, B. Technology acceptance model (TAM) and social media usage: An empirical study on Facebook. J. Enterp. Inf. Manag. 2014, 27, 6–30. [Google Scholar] [CrossRef]
- Venkatesh, V.; Davis, F.D. A theoretical extension of the technology acceptance model: Four longitudinal field studies. Manag. Sci. 2000, 46, 186–204. [Google Scholar] [CrossRef]
- Bandura, A. Self-efficacy: Toward a unifying theory of behavioral change. Psychol. Rev. 1977, 84, 191–215. [Google Scholar] [CrossRef]
- Bandura, A. Social Foundations of Thought and Action: A Social Cognitive Theory; Printice Hall: Hoboken, NJ, USA, 1986. [Google Scholar]
- Davis, F.D. Perceived usefulness, perceived ease of use, and user acceptance of information technology. Mis Q. 1989, 13, 319–340. [Google Scholar] [CrossRef]
- Compeau, D.R.; Higgins, C.A. Computer self-efficacy: Development of a measure and initial test. Mis Q. Manag. Inf. Syst. 1995, 19, 189–210. (In English) [Google Scholar] [CrossRef]
- Olivier, T.A.; Shapiro, F. Self-efficacy and computers. J. Comput. -Based Instr. 1993, 20, 81–85. [Google Scholar]
- Marlene, E.B.; Daniel, J.B. Changing Patterns or Patterns of Change: The Effects of a Change in Technology on Social Network Structure and Power. Adm. Sci. Q. 1990, 35, 104–127. [Google Scholar] [CrossRef]
- Harrison, A.W.; Rainer, R.K., Jr.; Hochwarter, W.A.; Thompson, K.R. Testing the self-efficacy—performance linkage of social—cognitive theory. J. Soc. Psychol. 1997, 137, 79–87. (In English) [Google Scholar] [CrossRef]
- Albion, P.R. Some Factors in the Development of Self-Efficacy Beliefs for Computer Use among Teacher Education Students. J. Technol. Teach. Educ. 2001, 9, 321–347. (In English) [Google Scholar]
- Littrell, A.B.; Zagumny, M.J.; Zagumny, L.L. Contextual and Psychological Predictors of Instructional Technology Use in Rural Classrooms. Educ. Res. Q. 2005, 29, 37–47. [Google Scholar]
- Zhao, Y.; Pugh, K.; Sheldon, S.; Byers, J.L. Conditions for classroom technology innovations. Teach. Coll. Rec. 2002, 104, 482–515. (In English) [Google Scholar] [CrossRef]
- Venkatesh, V. Determinants of Perceived Ease of Use: Integrating Control, Intrinsic Motivation, and Emotion into the Technology Acceptance Model. Inf. Syst. Res. 2000, 11, 342–365. (In English) [Google Scholar] [CrossRef]
- Wang, Y.S.; Wang, Y.M.; Lin, H.H.; Tang, T.I. Determinants of user acceptance of Internet banking: An empirical study. Int. J. Serv. Ind. Manag. Conf. Pap. 2003, 14, 501–519. (In English) [Google Scholar] [CrossRef]
- Venkatesh, V.; Thong, J.Y.L.; Xu, X. Consumer acceptance and use of information technology: Extending the unified theory of acceptance and use of technology. Mis Q. Manag. Inf. Syst. 2012, 36, 157–178. (In English) [Google Scholar] [CrossRef]
- Abdullah, F.; Ward, R. Developing a General Extended Technology Acceptance Model for E-Learning (GETAMEL) by analysing commonly used external factors. Comput. Hum. Behav. 2016, 56, 238–256. (In English) [Google Scholar] [CrossRef]
- Korobili, S.; Togia, A.; Malliari, A. Computer anxiety and attitudes among undergraduate students in Greece. Comput. Hum. Behav. 2010, 26, 399–405. (In English) [Google Scholar] [CrossRef]
- Powell, A.L. Computer anxiety: Comparison of research from the 1990s and 2000s. Comput. Hum. Behav. Rev. 2013, 29, 2337–2381. (In English) [Google Scholar] [CrossRef]
- Van Der Heijden, H. User acceptance of hedonic information systems. Mis Q. Manag. Inf. Syst. 2004, 28, 695–704. (In English) [Google Scholar] [CrossRef]
- Hsu, M.K.; Wang, S.W.; Chiu, K.K. Computer attitude, statistics anxiety and self-efficacy on statistical software adoption behavior: An empirical study of online MBA learners. Comput. Hum. Behav. 2009, 25, 412–420. (In English) [Google Scholar] [CrossRef]
- Venkatesh, V.; Morris, M.G.; Davis, G.B.; Davis, F.D. User acceptance of information technology: Toward a unified view. Mis Q. 2003, 27, 425–478. [Google Scholar] [CrossRef]
- Teo, T.; Zhou, M. Explaining the intention to use technology among university students: A structural equation modeling approach. J. Comput. High. Educ. 2014, 26, 124–142. (In English) [Google Scholar] [CrossRef]
- Al-Rahmi, W.M.; Yahaya, N.; Aldraiweesh, A.A.; Alturki, U.; Alamri, M.M.; Saud, M.S.B.; Kamin, Y.B.; Aljeraiwi, A.A.; Alhamed, O.A. Big Data Adoption and Knowledge Management Sharing: An Empirical Investigation on Their Adoption and Sustainability as a Purpose of Education. Ieee Access 2019, 7, 47245–47258. (In English) [Google Scholar] [CrossRef]
- Almaiah, M.A.; Alamri, M.M.; Al-Rahmi, W.M. Analysis the Effect of Different Factors on the Development of Mobile Learning Applications at Different Stages of Usage. Ieee Access 2020, 8, 16139–16154. (In English) [Google Scholar] [CrossRef]
- Islam, A.Y.M.A.; Mok, M.M.C.; Gu, X.; Spector, J.; Hai-Leng, C. ICT in Higher Education: An Exploration of Practices in Malaysian Universities. Ieee Access 2019, 7, 16892–16908. (In English) [Google Scholar] [CrossRef]
- Pelling, E.L.; White, K.M. The theory of planned behavior applied to young people’s use of social networking web sites. Cyberpsychol. Behav. 2009, 12, 755–759. (In English) [Google Scholar] [CrossRef] [PubMed]
- Kim, B. Understanding antecedents of continuance intention in social-networking services. Cyberpsychol. Behav. Soc. Netw. 2011, 14, 199–205. (In English) [Google Scholar] [CrossRef] [PubMed]
- Liaw, S.S.; Huang, H.M. Perceived satisfaction, perceived usefulness and interactive learning environments as predictors to self-regulation in e-learning environments. Comput. Educ. 2013, 60, 14–24. [Google Scholar] [CrossRef]
- Umek, L.; Keržič, D.; Aristovnik, A.; Tomaževič, N. Analysis of selected aspects of students’ performance and satisfaction in a Moodle-based e-learning system environment. Eurasia J. Math. Sci. Technol. Educ. 2015, 11, 1495–1505. [Google Scholar]
- Galán, S.L.; Galán, S.L.; López, L.M. What Drives Students’ Satisfaction with Instruction? Espacios 2018, 39, 13–29. Available online: http://www.revistaespacios.com/a18v39n17/18391713.html (accessed on 10 June 2021).
- Guest, R.; Rohde, N.; Selvanathan, S.; Soesmanto, T. Student satisfaction and online teaching. Assess. Eval. High. Educ. 2018, 43, 1084–1093. [Google Scholar] [CrossRef]
- Matosas-López, L.; Bernal-Bravo, C. Presence of ICT in the design of BARS for the assessment of teaching efficiency in online modalities. Psychol. Soc. Educ. 2020, 12, 43–56. [Google Scholar] [CrossRef]
- Venkatesh, V.; Bala, H. Technology acceptance model 3 and a research agenda on interventions. Decis. Sci. 2008, 39, 273–315. [Google Scholar] [CrossRef]
- Al-Rahmi, W.M.; Yahaya, N.; Alamri, M.M.; Aljarboa, N.A.; Kamin, Y.B.; Moafa, F.A. A model of factors affecting cyber bullying behaviors among university students. Ieee Access 2019, 7, 2978–2985. (In English) [Google Scholar] [CrossRef]
- Hair, J.F., Jr.; Babin, B.J.; Krey, N. Covariance-Based Structural Equation Modeling in the Journal of Advertising: Review and Recommendations. J. Advert. 2017, 46, 163–177. (In English) [Google Scholar] [CrossRef]
- Berraies, S.; Yahia, K.B.; Hannachi, M. Identifying the effects of perceived values of mobile banking applications on customers: Comparative study between baby boomers, generation X and generation Y. Int. J. Bank Mark. 2017, 35, 1018–1038. (In English) [Google Scholar] [CrossRef]
- Fan, R.J.D.; Tan, P.J.B. Application of information technology in preschool aesthetic teaching from the perspective of sustainable management. Sustainability 2019, 11, 2179. (In English) [Google Scholar] [CrossRef]
- Al-Rahmi, W.M.; Alias, N.; Othman, M.S.; Ahmed, I.A.; Zeki, A.M.; Saged, A.A. Social media use, collaborative learning and students’ academic performance: A systematic literature review of theoretical models. J. Theor. Appl. Inf. Technol. Rev. 2017, 95, 5399–5414. (In English) [Google Scholar]
- Teo, T. Modeling the determinants of pre-service teachers’ perceived usefulness of e-learning. Campus-Wide Inf. Syst. 2011, 28, 124–140. (In English) [Google Scholar] [CrossRef]
- Macharia, J.K.N.; Pelser, T.G. Key factors that influence the diffusion and infusion of information and communication technologies in Kenyan higher education. Stud. High. Educ. 2014, 39, 695–709. (In English) [Google Scholar] [CrossRef]
- Al-Rahmi, W.M.; Othman, M.S.; Yusuf, L.M. Effect of engagement and collaborative learning on satisfaction through the use of social media on Malaysian higher education. Res. J. Appl. Sci. Eng. Technol. 2015, 9, 1132–1142. (In English) [Google Scholar] [CrossRef]
- Al-Rahmi, W.M.; Yahaya, N.; Alamri, M.M.; Alyoussef, I.Y.; Al-Rahmi, A.M.; Kamin, Y.B. Integrating innovation diffusion theory with technology acceptance model: Supporting students’ attitude towards using a massive open online courses (MOOCs) systems. Interact. Learn. Environ. 2019. (In English) [Google Scholar] [CrossRef]
- Agrawal, A.K.; Mittal, G.K. The Role of ICT in Higher Education for the 21st Century: ICT as A Change Agent for Education. In Multidisciplinary Higher Education, Research, Dynamics & Concepts: Opportunities & Challenges For Sustainable Development; Varshney, P.K., Agrawal, G., Eds.; Swaranjali Publication: Ghaziabad, India, 2018; ISBN 978-93-87662-12-4. [Google Scholar]
- Al-Rahmi, W.M.; Othman, M.S.; Yusuf, L.M. Using social media for research: The role of interactivity, collaborative learning, and engagement on the performance of students in malaysian post-secondary institutes. Mediterr. J. Soc. Sci. 2015, 6, 536–546. (In English) [Google Scholar] [CrossRef][Green Version]
- Aristovnik, A.; Keržič, D.; Ravšelj, D.; Tomaževič, N.; Umek, L. Impacts of the COVID-19 pandemic on life of higher education students: A global perspective. Sustainability 2020, 12, 8438. [Google Scholar] [CrossRef]
- Heilporn, G.; Lakhal, S.; Bélisle, M. An examination of teachers’ strategies to foster student engagement in blended learning in higher education. Int. J. Educ. Technol. High. Educ. 2021, 18, 1–25. [Google Scholar] [CrossRef]
- Owston, R.; York, D.; Murtha, S. Student perceptions and achievement in a university blended learning strategic initiative. Internet High. Educ. 2013, 18, 38–46. [Google Scholar] [CrossRef]
- Matosas-López, L.; Aguado-Franco, J.; Gómez-Galán, J. Constructing an instrument with behavioral scales to assess teaching quality in blended learning modalities. J. New Approaches Educ. Res. (NAER J.) 2019, 8, 142–165. [Google Scholar] [CrossRef]
- Bala, M. Use of ICT in Higher Education. In Multidisciplinary Higher Education, Research, Dynamics & Concepts: Opportunities & Challenges For Sustainable Development; Varshney, P.K., Agrawal, G., Eds.; Swaranjali Publication: Ghaziabad, India, 2018; ISBN 978-93-87662-12-4. [Google Scholar]
- Dave, D. An analytical study of the role of ICT in Higher Education. J. Glob. Econ. 2019, 15, 56–61. [Google Scholar]


Publisher’s Note: MDPI stays neutral with regard to jurisdictional claims in published maps and institutional affiliations. |
© 2021 by the authors. Licensee MDPI, Basel, Switzerland. This article is an open access article distributed under the terms and conditions of the Creative Commons Attribution (CC BY) license (https://creativecommons.org/licenses/by/4.0/).