1. Introduction
Private label brands (also called store brands, house brands, reseller brand or distributor brands) are brands developed by retailers or wholesalers [
1]. The private label brands are used by retailers as a way to differentiate their retail formula and assortment from their competitors. Private label brands can carry the retailer’s own name or a name created and used exclusively by that retailer [
2]. Besides their private label products, most retailers sell mainly national brands (also called manufacturer brands or producer brands), which include products that are nationally or internationally widely available and not just limited to one retailer or region. Over the last decade, the market share of private label brands has kept increasing in European countries. Data in the most recent PLMA Yearbook show that private label brands’ market share climbed in nearly all of the 20 countries tracked by Nielsen for the report. In 2019, private label brands accounted for 40% or more of the products sold in seven European countries, Spain (51%), Switzerland (49%), United Kingdom (47%), Germany (45%), Belgium (44%), Austria (43%) and Portugal (41%), and were also becoming stronger in emerging retail markets such as Hungary (34%), Poland (31%), Czech Republic (30%) and Slovakia (32%) [
3].
Through their private label brands, retailers originally aimed to provide consumers with a more budget-friendly alternative to the so-called national brands. With the surge of competition from hard discounters, however, retailers have looked for ways to differentiate themselves and increase margins. Kotler and Keller [
1] indicate that retailers are increasingly developing exclusive store brands and are also adding premium private label brand items (also called value-added private labels) to their private label brand assortments to differentiate themselves from competitors. Coelho do Vale et al. [
4] concluded that the main factor for consumers’ private label loyalty is the perceived quality. While the initial positioning strategy of private label brands was based on low price, their study shows evidence that the adoption of private labels is no longer dependent on its initial pricing strategy but has shifted toward quality [
4].
Meanwhile, the increasing public attention for sustainability over past decades left retailers with the question on how they could meet these new societal challenges and improve their store image regarding sustainability [
5]. While many retailers added sustainability objectives to their corporate values and took steps to make their retail space more energy friendly, reduce waste such as plastic bags and packaging and lower their carbon footprint, such measures did not take the sold goods into account [
6]. Miller and Merrilees [
7] reported that consumers’ perceptions of the retailers’ environmental management practices influence their attitudes toward the retailers. Another way retailers started to express their sustainability identity was through their choice of premium private labels such as private label organic products. The development of an assortment of private label branded organic foods herewith exemplifies this evolution. It underscores corporate social responsibility and allows retailers to demonstrate that they take sustainability issues seriously [
8], while simultaneously meeting changing consumer demands, e.g., with respect to sustainable food. For example, Niclaes and Nies [
9] report that major retailers in Belgium—the country where the present study has been performed—carry between 200 and 500 organic references within their private label brand assortment. Their market analysis further indicates that private label organic products are, on average, 45% more expensive than the equivalent nonorganic private label brand and 5% more expensive than the equivalent nonorganic national brand. Data from the IPLC study in 2017 shows that, in Belgium, organic is the leading category within premium private label brands, and organic references account for 7.8% of the total private label references offered by retailers [
8].
A recent systematic review of consumer studies by Tobi et al. [
10] indicated the high value of food labeling schemes on environmental and social responsibility for consumers and their preference for organic labels, in particular. In markets where legislation guarantees production processes and food origin, private label products certified with quality food labels (such as organic labels) are responding to consumer demand with affordable premium products and are capturing a good part of these segments’ growth. While these premium private labels might assist retailers to distinguish their product mix from competitors, they also “place national brands and private labels more directly in price and quality competition” [
3]. Retailers also strive to enhance their image by offering high quality products and expect that these premium private label food products (such as organic) will provide them with the image of a premium retailer [
11]. In line with this, Konuk [
12] reported for Turkish consumers that trustworthiness of organic private label food products is mainly determined by store image.
Numerous studies have examined organic food consumption and its determinants as a more sustainable alternative to conventional food. However, only a few organic food studies have also incorporated the concept of private label brands [
13,
14,
15,
16,
17]. The study by Bauer et al. [
13], who implemented an online experimental survey in Germany using cereal products as product category, revealed that the use of an organic label increased the perception of both branded and private labeled products on attributes such as healthiness, hedonism, environmental friendliness and food safety. Positive effects of organic labeling were also observed in terms of purchase intention and willingness to pay. Furthermore, this study indicated that private label products benefited more strongly from organic labeling than branded products. The study herewith underscored the strong potential of organic labeling in fostering the perceived value of private label products. Meanwhile, branded products gained relatively less from carrying an organic label. The choice experimental study by Meas et al. [
14] in the USA using blackberry jam as product category indicated that national brands were, in general, more likely to be preferred and higher valued by consumers than “store brands”—the term used in this study when referring to private label products. The study also revealed that the preference for the brand attribute (national, regional or store brand) was very heterogeneous among the study sample, which supports the idea of segmentation when studying consumer preferences in this context. The analysis did not deal with interaction effects between branding and organic labeling, and, therefore, it did not reveal complementary or substitute effects between branding and organic labeling. Perrini et al. [
15] studied consumers’ interest and trust in private label organic foods in Italy through a survey with yoghurt as the focal product category. The study revealed that consumer trust in private label organic products rises when trust in organic products, in general, and trust in the retailer’s private label rises. Increased trust also triggered brand loyalty and willingness to pay a price premium. This study herewith demonstrated that private labels and organic labeling are a possible match in the sense that both attributes can simultaneously trigger favorable consumer responses. The study of Pivato et al. [
16] indicated that corporate social responsibility (CSR) and performance by retailers influence organic food consumers’ trust toward the involved retailers; organic products, in general; and private label organic products, specifically. Increased trust also positively contributed to consumers’ brand loyalty. Finally, the study by Ngobo [
17], which analyzed retail-level scanning data from two French cities as test markets, indicated that consumers are more likely to buy organic “store brands” (i.e., private label brands) as compared to organic national brands. Besides profiling households purchasing organic foods as higher-income, higher-level occupations, college educated and older, this study also revealed significant heterogeneity in households’ responses to organic private label brands and the way in which consumers buy organic private label brands.
Some of these empirical studies recommend more research on the combination of organic labeling and brands (national and/or private label brands), eventually also covering different product categories and countries [
13,
17] and accounting for heterogeneity among consumers [
14,
17]. For example, in Belgium, all major retailers are now selling organic products under their own private labels. Belgian supermarkets are the key distribution channel for organic food (44.1%), followed by specialty stores, with a share of 30.6 % [
18]. Many consumers looking for organic food are thus facing organic food from the private label brands and have to make trade-offs with national brands. Therefore, it is relevant to account for the possible role of branding in organic food studies. To address the research gap on this emerging trend, this study evaluates the willingness to pay (WTP) for national brand versus private label organic products for two product categories (eggs and orange juice) as study cases. As compared to previous studies, the novelty of the present study is that it covers two product categories using the same research methodology (i.e., a choice experiment) and that it explicitly addresses heterogeneity among consumers through implementing latent class segmentation analysis.
2. Materials and Methods
2.1. Data Collection
The data were collected through a cross-sectional consumer survey in the northern, Dutch speaking part of Belgium (Flanders) (n = 693) in 2013. Participants were selected from a proprietary consumer panel, managed by the market research company responsible for data collection. Inclusion criteria were being aged 18 years or older and being involved in household food purchasing. All contact and questionnaire administration procedures were done electronically, and participants’ anonymity was guaranteed. Members of the market research company’s consumer panel were invited to participate in this study by email. The email contained a link which directed them to this study’s Qualtrics survey.
2.2. Questionnaire Content
The survey instrument included choice experiment (CE) questions and questions regarding attitudes, including trust and perceived quality, toward organic food and private labels, as well as the sociodemographic characteristics of the participants. Sociodemographic characteristics included gender, age, education level, living situation and occupational status.
Attitude toward organic food was measured using 7-point semantic differential scales. Participants were presented with the statement, “Please indicate which word best describes how you feel about consuming organic food products compared to conventional food products”. The bipolar adjectives were bad/good, unpleasant/pleasant and negative/positive, i.e., a commonly used scale for assessing (explicit) attitude [
19,
20,
21,
22]. The score for this construct for each participant was calculated as the average across the three items (Cronbach’s α = 0.93). Attitude toward private label brands was measured with the 6-item construct from Burton et al. [
23] using a 7-point agreement scale from “totally disagree” to “totally agree”. The statements included, for example, “Buying private label brands makes me feel good”, and “I love it when private label brands are available for the product categories I purchase”. This construct has been applied previously in the private label brand literature [
24,
25,
26]. The average across the six items (Cronbach’s α = 0.87) was used as a measure of (explicit) attitude toward private label brands. Trust in private label products was measured on a 7-point agreement scale ranging from “totally disagree” to “totally agree” using two items from Janssen and Hamm [
27]. The statements used to measure trust were, “I trust food products from the private label of the retailer”, and “I have confidence in the food products from the private label of the retailer”. The average score was used as a measure for trust in private label products (Cronbach’s α = 0.94). In a similar vein, trust in private label organic products was measured using the average score (Cronbach’s α = 0.94) of the two statements, “I trust organic products from the private label of the retailer”, and “I have confidence in organic products from the private label of the retailer”, adapted from Janssen and Hamm [
27]. To measure how consumers perceive the quality of private label products and private label organic products, a 3-item construct measured on a 7-point scale was adapted from Beristain et al. [
28]. Perceived quality of private label products was the average across the three items (Cronbach’s α = 0.89), for example, “Private label products of the retailer are of high quality”, and “Private label products of the retailer give me the result I am looking for”. Perceived quality of private label organic products was the average across three items (Cronbach’s α = 0.88), for example, “Private label organic products from the retailer are of high quality”.
2.3. Choice Experiment Design
Two CEs were conducted in the study, one for each product category (i.e., eggs and orange juice). Firstly, eggs is the food product category with the highest price difference between organic and conventional, with organic eggs being twice to 2.5 times more expensive [
18]. Additionally, as compared to other organic foods, organic eggs have a large market share (9.9%) in Belgium. Eggs are commonly sold as 6-, 10- or 12-packs. We chose a 10-pack for eggs, as in this case study, participants could easily convert the package price to the unit price for one egg in case they would prefer to reason in those terms. Secondly, we incorporated orange juice, as this product category, in contrast to eggs, has strong national brands. Major retailers in Belgium sell both eggs and orange juice with their private label, and this also includes organic product versions in both categories. For juice, we chose 1L as unit of reference, as this is the most common package in Belgium. Its price also reflects the unit price per liter, and, therefore, there is no need to list two prices, i.e., a unit price and price per liter.
We opted to use a CE, since this allows for estimating the value of multiple attributes simultaneously and, as compared to other valuation methods, is very similar to real purchasing decisions. While other valuation methods may ask to rate a product or to report the WTP, a CE asks participants to make a product choice among the product alternatives presented to them, which are described with various product attributes. Making product choices rather than product rating or reporting WTP makes CE similar to what consumers do in a real shopping scenario.
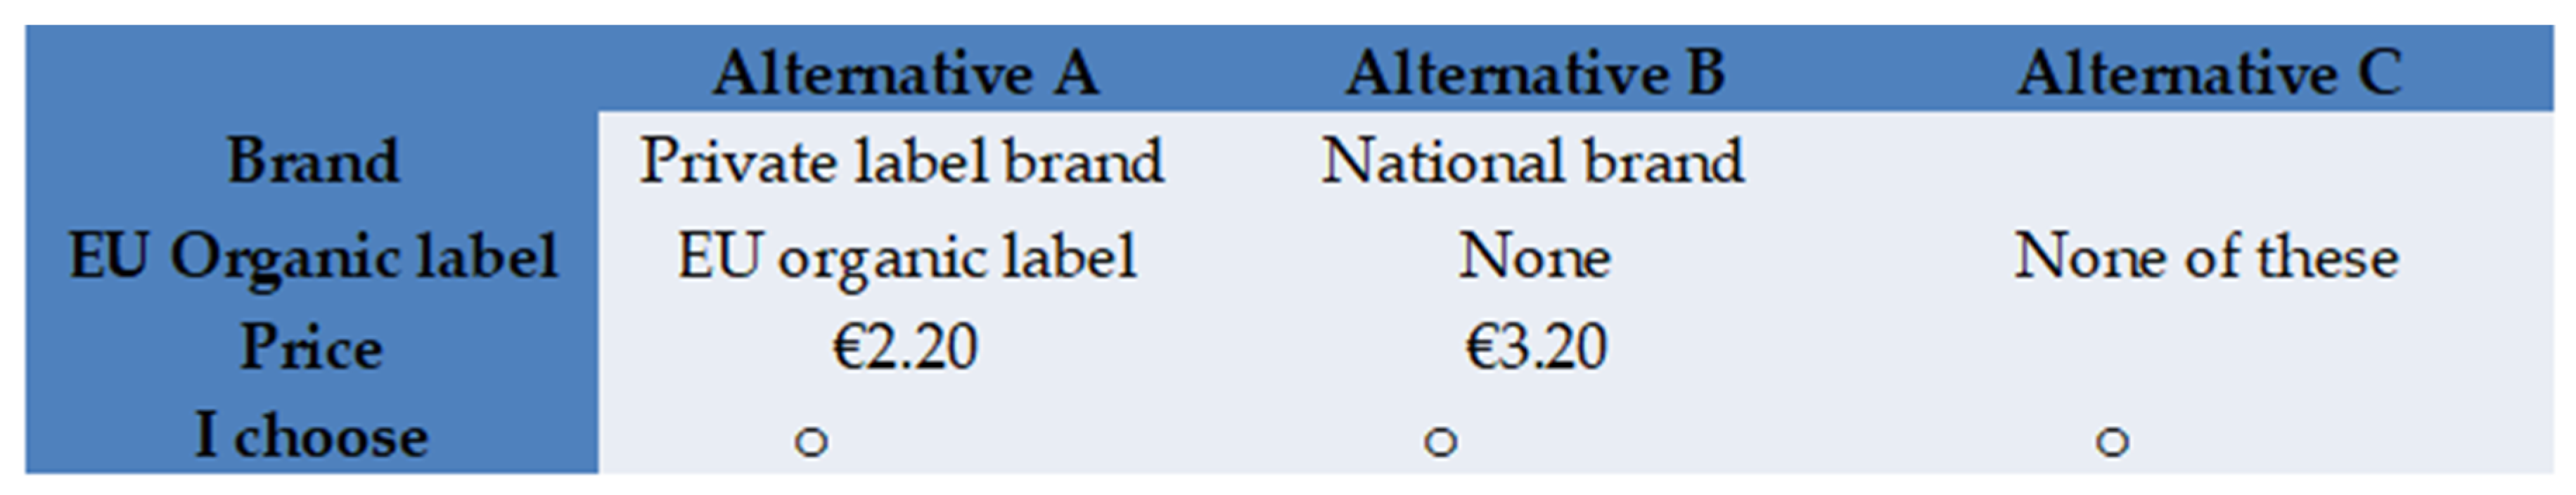
Therefore, CEs have been a popular technique used in consumer valuation studies. All the choice sets included two unlabeled alternatives consisting of product profiles with different levels of the attributes and the no-buy option. The attributes included were brand, organic label and price (
Table 1). The levels of the price attribute were chosen based on the actual prices of eggs and orange juice gathered during a store check in Belgian food stores.
The CE design followed the procedures suggested by Street and Burgess in 2007 [
29] and started with a full factorial design of 16 profiles. After applying the design generators, a practical set of 16 pairs were obtained with a D-efficiency of 94%. The 16 choice sets were then divided into two blocks of eight. An example of a choice set is shown in
Figure 1. Note that, in some cases, conventional eggs from a national brand may be more expensive than organic eggs of the same size/weight from a private label brand, as is shown in the choice set in
Figure 1. The participants were randomly assigned to one of these two blocks for the CE on eggs and on juice. Due to the hypothetical nature of our CE, a cheap talk script was included to potentially reduce hypothetical bias by explaining the importance of reacting as realistically as possible [
30,
31,
32]. Before answering the questions, participants were provided with information about the two attributes, organic and the brand. Both the meaning of the EU organic label and the information about the different types of brands (private labels and national brands) were given.
2.4. Model Specification
CEs are based on the Lancasterian consumer theory [
33], which assumes that utility of a good can be segregated in utilities of different attributes of a product and proposes that consumers make choices based on preferences for the attributes of these goods. Choice modeling assumes that study participants choose the alternative from each choice set to maximize their utility subject to their budget constraints. In accordance with random utility theory [
34], the utility of individual n choosing alternative j in choice situation t can be represented as:
where x
njt is a vector of observed variables relating to alternative j and individual n; β
n is a vector of structural taste parameters, which characterize choices; and ε
njt is the unobserved error term, which is assumed to be independent of β and x.
Rather than using conditional logit models, which assume homogeneous taste preferences, we used a latent class (LC) approach that accounts for heterogeneity in consumers’ taste preferences, i.e., allowing for different consumer segments to be present and identified. Each segment is characterized by class-specific utility parameters. The LC model assumes that consumer preferences within each segment are homogeneous and that these preferences vary between segments. This modeling approach gives a better understanding of the preferences for various market segments and allows the anticipation of varying valuation patterns, possibly leading to a differentiated marketing strategy based on the segments identified [
35]. In the LC model, two sets of variables require specification: the variables entering the utility function and the variables explaining the class membership.
The utility of individual n choosing alternative j in choice situation t, given that individual n is in class c, can be represented as:
where β
c is the parameter vector of class c associated with the explanatory variables x
njt and ε
njt is the unobserved error term.
In the utility specification, the attributes Brand and Organic are dummy coded; Brand takes the value 1 if national brand and 0 if private label brand is present; Organic takes the value 1 if the organic label is present and 0 otherwise. The utility specification also includes the interaction between the dummy variables Brand and Organic. The Price variable is considered a linear effect variable and takes the price of one package of 10 large eggs or the price of 1 L of cardboard packed (tetra-packed) pasteurized orange juice. No_Buy is a dummy variable taking the value 1 when the no-buy option is chosen and 0 when either product profile A or B is selected. β0 is the alternative-specific constant representing the no-buy option.
In a LC model, in addition to the specification of the utility function, a specification for the class membership function is defined. Both attitude toward organic food and attitude toward private label brands were included as variables explaining the segment membership. The WTP is calculated as the negative ratio of the parameter (coefficient estimate) of the attribute to the parameter of price (For example, the segment Eggs_1 is willing to pay a €0.22 premium (=1.01/4.68) for a package of 10 organic eggs, as calculated using the coefficient estimates).
The LC approach allows us to profile the segments by assigning each participant to a segment based on the highest probability of belonging to a segment. Differences between segments and associations between segment membership and sociodemographic variables are analyzed using independent samples Kruskal–Wallis tests in case of ratio scaled variables (e.g., age, trust in private label products) and chi-square association tests in case of categorical variables (e.g., education and occupational status). Wilcoxon signed-rank tests were performed for pairwise comparison of variables.
3. Results and Discussion
A total of 693 consumers completed the survey and the sociodemographic analysis is shown in
Table 2. A majority of the sample were women (65%). The age of the participants is well distributed over different age groups, and 77% have higher education degrees. The majority (61%) are cohabiting without children under 15 years.
Both the attitude toward organic products (mean = 4.98; S.D. = 1.27 on 7-point scale) and the attitude toward private label products (mean = 4.52; S.D. = 1.13 on 7-point scale) were favorable on average. Both attitude scores were very weakly and negatively correlated (Pearson r = −0.09; p = 0.013). Trust in private label brands (mean= 5.41; S.D. = 1.21 on 7-point scale) and the perceived quality of private label brands (mean= 5.09; S.D. = 1.19 on 7-point scale) were high among participants. However, participants reported lower trust in private label organic products (mean= 5.02; S.D. = 1.19 on 7-point scale) compared to trust in private label products (p < 0.001). Furthermore, participants perceived the quality of private label organic products (mean = 4.74; S.D. = 1.09 on 7-point scale) to be lower compared to the perceived quality of private label brands (p < 0.001). These results suggest that retailers might not have fully achieved their objective to create a premium image through private label organic products. However, there are some differences among the identified consumer segments, which are described later on. Price is identified as a barrier for organic food purchases, with 73% of participants agreeing that organic food is too expensive and 70% agreeing that they would buy more organic food if it was less expensive.
LC models with a different number of classes were estimated using the utility specification as well as the attitudes toward organic food and toward private label brands as explanatory variables for the class membership. Interaction between brand and organic was not significant and, therefore, no longer included in the final model. This specification was used to estimate models with two to five latent classes. Based on the model fits and their interpretation, the three-segment solution was selected. The outcomes of the one-segment model are also shown for comparison.
In the one-segment model (MNL model) for eggs (
Table 3) and juice (
Table 4), the coefficient of the no-buy option was negative and statistically significant, suggesting that consumers increase their utility more when choosing one of the presented products (options A and B) than when choosing the no-buy option. The price coefficient is negative and statistically significant, indicating that consumer utility decreases with increasing price. Both for eggs and juice, the coefficient for organic is positive, indicating an increased utility when the eggs or juice are certified organic. However, differences exist in terms of brand preferences for eggs and juice. While, for juice, the utility increases when a national brand is present compared to a private label brand, this is not the case for eggs, where the coefficient for brand is not statistically significant. This might reflect the strong presence of national brands for juice, while national brands for eggs are far less known.
The LC model for eggs (
Table 3) results in three segments with class probabilities of 52.0%, 24.5% and 23.5%. The segment membership function coefficients for Eggs_1 show that the probability of belonging to this segment is positively associated with attitude toward private label brands. The coefficient estimate for brand is negative and statistically significant, indicating that the utility for eggs with a national brand is lower than for eggs with the private label brand. Eggs_1 is, on average, willing to pay €0.17 more for a package (10 eggs) of private labeled eggs as compared to eggs with a national brand (
Table 5). The presence of an organic label increases the utility for this group. However, due to their high price sensitivity, their WTP premium for organic eggs is only €0.22 (
Table 5). Eggs_1 is significantly younger of age (mean = 38.8; S.D. = 0.80). Eggs_2 has a significantly less favorable attitude toward private label brands than segment 3 and a more positive attitude toward organic food (
Table 2 and
Table 3). This is also reflected in the utility parameters for Eggs_2, which are not significant for brand but significant and positive for the organic label. Eggs_2 is associated with more middle-aged consumers and those having a university degree (
Table 2). Eggs_2 is less price sensitive than Eggs_1 and is willing to pay €3.53 extra for (a package of 10) organic eggs. Eggs_2 also scores lower on perceived quality of private label brands (mean = 4.84; S.D. = 1.23 on 7-point scale). However, they perceive the quality of private label organic products higher (mean = 5.32; S.D. = 1.03 on 7-point scale) than the other segments. This might suggest that, for Eggs_2, retailers have accomplished creating a premium image of private label organic products. For Eggs_3, only price is a significant attribute. Eggs_3 is associated with older age, lower education and more retired and more unemployed consumers (
Table 2). For all of the three segments, the presence of a national brand for eggs does not result in a higher utility compared to a private label brand. Eggs_1 (52%) even prefers eggs with the private label brand over eggs from the national brand. Organic eggs are valued by three-quarters of the consumers, but only one-quarter of the study participants is willing to pay at least the current market price.
The LC model for juice (
Table 4) results in three segments with class probabilities of 45.4%, 29.8% and 24.7%. The segment membership function coefficients for Juice_1 show that the probability of belonging to this segment is positively influenced by attitude toward private label brands. The coefficient estimate for brand shows that Juice_1 does not increase its utility if a national brand is present and does not want to pay extra for national brand juice. The price coefficient is largely negative, and, thus, this segment’s utility decreases substantially with an increase in price, illustrating the high price sensitivity for this segment. The presence of an organic label does not result in an increase in utility for this segment. Juice_1 is associated with younger age (mean = 38.4, S.D. = 14.1) and fewer part-time-working, retired or unemployed consumers (
Table 2). The probability of belonging to Juice_2 is negatively associated with attitude toward private label brands. This is in line with this segment’s significant positive coefficient for national brand resulting in WTP premium of €2.16/L for a national brand orange juice as compared to a private label orange juice (
Table 6). Juice_2 has a more favorable attitude toward organic products than the other segments and a less favorable attitude, lower trust and lower perceived quality of private label brands (
Table 2). The coefficient for organic is the largest for Juice_2 as compared to the other segments, and this segment has the smallest price sensitivity. Juice_2 is willing to pay €3.43/L extra for organic orange juice as compared to conventional juice. Although Juice_2 is less favorable toward private label brands, their trust in private label organic products is higher than other segments, and they also perceive the quality of private label organic products to be higher (
Table 2). Juice_3 has a positive coefficient estimate for organic and is willing to pay €0.18/L extra for it. Juice_3 is associated with older age and a higher share of retired consumers. The LC model for juice shows that price is a very important attribute for juice consumers. More than half of the consumers also value an organic label and are willing to pay more for it. Juice_2 (30%) values both a national brand and an organic label on orange juice.
In line with the findings reported Meas et al. [
14] and Ngobo [
17], our study addressed consumer heterogeneity and identified distinct segments with a different interest in private label vs. national branded organic products. However, any direct comparison of our findings with those of previous studies [
13,
14,
15,
16,
17] that all focused on other product categories is rather void, as the preferences for national brand and private label differ across food categories.
4. Conclusions
Our results illustrate that preferences for national brand compared to private label brand as well as preference for organic food depend on the food category. In the specific case of eggs, more than half of the consumers preferred private label branded eggs over national brand eggs. Over 75% of the consumers valued organic eggs, though only a quarter was willing to pay a price premium that would be substantial enough to meet the price difference with conventional eggs, whereas another quarter of consumers was indifferent about the brand and the organic production for eggs. For eggs, 25% of the consumers were willing to pay a significant premium for organic production but not for national brands, showing the large potential for private label branded organic eggs.
For orange juice, national brand was clearly most preferred, with nearly 75% of the consumers preferring the national brand over the private label brand. For orange juice, the largest segment (45%) preferred the national brand over the private label brand while not caring much for an organic label, while a second segment (30%) preferred both organic and national brands and was willing to pay a premium.
For both product categories covered in the study, consumers who were most positive toward private label brands, in general, were characterized by younger age and a higher price sensitivity. Consumers who were most positive toward organic products (including organic products sold under private label brands), as well as willing to pay the largest price premium for organic products, were characterized by middle-age, higher education and a part-time working situation.
While our study was focused on Flanders (Belgium), future studies are recommended to evaluate consumer preferences for organic private label branded food in other countries. In addition, our study dates from a few years back, and, while we believe the market did not change dramatically in terms of presence of private label brands in the last decade in Belgium (e.g., according to the figures cited in the PLMA Yearbook, private label sales in Belgian supermarkets increased only slightly from 40% 2011 to 44% in 2019 [
3,
36]), it could be interesting to replicate this study in the near future and assess eventual shifts or persistence in consumer reactions toward private label branded organic food products.
The results and insights from this study are valuable for both the organic food sector and retailers selling eggs or orange juice with their private label brand and who are diversifying their product portfolio, specifically in terms of sustainability through supplying organic products. The insights from this study also demonstrate the importance of studying consumer preferences for specific and concrete food categories rather than overall concepts such as organic food or national branded foods.


