Article

Treatment Effect of Exercise Intervention for Female College Students with Depression: Analysis of Electroencephalogram Microstates and Power Spectrum

1
School of Sports, Shaanxi Normal University, Xi’an 710119, China
2
Centre for Sport and Exercise Sciences, University of Malaya, Kuala Lumpur 50603, Malaysia
*
Author to whom correspondence should be addressed.
Sustainability 2021, 13(12), 6822; https://doi.org/10.3390/su13126822
Submission received: 20 April 2021 / Revised: 9 June 2021 / Accepted: 11 June 2021 / Published: 16 June 2021

Abstract

:
This paper aims to assess the effect of exercise intervention on the improvement of college students with depression and to explore the change characteristics of microstates and the power spectrum in their resting-state electroencephalogram (EEG). Forty female college students with moderate depression were screened according to the Beck Depression Inventory-II (BDI-II) and Depression Self-Rating Scale (SDS) scores, and half of them received an exercise intervention for 18 weeks. The study utilized an EEG to define the resting-state networks, and the scores of all the participants were tracked during the intervention. Compared with those in the depression group, the power spectrum values in the θ and α bands were significantly decreased (p < 0.05), and the duration of microstate C increased significantly (p < 0.05), while the frequency of microstate B decreased significantly (p < 0.05) in the exercise intervention group. The transition probabilities showed that the exercise intervention group had a higher probability from B to D than those in the depression group (p < 0.01). In addition, the power of the δ and α bands were negatively correlated with the occurrence of microstate C (r = −0.842, p < 0.05 and r = −0.885, p < 0.01, respectively), and the power of the β band was positively correlated with the duration of microstate C (r = 0.900, p < 0.01) after exercise intervention. Our results suggest that the decreased duration of microstate C and the increased α power in depressed students are associated with reduced cognitive ability, emotional stability, and brain activity. Depression symptoms were notably improved after exercise intervention, thus providing a more scientific index for the research, rehabilitation mechanisms, and treatment of depression.

1. Introduction

Depression is a common chronic mental disorder with complicated causes and low rehabilitation rates [1]; its clinical symptoms include low mood, anxiety, insomnia, cognitive impairment, and even suicidal thoughts [2]. Currently, college students are at a high risk of depression. In recent years, the problem of depression has become increasingly serious and has a negative impact on an individual’s physical and mental health, damaging their careers and even their lives [3].
From the perspective of clinical psychology, depression is the result of a combination of factors, which are related to the patient’s age, personality, education level, physical illness, life pressure, family environment, lack of physical activity, and other factors [4,5]. The study of the pathogenesis of depression mainly involves neurobiological research. It is generally believed that the etiology of depression is related to neuroendocrine disorders, neurotransmitter concentration changes, autonomic dysfunction, and changes in the function of cognitive-related brain areas [6,7,8,9]. Therefore, it is very important to analyze the changes in the brain function of college students with depression to reveal its pathogenesis.
The focus of treatment for people with depression consists of antidepressants and psychotherapies [10]. Exercise therapy is considered to be the least expensive and most effective complementary treatment for depression [11]. Exercise plays a significant role in improving the symptoms of patients with depression; it improves their physical health and also improves their strategies under pressure, quality of life and, independence in daily activities [12]. For mild to moderate depression, exercise can be as effective as antidepressants and psychotherapy. For major depression, exercise is also a valuable supplement to traditional therapy [13]. Current guidelines from the World Health Organization (WHO) [14] and the UK’s National Institute for Health and Clinical Excellence (NICE) [15] recommend physical activity as part of the standard treatment for depression.
Although the evidence for the positive effects of exercise training on depression is growing, the clinical use, at least as an adjunct to established treatment approaches such as psychotherapy or pharmacotherapy, is only just beginning [16]. Further research into the practical effects of exercise, its interactions with standard treatments and details of the optimal type, intensity, frequency, and duration of exercise may further support its clinical use in patients. In recent years, articles have shown that organized sports have been associated with decreased depressive symptoms, increased self-esteem, and improved social abilities [17]. Sport is a popular activity that is easy to organize at school. College students have flexible time, plenty of places to play and a wide variety of different forms of activity. Among them, team sports games combine the advantages of both group counselling and sports as typical interventions for mental illness and have a positive impact on improving the mental health of college students. Compared with individual sports, team sports provide more entertainment opportunities and enhance the fun of the game, thus changing the goal orientation of the players. Whereas team sports depend on the support of their teammates, individual sports rely only on the individual’s own preparation and skill level to achieve success [18].
A depressed mood is closely linked to brain activity [19]. The main clinical features of depression are affective dysfunction and cognitive impairment, both of which are related to dysfunction in different brain areas [20]. Electroencephalography (EEG) provides valuable information for the accurate identification of depression. “Since the temporal and frequency variation in resting-state brain network dynamics may be a significant biomarker of illness and therapeutic outcome” [21], microstate and power spectrum analysis are suitable tools for the purposes of this study.
EEG microstate analysis is defined as global patterns of scalp potential topographies [22], with inherent high temporal resolution and high test-retest reliability. It uses multichannel EEG arrays to study sub-second dynamic changes in brain activity [23], representing the real-time functional state of the brain. Koenig et al. [24] proposed that the brain’s topographic maps were divided into four categories: A, B, C, and D, reflecting the activation of different neurons. For example, microstate A is associated with auditory networks for phonological processing, microstate B represents the visual network of visual image processing, microstate C plays a key role in switching between the central-executive function and the default mode, and microstate D is more involved in the switching and reorientation of attention [25,26].
EEG power spectrum analysis is an EEG signal analysis technique for the diagnosis of brain diseases [27], and its results are an important indicator for clinical diagnosis and research [28]. The power spectrum in different bands can reflect people’s different states. There will be a δ band in the case of extreme fatigue and lethargy, an θ band is more significant when setbacks occur in depression, an α band is one of the basic rhythms, when nervous an emotional β band occurs, and a higher frequency γ band is often seen when an individual is awake and focused on something [29]. Additionally, researchers have found that the power spectrum of EEG signals in different bands of depressed patients was significantly different from that of healthy individuals [20].
Currently, researchers have made some achievements in the identification, treatment, and evaluation of depression. They see faulty prospection as a core underlying process that drives depression. This framework points to testable predictions about the development and treatment of depression [30]. A better understanding of the disruption and the changes in brain network dynamics in depression is critical for developing novel and targeted treatments [9]. It is well known that exercise plays an observable role in improving mental illness [8], but there are still few studies on the influence of exercise intervention on EEG microstates and the power spectrum in depression. Thus, the main goal of our study was to explore how resting-state microstates and the power spectrum are affected in depressed students compared to healthy individuals and the therapeutic potential of exercise interventions for depression. We hypothesized that depressed students would show different microstate dynamics from healthy controls in terms of the temporal characteristics of the EEG microstates, the amplitude values of the power spectrum, and the correlation between the two. We also hypothesized that an exercise intervention will improve the clinical severity of depression and abnormal brain activity.

2. Materials and Methods

2.1. Participants

Students with moderate or major depression among 4000 first-year students at Shaanxi Normal University were screened using the Beck Depression Inventory-II (BDI-II ≥ 20) [31] and the Self-Rating Depression Scale (SDS ≥ 63) [32]. Following this, those students who met the above conditions were required to pass a comprehensive physical examination in the Xuefu Hospital of Shaanxi Normal University. Other physical illnesses and dysplasia were excluded, and among the students there was no history of head injury, alcohol abuse or drug abuse, or family history of other mental diseases, such as neurological disorders, epileptic seizures, and the students had had no depressive treatment within 1 month of the experiment. Forty female students were finally selected as the study subjects to avoid gender differences. They were randomly divided into two groups: a depression control group (DC) and an exercise intervention group (EI). Additionally, 20 healthy female students from the same grade were recruited as the control group (HC) and underwent the same criteria of screening as the above participants. The G*Power was used to estimate the statistical power. The statistical power was determined based on a post-hoc power analysis based on the sample size (DC = 40 and HC = 20), with a large effect with 0.80 power and 0.05 Type I error rate. The results showed that the statistical power (1−β) of this study was 0.92. More details for the information can be found in Table 1. There were no statistical differences among the three groups. All participants signed the informed consent, and this study was approved by the Review Committee of Shaanxi Normal University.

2.2. Exercise Intervention Methods

All students in each group received regular physical education and academic classes at the university. In addition, the EI group received exercise intervention twice a week, 90 min each time, with a total intervention lasting 18 weeks, and the exercise content selected were team sports games (available in the Supplementary Materials, and shown in Table S1). The large group we selected for our experiment and the positive impact of organized sports on the participation of depressed students made this intervention more appropriate for our study.
The calculation of the maximum heart rate in the college-aged subjects was based on Gellish et al.’s equation for calculating the maximum heart rate: “HRmax = 207 − 0.7 × age” [33]. The exercise intensity was controlled at medium intensity (the heart rate was controlled at 50–80% of the maximum). The ActiGraph GT3-X+ device (ActiGraph LLC, Pensacola, FL, USA) was worn to monitor the dynamic heart rate and to record the exercise in real time. Exercise levels were assessed by the criteria of The Physical Activity Guidelines for Americans, 2nd edition (PAG) [34]: a high level was defined as a “time of moderate intensity physical activity per week ≥ 300 min”, a moderate level was defined as “300 min > time of moderate intensity physical activity per week ≥ 150 min” and a low level was defined as “150 min > time of moderate intensity physical activity per week”. The total activity and real-time dynamic heart rate data were exported by ActiLife software (version 6.11.4, ActiGraph LLC, Pensacola, FL, USA.) to access the exercise intensity and the physiological load of the exercise. Exercise intervention was carried out by postgraduate students with physical education after unified training. Entertainment and humanized communication were emphasized in the intervention, excluding the interference of the subjects’ resistant emotions. In addition, the BDI-II and SDS scores of all the participants were tracked every three weeks to monitor the changes in the depressive symptoms among the college students. Group psychological sessions were organized after the scales test. Counseling was conducted in the form of talks by psychiatrists at the university hospital.

2.3. EEG Recording

Five minutes resting-state EEG data were recorded using 32-channels (i.e., FP1, FP2, F7, F3, FZ, F4, F8, T3, T5, C3, CZ, C4, T6, M1, P3, PZ, P4, M2, O1, O2, TP8, TP7, OZ, CP4, FC3, FT8, CP3, FT7, CPZ, FC4, and FCZ) according to the EEG system Neuroscan (Neuroscan Inc., El Paso, TX, USA). Subjects were sitting in a comfortable upright position in an electrically shielded room with dimmed light. Their heads were washed before the recording to reduce the interference of scalp dirt with the EEG signal. During the recording of the EEG data, the participants were asked to avoid movements that may cause artifacts such as head bowing, eye movements, and leg shaking, and were asked to sit in a quiet upright position awake and with their eyes closed. All the EEGs were continuously sampled at 1024 Hz with the left and right mastoid M1 and M2 as references. All channel impedances were kept lower than 10 kΩ.

2.4. EEG Data Preprocessing

The EEG data were preprocessed using EEGLAB, an open-source toolbox running in the MATLAB environment. Resting EEG data (5 min) were band-pass filtered between 0.5–100 Hz, and the interference of a 50 Hz alternating current at the power frequency was eliminated by sag filtering. The EEG recording was down-sampled to 125 Hz, and the data portions contaminated by eye movements, electromyography (EMG), or any other non-physiological artifacts were corrected using the Independent Component Analysis (ICA) algorithm. The continuous EEG data were segmented into 200 EEG epochs using a time window of 2000 ms. EEG epochs contaminated by strong muscle artifacts and with amplitude values exceeding ±100 V at any electrode were manually rejected.

2.5. EEG Microstate Analysis

The EEG microstate analysis was based on a Topographic Atomize and Agglomerate Hierarchical Clustering (T-AAHC) algorithm [35]. Firstly, the global field power (GFP) was calculated. The GFP defined as the EEG potential variance across the scalp electrodes was computed for each time point as follows:
GFP = Σ i = 1 N ( u i u ¯ ) 2 N
where ui is the voltage, u is the voltage on the electrode i. u ¯ is the average of all the electrode voltages. N is the number of electrodes on the topographic maps. The GFP was a single measure of a topographic map at each point in time. The EEG topography remained stable at high GFP levels and changed rapidly around minima. Therefore, a microstate analysis at the peak of the GFP provided the optimal signal-to-noise ratio. Regardless of the polarity of the topographic map, each result cluster represented a microstate class. According to the standards implemented in Cartool Software 3.70 (a free academic software developed in the lab; https://sites.google.com/site/cartoolcommunity/, accessed on 15 June 2021) [36], topographic maps of each subject’s assumed EEG data were submitted to the T-AAHC algorithm, which could identify clustering with similar topographic map configurations. The order of the microstate classes was determined by the spatial correlation between the topographic maps of the group-level microstate classes. Finally, each original topographic map was assigned to an EEG microstate according to the maximum spatial correlation coefficient between the original topographic maps and the group-level microstate maps.

2.6. Microstate Parameters Recording

For each subject, 8 temporal parameters were then calculated for each of the previously identified microstates: (1) Duration—which represents the amount of time a given microstate class exists continuously, reflecting the stability of the neurons under the cerebral cortex [35]; (2) Occurrence—which represents the number of times a particular microstate class occurs per second, and reflects the tendency of the potential neurons or the nervous system to be activated in this microstate; (3) Contribution (Time Coverage)—during the entire time of the experiment, the proportion of the total time in various microstates, reflecting the time coverage of its potential neurons relative to other neurons [37]; (4) Mean Duration—this refers to the continuous display of the four types of average duration, reflecting the stability of potential neural work in microstates [38]; (5) Mean Occurrence—this refers to the average frequency of the four kinds of microstates, and it represents the rate of occurrence of a particular microstate, namely, the number of entering a microstate per second; (6) Global Explained Variance—as the sum of the explanatory variances for each type of microstate weighted by the GFP, evaluating how well the templates described the whole data; (7) Transition—this represents the transition probability from one microstate to another, and a sequential activation reflecting the different neural networks that generate microstates [39]; (8) Total Time—the total duration of effective recording of four kinds of microstates in the experiment.

2.7. EEG Power Spectrum Analysis

Two commonly used methods for measuring the EEG power spectrum are spectral power and the coherence of specific bands, reflecting the intensity of locally synchronous cortical activation and the functional connections between spatially distributed synchronous neuron assemblies, respectively [40]. The analysis method was programmed batch processing, and the steps were as follows. The head was divided into the frontal area (FP1-F3, FP2-F4), the central area (F3-C3, F4-C4), the top area (C3-P3, C4-P4), and the occipital area (P3-O1, P4-O2). For each participant and section, using the Fast Fourier Transform (FFT) to obtain the EEG spectrum, the signal from the time domain to the frequency domain, and the power spectrum (µV2) range of 1–100 Hz was used. The FFT relied on the Discrete Fourier Transform (DFT) [41]. For the N complex sequence x(s), the DFT is:
X ( k ) = s = 0 s 1 x ( s ) e j 2 π k s ( k = 0 , 1 , 2 S 1 )
where X(k) represents the transformed data of the DFT and x(s) represents the sampled analog signal. x(s) in the formula can be a virtual signal; in fact, x(s) are all real signals, that is, the imaginary part is 0, and the formula can be expanded as follows:
X ( k ) = s = 0 s 1 x ( s ) ( cos 2 π k n N j sin 2 π k s S ) ( k = 0 , 1 , 2 S 1 )
where n represents the s sample in the time domain and x corresponds to the signal time series (s = 0, 1, 2, , S − 1). X refers to the representation of the h frequency domain of the time series signal x. S represents the signal x corresponding to the k frequency component. k corresponds to the k frequency component (k = 0, 1, 2, …, S−1). The algorithm was inputted into the MATLAB command window to finally obtain the energy values of the frequency bands δ (1–4 Hz), θ (4–8 Hz), α (8–13 Hz), β (13–30 Hz), and γ (above 30 Hz) in the working area. A classical EEG analysis is usually performed in bands below 30 Hz, i.e., δ, θ, α and β bands [42].

2.8. Statistics Analysis

All the statistical analyses were performed by SPSS (version 22.0; SPSS Inc., Chicago, IL, USA). The Kolmogorov–Smirnov test showed that the data in each group followed a normal distribution. Missing data were filled with the mean (normal distribution) or median (non-normal distribution). The results were expressed as the mean ± standard deviation.
(1)
A two-way analysis of variance (ANOVA) was carried out for the duration and the occurrence parameters in the microstates with a number of correct items as the dependent variables, groups (HC, DC and EI) as a between-subject variable, and the microstate classes (A, B, C, and D) as within-subject variables. The results were tested post-hoc using independent sample t-tests in the case of a significant main effect. A false discovery rate (FDR) correction was applied to minimize the risk of a type I error. In order to estimate the effect size of these statistical tests, the partial eta-squared (η2) and Cohen’s d were computed for ANOVAs and independent sample t-tests, respectively. p < 0.05 was considered statistically significant.
(2)
A one-way ANOVA was performed for the power values in the δ, θ, α, and β frequency bands. p < 0.05 was considered statistically significant.
(3)
The spatial correlation of the three groups between the power spectrum values in each band and the temporal parameters of the four categories of microstates were assessed using the Pearson correlation analysis.

3. Results

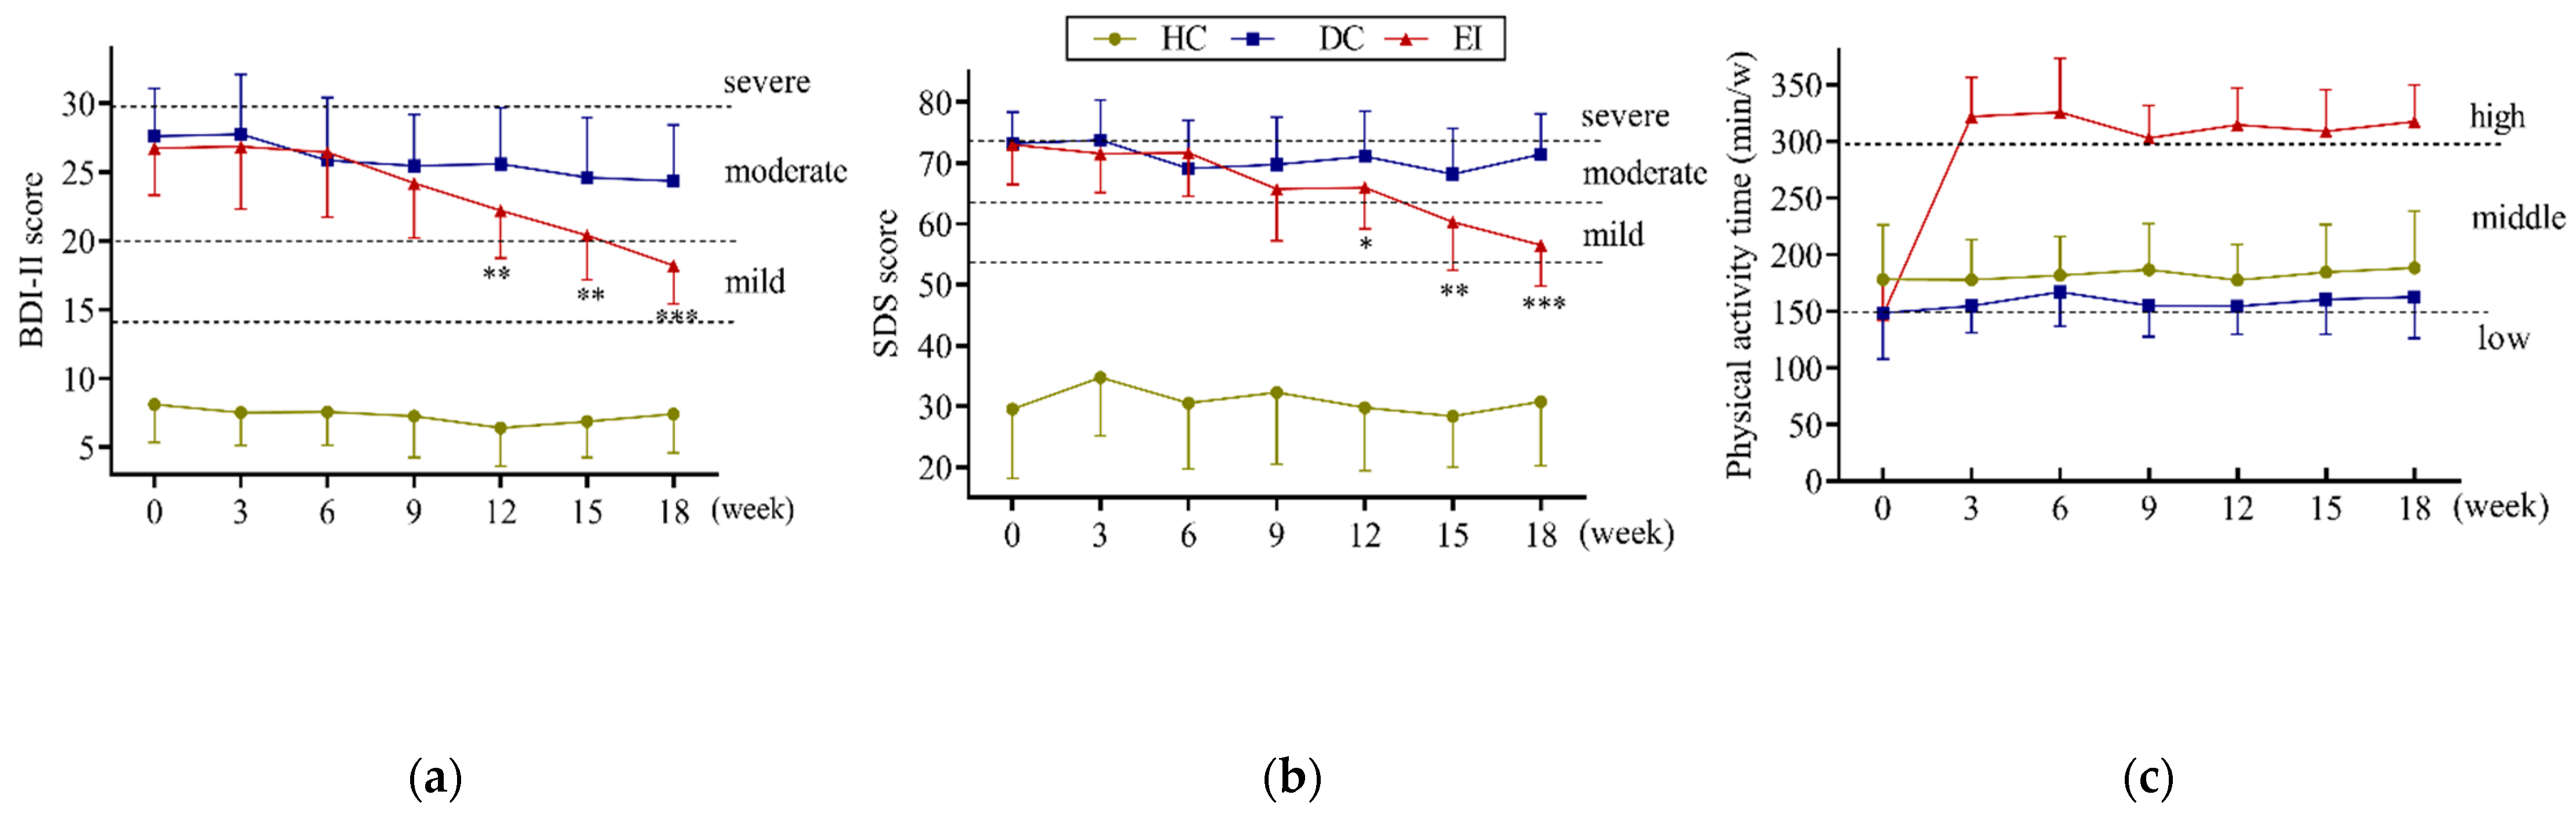
3.1. Total Exercise Level and Depression Symptoms

Before the exercise intervention, all of the students had a moderate physical activity time of approximately 150 min per week, and their physical activity levels were low to moderate according to the criteria for grading physical activity levels. When the exercise intervention began, the EI group averaged over 300 min of moderate-intensity physical activity per week, reaching a high level of physical activity (shown in Figure 1c). In addition, according to the scores of the BDI-II and SDS scales completed by the students in the three groups at 3-week intervals (shown in Figure 1a,b), the results showed that the mean BDI-II and SDS scores of the DC and EI groups were in the range of moderate depression before the exercise intervention experiment (20–29 and 63–73).
According to the ref. [8], the DC and EI groups were assessed as having moderate depression, while the HC group had mean BDI-II and SDS scores in the healthy range. Compared to the DC group, the EI group’s BDI-II and SDS scores did not change significantly in the first 6 weeks of the exercise intervention. However, beginning at week 9, the scores gradually decreased until at week 15, the SDS scores entered the mild depression range (53–63). By week 18, the mean of both the BDI-II and SDS scores of the students in the EI group were in the range of mild depression. The results suggested that after 18 weeks of exercise intervention, the students’ depression levels decreased from moderate to mild.

3.2. Comparison of Microstate Parameters

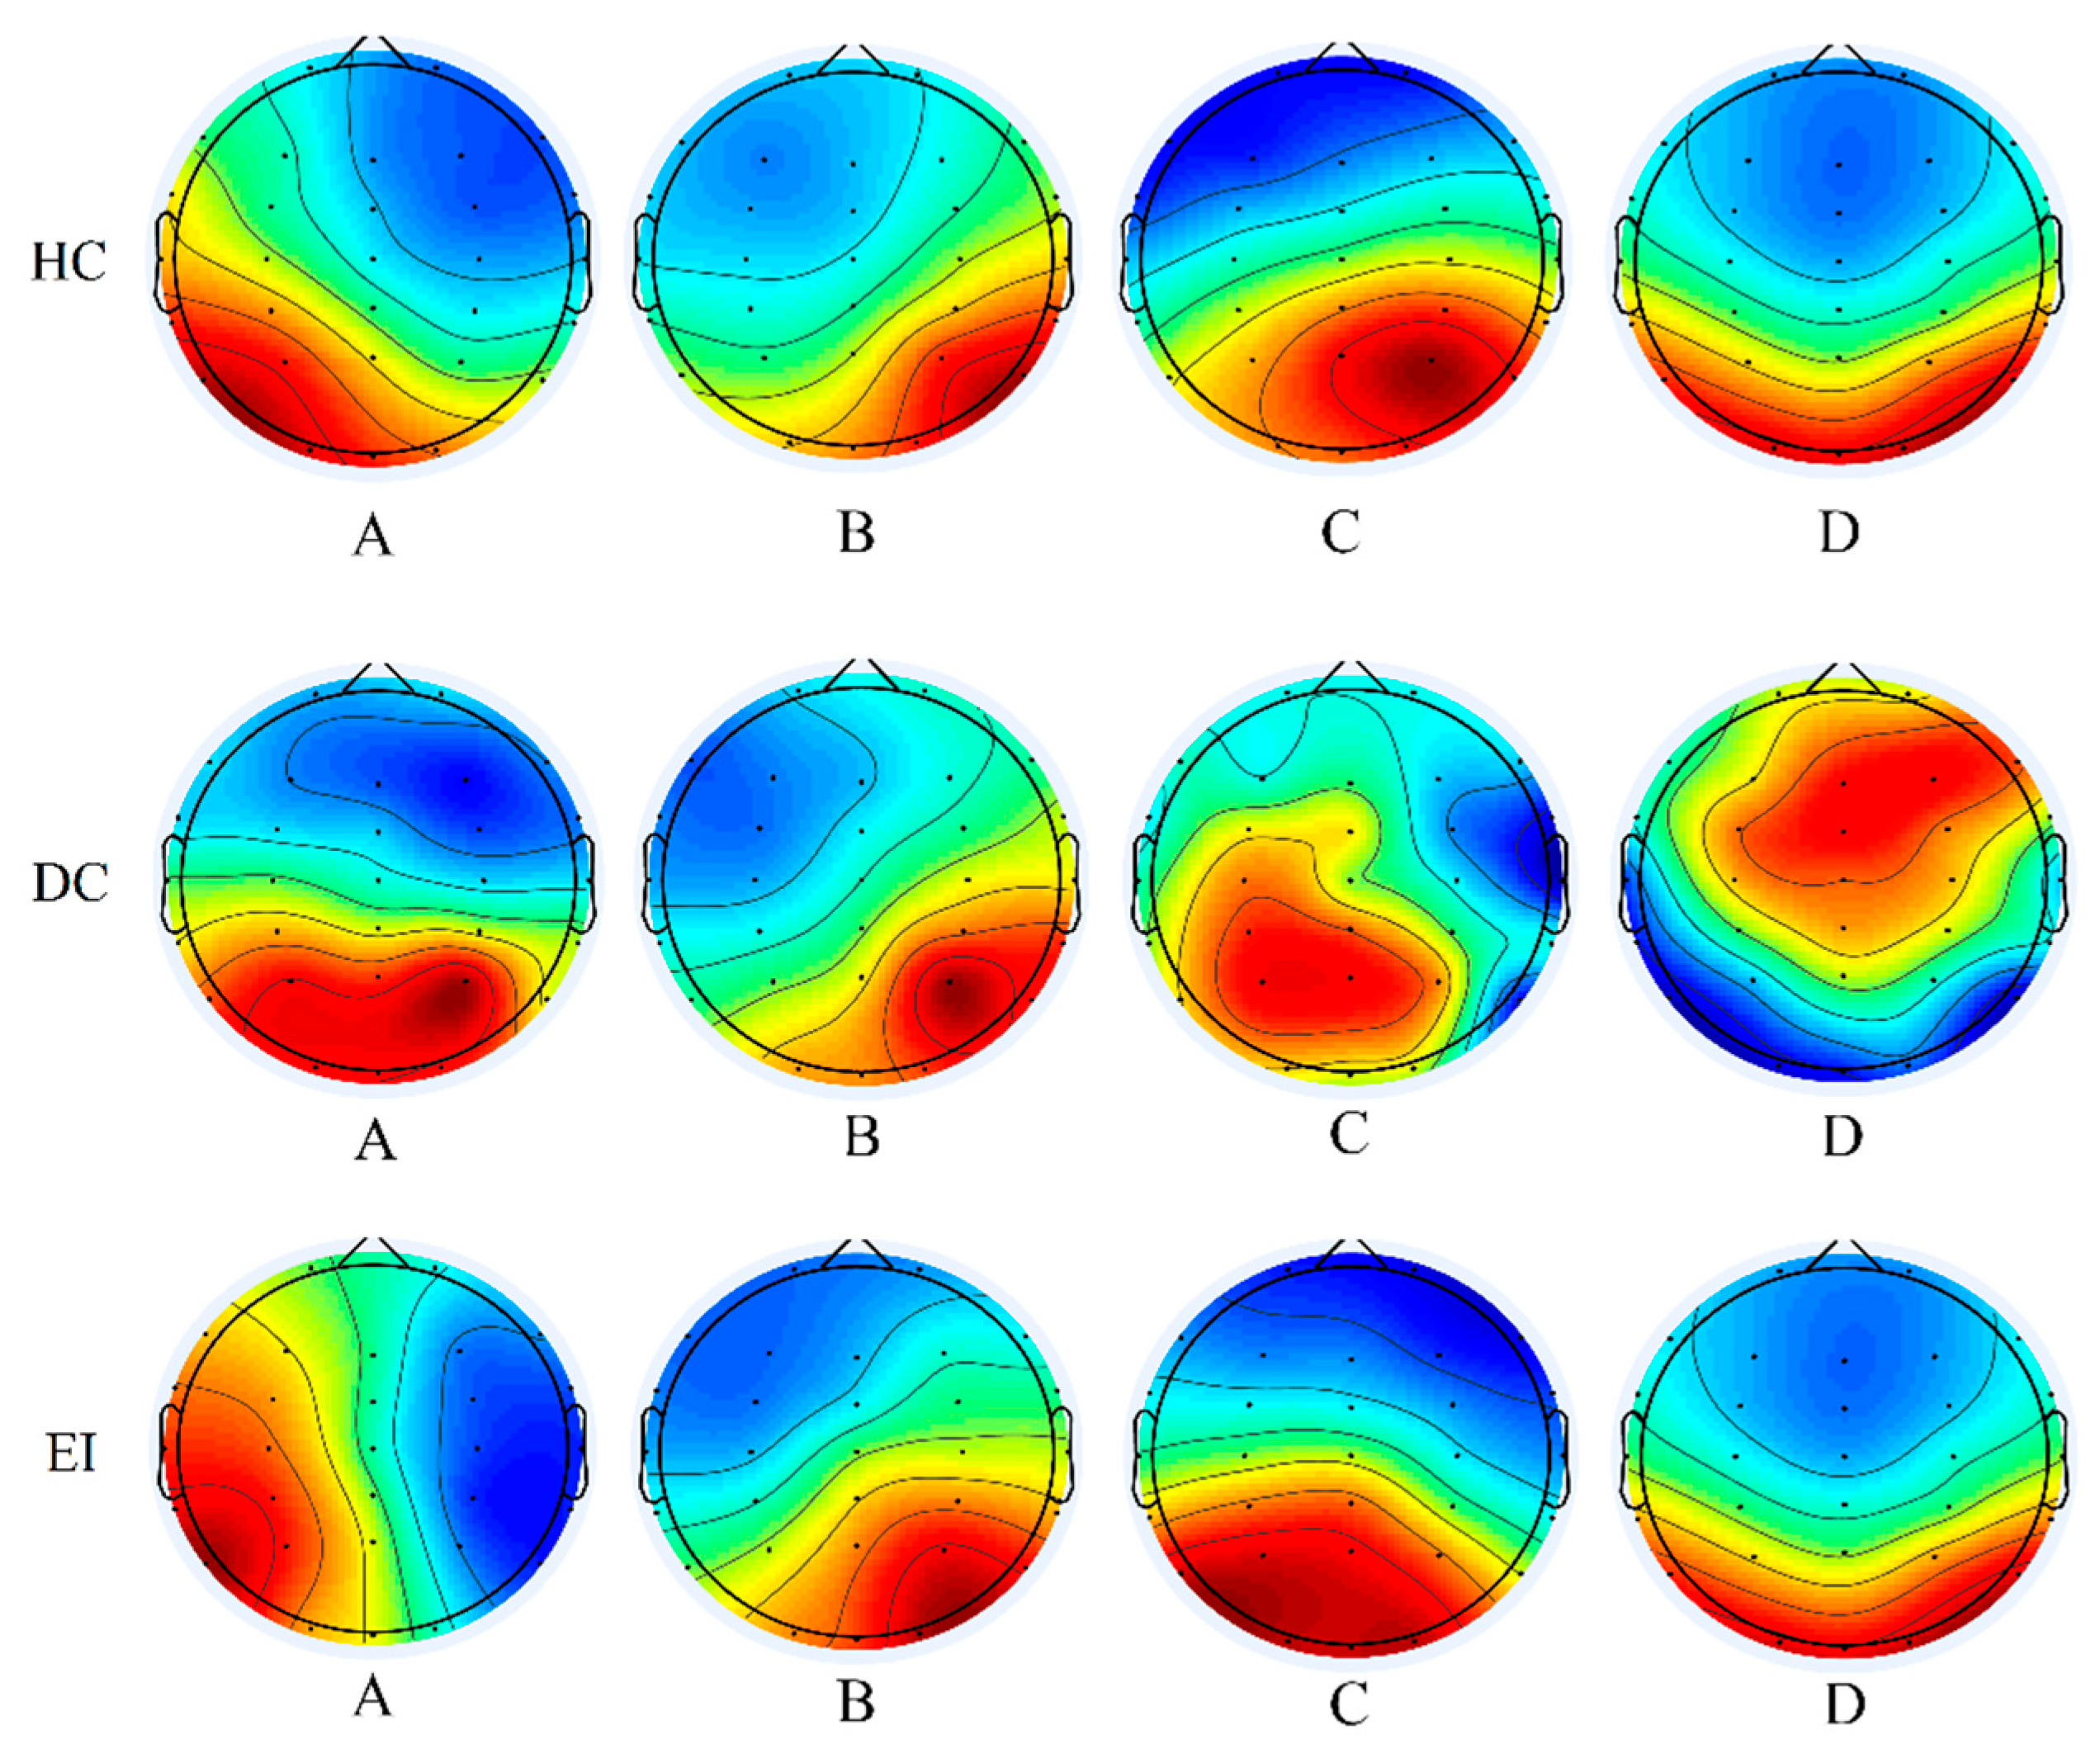
3.2.1. Comparison of Brain Topography in Microstates

Features of the fitted microstate sequences were compared across groups. We calculated the proportion of each EEG recording that was best fitted by each of the four microstates. The global explained variance in our case was 78.1% ± 0.038 for HC, 75.5% ± 0.034 for DC, and 82.6% ± 0.036 for EI (HC vs. DC, Cohen’s d = 0.721; HC vs. EI, Cohen’s d = −1.216 and DC vs. EI, Cohen’s d = −2.028, respectively).
The results (shown in Figure 2) indicated that compared with the HC group, the brain topography of the DC group showed the same barycenter distribution of microstate A and microstate B; the barycenter of microstate A was distributed in the right frontal lobe and the left occipital lobe, while the barycenter of microstate B was distributed in the left frontal lobe and the right occipital lobe. However, in the DC group, the center of gravity of the distributed microstates C and D in the brain was clearly inconsistent with the control; the gravity center in the control state of microstate C was located in the frontal lobe and occipital lobe, and the center of microstate D was located in the central area and occipital lobe. In the DC group, the center of gravity of microstate C was located in the left parietal lobe and occipital lobe. The center of gravity of microstate D was located in the parietal lobe and right frontal lobe. However, the center of gravity distribution in the EI group was significantly improved compared with that in the DC group, except that the center of gravity of microstate A was more inclined toward the bilateral temporal and occiput areas, and other microstates were basically the same as those in the HC group. These results indicated that the EEG microstates in the DC group and the EI group changed to a large extent, requiring further analysis of the change rules.

3.2.2. Results for EEG Microstate Parameters

The data of each group was tested to obey normal distribution. The results of the two-way repeated measures and the ANOVA for the EEG microstate parameters (shown in Table 2) indicated that: (1) The main effect of duration was significant (F (2, 57) = 6.979, p = 0.001, η2 = 0.396). t-test results showed that compared with the HC group, the duration of microstate C and the mean duration in the DC group were significantly shortened (p < 0.05 and 0.01, respectively). However, compared with the DC group, the duration of microstate C in the EI group was significantly longer (p < 0.05). (2) The main effect of the occurrence was significant (F (2, 57) = 4.127, p = 0.002, η2 = 0.195). t-test results showed that the occurrence of microstate B was significantly increased in the DC group compared with the HC group (p < 0.01), and the occurrence of microstate D and the mean occurrence were also significantly increased (p < 0.05). Compared with that in the DC group, the occurrence of microstate B in the EI group was significantly lower (p < 0.05). In addition, the results showed that the contribution of microstate D in the DC group was significantly lower than that in the HC group (p < 0.05).

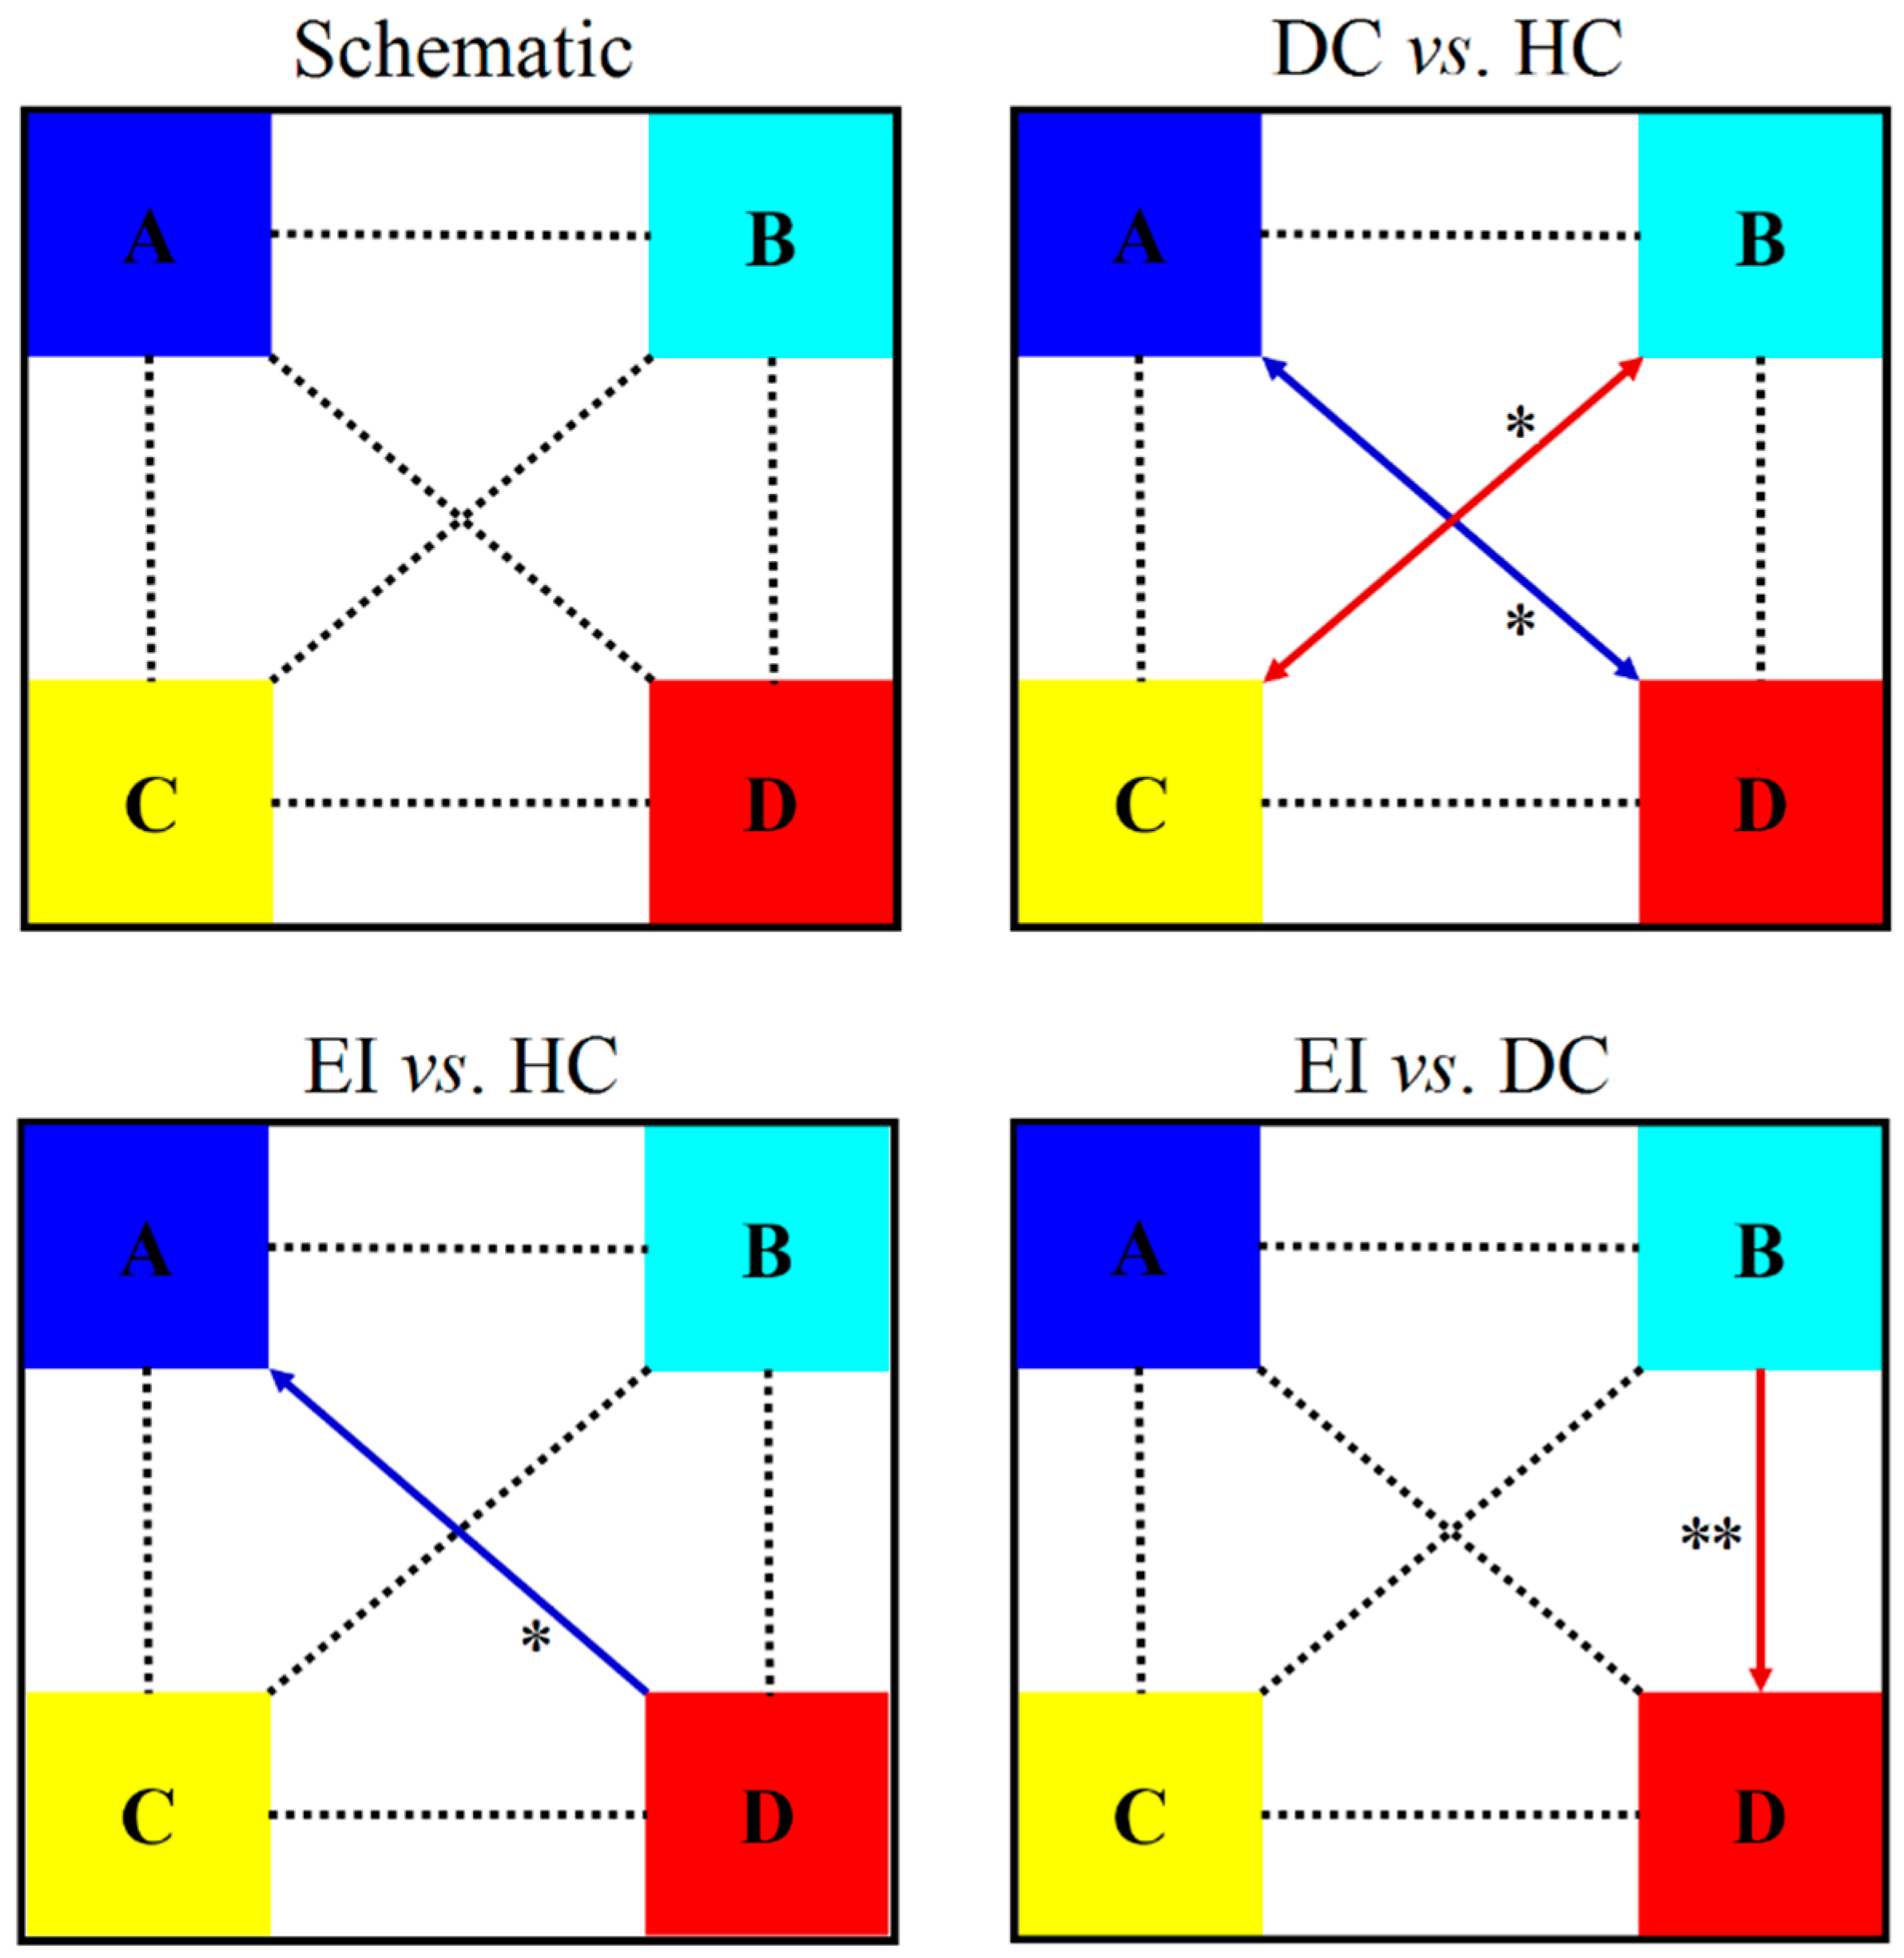
3.2.3. Probabilities of Transition between Microstates

Transition probabilities between the microstates were an important parameter for assessing the patterns of change in the microstates. The results shown in Figure 3 reveal the non-random transition probabilities estimated for the entire recording of EEG (5 min).
Compared with the HC group, the DC group was more likely to transition between microstate B and microstate C (p < 0.05, Cohen’s d = −0.944) but less likely to transition between microstate A and microstate D (p < 0.05, Cohen’s d = 0.763); meanwhile, the EI group had more difficulty in changing from microstate D to A (p < 0.05, Cohen’s d = 1.114). Compared with the DC group, the EI group was more likely to change from microstate B to D (p < 0.01, Cohen’s d = −1.100).

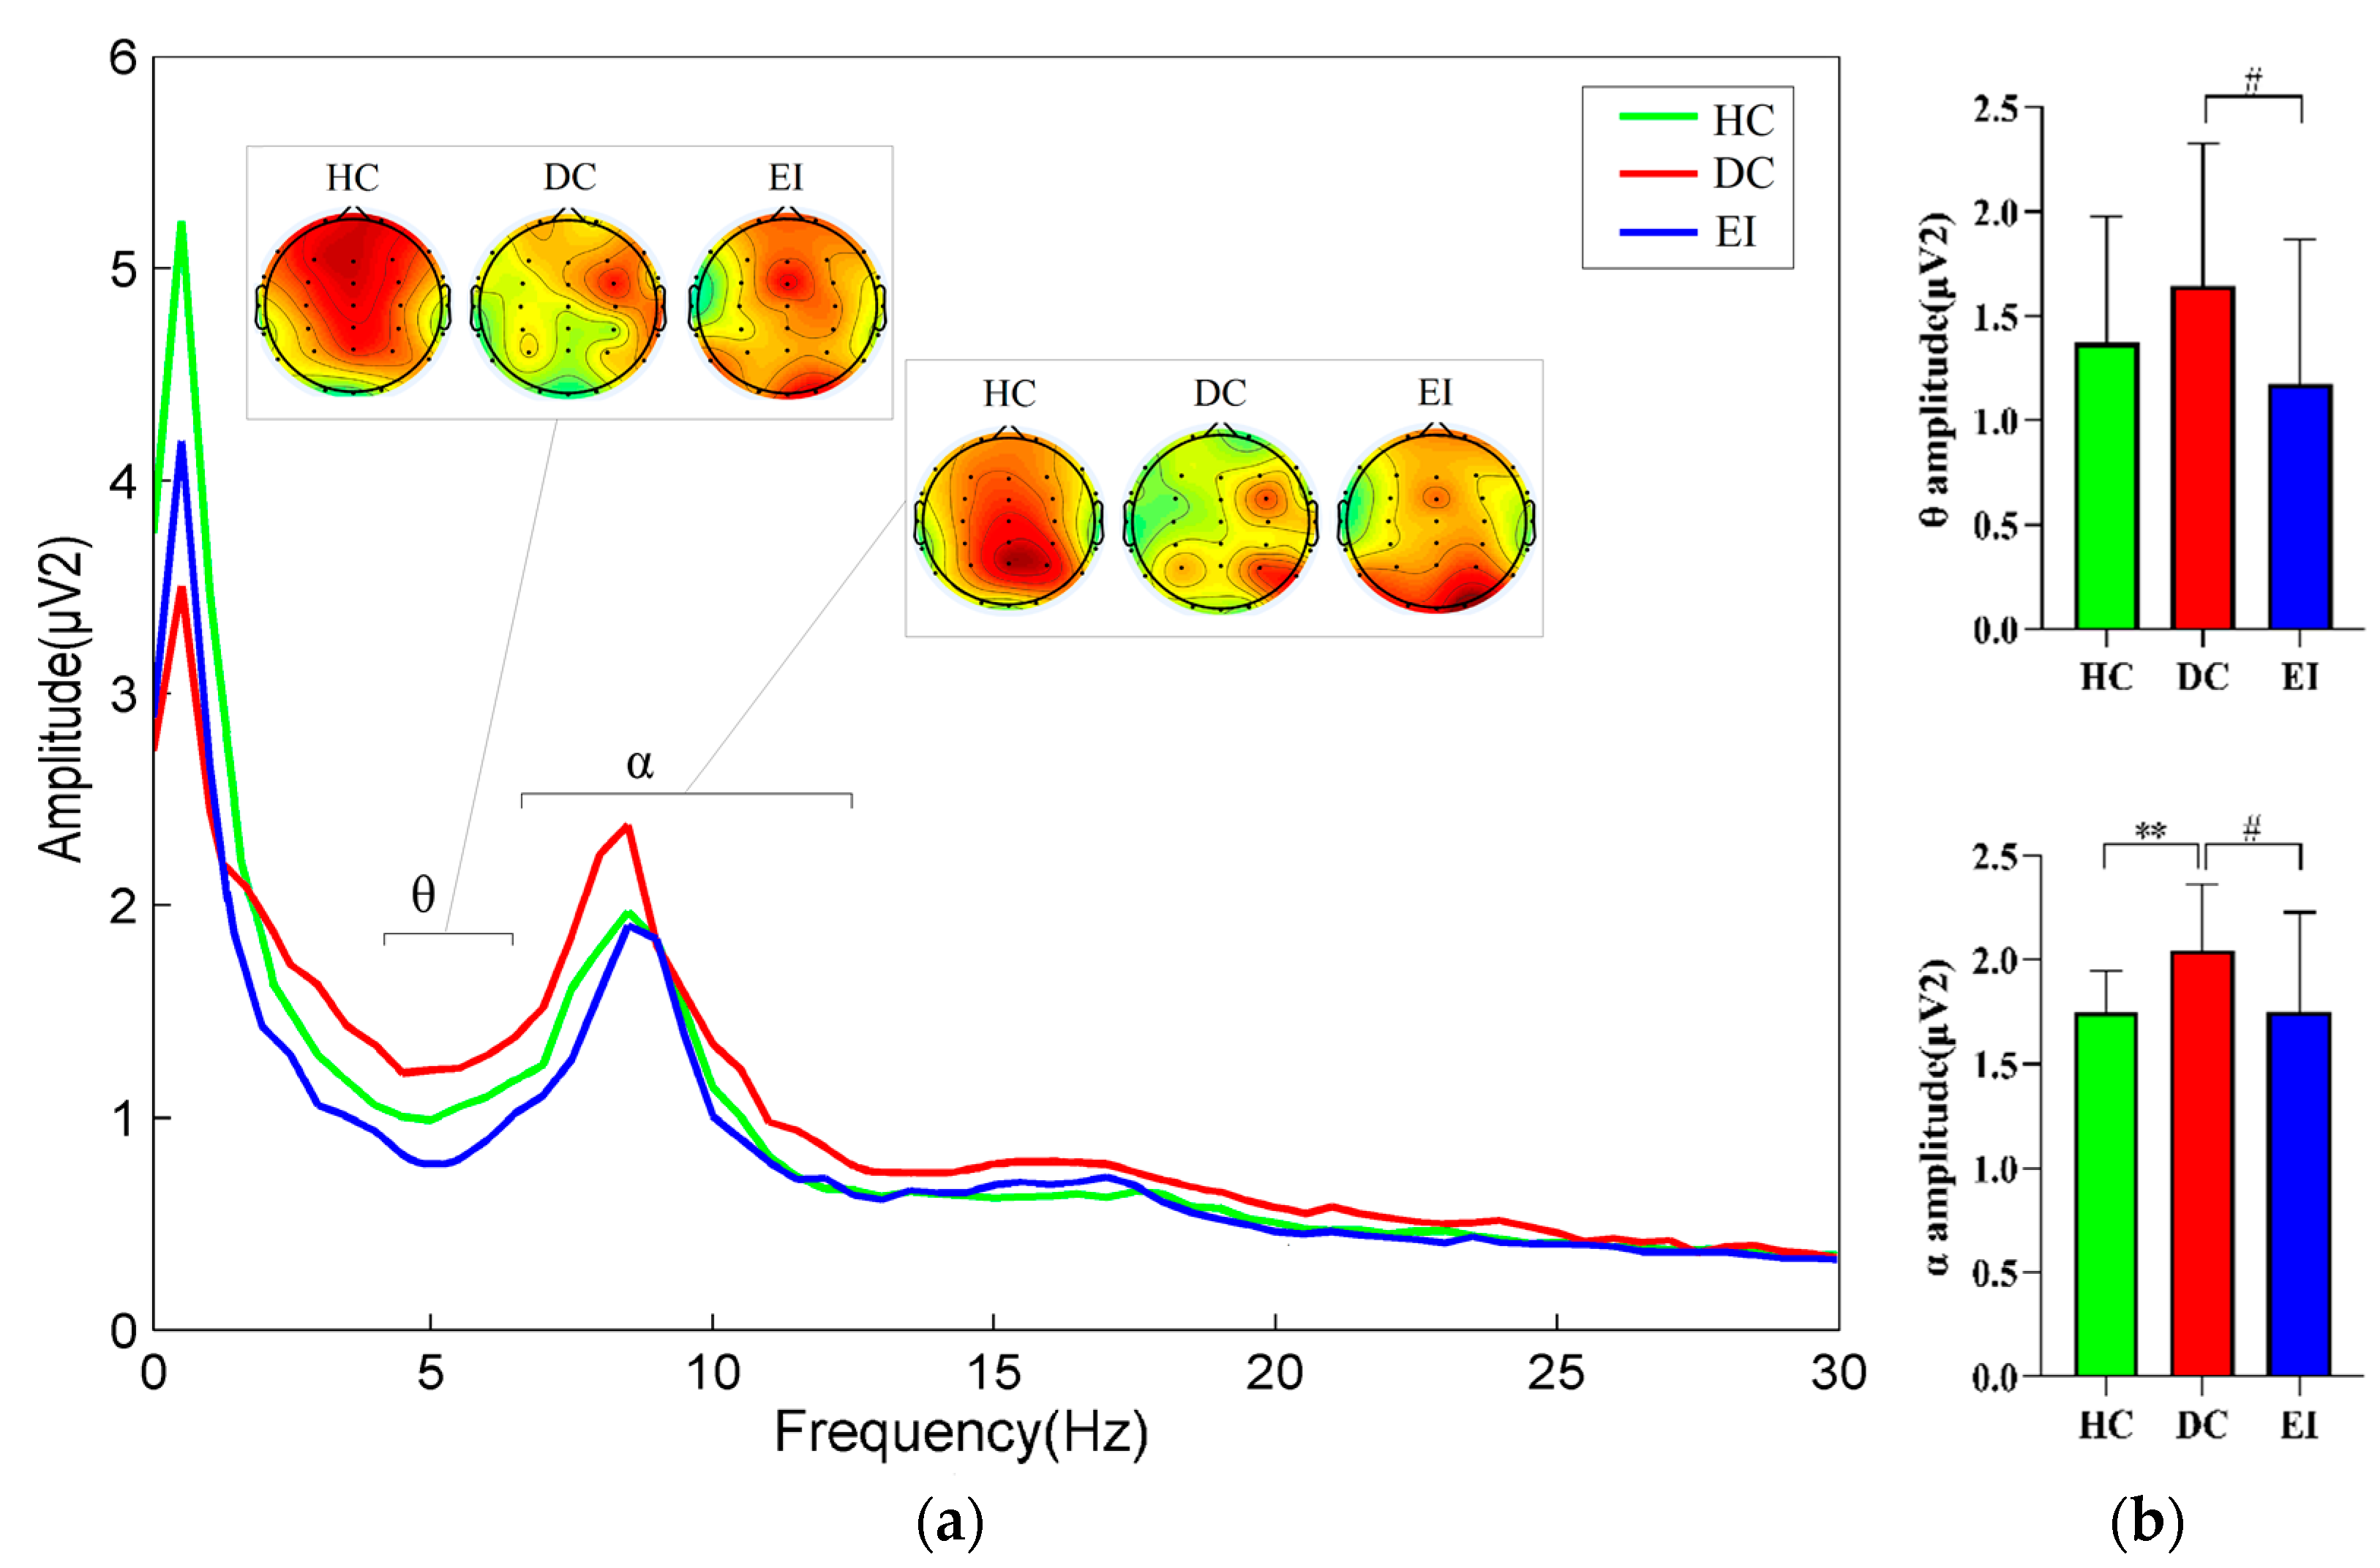
3.3. Comparison between Power Spectrum Values and EEG Energy Maps

Through an analysis of the frequency band curve, the EEG energy map, and the power values of the three groups, different results were obtained in the study of the EEG power in the different power spectrum bands.
The data of each group were tested to obey normal distribution. The general trend of the amplitudes of the three groups in the four bands δ, θ, α, and β is shown in Figure 4a, and the results of the one-way ANOVA for the EEG power spectrum values are shown in Figure 4b. The DC group showed a highly significant increase in the power of the α band compared to the HC group (F (2, 57) = 4.784, p = 0.009 < 0.01, η2 = 0.144), the EI group showed a significantly lower power in the θ band (F (2, 57) = 2.574, p = 0.028 < 0.05, η2 = 0.083), and the α band (F (2, 57) = 4.784, p = 0.001 < 0.05, η2 = 0.144) compared to the DC group. A comparison of the EEG energy maps for the significantly different θ and α bands revealed that the energy in the HC group was mainly concentrated in the prefrontal area in the θ band and in the posterior occipital area in the α band. The EEG energy distribution was deviated to different degrees in both the DC and EI groups.

3.4. Correlation of EEG Power Spectrum with Microstate Parameters

The Pearson correlation showed a significant correlation between the EEG power spectrum values and the microstate parameters of the three groups (as shown in Table 3), revealing the cooperative coupling relationship of the brain function in the resting-state.
From the HC group, the power of the α band was positively correlated with the contribution of microstate B (r = 0.554, p = 0.032 < 0.05). From the DC group, in the contribution parameter, microstate B was negatively correlated with the power of the δ band (r = −0.578, p = 0.024 < 0.05), microstate C was positively correlated with the power of the δ band (r = 0.604, p = 0.017 < 0.05), the θ band (r = 0.650, p = 0.009 < 0.01) and the α band (r = 0.547, p = 0.035 < 0.05). The power of the θ band was negatively correlated with the duration of microstate A (r = −0.564, p = 0.029 < 0.05), and the occurrences of microstate A and D (r = −0.569, p = 0.027 < 0.05 and r = −0.587, p = 0.022 < 0.05, respectively), but positively correlated with the contribution of microstate C (r = 0.650, p = 0.009 < 0.01). From the EI group, the power of the δ and α bands were negatively correlated with the occurrence of microstate C (r = −0.842, p = 0.018 < 0.05 and r = −0.885, p = 0.008 < 0.01), and the power of the β band was positively correlated with the duration of microstate C (r = 0.900, p = 0.006 < 0.01). There was no significant difference between the power spectrum values of the other bands and the correlation of the four kinds of microstate temporal parameters.

4. Discussion

This study evaluated the effect of exercise intervention on female college students with depression. In addition, the dynamic changes of the brain were monitored by the characteristics of the EEG microstate and the power spectrum in the resting-state before and after exercise intervention.
It is well known that exercise plays a significant role in improving the symptoms of patients with depression [12]. The effect of exercise on improving depression is closely related to the program, duration, intensity, and frequency of exercise. Studies have shown that recreational, aerobic, and non-competitive exercise programs are suitable interventions for patients with depression who perform at least 30 min of moderate intensity aerobic exercise daily. For college students, an exercise intervention of at least 60 min three times a week has a good effect on improvement, and the period of exercise intervention has been shown to be effective for 12 to 24 weeks [43]. Therefore, based on the previous research, this experiment adopted team sports games with a strong entertainment factor as the exercise intervention for female college students. In terms of exercise intensity, time, and frequency, the experiment selected moderate intensity, two times per week, 90 min each time, and the total intervention time was 18 weeks. We calculated their total exercise levels because the college students participating in this study were required to attend two physical education college classes each week, along with daily activities. The results showed that in normal college life, although the HC group had higher exercise levels than the DC group students, they were all in the moderate range, while the EI group of students reached a high level of total exercise. These levels consisted of daily activities, one physical education class per week, and exercise intervention two times per week. In addition, at week 12 during the exercise intervention, there was a significant decrease in the BDI-II and SDS scores of the students in the EI group compared to the DC group. By week 18, the BDI-II and SDS scores of all the students in the EI group fell from the moderate depression range to the mild depression range. The results of the study showed that 18 weeks of exercise intervention significantly improved depression in female college students.
EEG microstate analysis is a whole-brain imaging method that reflects a stable scalp potential topography, which can characterize the spatial organization and temporal dynamics of large-scale cortical activity at a high temporal resolution [44]. The measurement of the four microstate topographical maps and various parameters can not only analyze the blood oxygen level-dependent functions of the different brain areas, but can also explore the changes in the brain functions to further understand central nervous activity in the resting-state [23]. Strik et al. [45] used a spatially partitioned EEG to indicate the abnormal brain topographic structure of the microstates in patients with unipolar or bipolar depression, and the average duration of microstates was reduced. Damborska et al. used a K-Means clustering analysis to find that the severity of depressive symptoms was positively correlated with the occurrence of microstate A and used the Mann–Whitney U test to find that the occurrence and time coverage of microstates A and B were higher in patients with depression [46]. However, they did not distinguish unipolar depression from bipolar depression in the screening of experimental subjects, and the two diseases showed different pathophysiological characteristics in response to different treatments. Therefore, the study results of Strik et al. and Damborska et al. may not accurately reflect the microstate differences of unipolar depression patients. Murphy et al. [47] recently studied EEG microstates in patients with major depression and found that the occurrence of microstate A increased, while the duration and occurrence of microstate D decreased, and the duration and contribution of microstate D were negatively correlated with the severity of symptoms. In terms of microstate transitions, the probability of transitioning from other microstates to microstate C was significantly increased.
Different topographic maps are generated by the coordinated activity of different neural components in the brain. The topographic structure of spontaneous EEG activity indicates the distribution or direction of the underlying neural activity in the brain that produces the topographic maps. It contains information about the generation of cortical electrochemical activation patterns and cognitive processes. The results of the present study showed that the barycenter of microstates C and D in the DC group deviated from that of the HC group and that the control network distributed in the frontoparietal area showed different restructures. The results were similar to those found by Strik et al. [45]. Area activation in microstate C (anterior insula/frontal cortex, anterior cingulate) is due to the significant role of the network in the transformation between the central executive system and the default mode network [48]. It forms the key interface of cognitive, steady-state, motivational, and affective systems. Several studies have shown that the structural and functional connectivity in the network is associated with a better cognitive performance [49]. Area activation in microstate D is associated with the prefrontal attention network and primarily affects the flexibility of attention, such as switching and reorienting attention to relevant information [48]. The relative activation of microstate C and D networks is thought to be associated with the impairment of brain networks in patients with depression [50]. After exercise intervention, the abnormal brain topographical structure of students with depression was significantly improved. The right anterior insula and anterior cingulate correlate with emotional control [51]. The activities of the autonomic nervous system and muscle conduction post-exercise in students with depression gathered in the insular area, and the temporary reorganization of brain activity was regulated by a significant network and involved in the regulation of motor behavior. At the same time, it also played a positive role in emotional stability and adjustment.
The presence of an abnormal microstate can be considered a quantifiable characteristic marker for different mental diseases and neurological disorders [52]. According to the microstate parameters, the DC group had a shorter duration of microstate C and a shorter mean duration, a higher frequency of microstate B, and a higher mean frequency. Microstate D had a lower frequency and time coverage than the HC group. These results were similar to the results of Damborska and Murphy et al. [46,47]. The study found that the increased occurrence of microstate B indicates that the activation trend of the bilateral striatal visual area of the brain is increased, and the temporal dependence of the visual network of the patient’s occipital area on the microstate is increased [46]. The shortened duration of microstate C is an important factor in patients’ cognitive decline [53], and the shorter mean duration has also been shown to be associated with neuropsychiatric symptoms [37]. In addition, the reduction in microstate D has also been reported in the above studies on mental disorders, indicating that there is a common pathophysiological process in emotional or mental obstacles, which may be related to the cognitive control dominated by microstate D and the ability to respond to external stimuli [47]. From the results of state transitions, the DC group was more likely to transition between microstate B and microstate C and less likely to transition between microstate A and microstate D, which indicated that the transition probability between the visual network and significant network was increased, while that between the auditory network and attention network was decreased. However, these networks only partially enhanced connectivity. Therefore, we concluded that the increase or decrease in the probability of patients’ microstate transitions might also be due to the abnormal connection of microstates in the resting-state network, leading to the relative excess or absence of abnormal microstates associated with the transitions.
Compared with the DC group, the duration of microstate C was longer and the occurrence of microstate B was lower in the EI group. Compared with the HC group, the EI group was less likely to change from microstate D to A and more likely to change from microstate B to D than the DC group. In addition, the global explained variance of the EI group was 82%, which was significantly higher than that of the HC group and the DC group. Microstate C has been found to be involved in emotional tasks and responses to sensory stimuli, and a decrease in the duration of microstate C in patients with depression is associated with difficulty in reassessing the emotional cognition of some previous environmental stimuli [54]. Since microstates may correspond to specific types of mental activity and perception, and behavior may vary with ongoing microstate activity, brain regulation after exercise intervention may constitute potential neural matrix cognitive changes. Regarding microstate transitions, the results showed that exercise could change the activity of the cerebral cortex. The transition probability from the visual network to the attention network was increased after exercise intervention, while the probability of switching from the attention network to the auditory network was lower than that of the HC group. This coordination between these networks activates mechanisms that bring sensory stimuli into consciousness. The increase/decrease in the probability of microstate transition caused by exercise is due to the metabolic requirements of the activated neuronal circuits. After exercise, human brain energy is gradually restored and neuronal excitability is improved, indicating that exercise can improve nervous system function and promote brain development [55].
The understanding of the functional significance of microstates can be further expanded by studying the behavior of different microstates under different conditions, which may be spontaneous, stimulus-induced, or associated with restricted dysfunctions and pathological states [56]. However, the comparison of the microstate parameters in the present study differed from the results of Damborská et al. [46], which might be due to the fact that the EEG microstates of students with different degrees of depression were not interpreted separately in this study, resulting in no significant difference in the frequency of microstate A between the two groups. Thus, whether the higher occurrence of microstate A was a complex expression of depressive symptoms or a reflection of potential risk factors remains to be explored. In addition, the results of the microstate transitions in this study were also different from those of Murphy et al. [47], which may be due to the differences between the subject population. This paper focused on female college students aged 18–20 with depression and the EEG microstates associated with exercise interventions for depression, while Murphy et al. explored EEG microstates in patients with major depression of all ages.
EEG power spectrum analysis is the accepted method for EEG signal analysis, which reflects the “frequency content” of the signal or the distribution of signal power on the frequency [42]. EEG harmonics are complex; the θ band is often associated with mental states, especially in the parietal and temporal lobes; the α band represents the basic rhythms in a human EEG and can be recorded in any part of the cerebral cortex, especially in the parietal and occipital areas; the β band occurs in nervous or excited states and is mainly distributed in the frontal area, central area and temporal lobe. In terms of the EEG power spectrum in patients with depression, Kohler et al. [57] and Kemp et al. [58] observed an α band power enhancement in these patients. Studies have shown that when the α level is higher, the brain activity is lower; that is, the α band power spectrum is inversely proportional to brain activity. Healthy people’s brains are more active and the α band is reduced, while patients with depression have brain neurons that are in a state of inhibition, and excitement is reduced. Therefore, in the same resting-state, the brain activity in the frontal area of the depression group was weaker than that of the control group [39]. Lu et al. [59] found differences between depressed patients and the healthy control in the α and β bands. The α band differences were mainly in the left temporal lobe and the left frontal lobe, and the β band differences were mainly in the left central area, left frontal lobe, and parietal occipital area. Knott et al. [60] selected EEG data from 70 male patients with major depressive disorders and 23 male control subjects in a resting-state with closed eyes. In this study, the absolute and relative power, frequency, asymmetry, and coherence of the EEG were calculated for univariate analysis. Next, intergroup comparison and discriminant function analysis were performed to test whether the EEG could be used as a classification index. The results showed that the patients with depression were significantly different from the control group in the β band, while the activation index of the control group was decreased in the α band. Ricardo-Garcell et al. [61] have shown that depression is associated with increased θ amplitude/power in the anterior and right hemispheres of the scalp, and the θ band change may reflect the disruption of functional connectivity in the frontal cingulate pathway that mediates emotional regulation in depression. In addition, Henz et al. [62] found that mental exercise in the form of exercise imagination can lead to similar brain activation modes compared with physical exercise in the same exercise. When Wuqinxi of the dynamic qigong technique was mentally practiced, the α and θ bands activity increased significantly. Bailey et al. [63] showed that EEG activity increased in the θ, α, and β frequencies during and after exercise. The similarities and differences of the above studies are due to the different research methods and the different research objectives. From the power spectrum parameters, compared with the HC group, the power value of the α band in the DC group was increased; compared with the DC group, the power values of θ and α bands in the EI group were significantly reduced. In addition, the EEG energy maps of the θ and α bands revealed that the energy in the HC group was mainly concentrated in the prefrontal area of the θ band and the posterior occipital area of the α band. In contrast, the energy distribution was shifted in both the DC group and the EI group. The above results were similar to Kohler, Kemp, and Ricardo-Garcell et al. [57,58,61].
The α band in the EEG power spectrum not only reflects changes in excitatory and inhibitory pathways in patients with depression but also represents changes in functional connectivity within the default mode network model associated with depression [64]. Although depression is primarily characterized by low mood, it is also associated with disorders of multiple emotional dimensions, which may lead to specific resting electrical cortex and nerve damage associated with the disorder. Under the stimulation of stressful events, these concepts enable individuals with depressive tendencies to interpret their own experiences in a negative way, forming a negative cognition of themselves, the world, and the future, and may eventually lead to depression [65]. However, when comparing the power values of the different frequency bands in different subjects, the results of this study were different from those of Henz and Bailey et al. [62,63]. In addition, a decreased θ band after exercise may be associated with body fatigue [66].
In the study of the correlation between the two types of indicators, the r values of each parameter were obtained by correlating the EEG and the four bands of the δ, θ, α, and β power spectrum values with the four microstates of A, B, C, and D. The power spectrum values of the DC group at the θ band were highly correlated with the microstate temporal parameters. In the θ band, the power spectrum values were moderately negatively correlated with the duration of microstate A and moderately negatively correlated with the frequency of the occurrence of microstates A and D, but highly positively correlated with the time coverage of microstate C. The left temporal lobe and left insula were the major areas producing microstate A. Recent reports have shown that activity in the medial prefrontal cortex and the left side of the occipital gyrus is the basis for microstate A [67]. An increase in activity on the left side of the brain in students with depression results in an asymmetry of physiological electrical signals in the brain, while EEG prefrontal lateralization reflects depression’s proximity to impaired motivational systems. This conclusion is consistent with the depression symptoms of anhedonia and loss of interest. At the same time, EEG frontal asymmetry may be a characteristic of young people at risk for mood disorders, suggesting that an impaired function of the frontal limbic and subcortical brain areas may be associated with depression [68]. The results of this study showed that the θ band was significantly higher in students with depression and was highly correlated with the neuronal stability associated with the auditory network of subcortical phonological processing and the tendency of the nervous system to be activated in microstate A. In addition, the power spectrum values of the δ and α bands in the DC group were also moderately positively correlated with the time coverage of microstate C. Microstate C is usually associated with the saliency network of autonomic neural processing, which has been shown to be closely related to people’s extensive sensory and emotional experience, as well as autonomic processing and executive control. Networked coordination implements key mechanisms to bring sensory stimuli produced by the body into consciousness. The abnormal microstate dynamic pattern caused by depression may support a higher level of somatic consciousness, which in turn may be the basis for the enhancement of somatic consciousness [69]. Therefore, the power spectrum value of the δ and α bands of students in the DC group was highly correlated with the coverage rate of time of microstate C. The correlation between the HC and the EI groups was relatively low and scattered and was not discussed much here.
In summary, the results of the current study seem to indicate that depression affects not only emotional and cognitive mental operations but also motivational processes. The statistics we present here are the direct and long-term effects of exercise therapy on mental health and may be further revealed through the intervention of team sport games in depressed college students. These results can provide some intervention plans for the relevant student administration departments, and forward the idea of an adjuvant treatment of depression in addition to antidepressants and psychotherapies.
The reach of this study is potentially restricted by a few factors, and underscores the need for further study. One limitation of the study was that due to ethical constraints, we were unable to ask participants to refrain from taking any medication prior to participating in the study. This may be a concern as some medications have been demonstrated to improve cognitive function [18], which may further explain why we were unable to detect more significant differences. The second limitation of the current study was that due to the small sample size, we were unable to demonstrate whether depressed male college students would also be able to fit our results. Furthermore, to reflect a realistic sample of the adolescent population, studies should include participants who represent a diversity of races and ages.

5. Conclusions

The 18-week exercise intervention significantly improved depression in female college students. This work showed that the decreased duration of microstate C and the increased α band power values in depressed students are thought to be associated with reduced cognitive ability, emotional stability, and brain activity. Depression symptoms were notably improved after exercise intervention, thus providing a more scientific index for the research and rehabilitation mechanism and treatment of depression. In the future, we will further explore the stability of the results, namely the accuracy of the clinical diagnosis of depression and the evaluation of the recovery effect after the phased treatment of depression, as well as the feasibility of exercise as a treatment method for depression and explore more individualized exercise intervention methods.

Supplementary Materials

The following are available online at https://www.mdpi.com/article/10.3390/su13126822/s1, Table S1. Schedule of exercise intervention.

Author Contributions

Data curation, A.L., S.Z. and J.S.; formal analysis, A.L., Y.Z. (Yan Zhang) and X.N.; funding acquisition, A.C.; resources, T.X.; software, Y.Z. (Yue Zhang); supervision, A.C.; writing—original draft, A.L. All authors have read and agreed to the published version of the manuscript.

Funding

This research was supported by the National Natural Science Foundation of China (No. 31871209) and Shaanxi Normal University Graduate Student Innovation Team Project (Nos. TD2020003Z).

Institutional Review Board Statement

The study was conducted according to the guidelines of the Declaration of Helsinki, and approved by the Review Committee of Shaanxi Normal University (protocol code 202016002 and date of approval 17 January 2020).

Informed Consent Statement

Informed consent was obtained from all subjects involved in the study.

Data Availability Statement

Not applicable.

Acknowledgments

The authors want to thank the National Natural Science Foundation of China (No. 31871209) and Shaanxi Normal University Graduate Student Innovation Team Project (Nos. TD2020003Z).

Conflicts of Interest

The authors declare no conflict of interest.

References

  1. Del Pozo Cruz, B.; Alfonso-Rosa, R.M.; McGregor, D.; Chastin, S.F.; Palarea-Albaladejo, J.; Del Pozo Cruz, J. Sedentary behaviour is associated with depression symptoms: Compositional data analysis from a representative sample of 3233 US adults and older adults assessed with accelerometers. J. Affect. Disord. 2020, 265, 59–62. [Google Scholar] [CrossRef]
  2. Abdallah, C.G.; Sanacora, G.; Duman, R.S.; Krystal, J.H. The neurobiology of depression, ketamine and rapid-acting anti-depressants: Is it glutamate inhibition or activation? Pharmacol. Ther. 2018, 190, 148–158. [Google Scholar] [CrossRef] [PubMed]
  3. Bernaras, E.; Jaureguizar, J.; Garaigordobil, M. Child and Adolescent Depression: A Review of Theories, Evaluation Instruments, Prevention Programs, and Treatments. Front. Psychol. 2019, 10, 543. [Google Scholar] [CrossRef] [PubMed] [Green Version]
  4. Ebert, D.D.; Buntrock, C.; Mortier, P.; Auerbach, R.; Weisel, K.K.; Kessler, R.C.; Cuijpers, P.; Green, J.G.; Kiekens, G.; Nock, M.K.; et al. Prediction of major depressive disorder onset in college students. Depress. Anxiety 2019, 36, 294–304. [Google Scholar] [CrossRef] [PubMed] [Green Version]
  5. Ha, A.S.; Lonsdale, C.; Lubans, D.R.; Ng, J.Y.Y. Increasing Students’ Activity in Physical Education: Results of the Self-determined Exercise and Learning for FITness Trial. Med. Sci. Sports Exerc. 2020, 52, 696–704. [Google Scholar] [CrossRef] [PubMed]
  6. Asarnow, L.D. Depression and sleep: What has the treatment research revealed and could the HPA axis be a potential mechanism? Curr. Opin. Psychol. 2020, 34, 112–116. [Google Scholar] [CrossRef] [PubMed]
  7. Zheng, P.; Gao, H.C.; Li, Q.; Shao, W.H.; Zhang, M.L.; Cheng, K.; Yang, D.Y.; Fan, S.H.; Chen, L.; Fang, L.; et al. Plasma metabonomics as a novel diagnostic approach for major depressive disorder. J. Proteome Res. 2012, 11, 1741–1748. [Google Scholar] [CrossRef] [PubMed]
  8. Zhao, S.; Chi, A.; Yan, J.; Yao, C. Feature of Heart Rate Variability and Metabolic Mechanism in Female College Students with Depression. BioMed Res. Int. 2020, 2020, 1–9. [Google Scholar] [CrossRef] [PubMed] [Green Version]
  9. Zhou, H.; Hua, L.; Jiang, H.; Dai, Z.; Han, Y.; Lin, P.; Wang, H.; Lu, Q.; Yao, Z. Autonomic Nervous System Is Related to Inhibitory and Control Function Through Functional Inter-Region Connectivities of OFC in Major Depression. Neuropsychiatr. Dis. Treat. 2020, 16, 235–247. [Google Scholar] [CrossRef] [PubMed] [Green Version]
  10. Carek, P.J.; Laibstain, S.E.; Carek, S.M. Exercise for the Treatment of Depression and Anxiety. Int. J. Psychiatry Med. 2011, 41, 15–28. [Google Scholar] [CrossRef] [PubMed]
  11. Kvam, S.; Kleppe, C.L.; Nordhus, I.H.; Hovland, A. Exercise as a treatment for depression: A meta-analysis. J. Affect. Disord. 2016, 202, 67–86. [Google Scholar] [CrossRef]
  12. Schuch, F.B.; Vancampfort, D.; Richards, J.; Rosenbaum, S.; Ward, P.B.; Stubbs, B. Exercise as a treatment for depression: A meta-analysis adjusting for publication bias. J. Psychiatr. Res. 2016, 77, 42–51. [Google Scholar] [CrossRef] [PubMed] [Green Version]
  13. Knapen, J.; Vancampfort, D.; Moriën, Y.; Marchal, Y. Exercise therapy improves both mental and physical health in patients with major depression. Disabil. Rehabil. 2014, 37, 1490–1495. [Google Scholar] [CrossRef] [PubMed]
  14. World Health Organization (WHO). Mental Health Physical Activity. Available online: https://www.who.int/mental_health/mhgap/evidence/resource/depression_q6.pdf (accessed on 25 May 2015).
  15. National Institute for Health and Clinical Excellence (UK). Depression: Evidence Update April 2012: A Summary of Selected New Evidence Relevant to NICE Clinical Guideline 90 ‘The Treatment and Management of Depression in Adults’ (2009); National Institute for Health and Clinical Excellence: London, UK, 2012.
  16. Ströhle, A. Physical activity, exercise, depression and anxiety disorders. J. Neural Transm. 2008, 116, 777–784. [Google Scholar] [CrossRef] [PubMed]
  17. Pedersen, M.T.; Vorup, J.; Nistrup, A.; Wikman, J.M.; Alstrøm, J.M.; Melcher, P.G.S.; Pfister, G.U.; Bangsbo, J. Effect of team sports and resistance training on physical function, quality of life, and motivation in older adults. Scand. J. Med. Sci. Sports 2017, 27, 852–864. [Google Scholar] [CrossRef] [PubMed]
  18. Sabiston, C.M.; Jewett, R.; Ashdown-Franks, G.; Bélanger, M.; Brunet, J.; O’Loughlin, E.; O’Loughlin, J. Number of Years of Team and Individual Sport Participation During Adolescence and Depressive Symptoms in Early Adulthood. J. Sport Exerc. Psychol. 2016, 38, 105–110. [Google Scholar] [CrossRef] [Green Version]
  19. Ay, B.; Yildirim, O.; Talo, M.; Baloglu, U.B.; Aydin, G.; Puthankattil, S.D.; Acharya, U.R. Automated Depression Detection Using Deep Representation and Sequence Learning with EEG Signals. J. Med. Syst. 2019, 43, 205. [Google Scholar] [CrossRef]
  20. De Aguiar Neto, F.S.; Rosa, J.L.G. Depression biomarkers using non-invasive EEG: A review. Neurosci. Biobehav. Rev. 2019, 105, 83–93. [Google Scholar] [CrossRef]
  21. Lehmann, D.; Ozaki, H.; Pal, I. EEG alpha map series: Brain micro-states by space-oriented adaptive segmentation. Electroencephalogr. Clin. Neurophysiol. 1987, 67, 271–288. [Google Scholar] [CrossRef]
  22. Michel, C.M.; Koenig, T. EEG microstates as a tool for studying the temporal dynamics of whole-brain neuronal networks: A review. NeuroImage 2018, 180, 577–593. [Google Scholar] [CrossRef]
  23. Cai, Y.; Chen, S.; Chen, Y.; Li, J.; Wang, C.D.; Zhao, F.; Dang, C.P.; Liang, J.; He, N.; Liang, M.; et al. Altered Resting-State EEG Microstate in Idiopathic Sudden Sensorineural Hearing Loss Patients with Tinnitus. Front. Neurosci. 2019, 13, 443. [Google Scholar] [CrossRef] [Green Version]
  24. Koenig, T.; Lehmann, D.; Merlo, M.C.; Kochi, K.; Hell, D.; Koukkou, M. A deviant EEG brain microstate in acute, neuroleptic-naive schizophrenics at rest. Eur. Arch. Psychiatry Clin. Neurosci. 1999, 249, 205–211. [Google Scholar] [CrossRef] [PubMed]
  25. Britz, J.; Van De Ville, D.; Michel, C.M. BOLD correlates of EEG topography reveal rapid resting-state network dynamics. NeuroImage 2010, 52, 1162–1170. [Google Scholar] [CrossRef]
  26. Milz, P.; Faber, P.L.; Lehmann, D.; Koenig, T.; Kochi, K.; Pascual-Marqui, R.D. The functional significance of EEG microstates-—Associations with modalities of thinking. Neuroimage 2016, 125, 643–656. [Google Scholar] [CrossRef]
  27. Thilakavathi, B.; Devi, S.S.; Malaiappan, M.; Bhanu, K. EEG power spectrum analysis for schizophrenia during mental activity. Australas. Phys. Eng. Sci. Med. 2019, 42, 887–897. [Google Scholar] [CrossRef] [PubMed]
  28. Mendelson, T.; Tandon, S.D. Prevention of Depression in Childhood and Adolescence. Child Adolesc. Psychiatr. Clin. N. Am. 2016, 25, 201–218. [Google Scholar] [CrossRef] [PubMed]
  29. Fuentes-García, J.P.; Villafaina, S.; Collado-Mateo, D.; Cano-Plasencia, R.; Gusi, N. Chess Players Increase the Theta Power Spectrum When the Difficulty of the Opponent Increases: An EEG Study. Int. J. Environ. Res. Public Health 2019, 17, 46. [Google Scholar] [CrossRef] [Green Version]
  30. Roepke, A.M.; Seligman, M.E.P. Depression and prospection. Br. J. Clin. Psychol. 2015, 55, 23–48. [Google Scholar] [CrossRef] [PubMed]
  31. Parker, G.; Fletcher, K.; Hyett, M.; Hadzi-Pavlovic, D.; Barrett, M.; Synnott, H. Measuring melancholia: The utility of a prototypic symptom approach. Psychol. Med. 2008, 39, 989–998. [Google Scholar] [CrossRef] [PubMed]
  32. Zung, W.W.K. A Self-Rating Depression Scale. Arch. Gen. Psychiatry 1965, 12, 63–70. [Google Scholar] [CrossRef]
  33. Gellish, R.L.; Goslin, B.R.; Olson, R.E.; McDONALD, A.; Russi, G.D.; Moudgil, V.K. Longitudinal Modeling of the Relationship between Age and Maximal Heart Rate. Med. Sci. Sports Exerc. 2007, 39, 822–829. [Google Scholar] [CrossRef] [PubMed]
  34. Piercy, K.L.; Troiano, R.P.; Ballard, R.M.; Carlson, S.A.; Fulton, J.E.; Galuska, D.A.; George, S.M.; Olson, R.D. The Physical Activity Guidelines for Americans. JAMA 2018, 320, 2020–2028. [Google Scholar] [CrossRef] [PubMed]
  35. Von Wegner, F.; Knaut, P.; Laufs, H. EEG Microstate Sequences from Different Clustering Algorithms Are Information-Theoretically Invariant. Front. Comput. Neurosci. 2018, 12, 70. [Google Scholar] [CrossRef] [PubMed]
  36. Brunet, D.; Murray, M.M.; Michel, C.M. Spatiotemporal Analysis of Multichannel EEG: Cartool. Comput. Intell. Neurosci. 2011, 2011, 1–15. [Google Scholar] [CrossRef] [PubMed]
  37. Koenig, T.; Studer, D.; Hubl, D.; Melie, L.; Strik, W.K. Brain connectivity at different time-scales measured with EEG. Philos. Trans. R. Soc. Lond. B Biol. Sci. 2005, 360, 1015–1023. [Google Scholar] [CrossRef] [PubMed] [Green Version]
  38. Drissi, N.M.; Szakács, A.; Witt, S.T.; Wretman, A.; Ulander, M.; Ståhlbrandt, H.; Darin, N.; Hallböök, T.; Landtblom, A.M.; Engström, M. Altered Brain Microstate Dynamics in Adolescents with Narcolepsy. Front. Hum. Neurosci. 2016, 10, 369. [Google Scholar] [CrossRef] [PubMed] [Green Version]
  39. Khanna, A.; Pascual-Leone, A.; Michel, C.M.; Farzan, F. Microstates in resting-state EEG: Current status and future directions. Neurosci. Biobehav. Rev. 2015, 49, 105–113. [Google Scholar] [CrossRef] [PubMed] [Green Version]
  40. Gao, F.; Jia, H.; Wu, X.; Yu, D.; Feng, Y. Altered Resting-State EEG Microstate Parameters and Enhanced Spatial Complexity in Male Adolescent Patients with Mild Spastic Diplegia. Brain Topogr. 2016, 30, 233–244. [Google Scholar] [CrossRef]
  41. Akin, M. Comparison of Wavelet Transform and FFT Methods in the Analysis of EEG Signals. J. Med. Syst. 2002, 26, 241–247. [Google Scholar] [CrossRef] [PubMed]
  42. Dressler, O.; Schneider, G.; Stockmanns, G.; Kochs, E.F. Awareness and the EEG power spectrum: Analysis of frequencies. Br. J. Anaesth. 2004, 93, 806–809. [Google Scholar] [CrossRef] [PubMed] [Green Version]
  43. Guo, S.; Liu, F.; Shen, J.; Wei, M.; Yang, Y. Comparative efficacy of seven exercise interventions for symptoms of depression in college students: A network of meta-analysis. Medicine 2020, 99, e23058. [Google Scholar] [CrossRef]
  44. Andreou, C.; Faber, P.L.; Leicht, G.; Schoettle, D.; Polomac, N.; Hanganu-Opatz, I.L.; Lehmann, D.; Mulert, C. Resting-state connectivity in the prodromal phase of schizophrenia: Insights from EEG microstates. Schizophr. Res. 2014, 152, 513–520. [Google Scholar] [CrossRef]
  45. Strik, W.K.; Dierks, T.; Becker, T.; Lehmann, D. Larger topographical variance and decreased duration of brain electric mi-crostates in depression. J. Neural Transm./Gen. Sect. JNT 1995, 99, 213–222. [Google Scholar] [CrossRef] [PubMed]
  46. Damborská, A.; Piguet, C.; Aubry, J.-M.; Dayer, A.G.; Michel, C.M.; Berchio, C. Altered Electroencephalographic Resting-State Large-Scale Brain Network Dynamics in Euthymic Bipolar Disorder Patients. Front. Psychiatry 2019, 10, 826. [Google Scholar] [CrossRef] [PubMed]
  47. Murphy, M.; Whitton, A.E.; Deccy, S.; Ironside, M.L.; Rutherford, A.; Beltzer, M.; Sacchet, M.; Pizzagalli, D.A. Abnormalities in electroencephalographic microstates are state and trait markers of major depressive disorder. Neuropsychopharmacology 2020, 45, 2030–2037. [Google Scholar] [CrossRef] [PubMed]
  48. Sridharan, D.; Levitin, D.J.; Menon, V. A critical role for the right fronto-insular cortex in switching between central-executive and default-mode networks. Proc. Natl. Acad. Sci. USA 2008, 105, 12569–12574. [Google Scholar] [CrossRef] [PubMed] [Green Version]
  49. Coste, C.P.; Kleinschmidt, A. Cingulo-opercular network activity maintains alertness. NeuroImage 2016, 128, 264–272. [Google Scholar] [CrossRef]
  50. Atluri, S.; Wong, W.; Moreno, S.; Blumberger, D.M.; Daskalakis, Z.J.; Farzan, F. Selective modulation of brain network dy-namics by seizure therapy in treatment-resistant depression. NeuroImage Clin. 2018, 20, 1176–1190. [Google Scholar] [CrossRef] [PubMed]
  51. Henderson, L.A.; Gandevia, S.C.; Macefield, V.G. Somatotopic organization of the processing of muscle and cutaneous pain in the left and right insula cortex: A single-trial fMRI study. Pain 2007, 128, 20–30. [Google Scholar] [CrossRef] [PubMed]
  52. Serrano, J.I.; Del Castillo, M.D.; Cortés, V.; Mendes, N.; Arroyo, A.; Andreo, J.; Rocon, E.; Del Valle, M.; Herreros, J.; Romero, J.P. EEG Microstates Change in Response to Increase in Dopaminergic Stimulation in Typical Parkinson’s Disease Patients. Front. Neurosci. 2018, 12, 714. [Google Scholar] [CrossRef] [Green Version]
  53. Tomescu, M.; Rihs, T.; Rochas, V.; Hardmeier, M.; Britz, J.; Allali, G.; Fuhr, P.; Eliez, S.; Michel, C. From swing to cane: Sex differences of EEG resting-state temporal patterns during maturation and aging. Dev. Cogn. Neurosci. 2018, 31, 58–66. [Google Scholar] [CrossRef]
  54. Seeley, W.W.; Menon, V.; Schatzberg, A.F.; Keller, J.; Glover, G.H.; Kenna, H.; Reiss, A.L.; Greicius, M.D. Dissociable intrinsic connectivity networks for salience processing and executive control. J. Neurosci. 2007, 27, 2349–2356. [Google Scholar] [CrossRef]
  55. Gujral, S.; Aizenstein, H.; Reynolds, C.F., III; Butters, M.A.; Erickson, K.I. Exercise effects on depression: Possible neural mechanisms. Gen. Hosp. Psychiatry 2017, 49, 2–10. [Google Scholar] [CrossRef] [PubMed]
  56. Laird, A.R.; Fox, P.; Eickhoff, S.B.; Turner, J.; Ray, K.L.; McKay, D.R.; Glahn, D.C.; Beckmann, C.F.; Smith, S.M.; Fox, P.T. Behavioral Interpretations of Intrinsic Connectivity Networks. J. Cogn. Neurosci. 2011, 23, 4022–4037. [Google Scholar] [CrossRef] [PubMed] [Green Version]
  57. Köhler, S.; Ashton, C.H.; Marsh, R.; Thomas, A.J.; Barnett, N.A.; O’Brien, J.T. Electrophysiological changes in late life depression and their relation to structural brain changes. Int. Psychogeriatr. 2011, 23, 141–148. [Google Scholar] [CrossRef] [PubMed]
  58. Kemp, A.H.; Griffiths, K.; Felmingham, K.L.; Shankman, S.A.; Drinkenburg, W.H.I.M.; Arns, M.; Clark, C.R.; Bryant, R.A. Dis-order specificity despite comorbidity: Resting EEG alpha asymmetry in major depressive disorder and post-traumatic stress disorder. Biol. Psychol. 2010, 85, 350–354. [Google Scholar] [CrossRef] [PubMed]
  59. Lu, Q.; Jiang, H.; Bi, K.; Liu, C.; Yao, Z. Discriminative analysis with a limited number of MEG trials in depression. J. Affect. Disord. 2014, 167, 207–214. [Google Scholar] [CrossRef]
  60. Knott, V.; Mahoney, C.; Kennedy, S.; Evans, K. EEG power, frequency, asymmetry and coherence in male depression. Psychiatry Res. Neuroimaging 2001, 106, 123–140. [Google Scholar] [CrossRef]
  61. Ricardo-Garcell, J.; González-Olvera, J.J.; Miranda, E.; Harmony, T.; Reyes, E.; Almeida, L.; Galán, L.; Díaz, D.; Ramírez, L.; Fernández-Bouzas, A.; et al. EEG sources in a group of patients with major depressive disorders. Int. J. Psychophysiol. 2009, 71, 70–74. [Google Scholar] [CrossRef]
  62. Henz, D.; Schöllhorn, W.I. EEG Brain Activity in Dynamic Health Qigong Training: Same Effects for Mental Practice and Physical Training? Front. Psychol. 2017, 8, 154. [Google Scholar] [CrossRef] [Green Version]
  63. Bailey, S.P.; Hall, E.E.; Folger, S.E.; Miller, P.C. Changes in EEG During Graded Exercise on a Recumbent Cycle Ergometer. J. Sports Sci. Med. 2008, 7, 505–511. [Google Scholar]
  64. Mulders, P.C.; van Eijndhoven, P.F.; Schene, A.H.; Beckmann, C.F.; Tendolkar, I. Resting-state functional connectivity in major depressive disorder: A review. Neurosci. Biobehav. Rev. 2015, 56, 330–344. [Google Scholar] [CrossRef] [PubMed]
  65. Vogt, T.; Schneider, S.; Brümmer, V.; Strüder, H.K. Frontal EEG asymmetry: The effects of sustained walking in the elderly. Neurosci. Lett. 2010, 485, 134–137. [Google Scholar] [CrossRef] [PubMed]
  66. Burcal, C.J.; Jeon, M.H.; Gonzales, M.J.M.; Faust, M.E.; Thomas, A.C.; Hubbard-Turner, T.J.; Wikstrom, E.A. Cortical Measures of Motor Planning and Balance Training in Patients with Chronic Ankle Instability. J. Athl. Train. 2019, 54, 727–736. [Google Scholar] [CrossRef] [PubMed] [Green Version]
  67. Custo, A.; Van De Ville, D.; Wells, W.M.; Tomescu, M.I.; Brunet, D.; Michel, C.M. Electroencephalographic Resting-State Networks: Source Localization of Microstates. Brain Connect. 2017, 7, 671–682. [Google Scholar] [CrossRef] [PubMed]
  68. Villafaina, S.; Sitges, C.; Collado-Mateo, D.; Fuentes-García, J.P.; Gusi, N. Influence of depressive feelings in the brain processing of women with fibromyalgia: An EEG study. Medicine 2019, 98, e15564. [Google Scholar] [CrossRef] [PubMed]
  69. Wei, Y.; Ramautar, J.R.; Colombo, M.A.; Lindert, B.H.W.T.; Van Someren, E.J.W. EEG Microstates Indicate Heightened Somatic Awareness in Insomnia: Toward Objective Assessment of Subjective Mental Content. Front. Psychiatry 2018, 9, 395. [Google Scholar] [CrossRef] [PubMed]
Figure 1. Total exercise level and depression symptoms (a) BDI-II score, (b) SDS score, (c) physical activity time; HC: healthy control; DC: depression control; EI: exercise intervention; vs. DC, *: p < 0.05, **: p < 0.01, ***: p < 0.001; BDI-II: Beck Depression Inventory-II; SDS: Self-Rating Depression Scale; criteria of depression symptoms: major: BDI-II score ≥29 and SDS score ≥73; moderate: 29 > BDI-II score ≥ 20 and 73 > SDS score ≥ 63; mild: 20 > BDI-II score ≥ 14 and 63 > SDS score ≥ 53; criteria of depression symptoms: high level: time of moderate intensity physical activity ≥300 min/w; moderate level: 300 min/w > time of moderate intensity physical activity ≥ 150 min/w; low level: 150 min/w > time of moderate intensity physical activity.
Sustainability 13 06822 g001
Figure 2. Four EEG microstate topographies for three groups (HC: healthy control; DC: depression control; EI: exercise intervention; EEG: electroencephalogram).
Sustainability 13 06822 g002
Figure 3. Comparison of the transition results between four microstates in the college students (HC: healthy control; DC: depression control; EI: exercise intervention; red arrow: increase, blue arrow: decrease; *: p < 0.05, **: p < 0.01).
Sustainability 13 06822 g003
Figure 4. Comparison of the EEG power spectrum parameters among the three groups. Frequency curve and EEG energy map of significantly different bands (a); power spectrum values of each band (b); HC: healthy control; DC: depression control; EI: exercise intervention; EEG: electroencephalogram; vs. HC, **: p < 0.01; vs. DC, #: p < 0.05.
Sustainability 13 06822 g004
Table 1. Basic information of subjects.
IndicatorsHCDCEI
Sample size202020
Age (years)18–2018–2018–20
BMI (kg/m2), mean (SD)22.05 ± 2.6621.97 ± 1.8822.26 ± 2.41
Handedness, left/right0/200/200/20
Mother’s education level(UG = 7; HS = 9; MS = 4)(UG = 3; HS = 9; MS = 6; PS = 2)(UG = 4; HS = 9; MS = 6; PS = 1)
Father’s education level(UG = 9; HS = 11)(UG = 5; HS = 7; MS = 7; PS = 1)(UG = 7; HS = 8; MS = 5)
Family patterns(PF = 18; SPF = 1; EF = 1)(PF = 13; SPF = 4; EF = 3)(PF = 15; SPF = 3; EF = 2)
Rearing patterns(PR = 16; MR = 3; FR = 1)(PR = 11; MR = 5; FR = 1; GR = 3)(PR = 13; MR = 4; GR = 3)
NBV, times0.42 ± 0.513.96 ± 2.073.17 ± 2.73
Note: HC: healthy control; DC: depression control; EI: exercise intervention; BMI: body mass index; SD: standard deviation of the mean; NBV: the number of times a child was beaten or verbally assaulted during their upbringing; UG: university; HS: high school; MS: middle school; PS: Primary school; PF: parental family; SPF: single parental family; EF: extended family; PR: parents’ rearing; FR: father’s rearing; MR: mother’s rearing; GR: grandparents’ rearing.
Table 2. Comparison of EEG microstate parameters among the three groups.
ParametersHC (n = 20)DC (n = 20)EI (n = 20)Cohen’s d
MeanSDMeanSDMeanSDHC vs. DCHC vs. EIDC vs. EI
Total Time (s)55.4803.19658.5245.77860.1016.281−0.652−0.927−0.261
Duration (s)
A0.0730.0050.0690.0060.0710.0040.7240.442−0.392
B0.0690.0070.0670.0070.0680.0040.2860.175−0.175
C0.0700.0020.0680.002 **0.0690.001#1.0000.632−0.632
D0.0680.0060.0630.0070.0640.0030.6140.614−0.186
Mean Duration0.0700.0030.0670.004 *0.0680.0610.8490.046−0.023
Occurrence
A3.6490.1793.7000.2663.7600.049−0.225−0.225−0.314
B3.4740.3143.9220.229 **3.7160.140#−1.630−0.9951.085
C3.8400.3713.5970.3263.8370.2410.6960.010−0.102
D3.5930.2403.8050.213 *3.7270.533−0.934−0.3240.192
Mean Occurrence14.5560.58315.0240.677 *15.0410.475−0.741−0.912−0.029
Contribution (%)
A0.2600.0540.2520.0510.2590.0570.1520.018−0.129
B0.2390.0470.2630.0420.2420.040−0.538−0.0690.512
C0.2480.0480.2590.0540.2870.072−0.215−0.637−0.440
D0.2540.0340.2130.056 *0.2270.0350.8850.7830.300
Note: HC: healthy control; DC: depression control; EI: exercise intervention; EEG: electroencephalogram; vs. HC, *: p < 0.05, **: p < 0.01; vs. DC, #: p < 0.05.
Table 3. Correlation of various indicators between EEG microstates and power spectrum in the three groups.
BandsGroupsDurationOccurrenceContribution
ABCDABCDABCD
δHC0.430−0.3760.091−0.2330.0840.2020.250−0.1090.0090.221−0.4200.280
DC−0.122−0.044−0.0070.191−0.440−0.3310.016−0.122−0.171−0.578 *0.604 *0.023
EI−0.4370.0110.357−0.1340.1610.057−0.842 *−0.161−0.196−0.4670.2860.165
θHC0.406−0.134−0.254−0.203−0.1540.346−0.083−0.270−0.0710.364−0.003−0.388
DC−0.564 *0.1500.4780.196−0.569 *−0.485−0.399−0.587 *−0.509−0.4020.650 **0.228
EI−0.0260.262−0.379−0.2200.312−0.176−0.703−0.289−0.125−0.5100.624−0.304
αHC0.470−0.340−0.240−0.4160.4120.3910.027−0.242−0.3820.554 *−0.2930.263
DC−0.354−0.0680.006−0.235−0.5220.193−0.0340.080−0.337−0.1180.547 *−0.203
EI−0.5720.1600.3280.112−0.0320.084−0.885 **0.036−0.451−0.4300.4840.148
βHC0.213−0.1620.066−0.0360.024−0.025−0.1070.296−0.027−0.4450.3890.106
DC−0.471−0.222−0.071−0.207−0.196−0.038−0.3180.3190.0650.0410.039−0.201
EI−0.577−0.1890.900 **0.026−0.042−0.0800.323−0.1010.303−0.008−0.176−0.079
Note: HC: healthy control; DC: depression control; EI: exercise intervention; EEG: electroencephalogram; *: p < 0.05, **: p < 0.01.
Publisher’s Note: MDPI stays neutral with regard to jurisdictional claims in published maps and institutional affiliations.

