Article

Trends and Interannual Variability of Extreme Rainfall Indices over Cameroon

by
Derbetini A. Vondou
1,*,
Guy Merlin Guenang
1,2,
Tchotchou Lucie Angennes Djiotang
1 and
Pierre Honore Kamsu-Tamo
1
1
Laboratory for Environmental Modelling and Atmospheric Physics, Department of Physics, University of Yaounde 1, Yaounde P.O. Box 812, Cameroon
2
L2MPS, Department of Physics, Faculty of Science, University of Dschang, Dschang P.O. Box 96, Cameroon
*
Author to whom correspondence should be addressed.
Sustainability 2021, 13(12), 6803; https://doi.org/10.3390/su13126803
Submission received: 28 April 2021 / Revised: 7 June 2021 / Accepted: 11 June 2021 / Published: 16 June 2021

Abstract

:
Central African citizens are highly vulnerable to extreme hydroclimatic events due to excess precipitation or to dry spells. This study makes use of CHIRPS precipitation data gridded at 0.05° × 0.05° resolution and extended from 1981 to 2019 to analyze spatial variabilities and trends of six extreme precipitation indices defined by the Expert Team on Climate Change Detection and Indices (ETCCDI) over Cameroon. They are the number of wet days (RR1), the simple daily intensity index (SDII), the annual total precipitation from days greater than the 95th percentile (R95ptot), the maximum number of consecutive wet days (CWD), the maximum number of consecutive dry days (CDD), the number of very heavy rainfall (RR20). The standard precipitation index (SPI) time series were also examined in the five agro-climatic regions of the domain. The pattern of annual precipitation was first checked over the entire domain. We obtain a well-known pattern showing a decreased precipitation northward with the highest values around the Atlantic Ocean coast. The analysis shows that all indices represent patterns approximately similar to that of annual rainfall except CDD where the spatial south-north gradient is reversed. RR20 shows the lowest spatial variability. Trend study of RR1 indicates negative values south of the domain and predominated positive values in the northern part, where CDD, on the contrary, shows a decreased trend. The highest trends are observed in the northernmost area for CWD and around the coast for SDII and R95ptot. SPI time series indicate an alternative dry and wet period and the years between 1990 and 2000 witnessed more annual wet conditions. Such a study is very important in this domain where variabilities of climatic components are very high due to climate change impact and diversified relief. The results can serve as a reference for agricultural activity, hydropower management, civil engineering, planning of economic activities and can contribute to the understanding of the climate system in Cameroon.

1. Introduction

In Cameroon, rainfall plays an important role in the planning and management of water resources. More than 95% of electricity is generated by hydro-power [1]. Water flowing in the rivers provides the main resources for drinking. In urban areas, rapid population growth and inadequate urban infrastructures highlight the need for integrated water management. Disturbance of water supply will negatively impact human well-being in these populated regions. Therefore, it is essential to store water during rainy periods for better management when dry conditions are prevailing. Furthermore, the economy of the country is essentially built on rain-fed agriculture, which contributes to an important part of the gross domestic product. Forests are considerably constrained not only from climate change but also from increasing rate of inhabitants and substantial demand for forest resources. Unforeseeable rainfall alteration and drought can dubiously disturb plant growth and evolve in food shortages which can have an adverse effect on gross domestic product.
The climate of Cameroon has been changing [2]. The occurrence of extreme weather events is generally connected to strong rainfall [3,4]. Many cities in the country are recurrently devastated by flooding. Ref. [5] shows that the start and demise of the rainy season over Cameroon depend on the region. Some parts of Cameroon have been afflicted by the rainy season arriving later with less water. Extreme rainfall events represent a major threat. As projected by IPCC reports, extreme precipitation and drought episodes will probably happen more regularly and much more intensely. Extreme precipitation may result in flooding, causing water-related illness and population migration. An understanding of contemporary rainfall variability and trends is needed for planning suitable adaptation measures especially in the agricultural and hydrological sectors.
A number of recent studies [6] highlight the necessity for consideration of using dynamically downscaled regional climate models (RCMs), such as those from the Coordinated Regional Climate Downscaling Experiment Program (CORDEX) to analyze extreme trends. Results of [7] and [8] revealed that the RCMs used in their study mimic quite well the spatial distribution of precipitation extremes. Rainfall extreme changes have been explored in many regions in Africa [9]; they showed some significant trends in heavy precipitation over Central Africa. However, none of this research has looked into the changes in extreme precipitation indices in different countries where national decisions are taken. In the study of [9], limited station data have been considered for Cameroon for their study. Among the reasons pertaining to this lack of studies of Cameroon is the scarcity of long-term continuous rainfall time series. Ref. [10] used monthly data for only eight stations to investigate temperature and rainfall trends over agro-climatic regions of Cameroon, which is not enough to represent the climate of the country and to analyze the occurrence of single large-scale events like variable onset and offset of rainfall, long dry spells or flood. Increased human deaths have been reported every year as a consequence of flood events [4]. Furthermore, there is no intensive campaign of observations devoted to the comprehension of climate variability in Cameroon to bring out more relevant tools for policy and decision-makers at the agro-climatic regional level derived from high-resolution data.
It is very important to build a map of extreme rainfall due to the growing vulnerability of populations to natural hazards. For a good flood risk management and civil engineering infrastructure design, there is a need to have data suitable at satisfactory temporal and spatial resolutions. However, in Cameroon, conventional weather stations are unevenly disseminated and there is too much regional missing data with strong spatial gradients of precipitation. Thus, the overall aim of the present study is to investigate an in-depth historical analysis of the spatio-temporal trends of rainfall and some hydrological extreme indices over agro-ecological zones of Cameroon using high resolution and homogenized Climate Hazards Group InfraRed Precipitation (CHIRPS) data to consider the local details brought out by rainfall time series in addition to regional consistency. Trends and variability in the considered indices will be examined. This paper is structured as follows: Section 2 is devoted to the description of the study area, datasets and methods. Section 3 presents the main results and discussions. Finally, conclusions and recommendations based on the findings are presented in Section 4.

2. Data and Method

2.1. Study Area

Cameroon is characterized by an entire spectrum of tropical climates. The main drivers of climate in the country are south-westerly humid flow coming from the Atlantic Ocean and dry north-easterly Harmattan coming from the Sahara Desert. Various highlands and concave coastline shapes modify precipitation distribution. Rainfall decreases from the coast towards the land and from the south to the north. The diversity of ecological regions in Cameroon makes it an interesting area for the study of tropical climate variability [10]. Rainfall is well known to be characterized by a strong local variability at various scales [2]. The country is subdivided into five agro-climatic zones namely: the sudano-sahelian zone (ZSS), the high savannah zone (ZHS), the western highlands zone (ZHP), the dense humid forests zone with monomodal rainfall (ZFM), and the dense humid forests zone with bimodal rainfall (ZFB) (see Figure 1).

2.2. Data Used

In this study, we used CHIRPS data developed to support the United States Agency for International Development Famine Early Warning Systems Network [11]. CHIRPS is produced by a collaboration between researchers of the Climate Hazards Group, the United States Geological Survey, and the Earth Resources Observation and Science center. It is a quasi-global daily rainfall time series gridded at 0.05° × 0.05° available from 1981 to the present. Rainfall is estimated from thermal infrared based on the calibration of Cold Cloud Duration (CCD) by Tropical Rainfall Measuring Mission Multi-Satellite Precipitation Analysis version 7. Stations rainfall data are also incorporated in the estimation through state-of-the-science interpolated gauge products [12]. The CHIRPS product may have some inhomogeneity over parts of the world where the availability of station data is not consistent over time. The CHIRPS product incorporates different available stations over the years. However, their number has typically been decreasing over time. A detailed description of the CHIRPS product has been provided in [11]. Ref. [13] showed that CHIRPS reproduces fairly well the mean rainfall regimes and the spatial patterns of mean annual rainfall over southern Cameroon. Detailed validation of CHIRPS data is beyond the scope of this study. CHIRPS are used to quantify the hydrologic impacts of decreasing precipitation and rising air temperatures in the Greater Horn of Africa [14]. Ref. [15] satisfactorily used CHIRPS data along the coast of the Gulf of Guinea. Investigating extreme rainfall indicators over Coastal West Africa, Ref. [16] showed good agreements between stations data and CHIRPS rainfall estimates. The CHIRPS product has been shown to capture rainfall variability and outperforms other datasets in Mozambique [17]. The results of [18] show that CHIRPS rainfall is significantly better than other satellite products over East Africa and is in concordance with observations. Climatological averages were calculated from 1981 to 2019.

2.3. Methodology

For this study, indices analyzed are defined by the Expert Team on Climate Change Detection and Indices (ETCCDI). These indices have been described in [19]. At each grid point, six ETCCDI indices were calculated: the number of wet days (RR1), the simple daily intensity index (SDII), the annual total precipitation from days greater than 95th percentile (R95ptot), the maximum number of consecutive wet days (CWD), the maximum number of consecutive dry days (CDD), the number of very heavy rainfall (RR20). A day is considered wet when the daily precipitation is at least 1 mm.
To compute the impact of drought, the Standardized Precipitation Index (SPI) was chosen for its simplicity and relevance. This requires a simple and ready-to-use atmospheric variable, easy to compute, and generally recognized as efficient in capturing drought events [20]. The method used to compute SPI for the investigation has been widely applied [21] and is founded on a probability-based indicator that quantifies the degree to which the total precipitation of a particular period fluctuates from normality. The SPI was computed by fitting a probability density function to the frequency distribution of precipitation summed over the desired time scale. The gamma density function was used due to its flexibility to display many precipitation distributions. This was performed separately for each period and for each region in space. SPI uses monthly precipitation aggregates at various time scales. Positive SPI values correspond to wet sequences and high negative values correspond to drought periods. Classifications of dryness and wetness events based on the SPI may be important for agricultural applications and can help with water supply management.
To investigate the linear trends in a given hydro-climatological time series, the Mann–Kendall test is frequently used. The test has been extensively used to evaluate the presence of significant climate trends [22]. In this test, the null hypothesis (H0) stipulated that there has been no trend in precipitation over time; the alternate hypothesis (H1) proposed that there has been a trend (increasing or decreasing) over time. The mathematical equations for calculating Mann–Kendall S-statistics, and standardized test statistics are as follows:
S = i = 1 n 1 j = i 1 n s g n ( x j x i )
where xi and xj are sequential data for ith and jth terms, n is the sample size and
s g n ( x j x i ) = { 1 , i f ( x j x i ) > 1 0 , i f ( x j x i ) = 0 1 , i f ( x j x i ) < 0
The S-statistics behaves approximately as normally distributed and the test is performed with normal distribution with E(S) = 0. The variance of S, Var(S) is given as:
V a r ( S ) = 1 18 [ n ( n 1 ) ( 2 n + 5 ) p = 1 q t p ( t p 1 ) ( 2 t p + 5 ) ]
where tp is considered as the number of ties for pth value and q is the number of tied values, and the summation is overall ties. The standardized normal test statistic is calculated as
Z = { S     1 V a r ( S ) , i f   S > 0 0 , i f   S = 0 S   +   1 V a r ( S ) , i f   S < 0
Positive Z values indicate an upward trend in the time series; negative Z values indicate a negative trend. For a two-tailed test, at a given α level of significance, H1 is accepted if Z > Z1 − α/2, where Z1 − α/2 is calculated from the standard normal distribution tables. At the 5% significance level, the null hypothesis of no trend is rejected if |Z| > 1.96.
To estimate the true slope of an existing trend, Sen’s non-parametric method [23], widely approved for its robustness was considered. The magnitude of the slope can be obtained as follows:
β = [ x i x j ( i j ) ]   for   all   j < i
If the total number of data points in the series is n, then there will be n(n−1)/2 slope estimates and the test statistic is the median of all slope estimates. The positive and negative signs of test statistics indicate increasing trends and decreasing trends respectively.

3. Results and Discussion

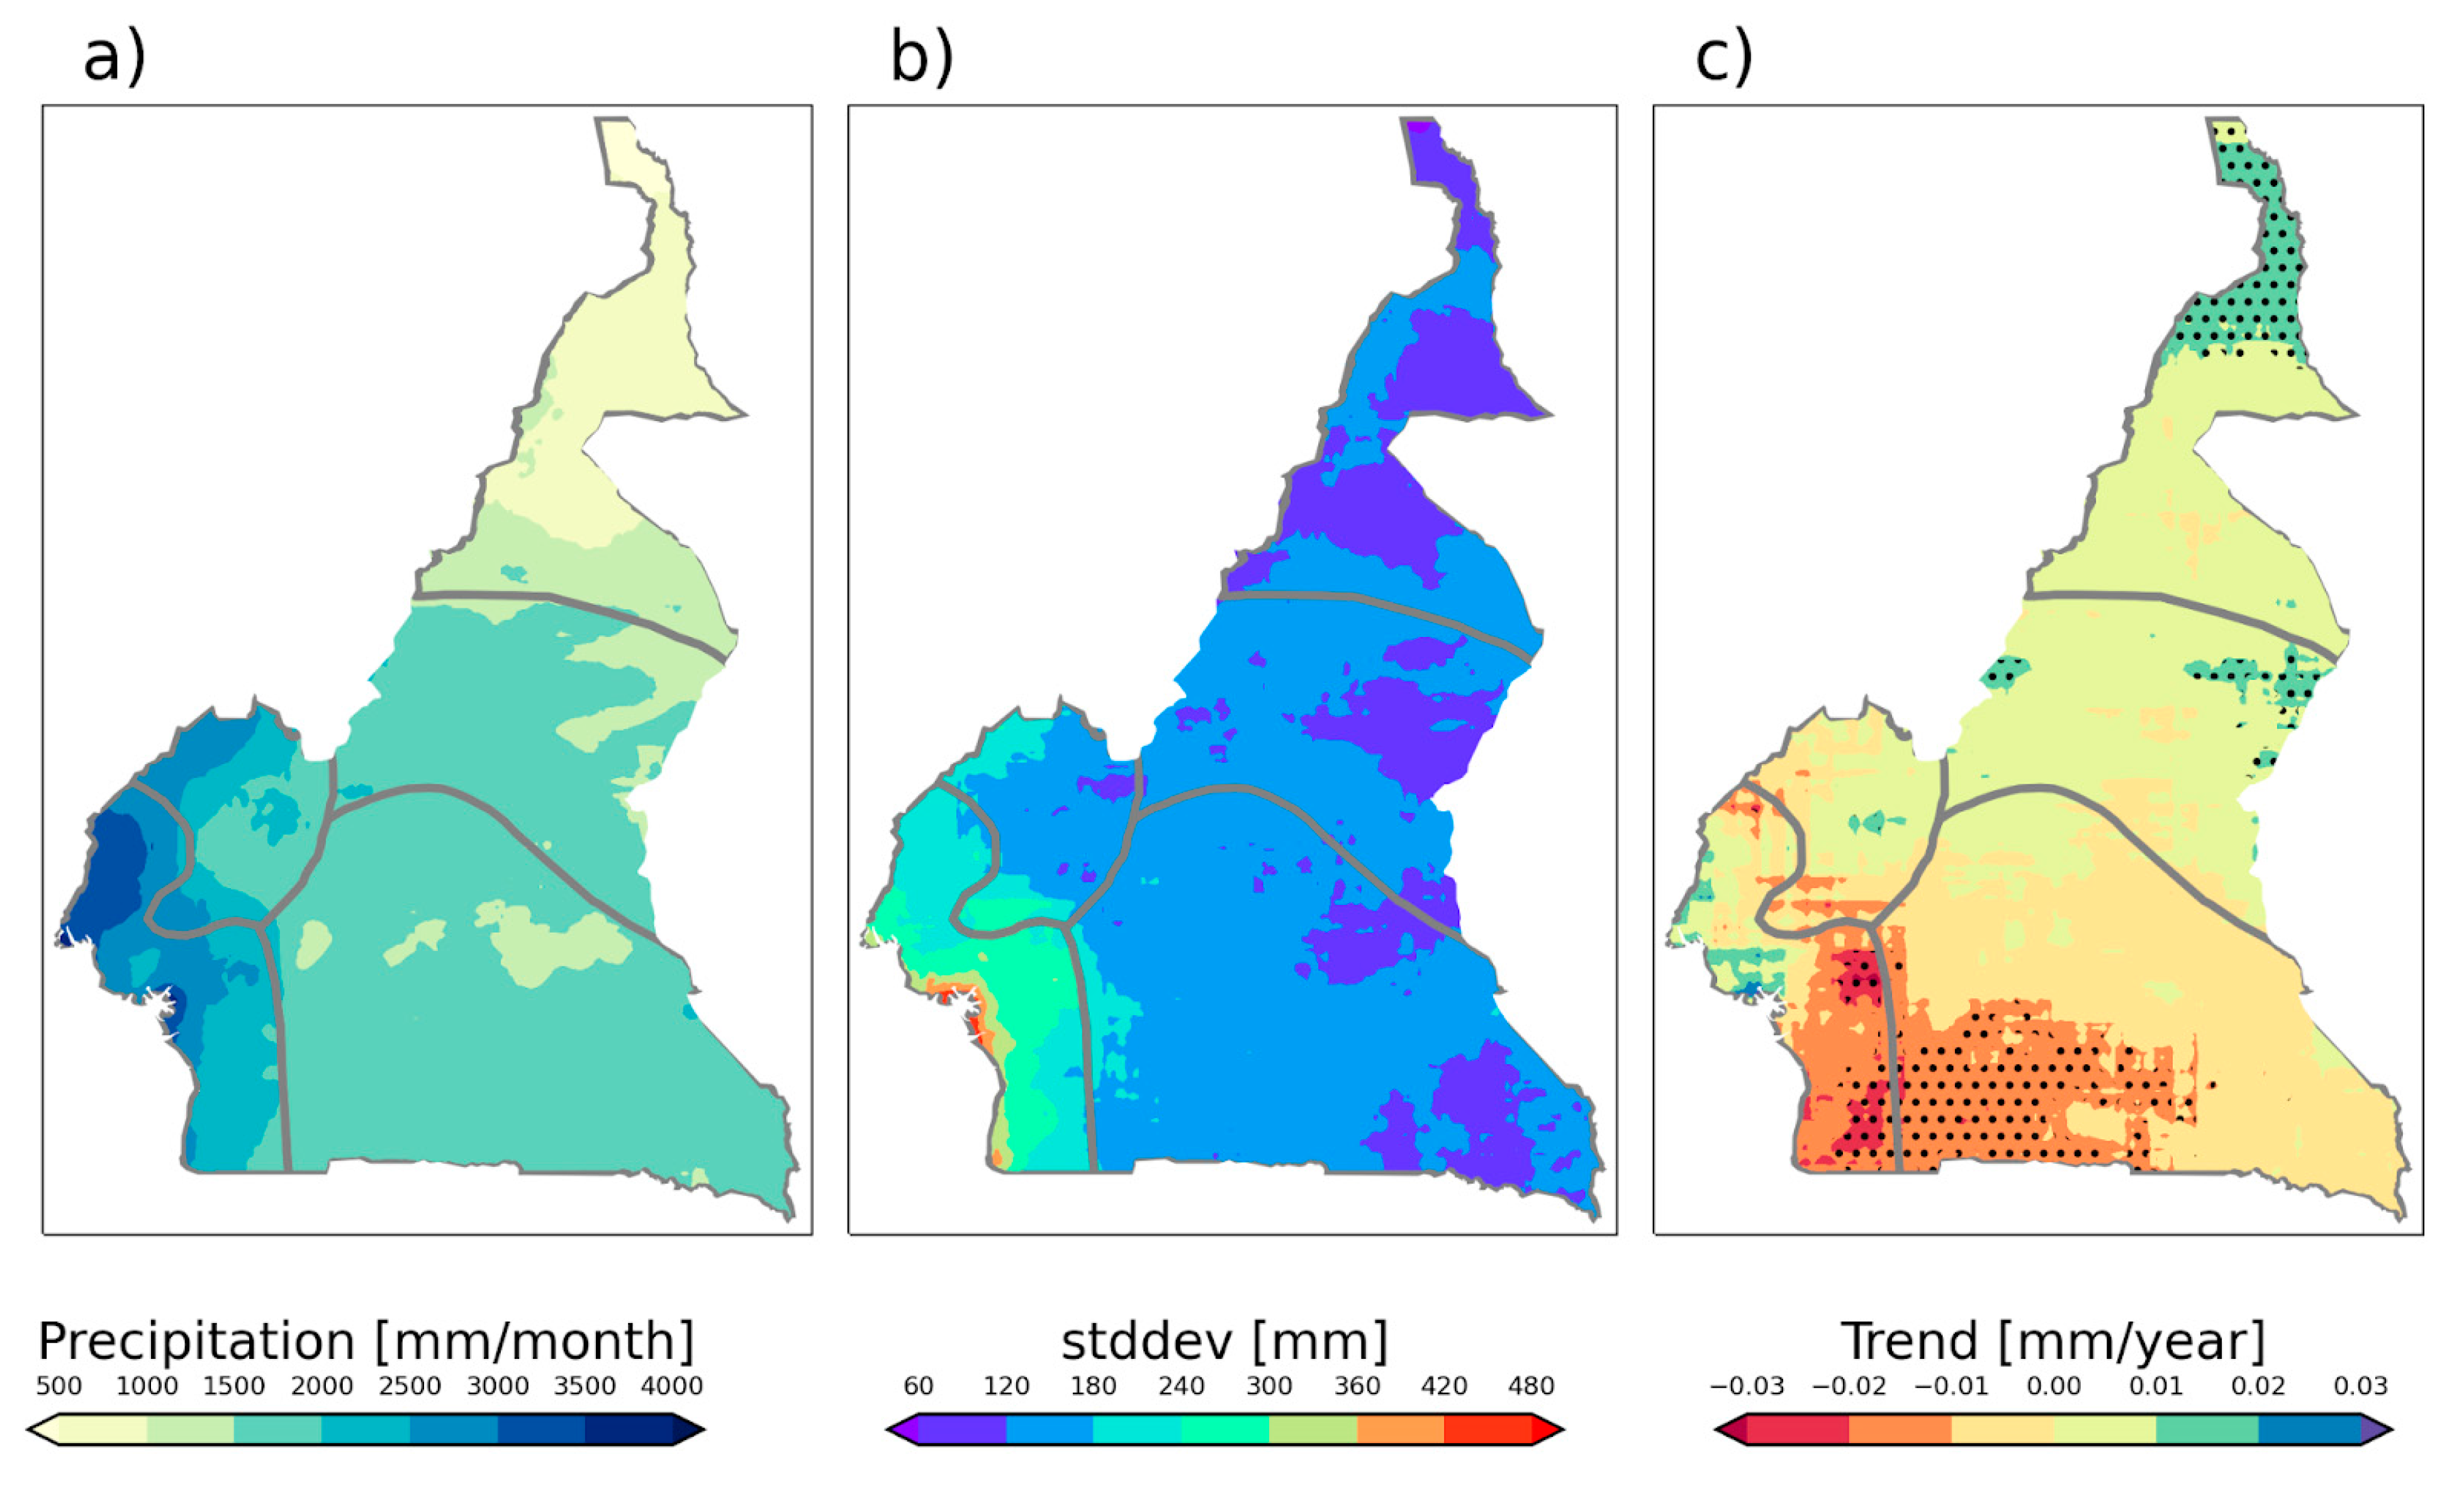
3.1. Climatological Mean Annual Precipitation

A synopsis statistic of the long-term series for the respective ecological zones of Cameroon is presented in Table 1. General statistical parameters (Minimum, maximum, mean, standard deviation, and coefficient of variation) of annual rainfall time series were calculated for each state. Rainfall varies between 650 and 1083 mm/year in ZSS with a coefficient of variation of 10.5%. The high variability in ZSS reflects very significant precipitation variability noted in the Sahelian zone [5], coincidentally, the region is the most populated of Cameroon. This type of high rainfall variability in ZSS hinders the practice of rain-fed agro-pastoral activities. Adequate planning actions to reduce potential impacts of unreliable rainfall and severe events may be taken in this region that is prone to such extremes [4]. Recent studies have reported intensified extreme events over Cameroon in the wake of persistent global warming [7]. The coastal zone (ZFM) has the second highest coefficient of variation (CV) of 5.72% and precipitation varied between 2095 and 2808 mm/year. The most elevated (ZHP) zone shows rainfall between a minimum of 1973 and a maximum of 2536 mm/year and a CV of 5.38%. Remarkably, the yearly variation shows that years with the highest amount of rainfall (respectively that of the least amount) are not the same in all agro-ecological regions. The observed anomalies depict a period of dryness (respectively wetness) over Cameroon.
Figure 2a presents the climatological annual mean based on CHIRPS data together with their standard deviation and trend to assess the stability of these patterns across the country. Relatively high amounts of rainfall (>3500 mm) are found along or close to the coast and drop moving away from the coastline. As shown in Figure 2a, the amount of precipitation decreases towards the north of the country, ranging from about 2500 mm in the south to less than 500 mm around Lake Chad. This decreasing gradient of precipitation is disrupted in the center of the country by the influence of high topography [2]. These observations are in agreement with findings in [5]. The coastal area depicts maximum variability as shown by the higher annual standard deviation of precipitation. The rest of the country presents relatively lower variability. Spatial trends of precipitation are revealed in Figure 2c characterized by a significant decrease or increase observed in different zones. Generally, annual rainfall in the northern part of Cameroon shows an increasing trajectory compared to a decreasing tendency in the south. The maximum positive trends in yearly rainfall amount dominated in the far north region of Cameroon whereas maximum negative trends were found to cover almost all major southeastern parts.

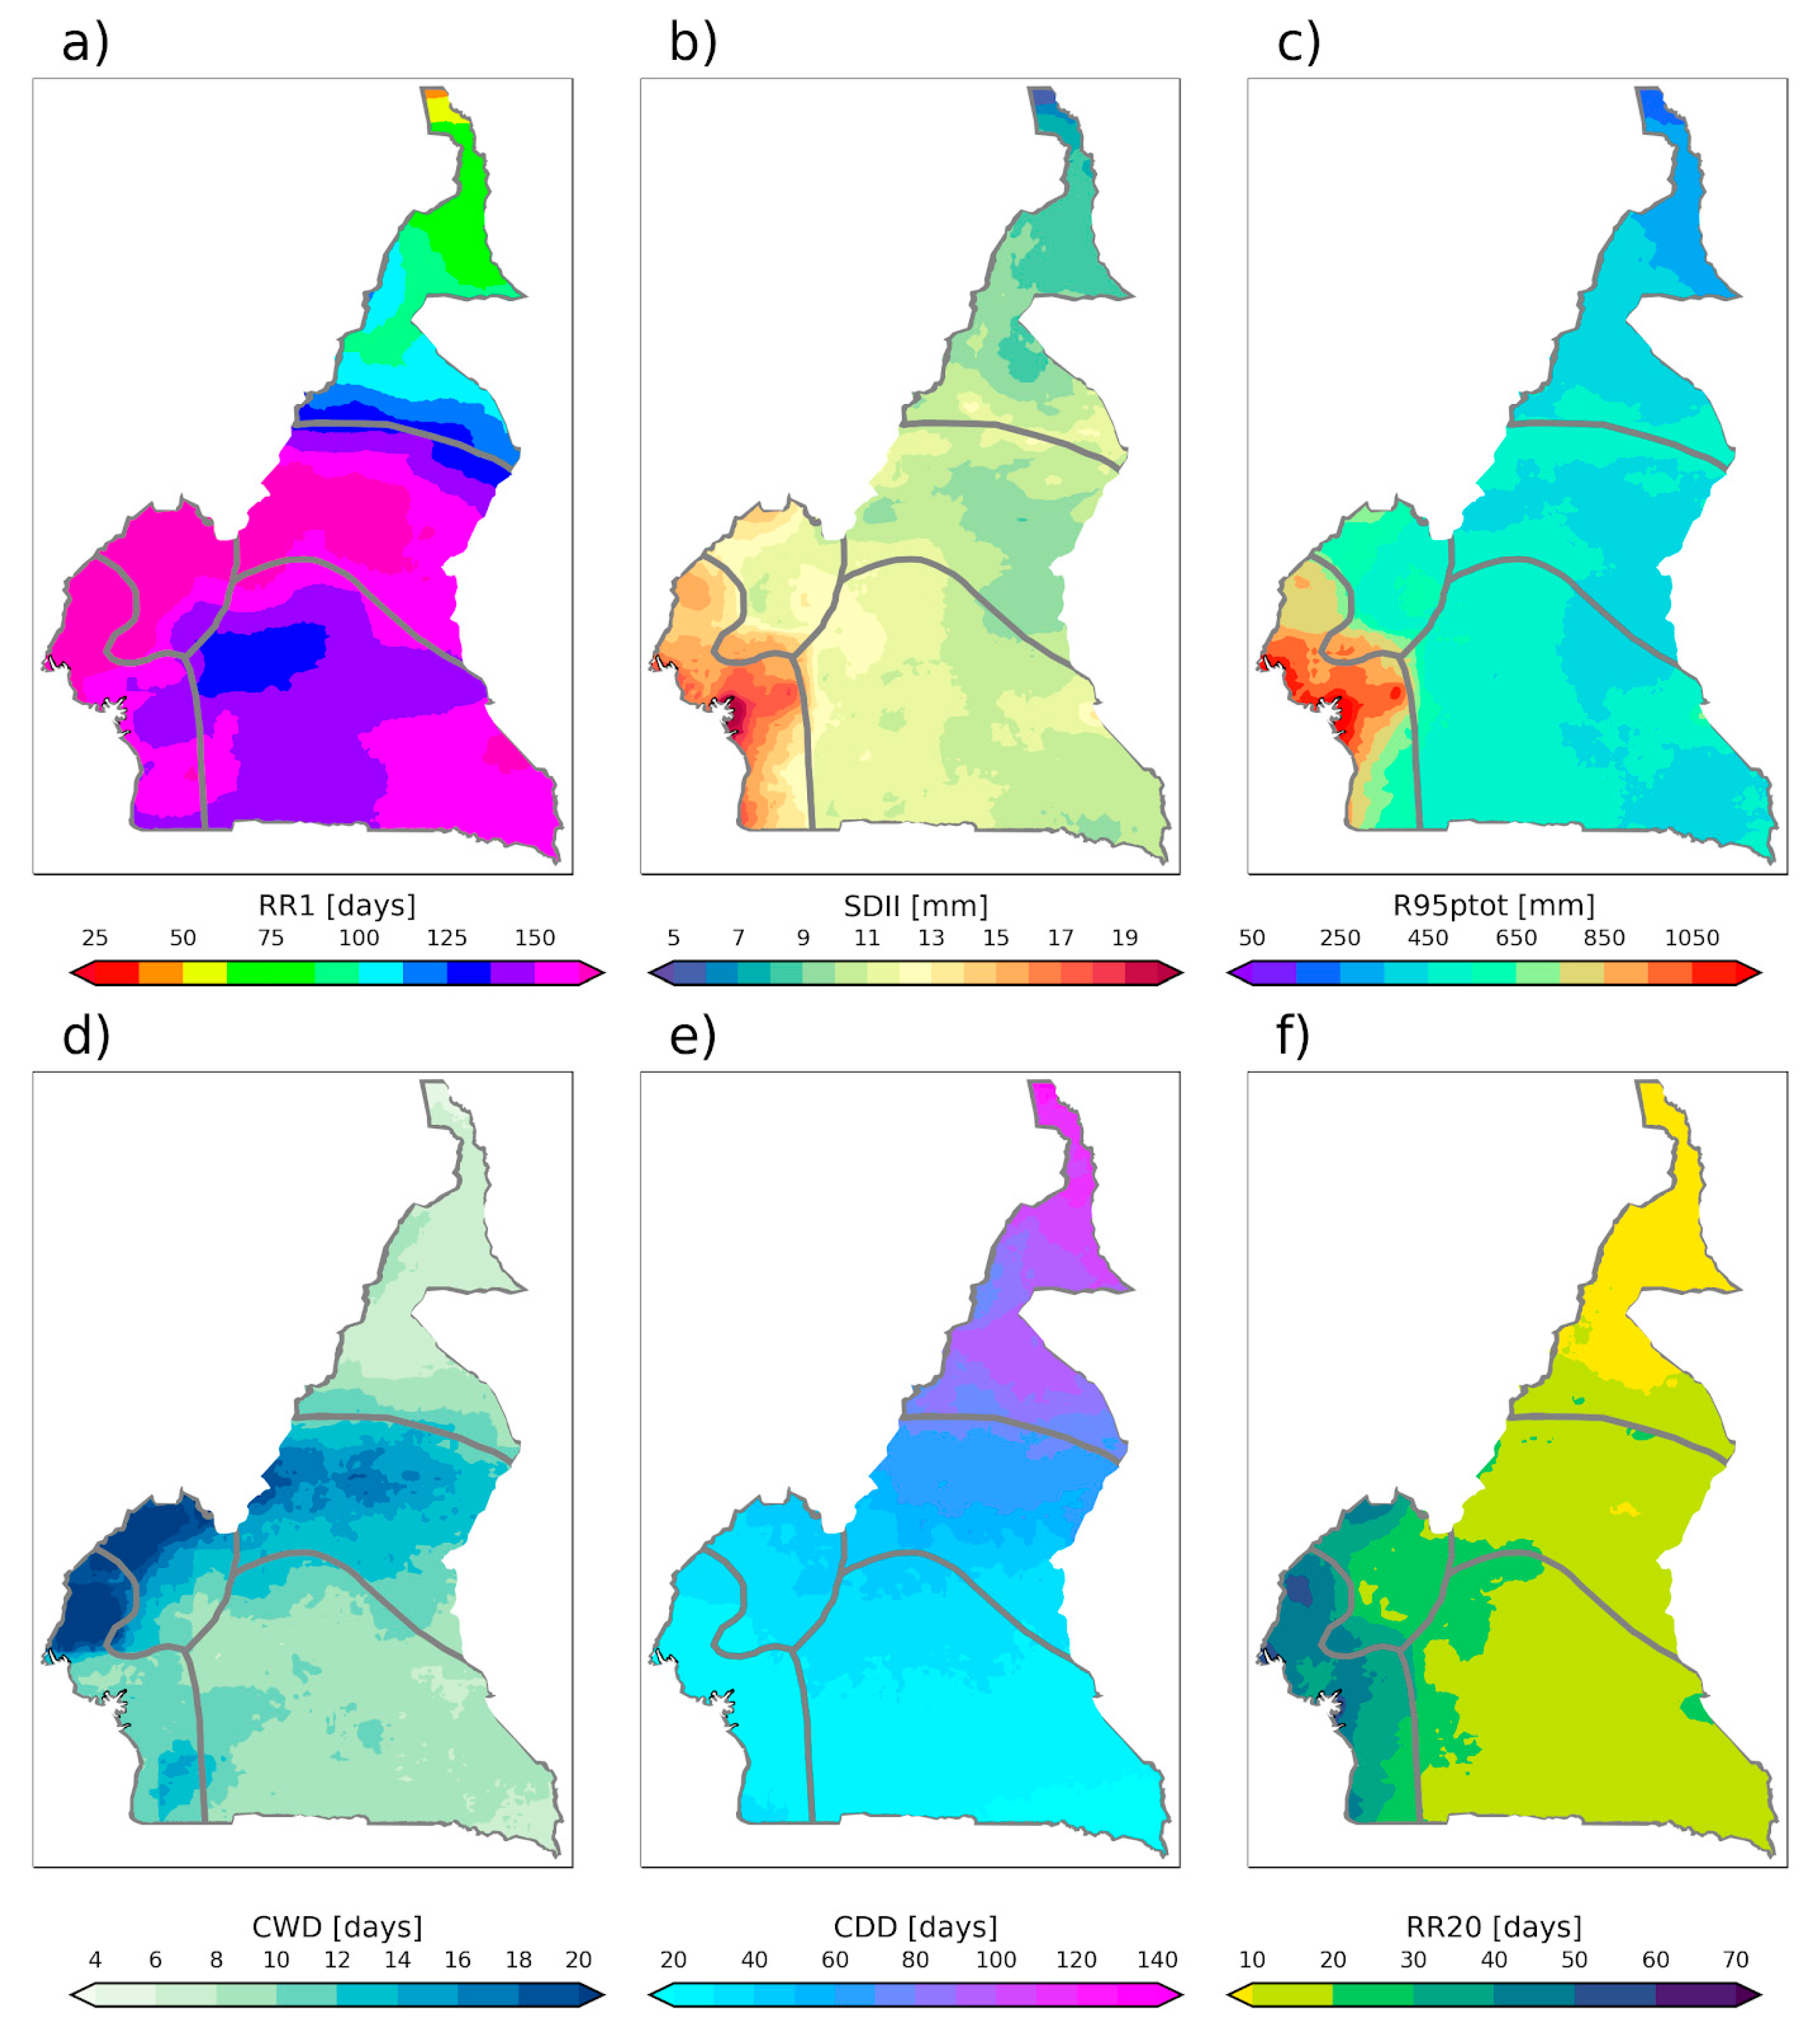
3.2. Spatial Variability of Extreme Indices
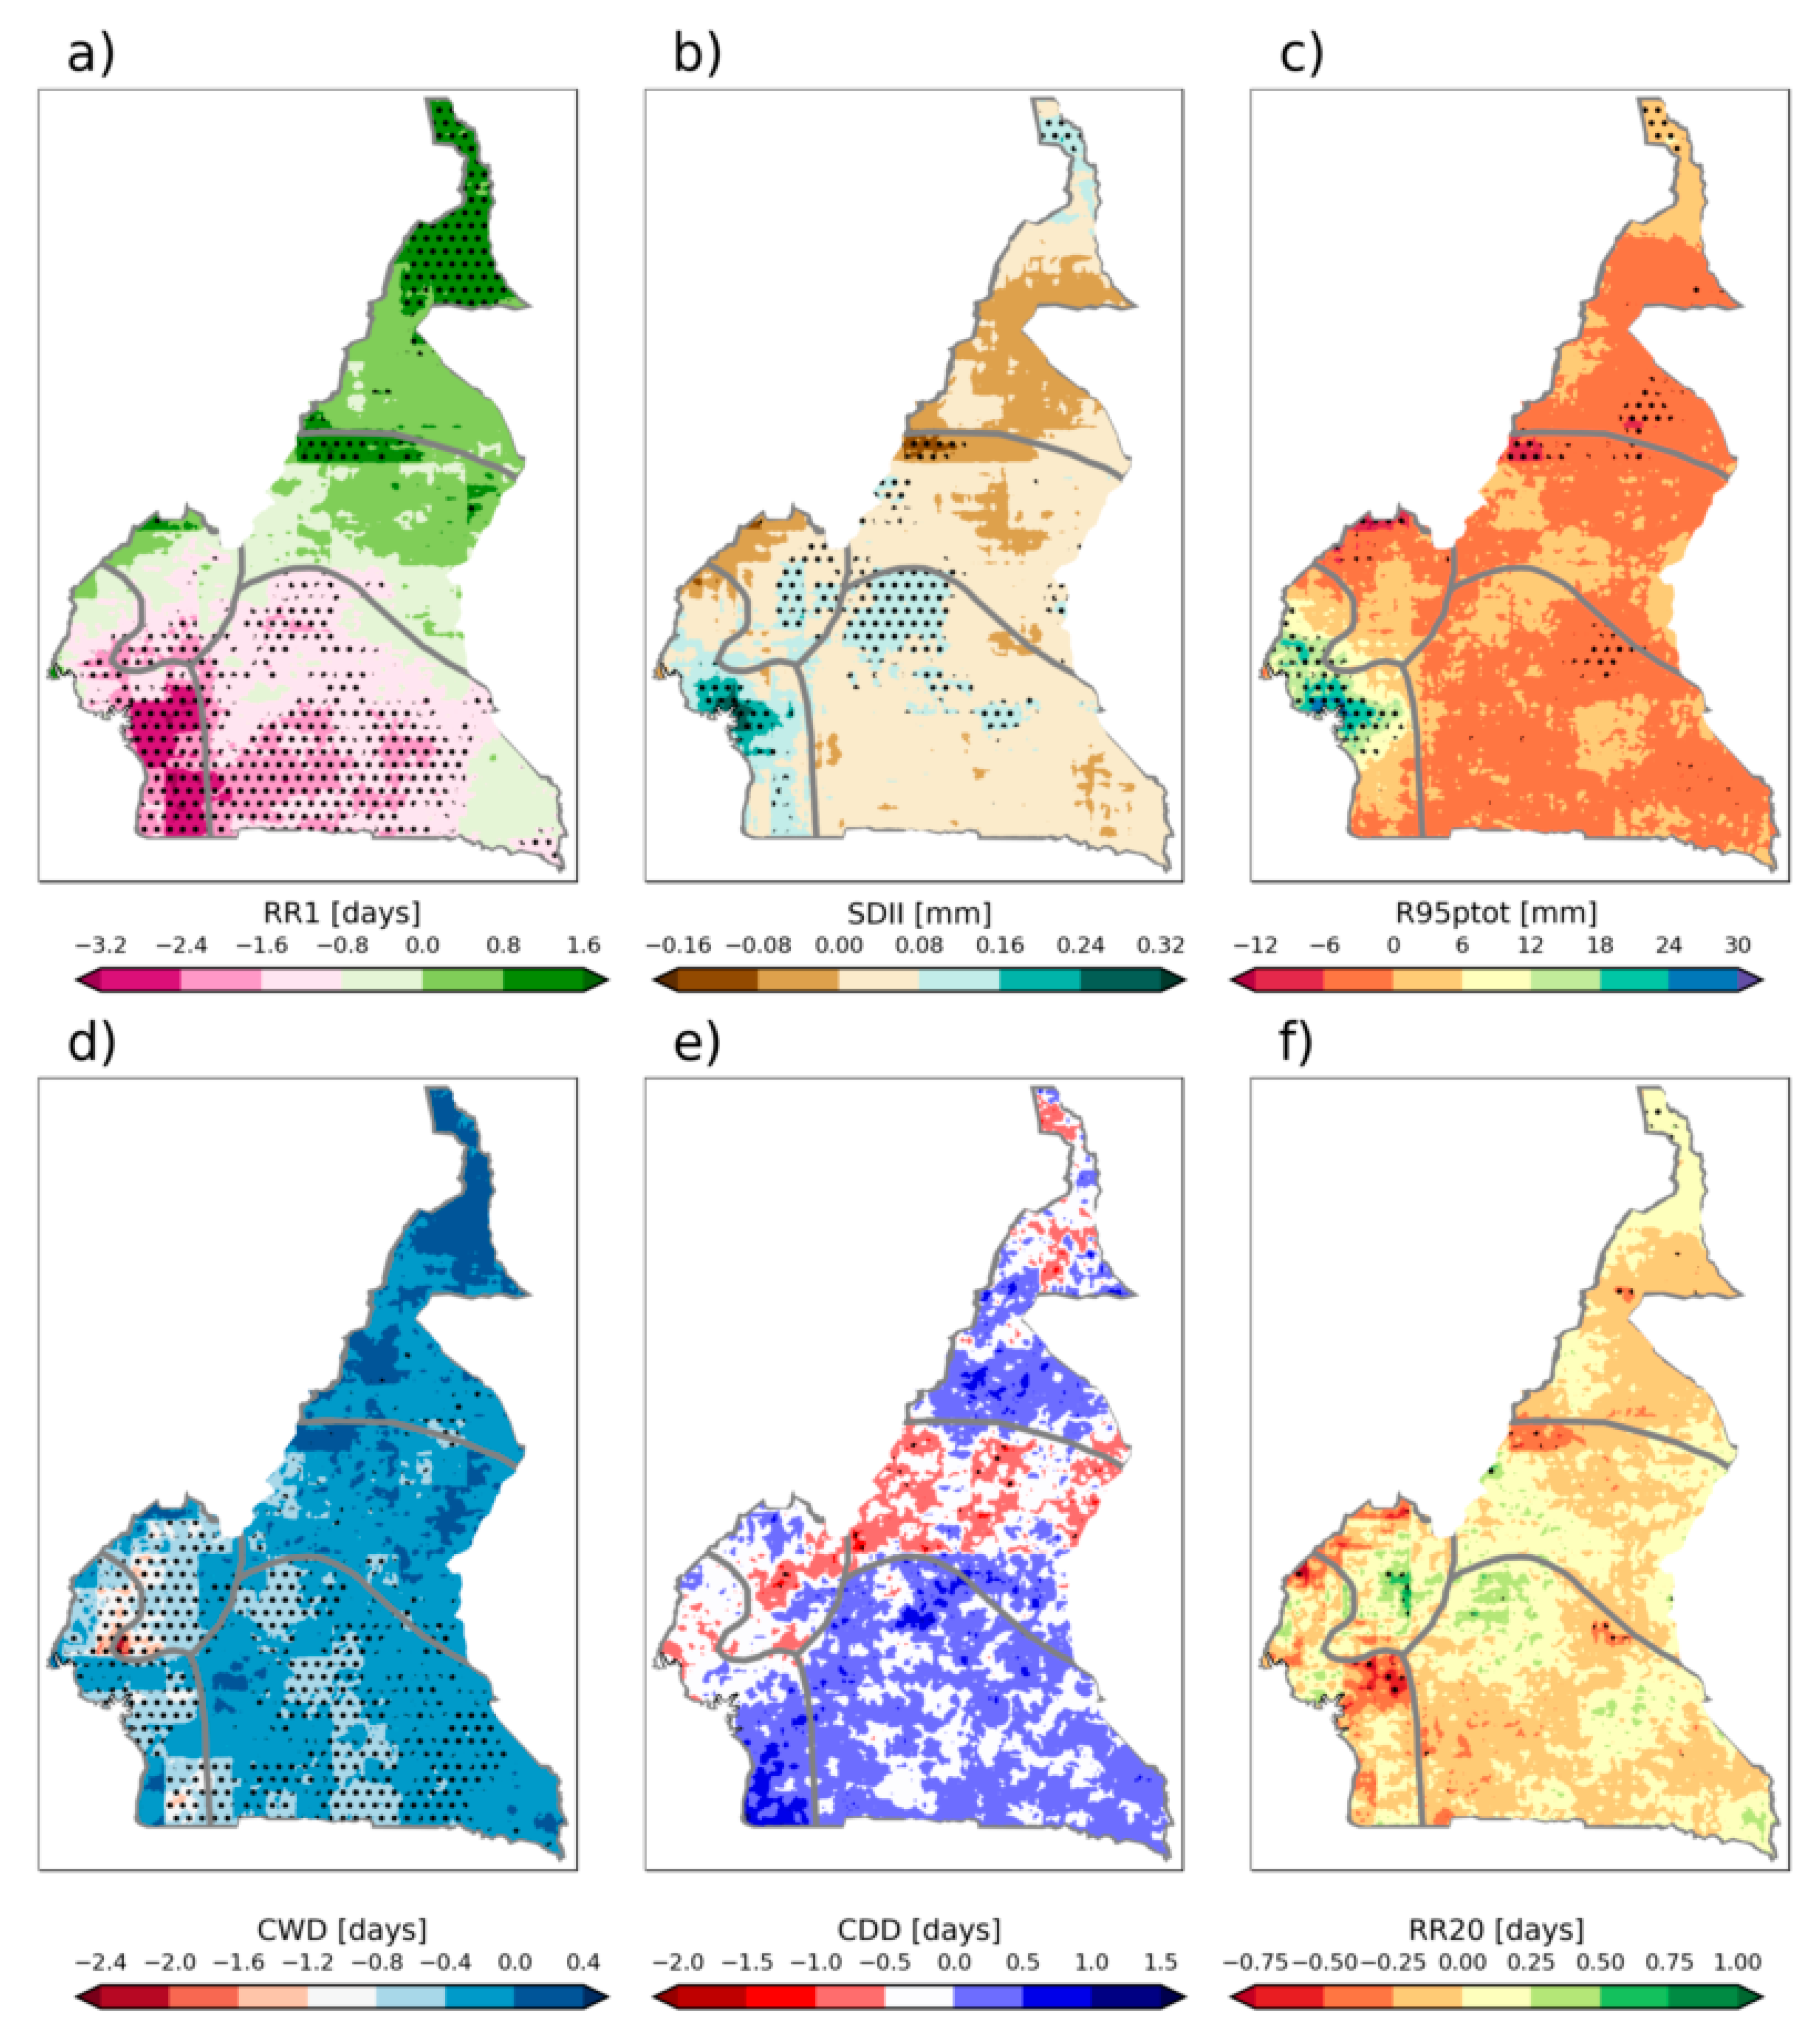
The results of the mean climatologies of the six selected rainfall indices (RR1, SDII, R95ptot, CWD, CDD and R20) are described in Figure 3 where the climatologies of the frequency indices over Cameroon were computed from data covering a period of 39 years (1981–2019). From Figure 3a, it is shown that the number of days with at least 1 mm (RR1) varies between 25 and 150 days. Generally, the number of rainy days is shorter in the north than in the south. The spatial distribution of RR1 does not strictly follow the pattern of mean annual rainfall. The effect of high relief on the increasing number of rainy days is also perceptible in the west, where more than 150 days per annum were recorded. The spatial patterns of SDII vary between 5 and 20 mm per year (Figure 3b). SDII values singularize the coastal region, where high values were found. The south-north decreased gradient of SDII is clearly highlighted. It follows a spatio-temporal variability of precipitation as well as a northward migration of dry isohyets. These observations are in agreement with findings in [8]. A systematic low SDII was obtained in the northernmost part of Cameroon with values below 7 mm. Relatively medium daily rainfall intensities (7–9 mm) were seen to dominate over the center of Cameroon, while most SDII below 7 mm stretches eastwards (or stretches towards the east). The annual R95ptot index ranges between 50 and 1000 mm per year, were observed over the entire country (Figure 3c). The R95ptot rainfall amount has high intensities over the coastal part of Cameroon. Low values of R95ptot were reached around Lake Chad highlighting the strong dependence on climatic conditions, which is characterized by high aridity accentuated (emphasized) by high temperatures. There are similarities in the spatial patterns displayed for SDII and that of R95ptot. The pattern of mean RR20 is very similar too (Figure 3e). The spatial distribution of CWD (Figure 3d) mimics that of mean annual rainfall. The decrease in precipitation observed over north Cameroon is mostly as a result of an increase in dry frequency.

3.3. Trend Study

The Mann–Kendall test has been performed to find significant trends (if any) in the yearly series. The present study used this trend test to reveal the possible significant and abrupt changes in rainfall patterns over the study area for the given period (1981–2019). It assumed a 5% threshold to reject the null hypothesis. The results for time series in agro-ecological zones ZFM, ZFB, ZHP show Z scores of −1.13, −1.37, and −0.04 (Table 2), for which |Z| is lesser than the threshold value of 1.96, being an indication of negative tendencies. However, Z shows positive values for the analysis in agro-ecological zones ZHS and ZSS indicating an increase in rainfall for the given period. The highest Z value was witnessed in ZSS at about 1.64. This important result shows that rainfall shifts have occurred in the different agro-ecological zone, which should affect decision making with respect to modifications in cropping (sowing) and cropping (sowing) calendars in light of the current drive to attain food security and attain sustainable development targets in Cameroon.
Figure 4a indicates that there is a positive trend of annual RR1 over much of the northern portions of Cameroon, while there is a negative trend of annual RR1 days in the southern part. Positive trends of RR1 associated with the decreasing trend of CDD (Figure 4e) in the northern part of Cameroon can partially be attributed to the partial recovery of rainfall in the Sahel [24,25]. The trend in annual RR1 is mostly consistent with the trend in annual rainfall (Figure 2c), albeit trends are generally more extensive, as statistically significant positive trends are concentrated on the coast. There has been a general increase in the trend of CWD area, dominated by increases in the Lake Chad area (Figure 4d). The overall pattern in SDII and R95ptot trends in Figure 4b,c show that there has been an extending shift towards the coast of environments favorable for excessive rainfall from 1981 to 2019. This result implies that there is potential for an overall increase in the risk of damages and losses (of lives) from large floods, albeit the increase in risk would be amplified more frequently if the good policy of urbanization management is not considered.

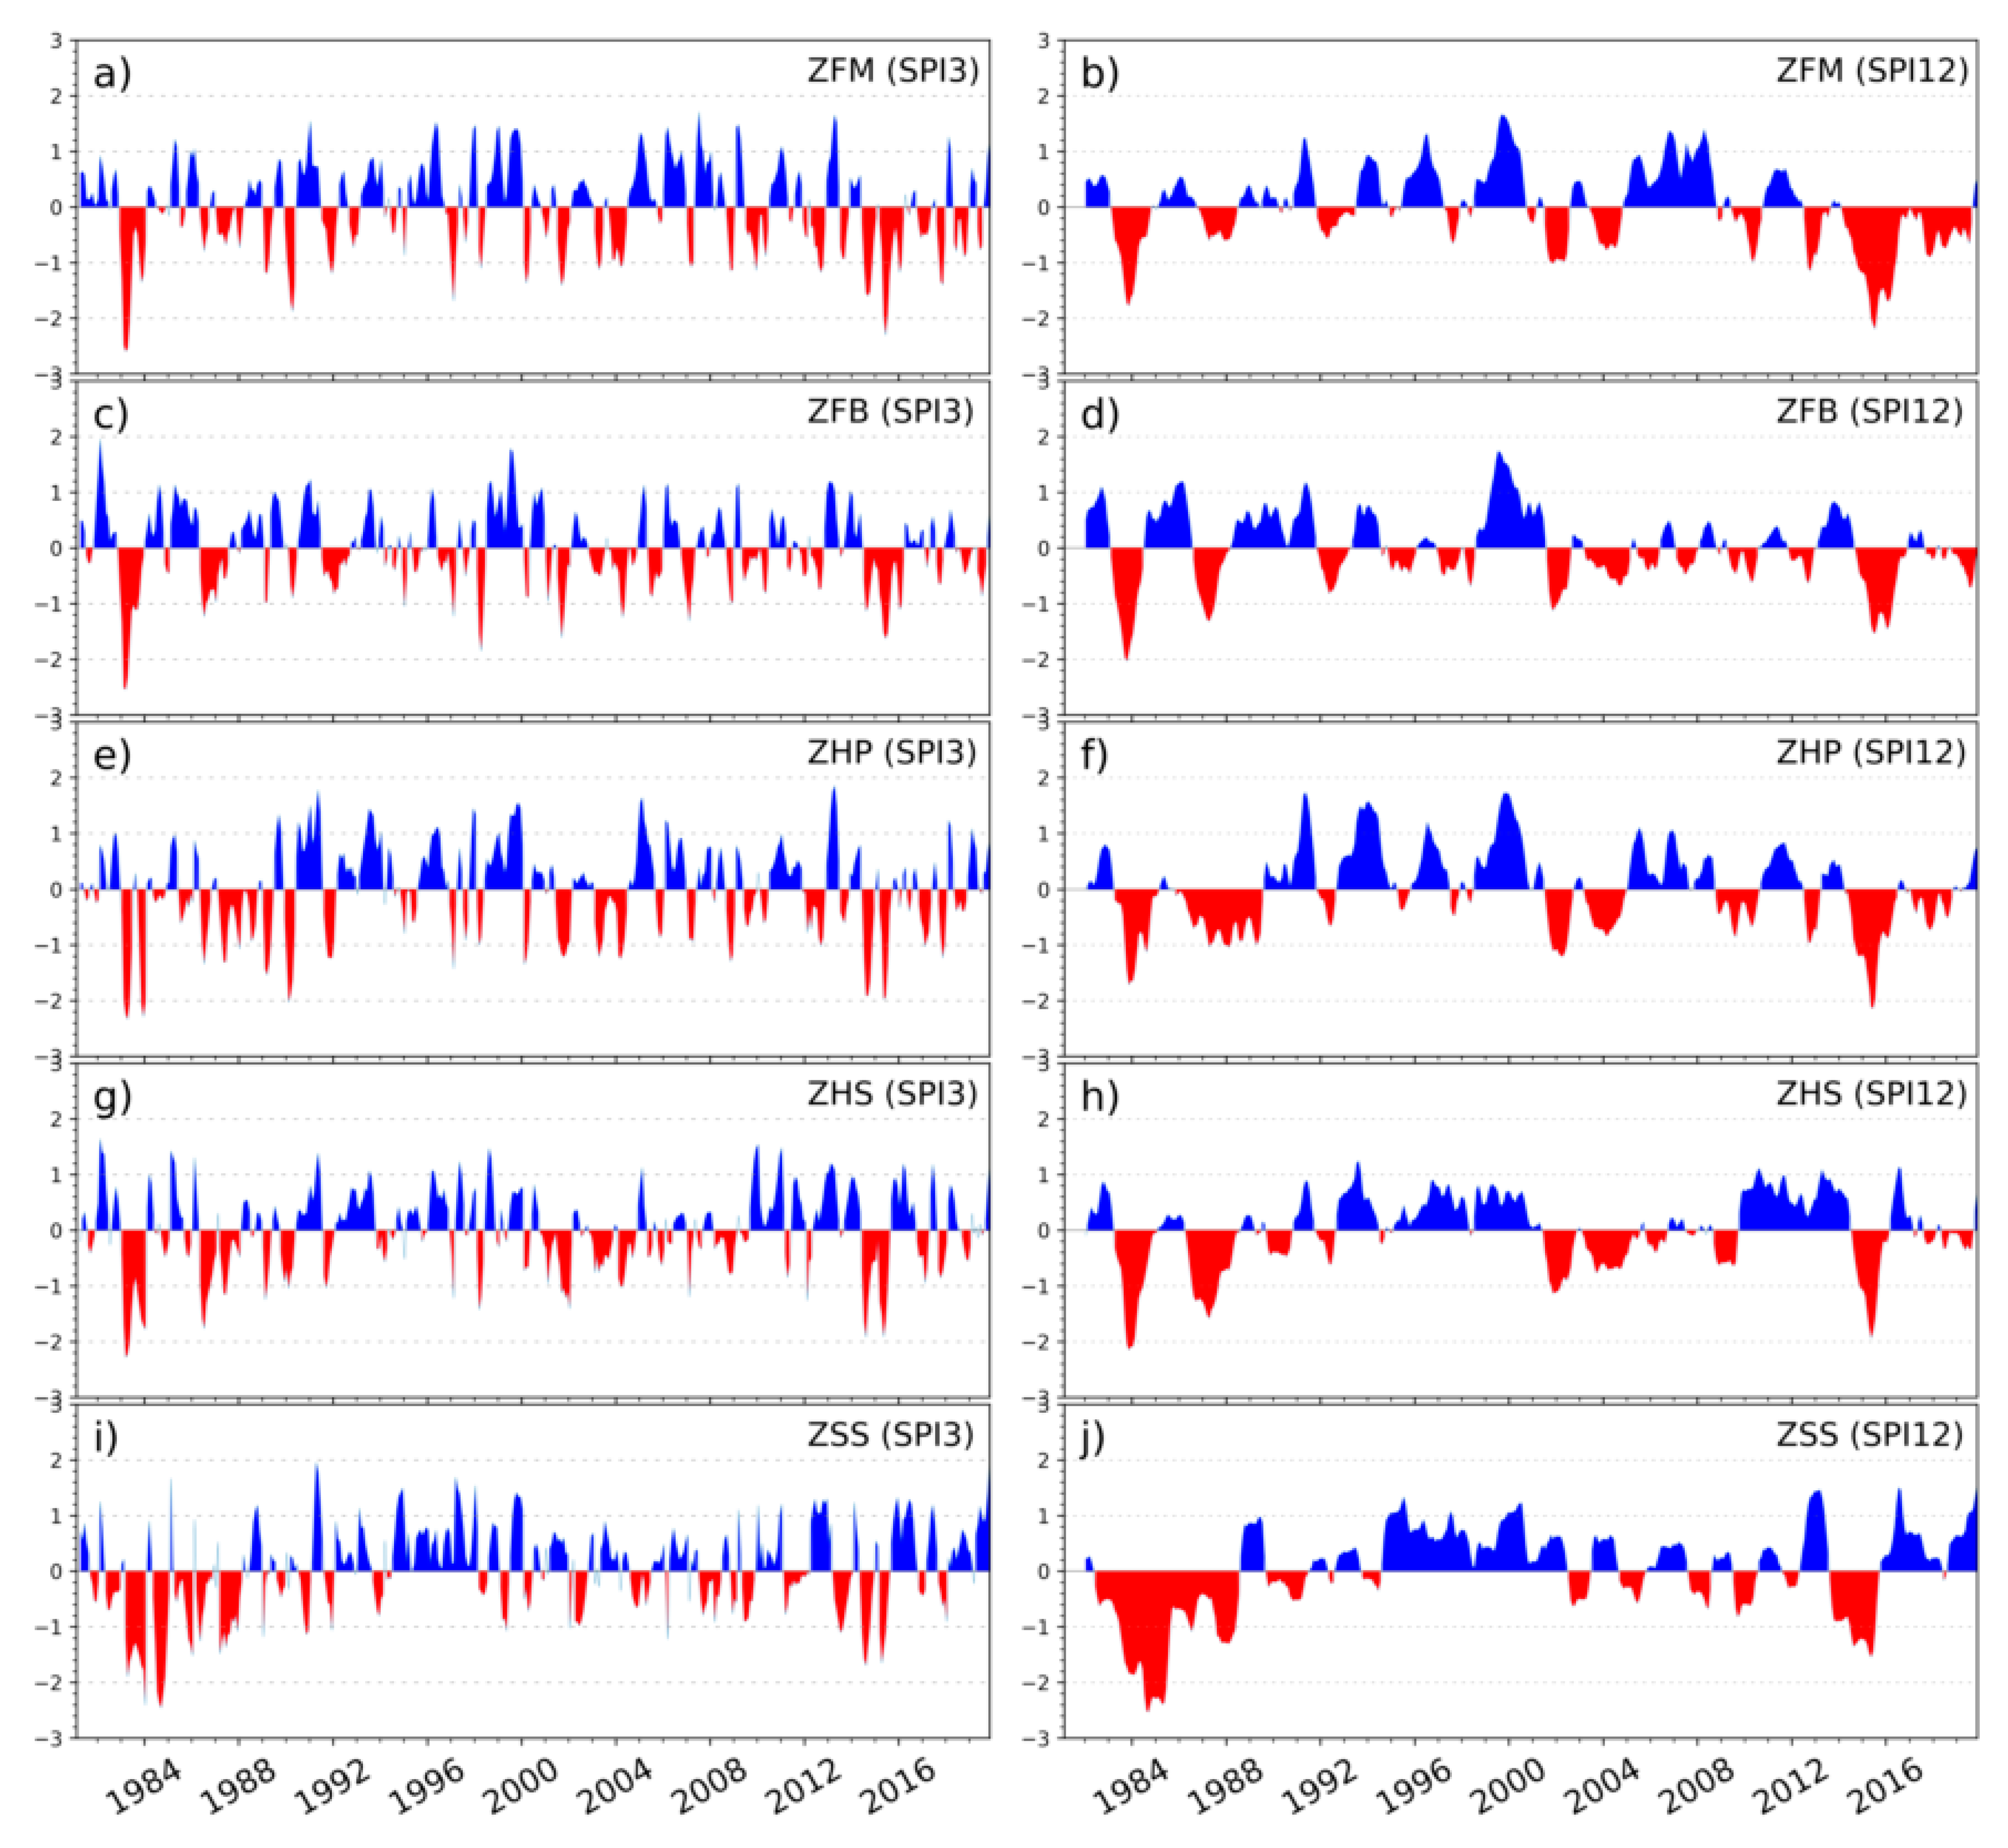
3.4. SPI Time Series

SPI values of 3- and 12-month time scales from 1981 to 2019 at different selected agro-ecological regions of Cameroon are shown in Figure 5. Remarkably dry and wet periods could be consistently represented in both time scales. Data showed the presence of alternative dry and wet periods, but with no regular annual shifts. For example, while the duration of the dry and wet conditions were not very obvious at the 3-month time-scale, analysis based on 12-month showed that the period 1990–2000 witnessed more wet conditions. All drought episodes before 1990 have been previously identified in the semiarid regions, and it has been reported that their impacts were catastrophic, with severe agriculture losses and water scarcity [14]. This analysis shows spatial variations of rainfall and identifies the years associated with climatic phenomenon regulating the interannual variability. In the agro-ecological zone ZSS the longest and most severe droughts were recorded in the 1980s, which resulted in larger impacts on the environmental economy and society, especially in this drought-prone area, thereby causing damage to agriculture and the hydro-environmental system [26]. Wet conditions were depicted in the 1990s. A decrease of the SPI series in the 2010 decade refers to an increase in drought. It is evident that during that period, drought extended throughout the country with various magnitudes. In this study, we consider that droughts are regulated by the temporal fluctuation in precipitation because the variability of precipitation is much higher than that of other variables, such as temperature and potential evapotranspiration. However, temperature rise can greatly influence the harshness of droughts [27]. In the context of global warming, drought indices using multi-scalar and multi-variables should be considered. An experiment by [27] clearly shows an increase in the duration and magnitude of droughts at the end of the century, which is directly related to the temperature increase. Therefore, monitoring drought in the agroecological zones of Cameroon needs different indicators or indices. Drought management plans that are agriculturally important should immediately be prepared for the country. Furthermore, trend analysis of drought is mandatory in the establishment of the preferences for the outlining, design, and build-up of water architecture.

4. Conclusions

In this work, we were interested in the study of the trends and variabilities of extreme precipitation indices over Cameroon using CHIRPS data at 0.05° × 0.05° grid resolution and extending over the 1981–2019 time period. These data showed satisfactory results and agreed, in most cases, with the observational data in East Africa. In addition to the 3- and 12-month SPIs, six other indices defined by ETCCDI were examined (RR1, SDII, R95ptot, CWD, CDD, and RR20). The climatological annual mean of rainfall was first examined to assess the stability of data patterns across the country. Generally, rainfall shows an increased tendency with a maximum positive trend in the northern part of Cameroon, whereas in the south, a predominant decreasing tendency is observed with a maximum negative trend. Next, the analysis of the mean climatologies of the six selected rainfall indices was undertaken. It is observed that the spatial distribution of the number of wet days (RR1) does not strictly follow the pattern of mean annual rainfall and the values are less in the north than in the south. The spatial patterns of the SDII and the R90ptot are very similar, showing a possible link between the two variables. They depict a (south-west/north-east) negative gradient with the highest values recorded near the Atlantic Ocean and the lowest in the northernmost part of the region. Overall, these two indices follow spatio-temporal variability of rainfall. The pattern of mean RR20 is similar to R95ptot, but showing less spatial variability. The spatial distribution of CWD mimics that of mean annual rainfall. The increase in rainfall observed over the northern part of Cameroon is mainly the result of the increase in CWD frequency. A negative trend of the index RR1 is observed in the south of the country while there is a positive trend over much of the northern part associated with the decreasing trend of CDD in the north. This can be partially attributed to the partial recovery of rainfall in the Sahel. CWD generally increases in the area with the highest trends in the northernmost (near Lake Chad). The spatial patterns of SDII and R95ptot trends show an extension towards the coast, which is favorable for excessive rainfall. SPI values indicate alternative dry and wet periods, but with no regular annual shifts. The period between 1990 and 2000 witnessed more annual wet conditions, and drought episodes in the 1980 decade have been well depicted in the semiarid regions. It can be seen from the results that most of the drought characteristics are the same in agroecological zones of Cameroon, despite the fact that the southern area receives much rainfall compared to the northern parts. Significant droughts have occurred in recent years, for instance, the 2013–2016 severe drought, which was induced by persistent shortages of rainfall during the rainy season, led to critical electricity shortages in many parts of Cameroon. Given the general tendency towards dry conditions found in this work, an action by stakeholders is needed for preventing water scarcity.

Author Contributions

Conceptualization, D.A.V., P.H.K.-T.; methodology, D.A.V., P.H.K.-T.; formal analysis, D.A.V., P.H.K.-T., G.M.G.; writing—original draft preparation, D.A.V.; writing—review and editing, D.A.V., T.L.A.D., G.M.G., P.H.K.-T. All authors have read and agreed to the published version of the manuscript.

Funding

This research received no external funding.

Institutional Review Board Statement

Not applicable.

Informed Consent Statement

Not applicable.

Data Availability Statement

Not applicable.

Acknowledgments

The authors thank editor for obtaining a waiver of the publication fee in the journal. We also thank the anonymous reviewers for their constructive remarks that greatly improved the manuscript.

Conflicts of Interest

The authors declare no conflict of interest.

References

  1. Nonki, R.M.; Lenouo, A.; Lennard, C.J.; Tchawoua, C. Assessing Climate Change Impacts on Water Resources in the Benue River Basin, Northern Cameroon. Environ. Earth Sci. 2019, 78. [Google Scholar] [CrossRef]
  2. Penlap, E.; Matulla, C.; von Storch, H.; Kamga, F. Downscaling of GCM Scenarios to Assess Precipitation Changes in the Little Rainy Season (March–June) in Cameroon. Clim. Res. 2004, 26, 85–96. [Google Scholar] [CrossRef] [Green Version]
  3. Tanessong, R.S.; Vondou, D.A.; Djomou, Z.Y.; Igri, P.M. WRF High Resolution Simulation of an Extreme Rainfall Event over Douala (Cameroon): A Case Study. Modeling Earth Syst. Environ. 2017, 3, 927–942. [Google Scholar] [CrossRef]
  4. Igri, P.M.; Tanessong, R.S.; Vondou, D.A.; Panda, J.; Garba, A.; Mkankam, F.K.; Kamga, A. Assessing the Performance of WRF Model in Predicting High-Impact Weather Conditions over Central and Western Africa: An Ensemble-Based Approach. Nat. Hazards 2018, 93, 1565–1587. [Google Scholar] [CrossRef]
  5. Guenang, G.M.; Mkankam Kamga, F. Onset, Retreat and Length of the Rainy Season over Cameroon. Atmos. Sci. Lett. 2012, 13, 120–127. [Google Scholar] [CrossRef]
  6. Vondou, D.A.; Haensler, A. Evaluation of Simulations with the Regional Climate Model REMO over Central Africa and the Effect of Increased Spatial Resolution. Int. J. Climatol. 2017, 37, 741–760. [Google Scholar] [CrossRef]
  7. Fotso-Nguemo, T.C.; Diallo, I.; Diakhaté, M.; Vondou, D.A.; Mbaye, M.L.; Haensler, A.; Gaye, A.T.; Tchawoua, C. Projected Changes in the Seasonal Cycle of Extreme Rainfall Events from CORDEX Simulations over Central Africa. Clim. Chang. 2019, 155, 339–357. [Google Scholar] [CrossRef]
  8. Mboka, J.M.; Kouna, S.B.; Chouto, S.; Djuidje, F.K.; Nguy, E.B.; Fotso-Kamga, G.; Matsaguim, C.N.; Fotso-Nguemo, T.C.; Nghonda, J.P.; Vondou, D.A.; et al. Simulated Impact of Global Warming on Extreme Rainfall Events over Cameroon during the 21st Century. Weather 2020. [Google Scholar] [CrossRef]
  9. Aguilar, E.; Aziz Barry, A.; Brunet, M.; Ekang, L.; Fernandes, A.; Massoukina, M.; Mbah, J.; Mhanda, A.; do Nascimento, D.J.; Peterson, T.C.; et al. Changes in Temperature and Precipitation Extremes in Western Central Africa, Guinea Conakry, and Zimbabwe, 1955–2006. J. Geophys. Res. 2009, 114, 1–11. [Google Scholar] [CrossRef]
  10. Molua, E. Climatic Trends in Cameroon: Implications for Agricultural Management. Clim. Res. 2006, 30, 255–262. [Google Scholar] [CrossRef] [Green Version]
  11. Funk, C.; Peterson, P.; Landsfeld, M.; Pedreros, D.; Verdin, J.; Shukla, S.; Husak, G.; Rowland, J.; Harrison, L.; Hoell, A.; et al. The Climate Hazards Infrared Precipitation with Stations—A New Environmental Record for Monitoring Extremes. Sci. Data 2015, 2, 1–21. [Google Scholar] [CrossRef] [Green Version]
  12. Funk, C.; Peterson, P.; Peterson, S.; Shukla, S.; Davenport, F.; Michaelsen, J.; Knapp, K.R.; Landsfeld, M.; Husak, G.; Harrison, L.; et al. A High-Resolution 1983–2016 Tmax Climate Data Record Based on Infrared Temperatures and Stations by the Climate Hazard Center. J. Clim. 2019, 32, 5639–5658. [Google Scholar] [CrossRef]
  13. Camberlin, P.; Barraud, G.; Bigot, S.; Dewitte, O.; Makanzu Imwangana, F.; Maki Mateso, J.; Martiny, N.; Monsieurs, E.; Moron, V.; Pellarin, T.; et al. Evaluation of Remotely Sensed Rainfall Products over Central Africa. Q. J. R. Meteorol. Soc. 2019, 145, 2115–2138. [Google Scholar] [CrossRef]
  14. Liebmann, B.; Bladé, I.; Funk, C.; Allured, D.; Quan, X.-W.; Hoerling, M.; Hoell, A.; Peterson, P.; Thiaw, W.M. Climatology and Interannual Variability of Boreal Spring Wet Season Precipitation in the Eastern Horn of Africa and Implications for Its Recent Decline. J. Clim. 2017, 30, 3867–3886. [Google Scholar] [CrossRef]
  15. Bichet, A.; Diedhiou, A. Less Frequent and More Intense Rainfall along the Coast of the Gulf of Guinea in West and Central Africa (1981–2014). Clim. Res. 2018, 76, 191–201. [Google Scholar] [CrossRef] [Green Version]
  16. Kpanou, M.; Laux, P.; Brou, T.; Vissin, E.; Camberlin, P.; Roucou, P. Spatial Patterns and Trends of Extreme Rainfall over the Southern Coastal Belt of West Africa. Theor. Appl. Climatol. 2020, 143, 473–487. [Google Scholar] [CrossRef]
  17. Toté, C.; Patricio, D.; Boogaard, H.; van der Wijngaart, R.; Tarnavsky, E.; Funk, C. Evaluation of Satellite Rainfall Estimates for Drought and Flood Monitoring in Mozambique. Remote Sens. 2015, 7, 1758–1776. [Google Scholar] [CrossRef] [Green Version]
  18. Dinku, T.; Funk, C.; Peterson, P.; Maidment, R.; Tadesse, T.; Gadain, H.; Ceccato, P. Validation of the CHIRPS Satellite Rainfall Estimates over Eastern Africa. Q. J. R. Meteorol. Soc. 2018, 144, 292–312. [Google Scholar] [CrossRef] [Green Version]
  19. Zhang, X.; Alexander, L.; Hegerl, G.C.; Jones, P.; Tank, A.K.; Peterson, T.C.; Trewin, B.; Zwiers, F.W. Indices for Monitoring Changes in Extremes Based on Daily Temperature and Precipitation Data. WIREs Clim. Chang. 2011, 2, 851–870. [Google Scholar] [CrossRef]
  20. Guenang, G.M.; Kamga, F.M. Computation of the Standardized Precipitation Index (SPI) and Its Use to Assess Drought Occurrences in Cameroon over Recent Decades. J. Appl. Meteorol. Climatol. 2014, 53, 2310–2324. [Google Scholar] [CrossRef]
  21. Guenang, G.M.; Komkoua, M.A.J.; Pokam, M.W.; Tanessong, R.S.; Tchakoutio, S.A.; Vondou, A.; Tamoffo, A.T.; Djiotang, L.; Yepdo, Z.; Mkankam, K.F. Sensitivity of SPI to Distribution Functions and Correlation Between Its Values at Different Time Scales in Central Africa. Earth Syst. Environ. 2019, 3, 203–214. [Google Scholar] [CrossRef]
  22. Musonda, B.; Jing, Y.; Iyakaremye, V.; Ojara, M. Analysis of Long-Term Variations of Drought Characteristics Using Standardized Precipitation Index over Zambia. Atmosphere 2020, 11, 1268. [Google Scholar] [CrossRef]
  23. Sen, P.K. Estimates of the Regression Coefficient Based on Kendall’s Tau. J. Am. Stat. Assoc. 1968, 63, 1379–1389. [Google Scholar] [CrossRef]
  24. Nicholson, S.E.; Fink, A.H.; Funk, C. Assessing Recovery and Change in West Africa’s Rainfall Regime from a 161-Year Record. Int. J. Climatol. 2018, 38, 3770–3786. [Google Scholar] [CrossRef]
  25. Biasutti, M. Rainfall Trends in the African Sahel: Characteristics, Processes, and Causes. WIREs Clim. Chang. 2019, 10, e591. [Google Scholar] [CrossRef] [Green Version]
  26. Njouenwet, I.; Vondou, D.A.; Fita Dassou, E.; Ayugi, B.O.; Nouayou, R. Assessment of Agricultural Drought during Crop-Growing Season in the Sudano–Sahelian Region of Cameroon. Nat. Hazards 2021, 106, 561–577. [Google Scholar] [CrossRef]
  27. Ajayi, V.O.; Ilori, O.W. Projected Drought Events over West Africa Using RCA4 Regional Climate Model. Earth Syst. Environ. 2020, 4, 329–348. [Google Scholar] [CrossRef]
Figure 1. Topography and five agro-climatological consistent regions within Cameroon: the soudano-sahelian zone (ZSS), the high savannah zone (ZHS), the western highlands zone (ZHP), the dense humid forests zone with monomodal rainfall (ZFM), and the dense humid forests zone with bimodal rainfall (ZFB).
Sustainability 13 06803 g001
Figure 2. Climatological mean annual precipitation in Cameroon Calculated from (a) CHIRPS data (1981–2019); (b) trend and (c) standard deviation. The black dots indicate the trends are above the 5% significant level.
Sustainability 13 06803 g002
Figure 3. Mean climatology of frequency indices for the period of 1981–2019 over Cameroon. (a) wet days (RR1); (b) simple daily intensity index (SDII); (c) annual total precipitation from days greater than 95th percentile (R95ptot); (d) maximum number of consecutive wet days (CWD); (e) maximum number of consecutive dry days (CDD); (f) number of very heavy rainfall (RR20).
Sustainability 13 06803 g003
Figure 4. Linear trends on extreme precipitation indicator (per year) of intensity indices for the period of 1981–2019 over Cameroon. (a) wet days (RR1); (b) simple daily intensity index (SDII); (c) annual total precipitation from days greater than 95th percentile (R95ptot); (d) maximum number of consecutive wet days (CWD); (e) maximum number of consecutive dry days (CDD); (f) number of very heavy rainfall (RR20). The dots denote significant trends greater than 5% level, according to the t-test.
Sustainability 13 06803 g004
Figure 5. Time-series of standardized precipitation index for each homogeneous agro-climatic region of Cameroon. Mean regional SPI values for (a) ZFM, (c) ZFB, (e) ZHP, (g) ZHS, (i) ZSS at 3-month time scale and (b) ZFM, (d) ZFB, (f) ZHP, (h) ZHS, (j) ZSS at 12-month time scale.
Sustainability 13 06803 g005
Table 1. Annual rainfall summary for different agro-ecological zones of Cameroon.
Agro-Ecological RegionMinMaxMeanSTDCV (%)
ZFM2094.82808.22458.6159.15.72
ZFB1427.81856.41640.186.45.27
ZHP1973.32536.32239.1120.65.38
ZHS1339.71712.21604.084.15.23
ZSS650.71083.7885.892.710.47
Table 2. Mann–Kendall and Sen’s tests statistics for annual rainfall over different agro-ecological zones of Cameroon.
Agro-Ecological Regionp-ValueZSlopeTau
ZFM0.25−1.13−0.128−2.527
ZFB0.16−1.37−0.155−1.786
ZHP0.96−0.04−0.006−0.066
ZHS0.410.820.0931.002
ZSS0.091.640.1842.461
Publisher’s Note: MDPI stays neutral with regard to jurisdictional claims in published maps and institutional affiliations.

