
Methodology of Urban Safety and Security Assessment Based on the Overall Risk Management Perspective


Abstract
1. Introduction
- (i)
- How do we conduct a comprehensive safety and security assessment for an urban area with dense hazard-bearing bodies and coupling of multi-hazard risks?
- (ii)
- How do we accurately quantify the risk and capacity of urban areas and scientifically evaluate the safety and security status of urban areas?
2. Assessment Process
2.1. Assessment Idea
- (1)
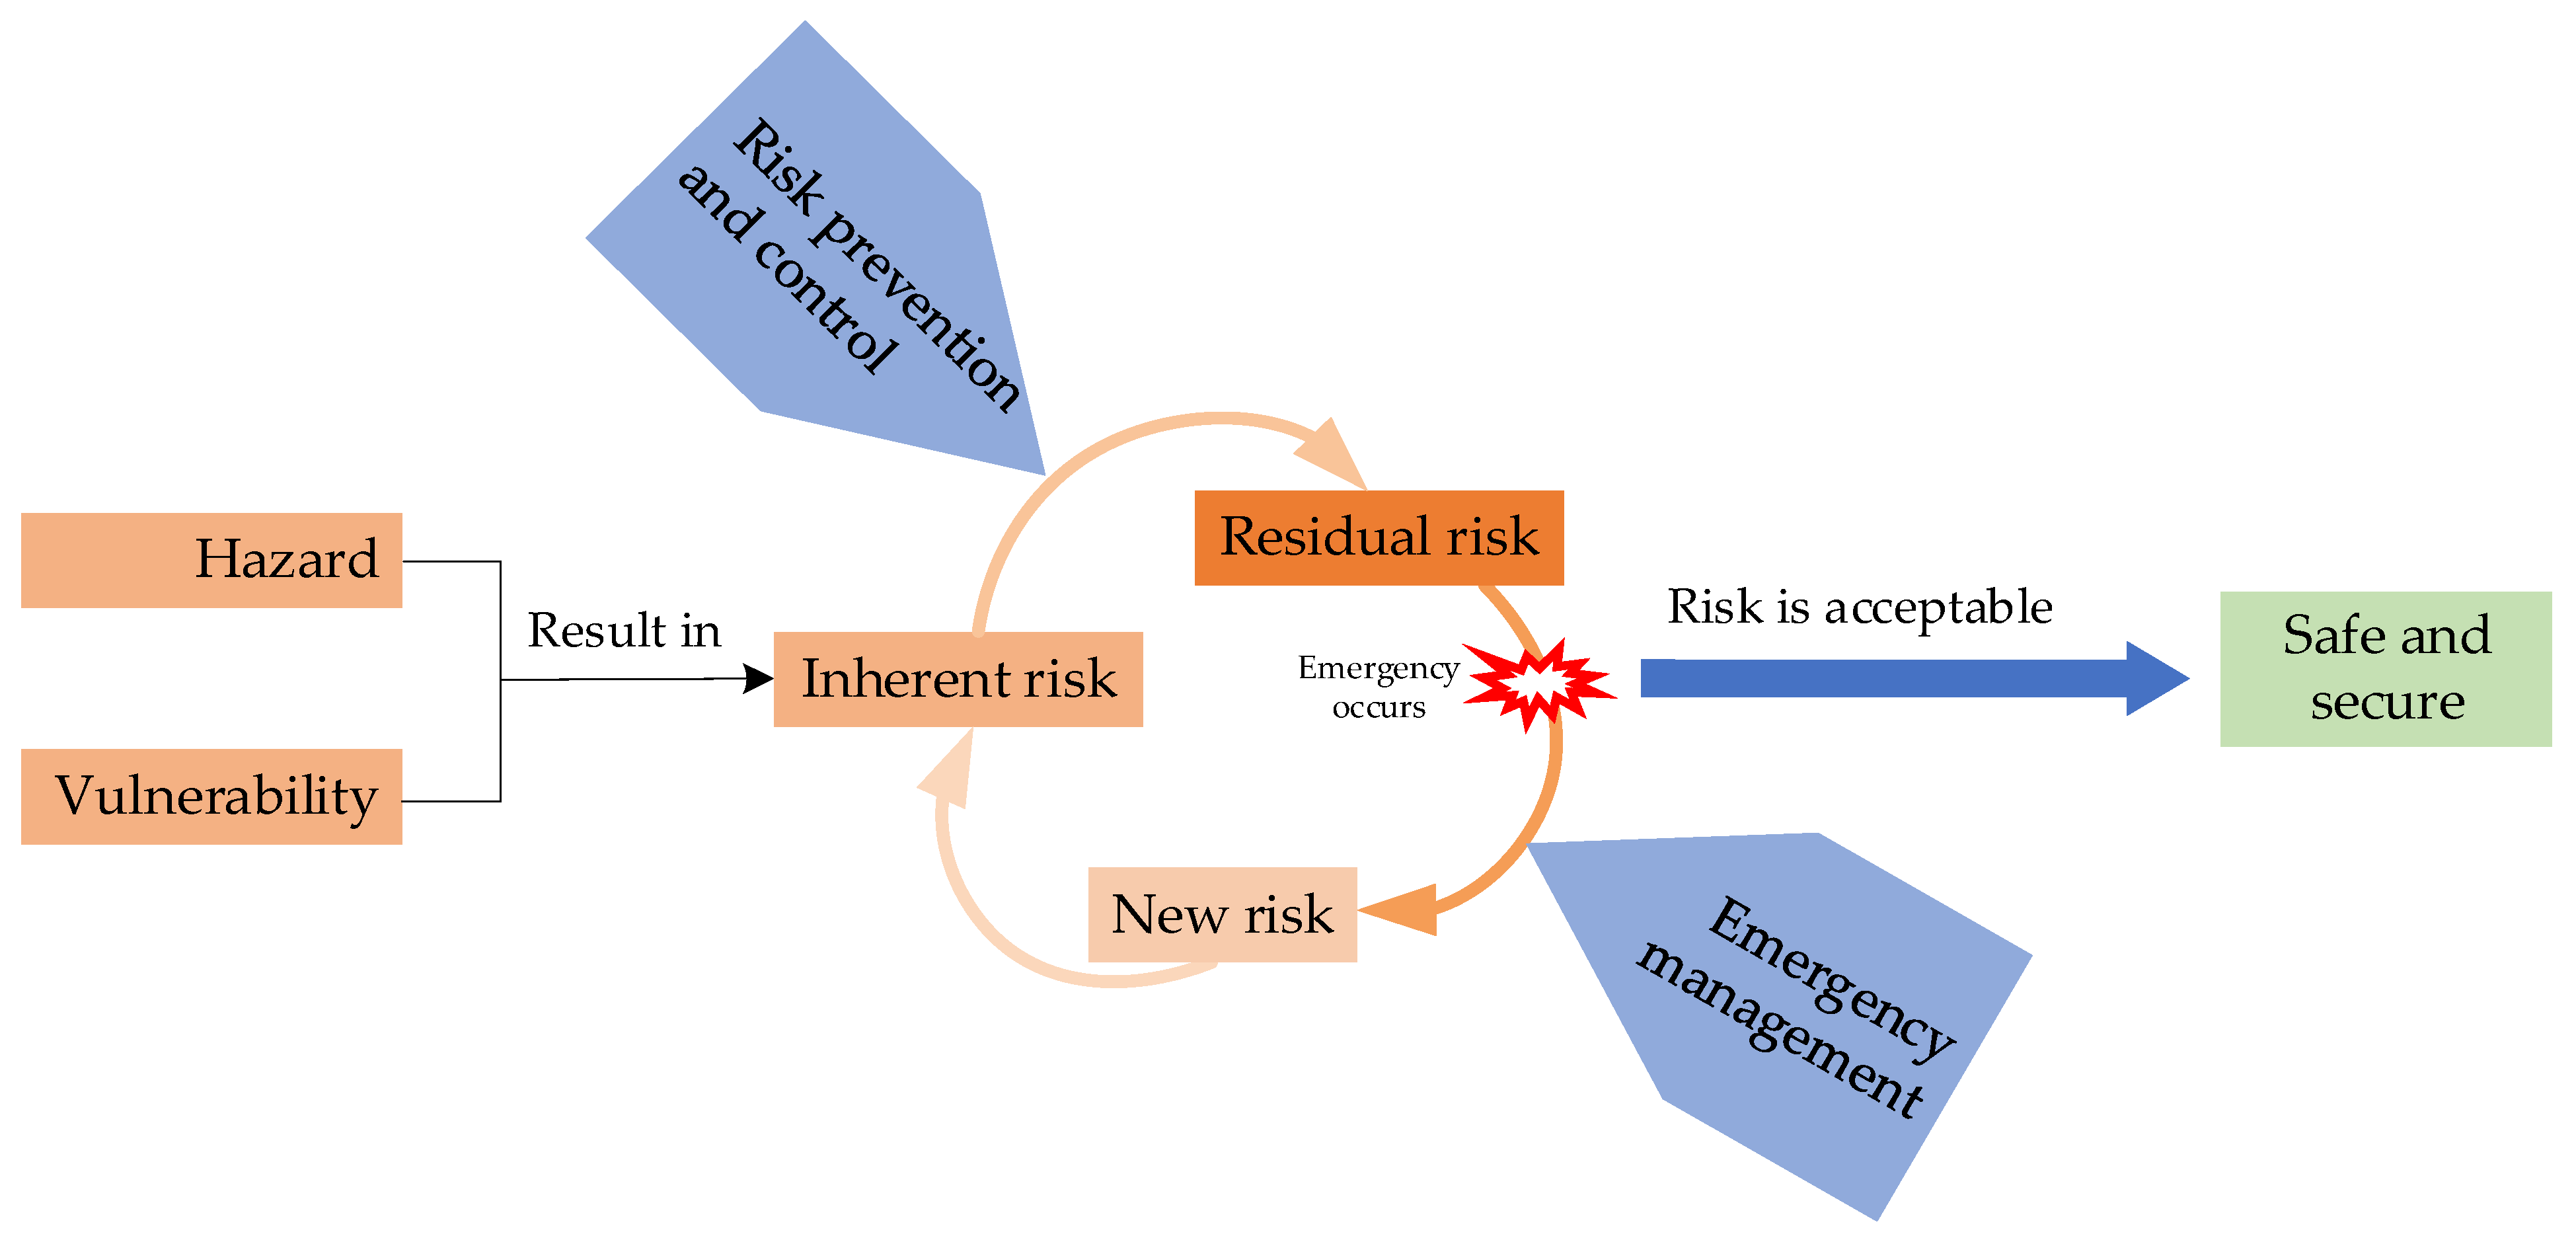
- An overall risk assessment is the basis for the refined and intelligent management of urban safety and security risks. On the one hand, risk assessments should be done for all hazard events, and risks should be managed hierarchically according to risk levels. On the other hand, the degree of control of the risks of a few critical hazard events in an urban area determines its overall safety and security status, and these critical hazard events also need to be screened through overall risk assessment. Meanwhile, the higher the inherent risk of a hazard event, the stricter the urban managers’ prevention and control of such events, thus, the residual risk of events with high inherent risks may not be high. However, strong prevention and control capacity cannot guarantee that high-risk events will not evolve into emergencies. Therefore, critical hazard events should be determined based on the initial hazard and vulnerability (i.e., inherent risks) of hazard events.
- (2)
- Many types of disasters and a large body of hazard sources are involved in urban areas, but the comprehensive risk of the urban area depends on a few critical hazards. Therefore, for regional-level urban safety and security assessment, in-depth analysis of all hazard events is difficult and unnecessary. Critical hazard events are the objects of key analysis in the urban safety and security assessment. The selective analysis of critical hazard events focuses on the post-event, so the selected critical emergency events are the critical hazard events that are screened out. The purpose of key analysis is to develop more effective risk treatments through in-depth study of the evolution process of such events.
- (3)
- Only by an overall analysis of various risk events and an in-depth analysis of critical emergency events can the urban safety and security status of the whole area be described. The realistic threats to urban safety and security come from the transformation of potential risk events into emergency events. Therefore, the impact of specific hazard events on urban safety and security can be measured by the matching level of residual risks and emergency capacities. In addition, the critical hazard events can represent the overall safety and security level. Therefore, by integrating the residual risks and emergency capacities of various critical hazard events, the overall urban safety and security status can be objectively evaluated.
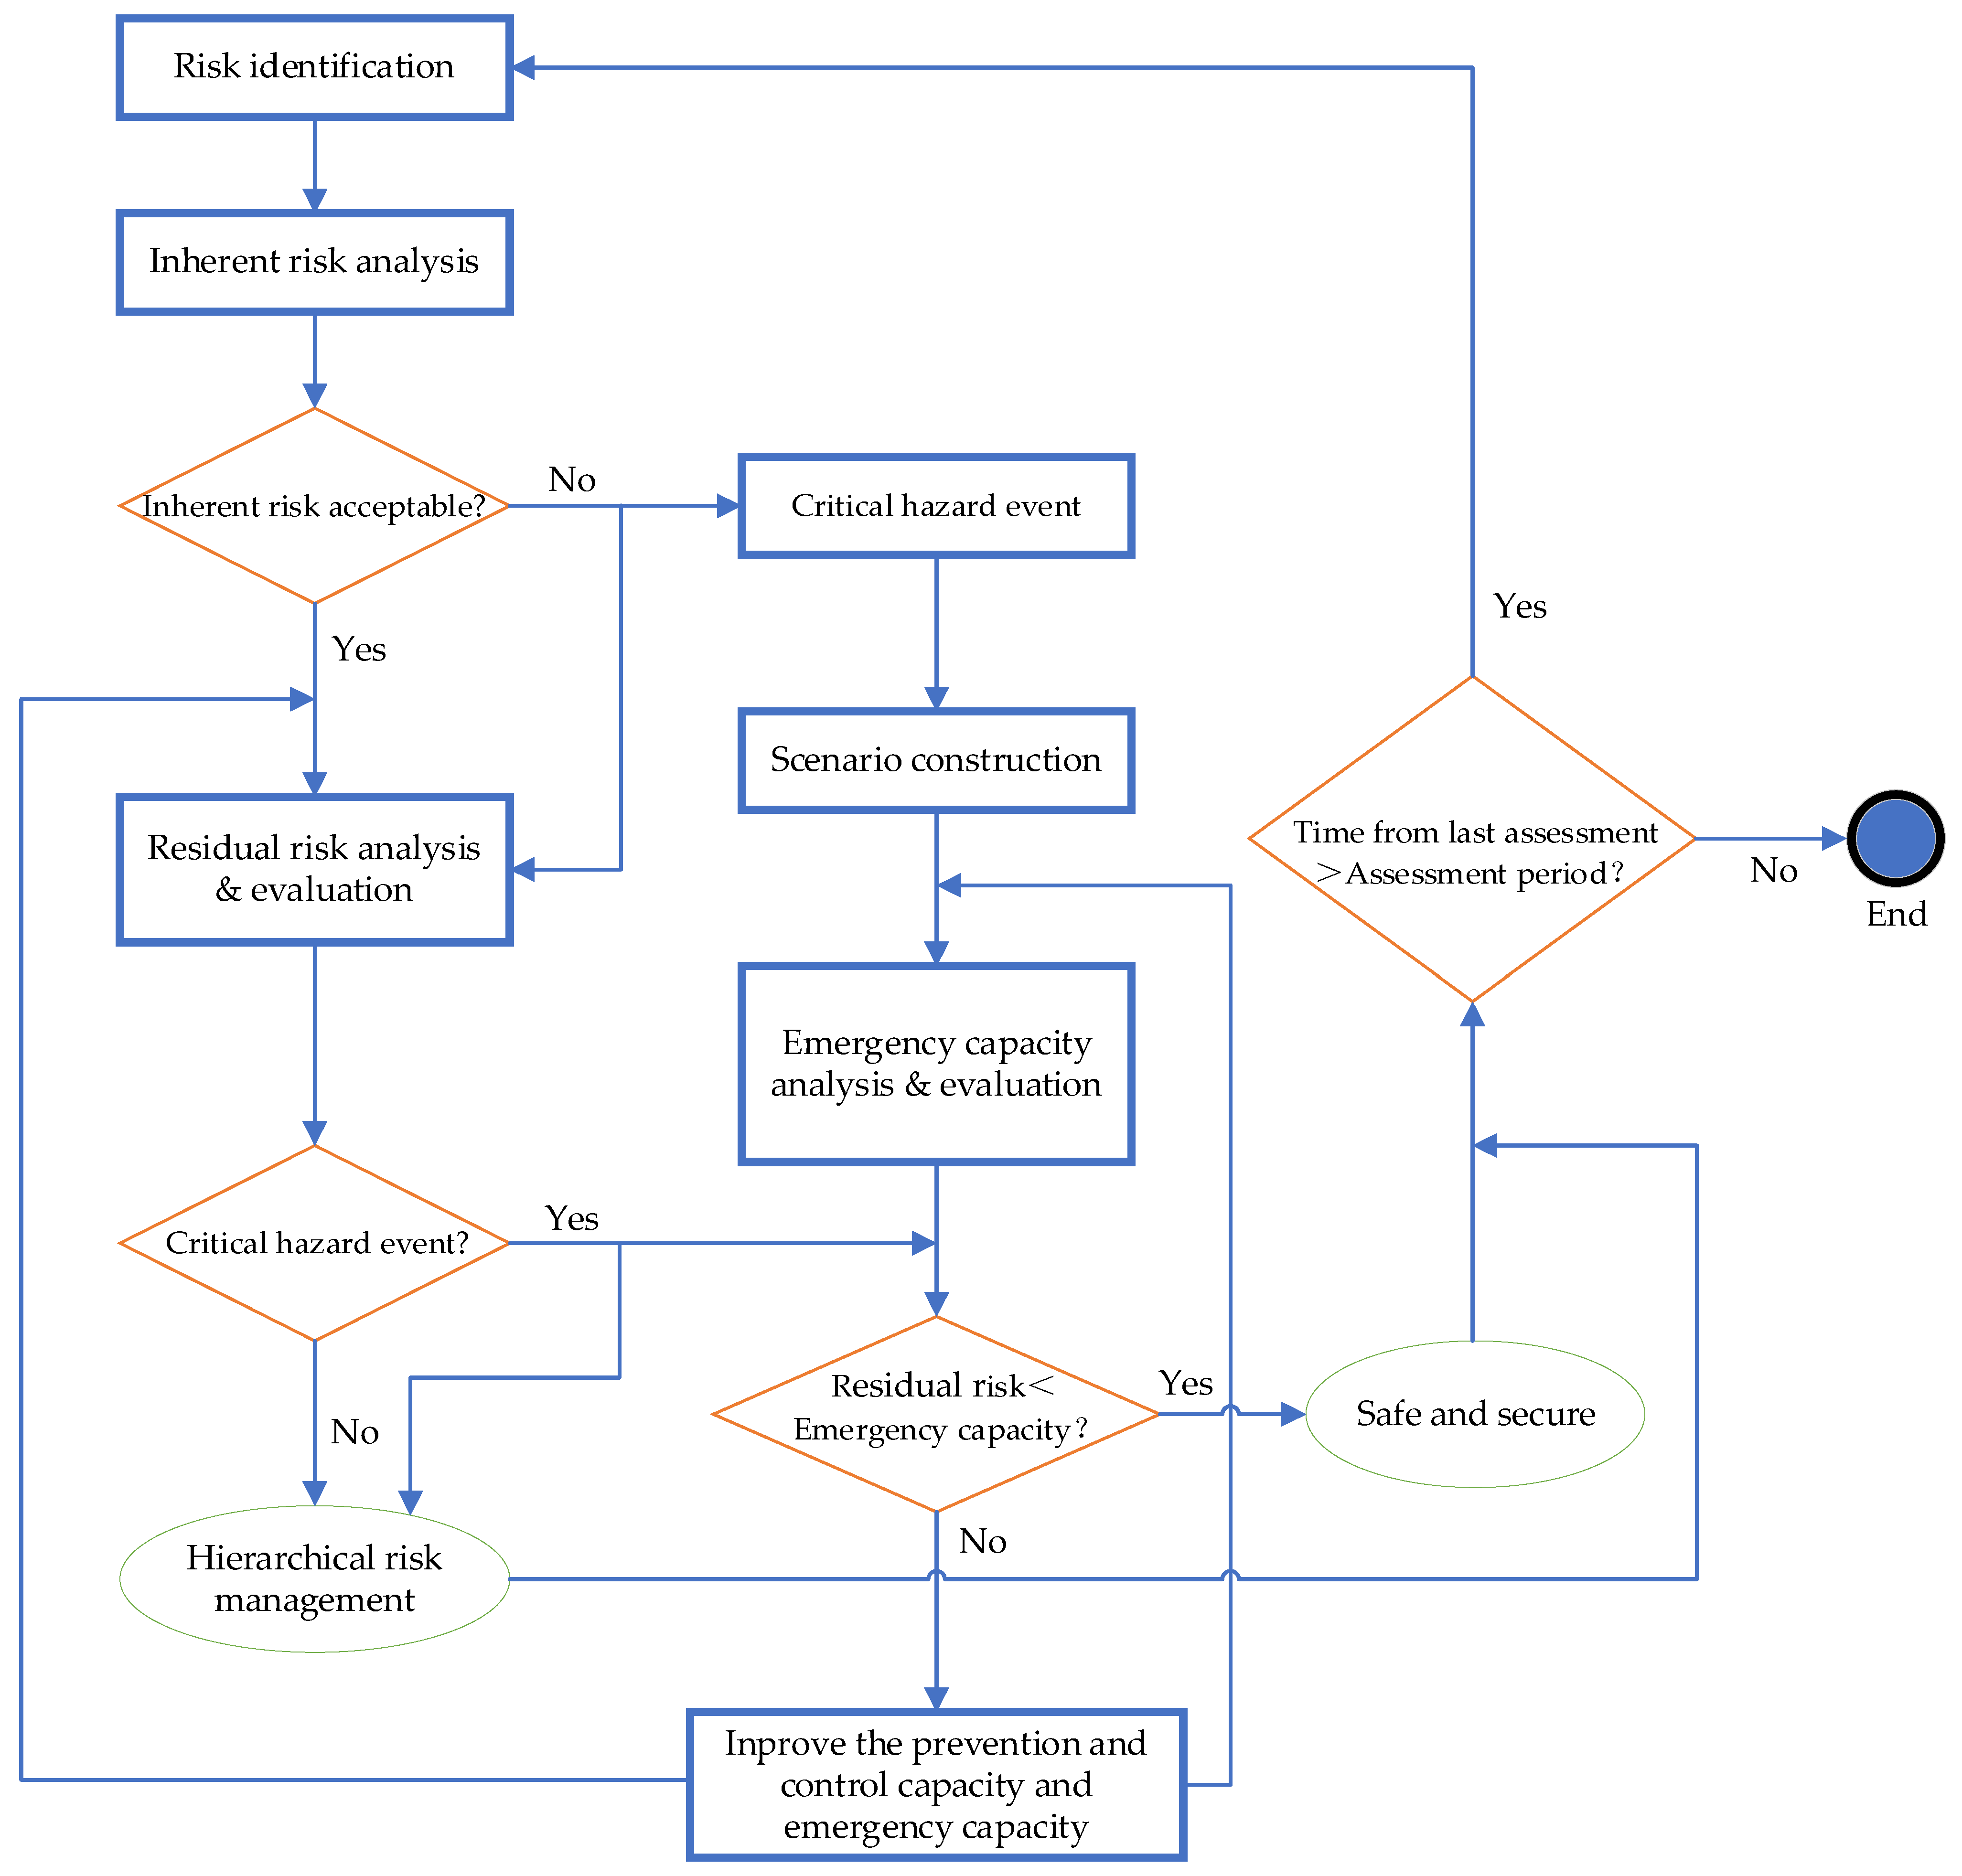
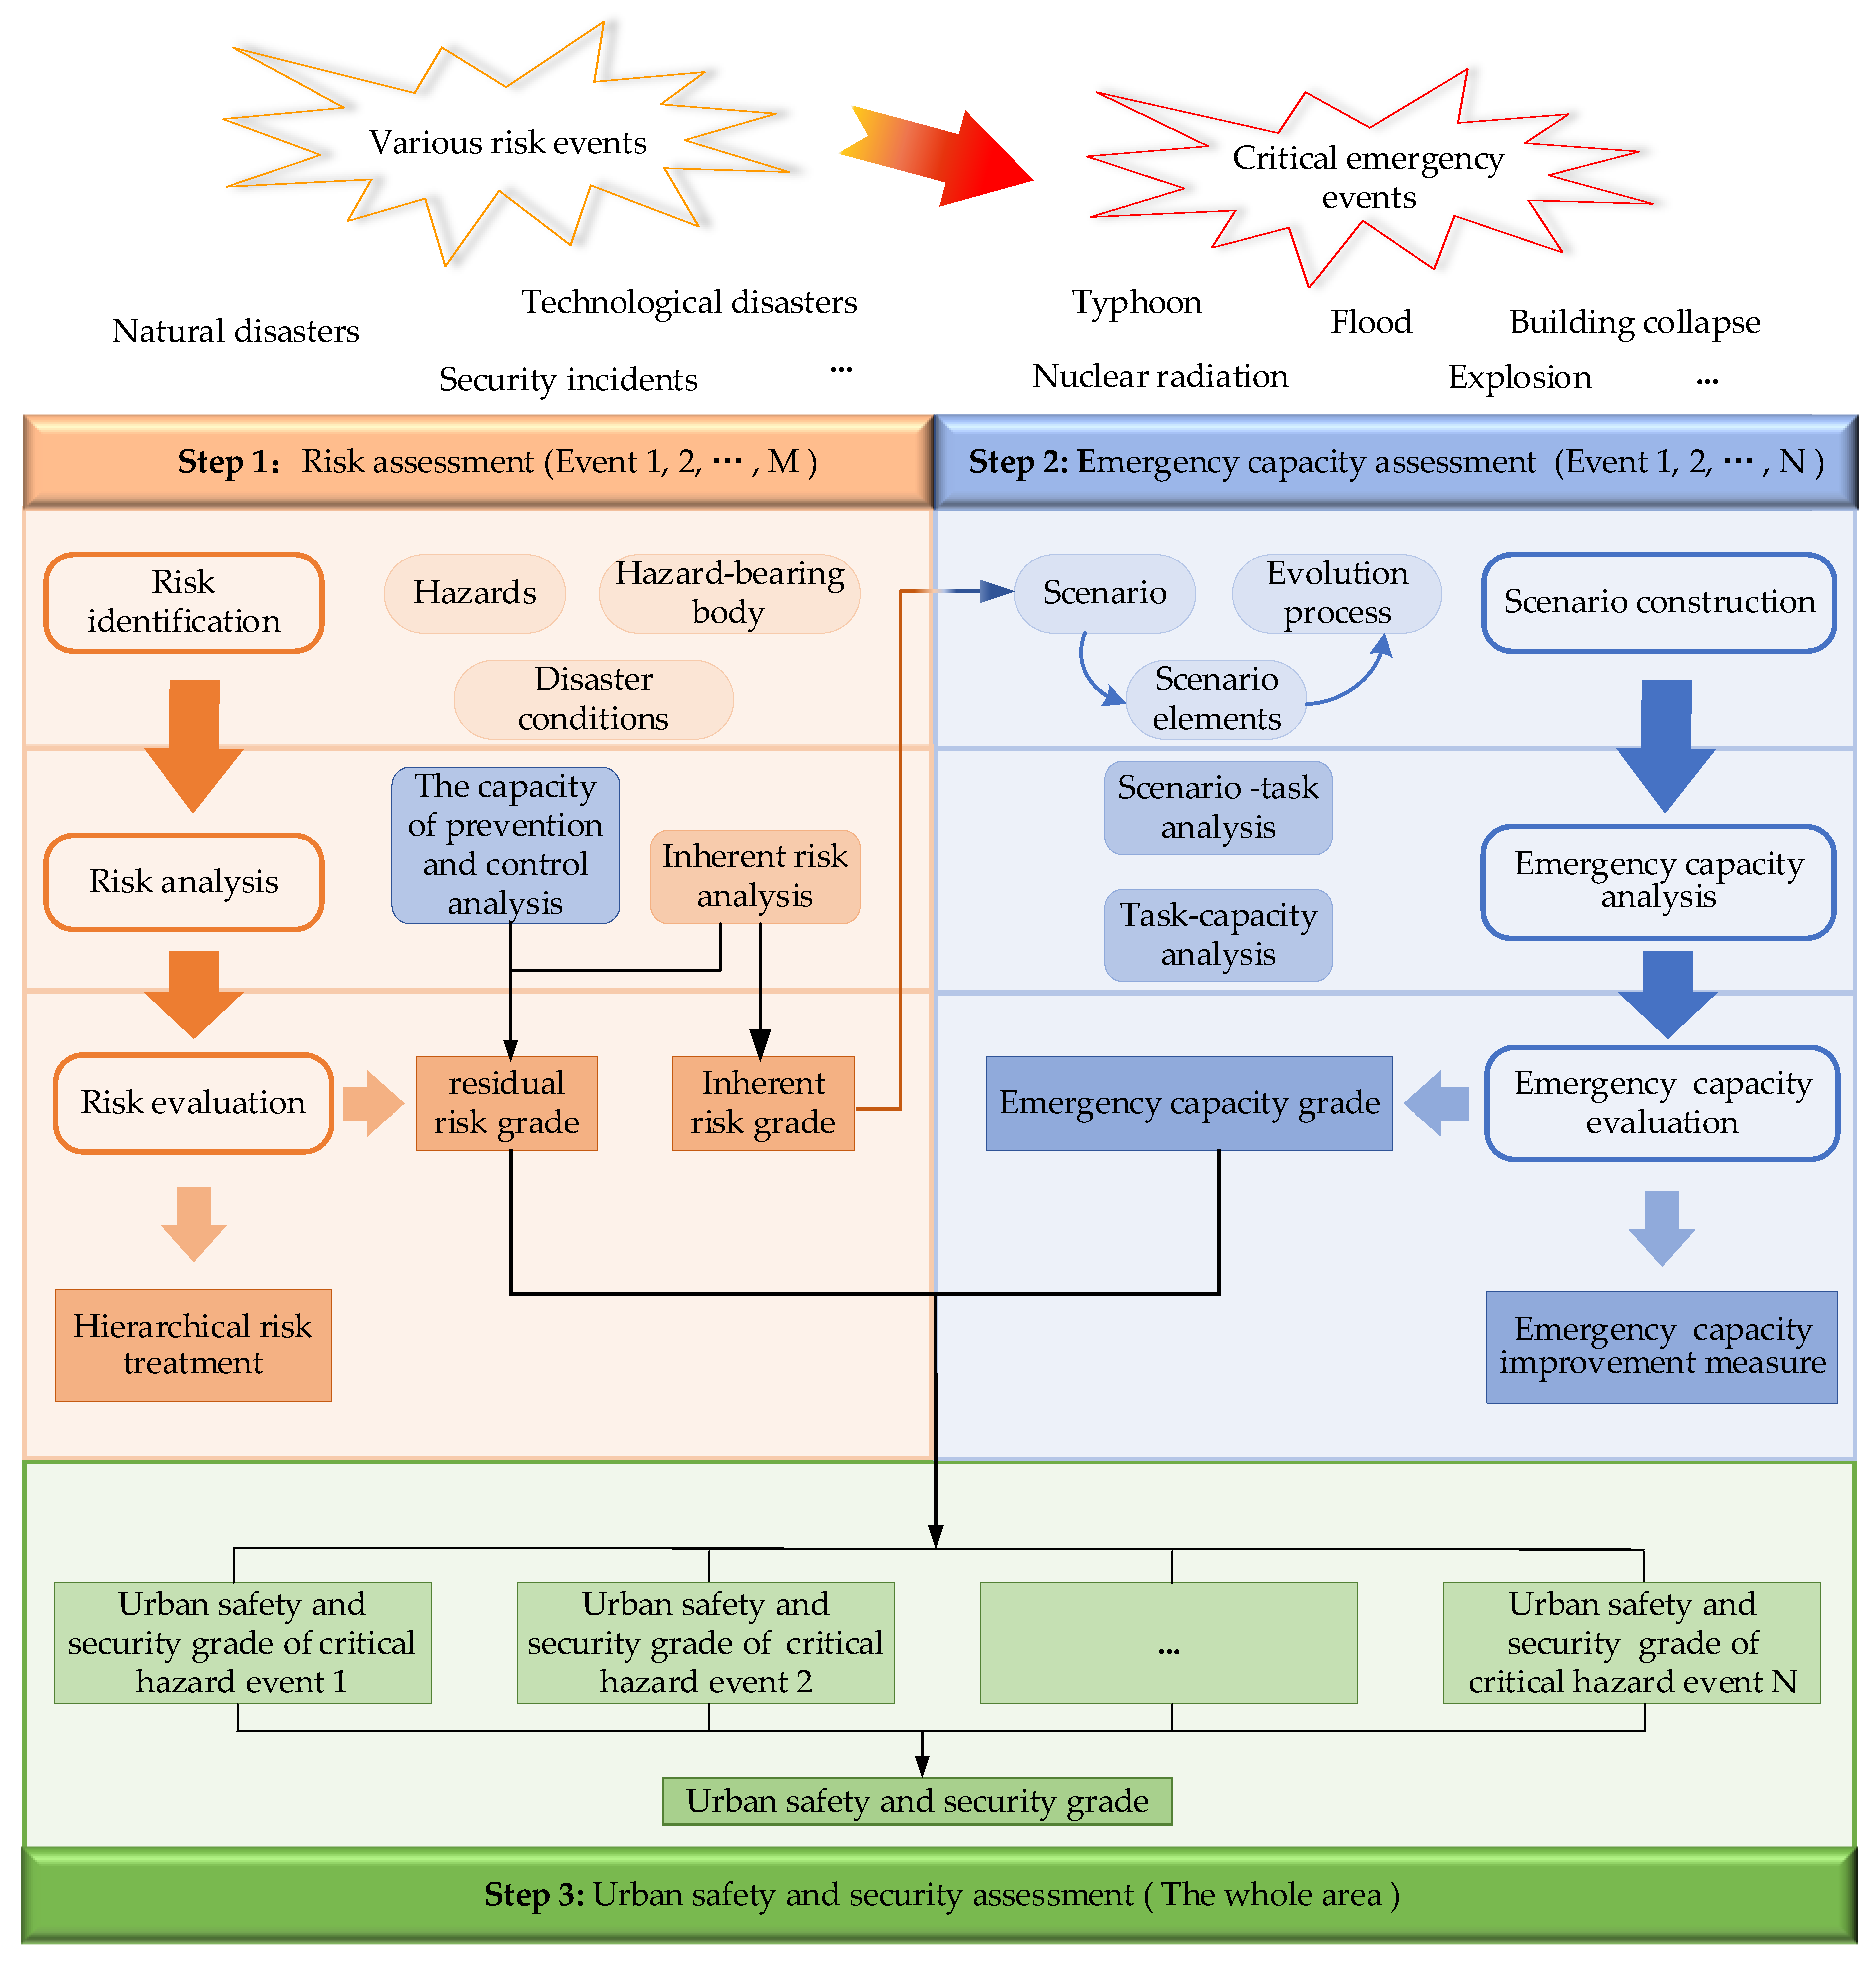
2.2. Specific Process
3. Assessment Methodology
3.1. The Framework of Methodology
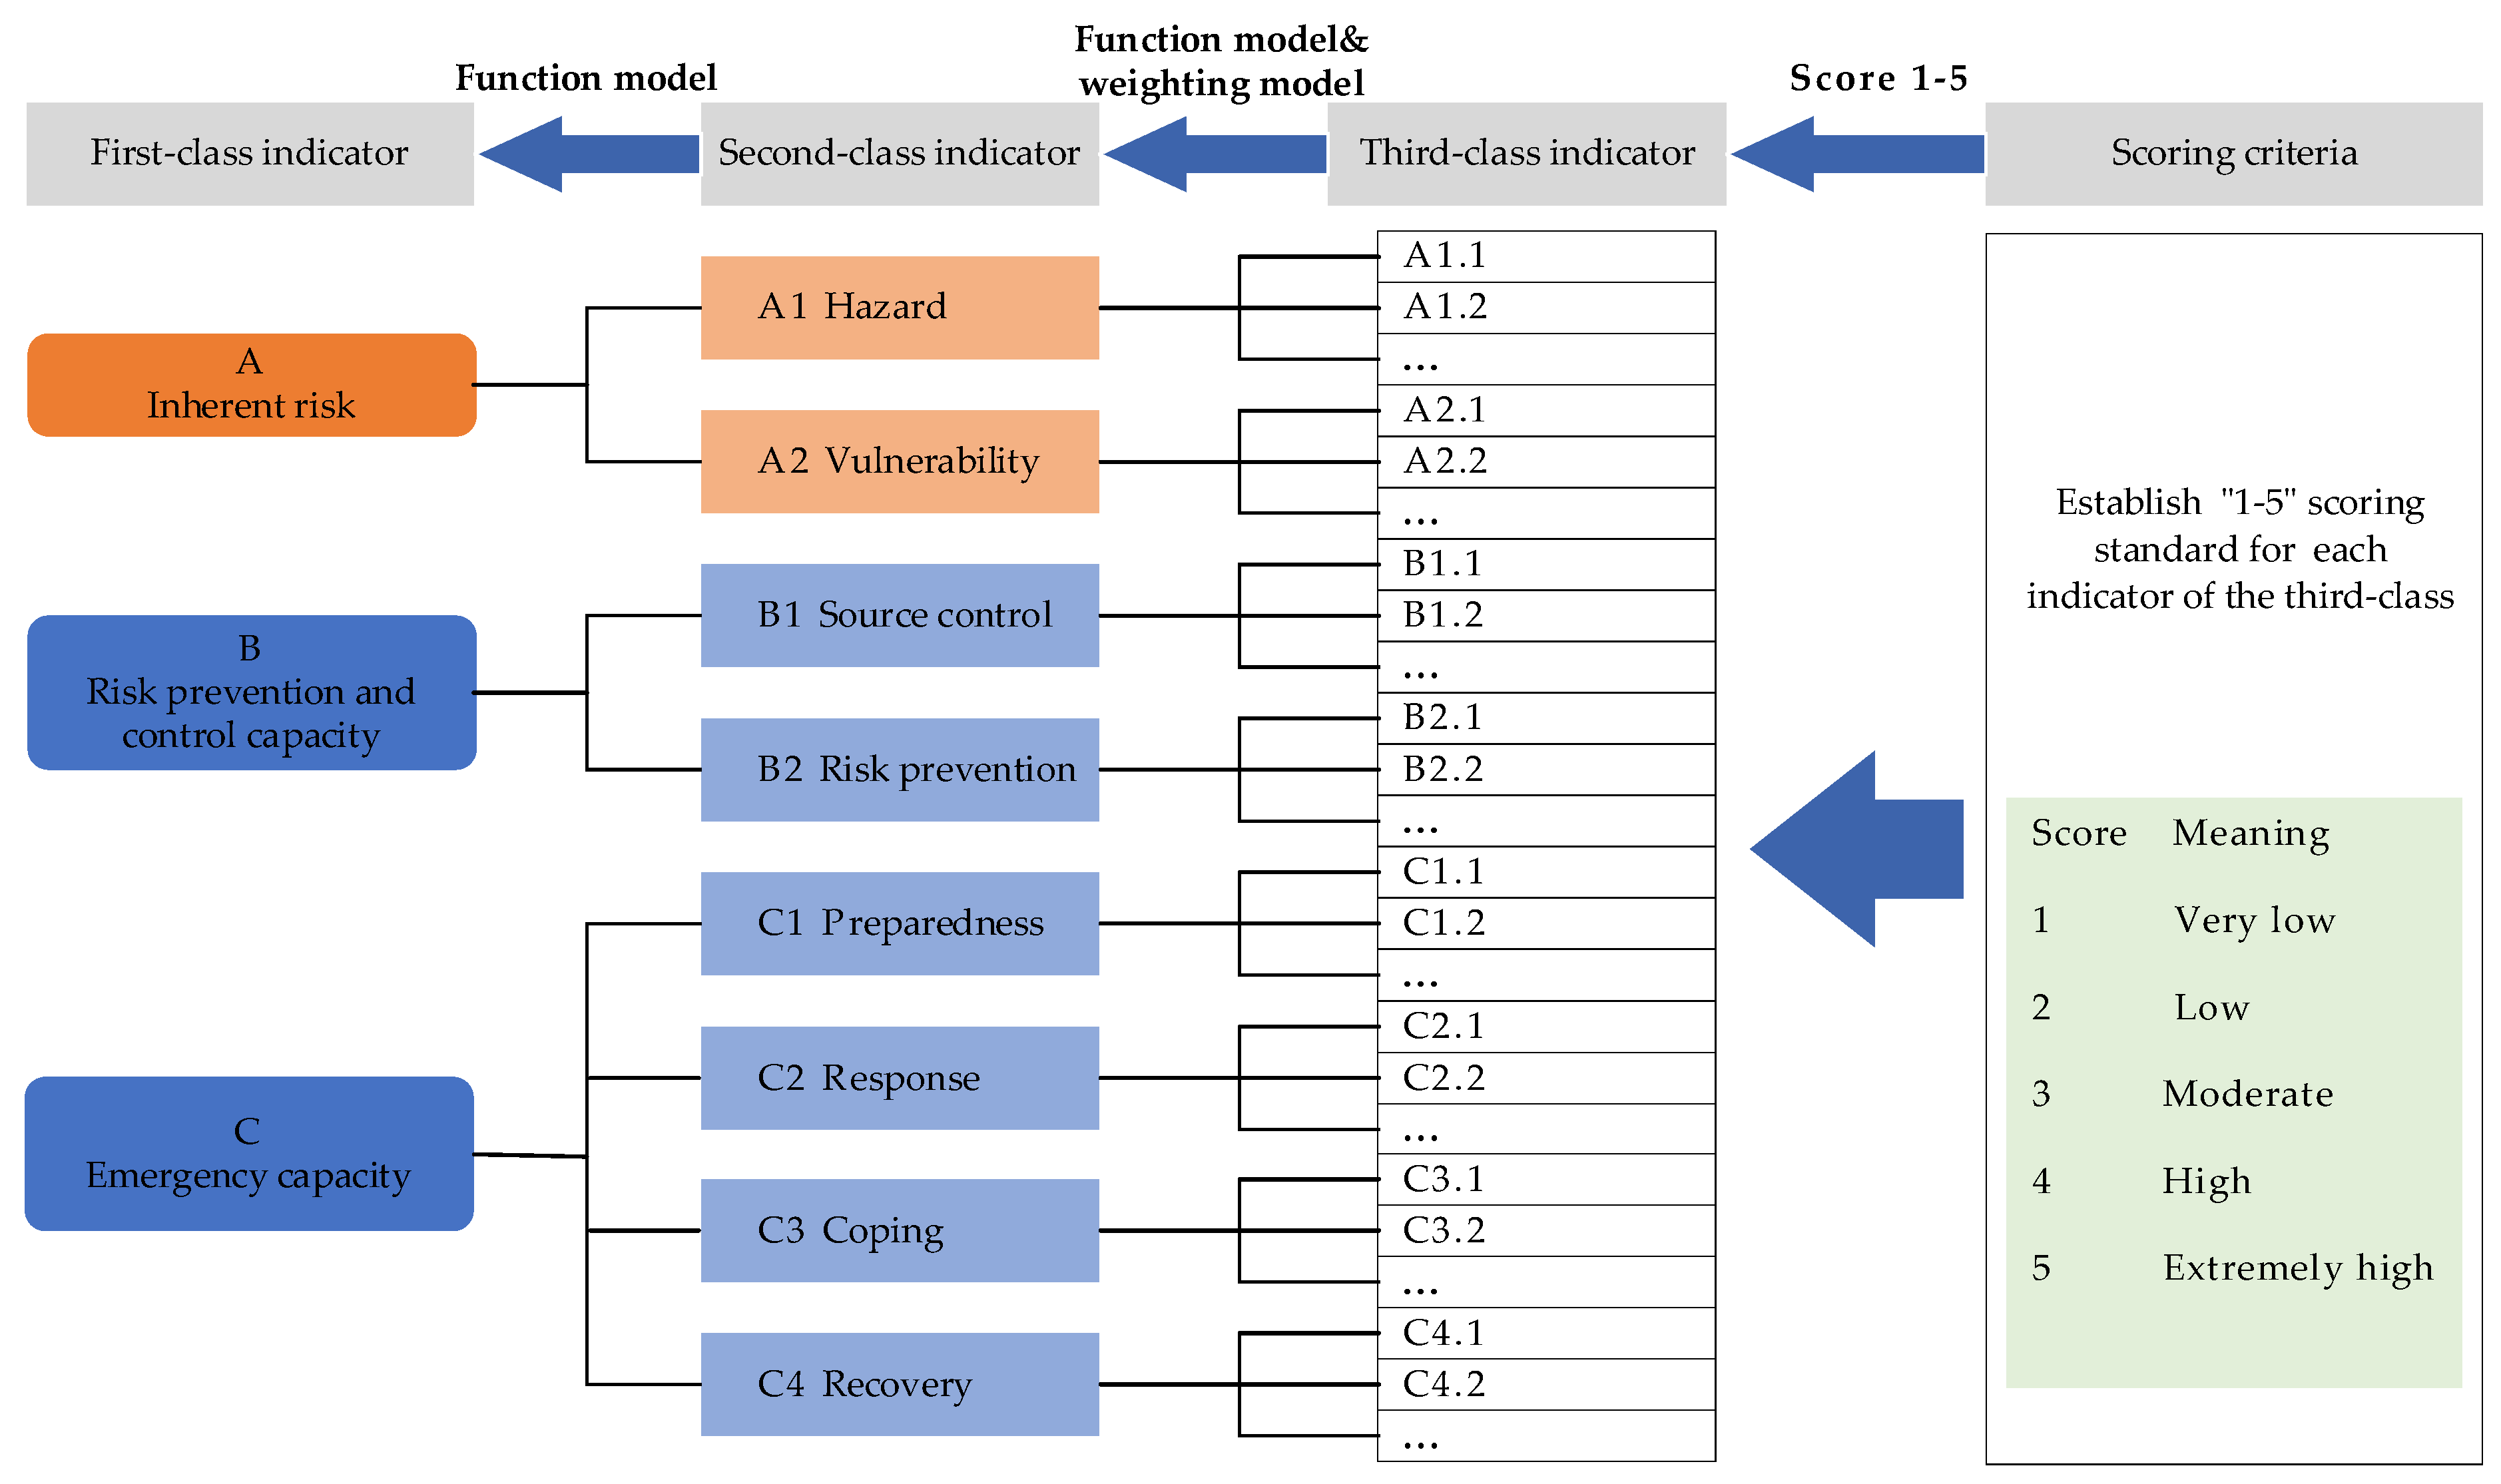
3.2. Weighting Model
3.3. Function Model
3.3.1. Risk Assessment Model for Specific Risk Events
- (1)
- Inherent risk (, )
- (2)
- Residual risk ()
3.3.2. Emergency Capacity Assessment Model for Specific Emergency Events
3.3.3. Urban Safety and Security Assessment Model for the Whole Area
4. Case Study
4.1. Overview of the Investigated Area
4.2. Process
- (1)
- Risk assessment of major risk events
- (i)
- Risk identification
- (ii)
- Risk analysis
- (iii)
- Risk evaluation
- (2)
- Emergency capacity assessment of critical emergency events
- (i)
- Scenario construction
- (ii)
- Emergency capacity analysis
- (iii)
- Emergency capacity evaluation
- (3)
- Urban safety and security assessment of the whole area
4.3. Results
- (1)
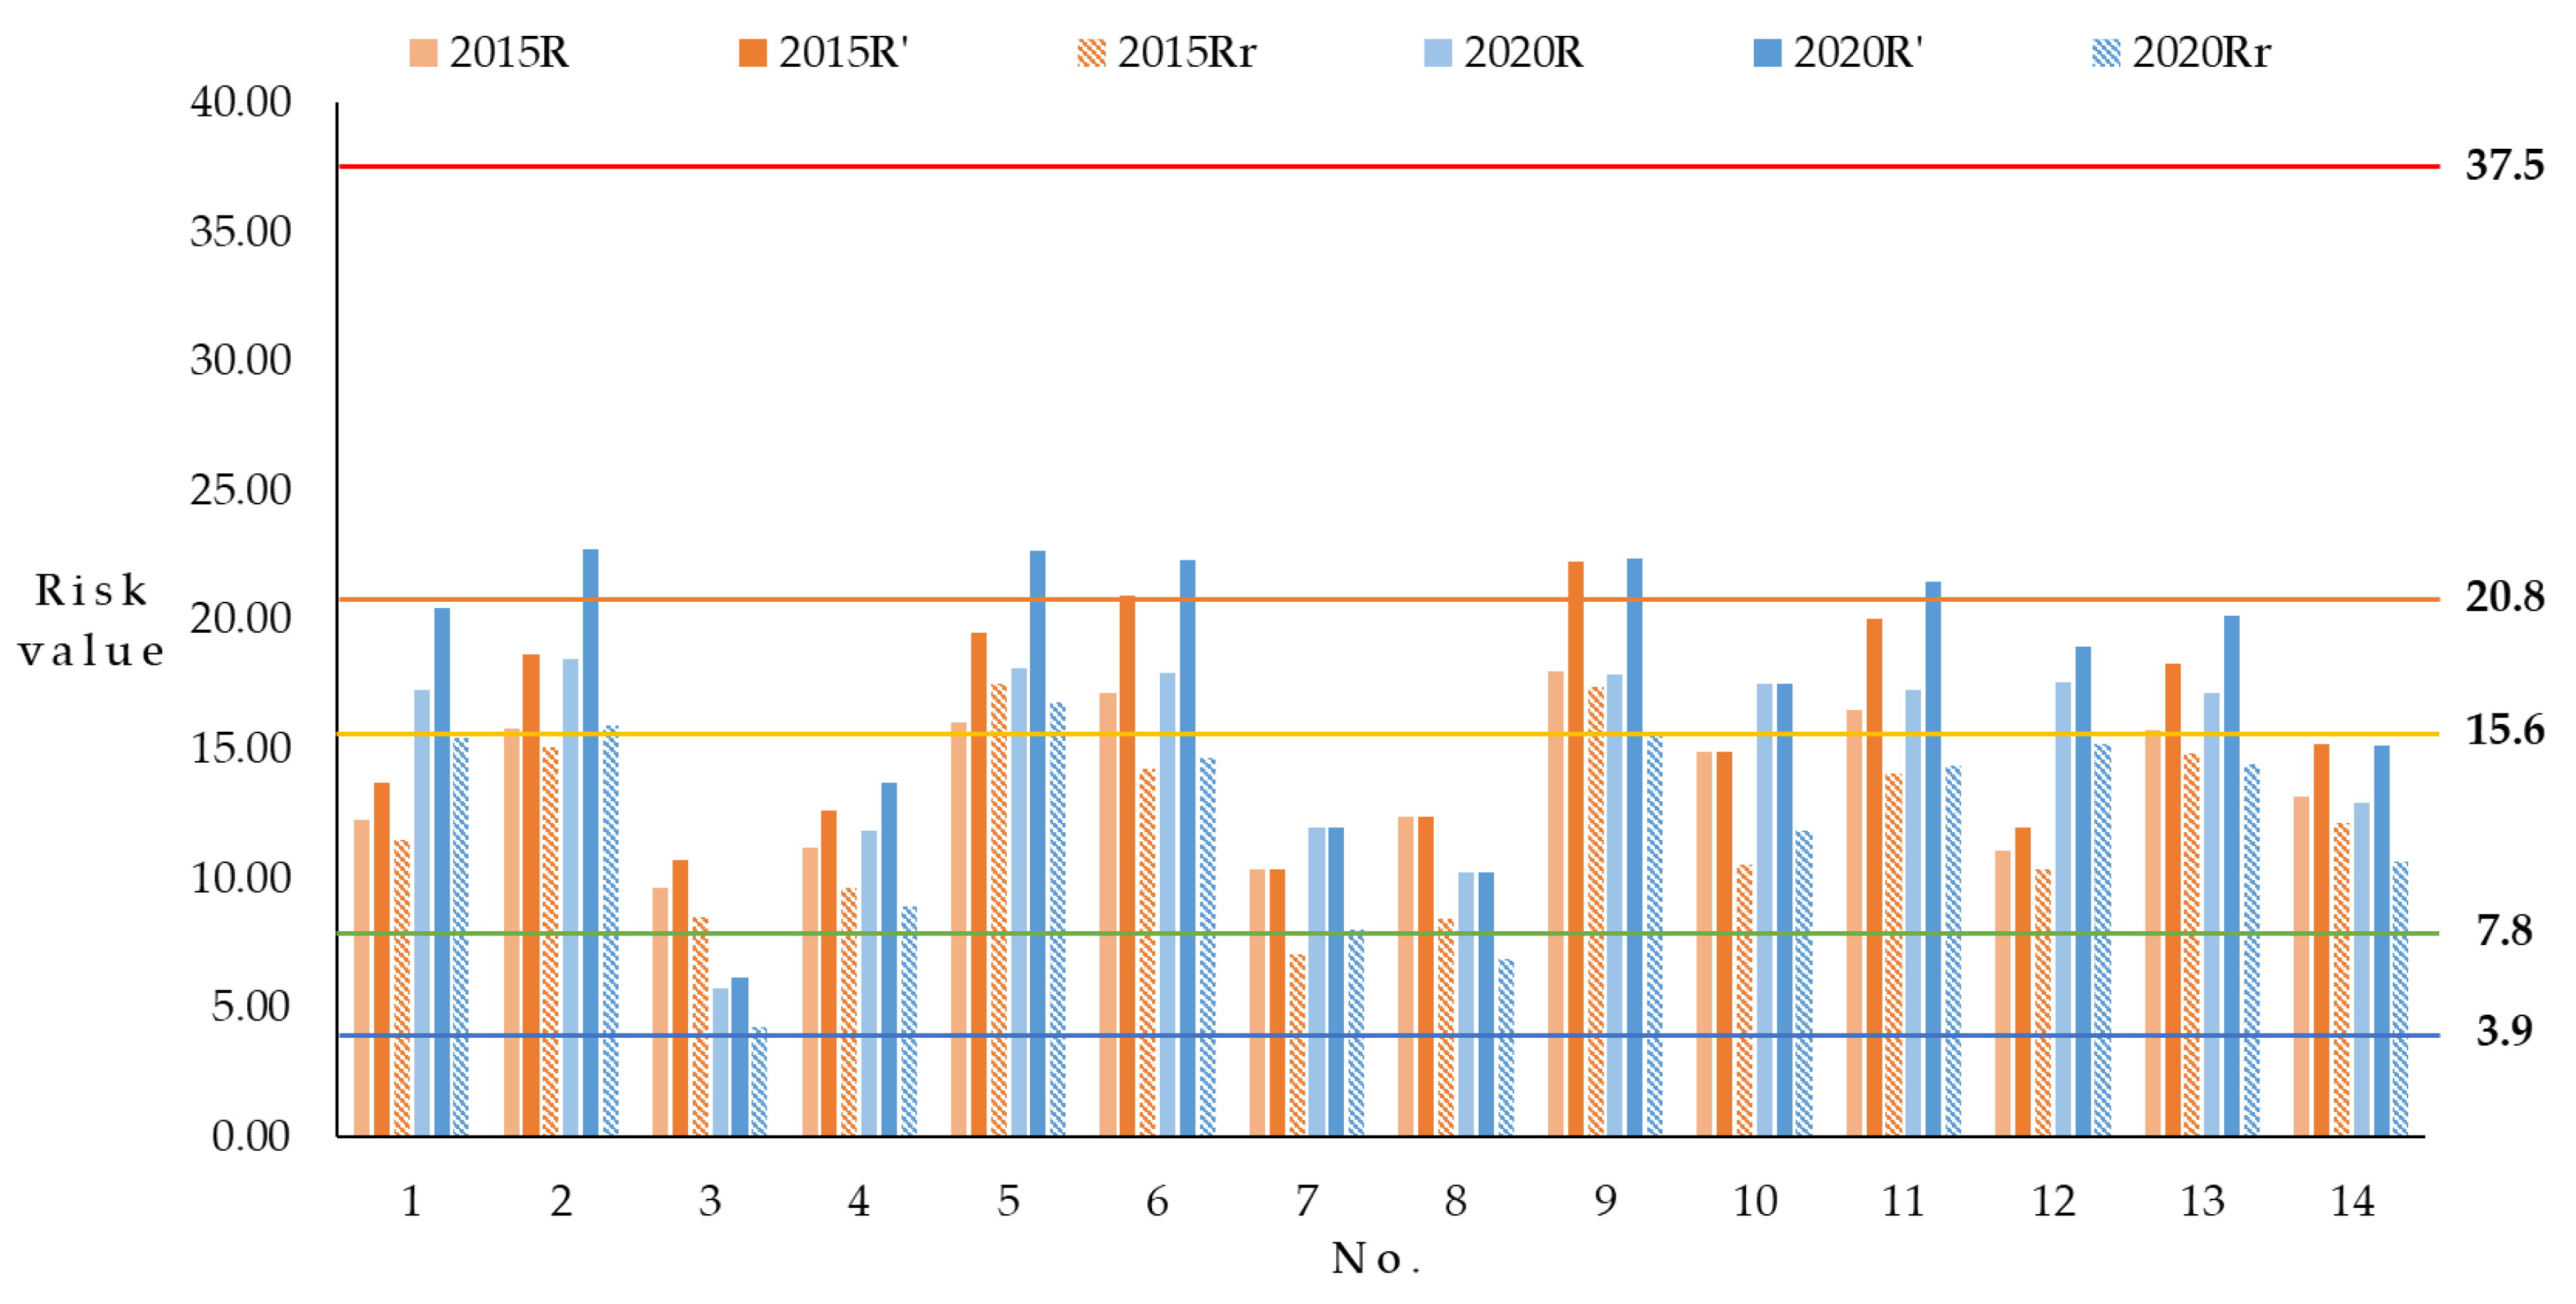
- , considering the combined triggering effect, increased significantly compared to (by an average increase of 16.41% in 2015 and 18.65% in 2020), indicating that the combined triggering effect had a significant impact on risk.
- (2)
- was significantly lower (by an average decrease of 22.82% in 2015 and 30.02% in 2020) than , taking into account the combined triggering effect, indicating that prevention and control capacity has had a significant controlling effect on risk.
- (3)
- In 2020, the of 10 categories of hazard events, except No. 3, 7, 8, 14, increased to varying degrees compared to 2015, with an average increase of 19.63%.
5. Discussion
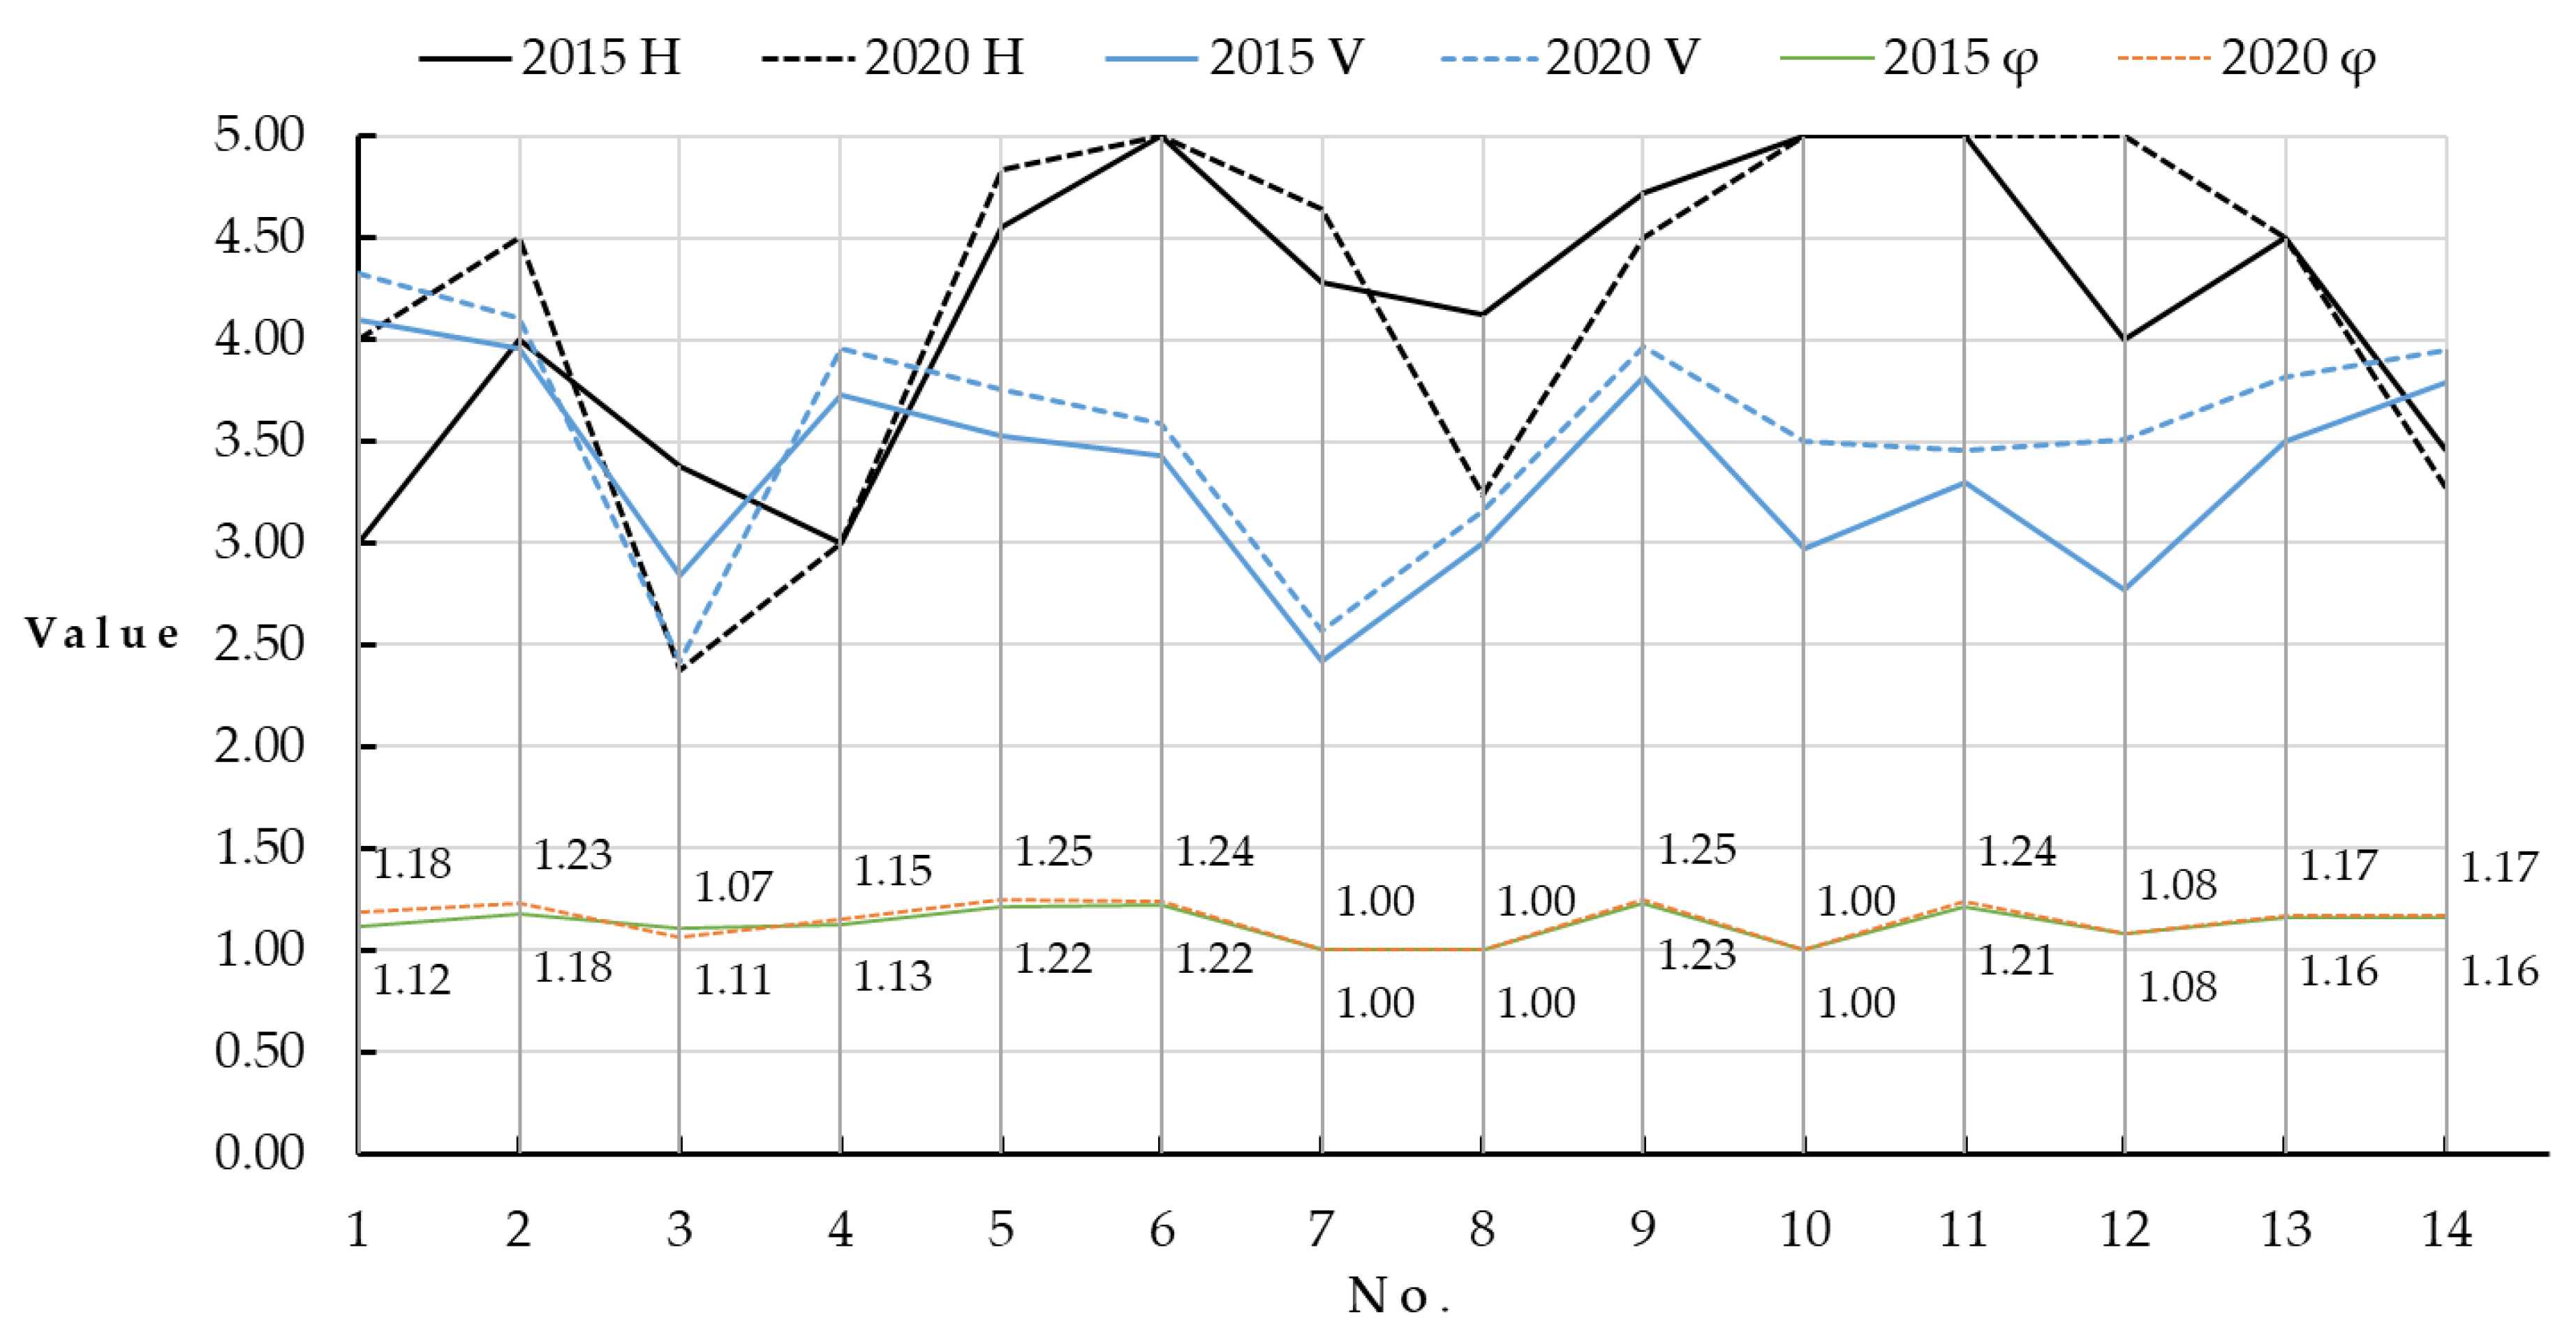
5.1. Analysis of the Overall Planning Impact on the Inherent Risk for Area A
- (1)
- Except for landslide and lightning, the hazard risk of the other three natural disasters has increased, and the overall hazard risk of natural disasters has slightly increased. The improvement of ecology and environment has fundamentally reduced the probability and intensity of landslide and natural forest fires. The hazard risk of landslide has been significantly reduced (−29.59%). However, the booming tourism has caused significant hazard risks of forest fires due to human factors. Therefore, the hazard risk of forest fires still shows an upward trend (6.15%). At the same time, affected by the change of global climate, the hazard risks of typhoon and flood have increased significantly (33.33% and 12.50%, respectively) as well.
- (2)
- The changing trend of each technical disaster is different, and their overall hazard risk has increased slightly. Technical disasters related to hazardous chemicals have always been the critical technical disasters in Area A. Except for fire and explosion accident in road transport of dangerous chemicals (No. 9), other technical disasters related to dangerous chemicals all have the highest hazard evaluation values. Specific measures corresponding to Area A’s economic development orientation have improved the traffic conditions for vehicles loading dangerous chemicals. It reduced the probability of fire and explosion accident in road transport of dangerous chemicals (No. 9). Therefore, the hazard risk of such a disaster has decreased slightly (−4.66%). In addition, the number of urban construction projects in Area A has increased from 86 in 2015 to 178 in 2020. Large-scale construction projects have been launched throughout the urban area, and the hazard risk of construction accidents has increased significantly (25.00%).
- (3)
- Except for landslide, the vulnerability of the remaining 13 disasters has increased, and the vulnerability of all disasters has increased by 6.40% on average. This is mainly due to two factors. On the one hand, urban construction and development have increased the density of population, buildings, and infrastructure in some affected areas, leading to increased exposure of the hazard-bearing body. On the other hand, population aging and social income gap have increased, leading to a rise in the overall vulnerability level.
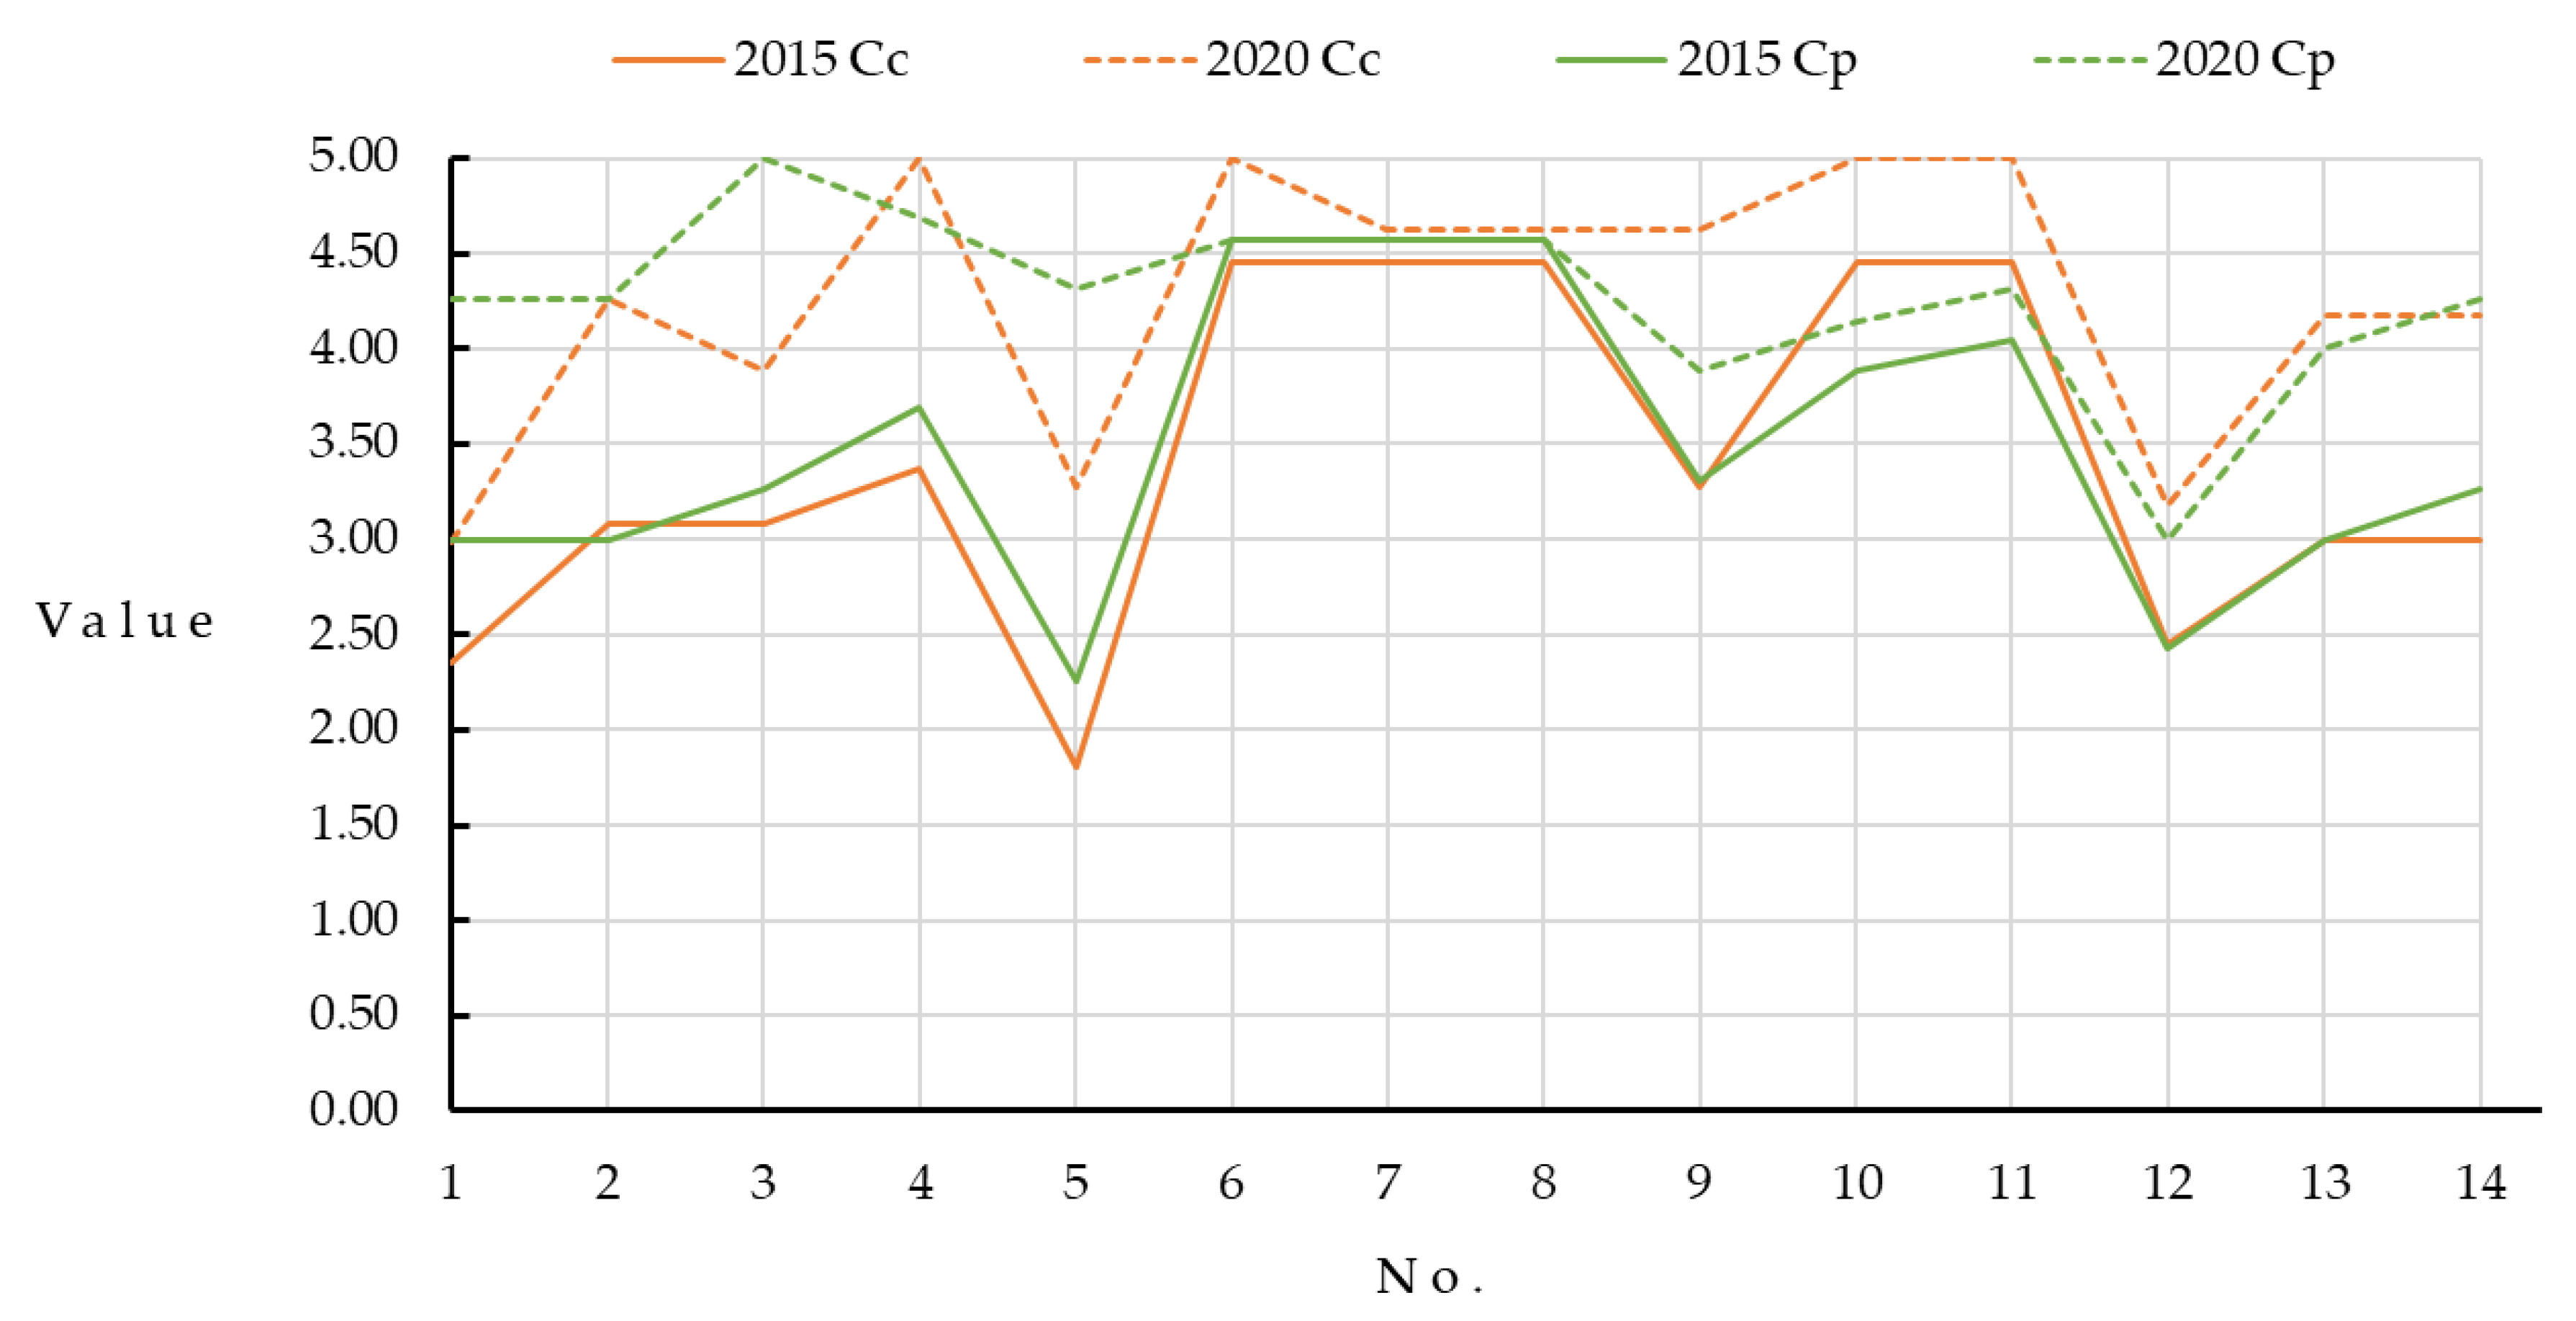
5.2. Analysis of the Special Safety Planning Impact on the Capacities for Area A
6. Conclusions
Author Contributions
Funding
Data Availability Statement
Acknowledgments
Conflicts of Interest
References
- Marana, P.; Eden, C.; Eriksson, H.; Grimes, C.; Hernantes, J.; Howick, S.; Labaka, L.; Latinos, V.; Lindner, R.; Majchrzak, T. Towards a resilience management guideline—Cities as a starting point for societal resilience. Sustain. Cities Soc. 2019, 48, 1–19. [Google Scholar] [CrossRef]
- Marc, V.; Beniamino, R.; Martínez-Gomariz, E. Integrated Assessment of Climate Change Impacts and Urban Resilience: From Climate and Hydrological Hazards to Risk Analysis and Measures. Sustainability 2020, 12, 6430. [Google Scholar] [CrossRef]
- Lacinák, M.; Ristvej, J. Smart City, Safety and Security. Procedia Eng. 2017, 192, 522–527. [Google Scholar] [CrossRef]
- Ristvej, J.; Lacinák, M.; Ondrejka, R. On Smart City and Safe City Concepts. Mob. Netw. Appl. 2020, 25, 836–845. [Google Scholar] [CrossRef]
- United Nations Office for Disaster Risk Reduction. Global Assessment Report on Disaster Risk Reduction. 2019. Available online: https://gar.undrr.org/report-2019 (accessed on 1 December 2020).
- Hizbaron, D.R.; Baiquni, M.; Sartohadi, J.; Rijanta, R. Urban Vulnerability in Bantul District, Indonesia—Towards Safer and Sustainable Development. Sustainability 2012, 4, 2022–2037. [Google Scholar] [CrossRef]
- Hadumaon, S.T.; Purhadi, P.; Suhartono, S.; Hamonangan, R. Social vulnerability to natural hazards in Indonesia: Driving factors and policy implications. Nat. Hazards 2014, 70, 1603–1617. [Google Scholar] [CrossRef]
- Xuesong, G.; Naim, K. Assessing social vulnerability to earthquake disaster using rough analytic hierarchy process method: A case study of Hanzhong City, China. Saf. Sci. 2020, 125, 104625. [Google Scholar] [CrossRef]
- Nuthammachot, N.; Stratoulias, D. Multi-criteria decision analysis for forest fire risk assessment by coupling AHP and GIS: Method and case study. Environ. Dev. Sustain. 2021, 1–16. [Google Scholar] [CrossRef]
- Lou, T. Risk assessment and application of dust explosion risk in industrial enterprises based on SCL and G1 methods. In Proceedings of the 34th Annual Conference of the Asia-Pacific Occupational Safety and Health Organization (APOSHO), Guiyang, China, 5–8 September 2019. [Google Scholar] [CrossRef]
- Sepehri, M.; Malekinezhad, H.; Hosseini, S.Z.; Ildoromi, A.R. Assessment of flood hazard mapping in urban areas using entropy weighting method: A case study in Hamadan city, Iran. Acta Geophys. 2019, 67, 1435–1449. [Google Scholar] [CrossRef]
- Qi, K.; Wang, Q.; Duan, Q.; Gong, L.; Sun, J.; Liew, K.M.; Jiang, L. A multi criteria comprehensive evaluation approach for emergency response capacity with interval 2-tuple linguistic information. Appl. Soft Comput. 2018, 72, 419–441. [Google Scholar] [CrossRef]
- Cutter, S.L.; Burton, C.G.; Emrich, C.T. Disaster Resilience Indicators for Benchmarking Baseline Conditions. J. Homel. Secur. Emerg. Manag. 2010, 7, 1–22. [Google Scholar] [CrossRef]
- Duzgun, H.S.B.; Yucemen, M.S.; Kalaycioglu, H.S.; Celik, K.; Kemec, S.; Ertugay, K.; Deniz, A. An integrated earthquake vulnerability assessment framework for urban areas. Nat. Hazards 2011, 59, 917–947. [Google Scholar] [CrossRef]
- Carreño, M.L.; Cardona, O.D.; Barbat, A.H. New methodology for urban seismic risk assessment from a holistic perspective. Bull. Earthq. Eng. 2012, 10, 547–565. [Google Scholar] [CrossRef]
- Guodong, W.; Aihua, Y.; Ruifang, H.; Binbin, C.; Yang, Y.; Shuhao, G. Research and practice of urban safety risk assessment method system. China Saf. Sci. J. 2019, 15, 46–50. [Google Scholar] [CrossRef]
- Qiang, Z.; Jianzhong, Z.; Chao, Z. Flood disaster risk analysis based on principle of maximum entropy and attribute interval recognition theory. Adv. Water Sci. 2012, 23, 323–333. [Google Scholar] [CrossRef]
- Kameshwar, S.; Cox, D.T.; Barbosa, A.R.; Farokhnia, K.; Park, H.; Alam, M.S. Probabilistic decision-support framework for community resilience: Incorporating multi-hazards, infrastructure interdependencies, and resilience goals in a Bayesian network. Reliab. Eng. Syst. Saf. 2019, 191, 10656. [Google Scholar] [CrossRef]
- Verseveld, H.; Dongeren, A.; Plant, N.G.; Jger, W.S.; Heijer, C.D. Modelling multi-hazard hurricane damages on an urbanized coast with a Bayesian Network approach—ScienceDirect. Coast. Eng. 2015, 103, 1–14. [Google Scholar] [CrossRef]
- Rong, L.; Liu, Y. Modeling the evaluation for regional disaster chain risk based on elements at risk. J. Syst. Eng. 2019, 34, 132–146. [Google Scholar] [CrossRef]
- Tao, Z.; Guohua, C.; Reniers, G.; Yunfeng, Y. Methodology for quantitative risk analysis of domino effects triggered by flood. Process Saf. Environ. Prot. 2021, 147, 866–877. [Google Scholar] [CrossRef]
- Maxx, D.; Robert, C.; Uwe, D.; Arthur, L.; Margaret, A. Natural Disaster Hotspots: A Global Risk Analysis; World Bank Group: Washington, DC, USA, 2005; pp. 35–60. [Google Scholar]
- Birkmann, J.W. Torsten Assessing the risk of loss and damage: Exposure, vulnerability and risk to climate-related hazards for different country classifications. Int. J. Glob. Warm. 2015, 8, 191–212. [Google Scholar] [CrossRef]
- Zánická Hollá, K.; Ristvej, J.; Šimák, L. Systematic method of risk assessment in industrial processes. In Risk Analysis VII: Simulation and Hazard Mitigation—Southampton; WIT Transaction on Information and Communication Technologies; WIT Press: Southampton, UK, 2010; Volume 43, pp. PI115–PI126. ISBN 9781845644727. [Google Scholar] [CrossRef]
- Wang, W.; Xia, C.; Ma, D.; Su, J. Multi-hazard comprehensive risk assessment based on coupling incentive mechanism. China Saf. Sci. J. 2019, 29, 251–264. [Google Scholar] [CrossRef]
- Almeida, M.C.; Telhado, M.J.; Morais, M.; Barreiro, J.; Lopes, R. Urban resilience to flooding: Triangulation of methods for hazard identification in urban areas. Sustainability 2020, 12, 2227. [Google Scholar] [CrossRef]
- Li, J.; Chen, C. Modeling the dynamics of disaster evolution along causality networks with cycle chains. Physical A 2014, 401, 251–264. [Google Scholar] [CrossRef]
- Sagara, B. Resilience Measurement Practical Guidance Note Series 2: Measuring Shocks and Stresses; US Agency for International Development: Washington, DC, USA, 2018; pp. 2–4.
- United Nations Office for Disaster Risk Reduction. Sendai Framework for Disaster Risk Reduction 2015–2030. 2015. Available online: https://www.ifrc.org/docs/IDRL/Sendai_Framework_for_Disaster_Risk_Reduction_2015-2030 (accessed on 1 December 2020).
- United Nations Office for Disaster Risk Reduction. Report of the Open-Ended Intergovernmental Expert Working Group on Indicators and Terminology Relating to Disaster Risk Reduction. 2016. Available online: https://www.preventionweb.net/files/50683_oiewgreportenglish (accessed on 1 December 2020).
- ISO 31000. Risk Management—Guideline; The International Organization for Standardization: Switzerland, Switzerland, 2018. [Google Scholar]
- Pappa, M. Social Vulnerability to Coastal Floods in Denmark: Investigating the Spatial Patterns among the Danish. 2019. Available online: https://projekter.aau.dk/projekter/files/307155336/PappaMariathesis.pdf (accessed on 1 December 2020).
- Jenks Natural Breaks Classification. Available online: http://wiki.gis.com/wiki/index.php/Jenks_Natural_Breaks_Classification (accessed on 2 March 2021).
- Caverzan, A.; Solomos, G. Review on Resilience in Literature and Standards for Critical Built-Infrastructure; Publications Office of the European Union: Luxembourg, 2014; pp. 1–41. [Google Scholar] [CrossRef]
- Tilloy, A.; Malamud, B.D.; Winter, H.; Joly-Laugel, A. A review of quantification methodologies for multi-hazard interrelationships. Earth Sci. Rev. 2019, 196, 102881. [Google Scholar] [CrossRef]
- Ricci, F.; Moreno, V.C.; Cozzani, V. A comprehensive analysis of the occurrence of Natech events in the process industry. Process Saf. Environ. Prot. 2021, 147, 703–713. [Google Scholar] [CrossRef]
- Fang, Y.; Qin, D.; Ding, Y. Global main approaches of risk and vulnerability assessment and implementation in scale transformation. Arid Land Geogr. 2009, 32, 319–326. [Google Scholar] [CrossRef]


| Grade | Grade 1 | Grade 2 | Grade 3 | Grade 4 | Grade 5 |
|---|---|---|---|---|---|
| (Description, Value) | (Low, 1) | (Lower, 2) | (Medium, 3) | (Higher, 4) | (High, 5) |
| Judgment Criteria | (0, 3.9] | (3.9, 7.8] | (7.8, 15.6] | (15.6, 20.8] | (20.8, 37.5] |
| Grade | Grade 1 | Grade 2 | Grade 3 | Grade 4 | Grade 5 |
|---|---|---|---|---|---|
| (Description, Value) | (Low, 1) | (Lower, 2) | (Medium, 3) | (Higher, 4) | (High, 5) |
| Emergency capacity | (0, 0.12] | (0.12, 0.24] | (0.24, 0.38] | (0.38, 0.56] | (0.56, 1] |
| Evaluation Criteria | (0, 0.7] | (0.7, 1.3] | (1.3, 2] | (2, 3] | (3, 5] |
|---|---|---|---|---|---|
| Grade | Grade 1 | Grade 2 | Grade 3 | Grade 4 | Grade 5 |
| Description | Most Unsafe | Unsafe | Critical Safe | Safe | Most Safe |
| No. | The Hazard Events | No. of Events Triggered | ||||||
|---|---|---|---|---|---|---|---|---|
| 2015 | 2020 | 2015 | 2020 | 2015 | 2020 | |||
| 1 | Typhoon | 7 | 0.47 | 0.68 | 5.81 | 9.22 | 1.12 | 1.18 |
| 2 | Flooding | 6 | 0.62 | 0.73 | 8.97 | 11.40 | 1.18 | 1.23 |
| 3 | Landslide | 4 | 0.36 | 0.20 | 5.63 | 3.50 | 1.11 | 1.07 |
| 4 | Lightning | 8 | 0.42 | 0.45 | 6.44 | 7.71 | 1.13 | 1.15 |
| 5 | Forest Fire | 2 | 0.63 | 0.71 | 10.81 | 12.54 | 1.22 | 1.25 |
| 6 | Fire and Explosion Accident during Production and Storage of Dangerous Chemical | 1 | 0.67 | 0.71 | 11.09 | 12.17 | 1.22 | 1.24 |
| 7 | Ammonia Related Explosion | 0 | 0.39 | 0.46 | 0 | 0 | 1 | 1 |
| 8 | Dust Explosion | 0 | 0.47 | 0.38 | 0 | 0 | 1 | 1 |
| 9 | Fire and Explosion Accident in Road Transport of Dangerous Chemicals | 2 | 0.71 | 0.70 | 11.75 | 12.66 | 1.23 | 1.25 |
| 10 | Oil Spills in Water Transportation of hazardous chemicals | 0 | 0.58 | 0.69 | 0 | 0 | 1 | 1 |
| 11 | Chemical Spills in Pipeline Transportation | 2 | 0.65 | 0.68 | 10.71 | 12.22 | 1.21 | 1.24 |
| 12 | Construction Accidents | 1 | 0.42 | 0.69 | 4.04 | 3.97 | 1.08 | 1.08 |
| 13 | Fire Accidents in Profit-oriented Assembly Occupancies | 1 | 0.61 | 0.67 | 8.07 | 8.69 | 1.16 | 1.17 |
| 14 | Fire Accidents in Public Assembly Occupancies | 1 | 0.51 | 0.50 | 7.96 | 8.52 | 1.16 | 1.17 |
| Time | The Critical Event Evolution Elements | Response Measures |
|---|---|---|
| At 8:10 p.m. |
|
|
| At 8:11 p.m. | The oil spill amounted to approximately 4 t and continued to increase. | Vessel A alerted the company. |
| At 8:17 p.m. | / | Vessel B rescued crew members that fell overboard. |
| At 8:48 p.m. | / | The first marine patrol vessel arrived on the scene to provide on-scene command, traffic control, and observation. |
| At 9:00 p.m. | The plugging of Vessel A failed; the oil spill amounted to approximately 270 t and continued to increase. |
|
| At 9:30 p.m. | / | The second specialist disposal team arrived on the scene and started cleaning up the oil. |
| At 10:00 p.m. | The oil spill at sea had increased to approximately 550 t, and there was a risk of contamination of the coastal landscape and shoreline. | / |
| At 11:00 p.m. | Vessel A sank in the waterway near the island with 1950 t of cargo oil still in its hold. | / |
| At 2:30 p.m. (on the morrow) | Oil spills spread to the coast. | Vessel B transported the three injured crew members to the nearest pier for hospital treatment. |
| At 6:00 p.m. (on the morrow) | / | The oil on the sea surface was cleaned up and the oil on the seabed and shoreline continued to be cleaned up by the relevant authorities. |
| Parameters | Value | Description of the Basic Data and Analysis Process |
|---|---|---|
| / | ||
| 0.96 |
| |
| According to Equation (11): . | ||
| Rescue and evacuation | / | |
| () | 1 (0.38) |
|
| Professional disaposal | / | |
| () | 0.01 (0.62) |
|
| According to Equation (13): . | ||
| Rescue and evacuation | / | |
| 0.38 | / | |
| 1 |
| |
| 1 |
| |
| Professional disaposal | / | |
| 0.62 | / | |
| 0.02 |
| |
| 0.92 |
| |
| According to Equation (16): . | ||
| () | 0.2 (0.25) |
|
| () | 0.49 (0.375) |
|
| () | 1 (0.375) |
|
| No. | ||||||||||
|---|---|---|---|---|---|---|---|---|---|---|
| 2015 | 2020 | 2015 | 2020 | 2015 | 2020 | 2015 | 2020 | 2015 | 2020 | |
| 1 | 12.28 | 17.29 | 13.71 | 20.48 | 11.51 | 15.45 | / | 0.80 | / | 1.67 |
| 2 | 15.81 | 18.49 | 18.65 | 22.71 | 15.04 | 15.91 | 0.71 | 0.79 | 1.67 | 1.25 |
| 3 | 9.61 | 5.75 | 10.70 | 6.16 | 8.50 | 4.21 | / | / | / | / |
| 4 | 11.17 | 11.86 | 12.61 | 13.69 | 9.62 | 8.93 | / | / | / | / |
| 5 | 16.05 | 18.14 | 19.51 | 22.69 | 17.54 | 16.78 | 0.37 | 0.74 | 0.75 | 1.25 |
| 6 | 17.14 | 17.92 | 20.94 | 22.28 | 14.24 | 14.64 | 0.56 | 0.76 | 1.67 | 1.67 |
| 7 | 10.34 | 11.94 | 10.34 | 11.94 | 7.03 | 8.03 | / | / | / | / |
| 8 | 12.36 | 10.23 | 12.36 | 10.23 | 8.40 | 6.88 | / | / | / | / |
| 9 | 17.99 | 17.85 | 22.22 | 22.38 | 17.42 | 15.68 | 0.15 | 0.45 | 0.50 | 1.00 |
| 10 | 14.88 | 17.51 | 14.88 | 17.51 | 10.54 | 11.81 | / | 0.52 | / | 1.33 |
| 11 | 16.49 | 17.27 | 20.02 | 21.49 | 14.04 | 14.34 | 0.56 | 0.74 | 1.67 | 1.67 |
| 12 | 11.09 | 17.56 | 11.98 | 18.95 | 10.32 | 15.20 | / | 0.61 | / | 1.67 |
| 13 | 15.75 | 17.16 | 18.30 | 20.14 | 14.82 | 14.40 | 0.54 | 0.73 | 1.33 | 1.67 |
| 14 | 13.12 | 12.91 | 15.08 | 15.11 | 12.04 | 10.64 | / | / | / | / |
| Year | Numbers of Critical Hazard Events | Average Value | ||
|---|---|---|---|---|
| 2015 | 6 | 4 | 66.67% | 0.48 |
| 2020 | 9 | 9 | 100% | 0.68 |
| Amplification | 50% | / | 50% | 41.67% |
| Indicator | |||||||||
|---|---|---|---|---|---|---|---|---|---|
| 2015 | 2020 | Average Increase | 2015 | 2020 | Average Increase | 2015 | 2020 | Average Increase | |
| Natural disasters | 3.59 | 3.74 | 4.48% | 3.63 | 3.71 | 1.43% | 1.15 | 1.18 | 2.30% |
| Technical disasters | 4.45 | 4.46 | 0.21% | 3.22 | 3.50 | 9.16% | 1.12 | 1.13 | 0.85% |
| Hazardous events | 4.14 | 4.20 | 1.74% | 3.37 | 3.58 | 6.40% | 1.13 | 1.15 | 1.37% |
| Indicator | ||||||||||||
|---|---|---|---|---|---|---|---|---|---|---|---|---|
| No. | 2015 | 2020 | Increase | 2015 | 2020 | Increase | 2015 | 2020 | Increase | 2015 | 2020 | Increase |
| 1 | / | 4.64 | / | / | 1.00 | / | / | 0.74 | / | / | 0.84 | / |
| 2 | 4.19 | 4.64 | 10.74% | 1.00 | 1.00 | 0.00% | 0.73 | 0.80 | 8.90% | 0.73 | 0.79 | 8.22% |
| 5 | 3.38 | 4.64 | 37.28% | 0.60 | 0.88 | 47.47% | 0.55 | 0.86 | 54.98% | 0.47 | 0.60 | 25.74% |
| 6 | 4.37 | 5.00 | 14.42% | 1.00 | 1.00 | 0.00% | 0.39 | 0.66 | 68.82% | 0.47 | 0.55 | 17.37% |
| 9 | 1.45 | 3.36 | 131.72% | 0.31 | 0.55 | 76.18% | 0.75 | 0.89 | 18.28% | 0.44 | 0.52 | 19.68% |
| 10 | / | 4.82 | / | / | 0.39 | / | / | 0.63 | / | / | 0.64 | / |
| 11 | 4.73 | 5.00 | 5.71% | 0.37 | 0.71 | 90.32% | 0.92 | 0.92 | 0.00% | 0.43 | 0.52 | 20.53% |
| 12 | / | 3.92 | / | / | 1.00 | / | / | 0.67 | / | / | 0.60 | / |
| 13 | 3.92 | 4.64 | 18.37% | 1.00 | 1.00 | 0.00% | 0.63 | 0.73 | 16.58% | 0.32 | 0.57 | 78.44% |
| Average | 3.67 | 4.52 | 36.37% | 0.71 | 0.84 | 35.66% | 0.66 | 0.77 | 27.93% | 0.49 | 0.62 | 25.66% |
Publisher’s Note: MDPI stays neutral with regard to jurisdictional claims in published maps and institutional affiliations. |
© 2021 by the authors. Licensee MDPI, Basel, Switzerland. This article is an open access article distributed under the terms and conditions of the Creative Commons Attribution (CC BY) license (https://creativecommons.org/licenses/by/4.0/).
Share and Cite
Chen, G.; Yang, Q.; Chen, X.; Huang, K.; Zeng, T.; Yuan, Z. Methodology of Urban Safety and Security Assessment Based on the Overall Risk Management Perspective. Sustainability 2021, 13, 6560. https://doi.org/10.3390/su13126560
Chen G, Yang Q, Chen X, Huang K, Zeng T, Yuan Z. Methodology of Urban Safety and Security Assessment Based on the Overall Risk Management Perspective. Sustainability. 2021; 13(12):6560. https://doi.org/10.3390/su13126560
Chicago/Turabian StyleChen, Guohua, Qin Yang, Xuexi Chen, Kongxing Huang, Tao Zeng, and Zhi Yuan. 2021. "Methodology of Urban Safety and Security Assessment Based on the Overall Risk Management Perspective" Sustainability 13, no. 12: 6560. https://doi.org/10.3390/su13126560
APA StyleChen, G., Yang, Q., Chen, X., Huang, K., Zeng, T., & Yuan, Z. (2021). Methodology of Urban Safety and Security Assessment Based on the Overall Risk Management Perspective. Sustainability, 13(12), 6560. https://doi.org/10.3390/su13126560