Abstract
With the expansion of urbanization, the interaction between different hazards has become increasing evident. In order to promote sustainable development of urban areas, it is particularly important to systematically analyze and evaluate urban safety and security under the coupling effect of multi-hazard risks. In response to the practical needs of urban safety and security assessment practice, this paper constructs an application-oriented urban safety and security quantitative assessment methodology. First, following the comprehensive risk management perspective, the logical relationship between urban safety and security elements is analyzed. It proposes “comprehensive screening, key analysis, and comprehensive evaluation” as a new assessment concept. Second, a system of urban safety and security assessment methods consisting of a weighting method and a function model is constructed. The function model includes two sub-models: a quantitative risk assessment model that considers triggering effects and a quantitative assessment model of emergency capacity that considers the evolution of emergencies. Finally, the method was applied to a coastal urban area in south China. The case study proved that the proposed method system can not only effectively evaluate various disaster risks and emergency capacity but also provide evidence for the formulation and implementation of urban safety and security management measures.
1. Introduction
With the continued advance of urbanization, more and more people will be living in urban areas. At present, 54 percent of the population live in urban areas, and the proportion of the global urban population is expected to increase to 66 percent by 2050 [1]. The management of urban areas has become one of the most important development challenges in the 21st century [2]. Efficient, safe, and sustainable is the goal of modern urbans areas. To promote the sustainable development of urban areas, it is important to understand the urban area with their smart and safe concepts as interconnected parts [3,4]. In urban areas, the barriers between traditional natural disasters, technological disasters, social security, and public health are breaking down due to wide-range interaction between human society and nature. Therefore, urban safety and security planning and resilience construction have paid more attention to systematic thought. In this context, a systematic analysis of urban safety and security considering the comprehensive multi-hazard risk is particularly important for improving urban safety resilience and promoting sustainable urban development.
Disasters in the field of urban safety and security are due to the interaction with dangerous events, vulnerability, and capacity, which cause the operation of a community or society to be severely disrupted on any scale [5]. Urban safety and security assessment focuses on risks, vulnerability, capacity, and resilience. It evaluates the threats to urban safety and security and the capacity required to ensure urban safety and security, forming a wealth of research results. How to comprehensively evaluate the safety and security level of urban areas is a hot topic in current research. Current evaluation methods can be mainly divided into two categories: the comprehensive evaluation method based on the index system and the quantitative evaluation method based on the mathematical model.
The comprehensive evaluation method is the most widely used method in urban safety and security assessment (e.g., Refs. [6,7,8]). The use of such methods first requires the construction of a multi-class indicator system, usually including four classes of target, criterion, factor, and index. Then, subjective weighting method (e.g., analytic hierarchy process (AHP) [9], G1-method [10], etc.), objective weighting method (e.g., entropy weight method [11]) or combination weighting model [12]) is used to determine the weight of each index. Finally, using the indicators value aggregation method, such as the weighting model [13,14], the fuzzy comprehensive evaluation method [15,16], and the attribute interval recognition method [17], the final evaluation value is obtained by combining the score and weight of each index.
The most important feature of the quantitative evaluation method based on a mathematical model is that the complex logical relationship between the evaluation elements or indicators is represented by a conceptual model in mathematical form so as to obtain more accurate and digital results. This method can be further divided into the evaluation model with (e.g., Refs. [18,19,20,21]) and without (e.g., Refs. [22,23,24]) considering the coupling relationship among multi-hazard risks. When evaluating the whole urban area or an even larger area, the evaluation model, without considering the coupling of multi-hazardrisks, is usually used. For example, in the World Risk Index (WRI) proposed by Birkmann et al. [23], the conceptual model of risk is “”, in which the four evaluation factors were exposure (E), susceptibility (S), coping capacity (CC), and adaptive capacity (AC). The evaluation model considering the coupling of multi-hazard risks often takes into account the deep disaster mechanism, so the models are more complex. For example, Verseveld et al. [19] modeled multi-hazard hurricane damages on coast buildings with a Bayesian Net-work approach. Rong et al. [20] developed a model to assess risk of regional disaster chain from the perspective of a hazard-bearing body. Zeng et al. [21] proposed the risk assessment model of Na-Tech event from chemical equipment triggered by floods.
In addition, the superposition method based on the above two methods and GIS (geographic information systems) technology is also a common evaluation method in previous research. A typical example is that Wang et al. [25] used GIS to obtain typical disaster information, constructed the spatial coupling incentive rules between disasters, and calculated the multi-hazard risk by using the ordered weighted of fixed-point. Another example comes from the Resilience to Cope with Climate Change in Urban Areas (RESCCUE) project, which developed a GIS-based information platform that can provide services of urban resilience assessment, planning, and management [26].
Due to a high concentration of urban hazard-bearing bodies and the coupling effects of multi-hazard risks, an evaluation method that focuses on “all disaster categories, all aspects, and whole process” is critical for multi-hazard risk analysis and for the improvement of urban safety and security. Currently, however, few research results have been able to provide such a systematic analysis idea. In terms of assessment, the focus can be risk, vulnerability, capacity, or resilience. These perspectives have different focuses but are also interrelated. Thus, only by effectively integrating all perspectives can we assess urban safety and security effectively. In terms of evaluation methods, the comprehensive evaluation method is usually based on the weighted calculation method. Although this method is simple and easy to implement, it cannot thoroughly consider the evolution mechanism of disaster risk and often ignores the logical relationship between the evaluation elements. Some mathematical models considering disaster chain effects (such as [27]) have been established to assess urban disaster risks, but urban areas involve many types of disasters and a large body of hazard sources, and the above method may be difficult to be widely applied due to the large amount of data.
In this paper, we aim to provide an application-oriented quantitative assessment method for urban safety and security, focusing on acute shocks (events with rapid onset, and typical short duration [28]). This method not only considers the practical needs of comprehensive coverage, prominent focus, operability, and guidance in the practice of urban safety and security assessment, but also takes the triggering effect as the key factor in quantitative risk. The analyses presented in the remainder of this paper are structured around the following key questions:
- (i)
- How do we conduct a comprehensive safety and security assessment for an urban area with dense hazard-bearing bodies and coupling of multi-hazard risks?
- (ii)
- How do we accurately quantify the risk and capacity of urban areas and scientifically evaluate the safety and security status of urban areas?
The organization of this paper is as follows. Section 2 discusses the logical relationship of urban safety and security elements from the perspective of comprehensive risk management and introduces the evaluation concept and specific evaluation process. Section 3 elaborates on the framework of assessment method and judgement criteria. Section 4 is a case study using relevant data before and after the implementation of safety planning in a district-level city to carry out a quantitative assessment of urban safety and security. Section 5 analyzes the application results to discuss the effectiveness of key planning measures affecting urban safety and security in urban planning. Finally, the leading findings of this paper are summarized in Section 6.
2. Assessment Process
Disaster risk management can prevent new disaster risks, reduce inherent risks, and manage residual risks, thereby enhancing resilience and achieving sustainable development [5,29,30]. Disaster risk management embodies the idea of overall risk management considering all disasters, all aspects, and the whole evolution process of disasters, creating an opportunity for the integration of different evaluation aspects. Based on this idea, hazard events are divided into potential hazard events (i.e., “risk events”) and occurred hazard events (i.e., “emergency events”) according to the evolution stages. Risk events are potentially destructive hazards that may but do not occur, and this stage corresponds to the generation and accumulation of hazards. When the accumulation of hazards reaches a critical value, and when triggered by internal or external factors and releases, the event evolves from a risk event to an emergency event. At the same time, the risk management activities are also changed from risk prevention and control under normal circumstances to emergency management under emergency conditions.
An urban area’s safety and security level is determined by its risks and risk management capacities. Therefore, the risk characteristics of hazard events and the corresponding risk management capacities are the two most critical elements in the analysis of urban safety and security. Among them, risk characteristics include the hazard and vulnerability of the hazard-bearing body; risk management capacities include the prevention and control capacity and the emergency capacity.
According to the aforementioned idea of overall risk management, the risk can be divided into inherent risk, residual risk, and new risk. The logical relationship between risk and risk management capacity is shown in Figure 1. In a certain round of risk evolution, the inherent risk is determined by the hazard and vulnerability. The risk that still exists after the implementation of risk prevention and control measures is called residual risk, which needs to be controlled by continuous and effective emergency management measures. Once the emergency situation is lifted, risk will enter a new round of the evolution stage.
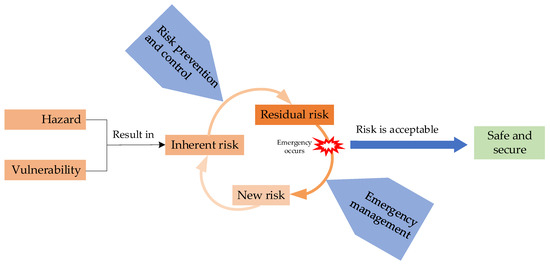
Figure 1.
Logical relationship of urban safety and security elements.
2.1. Assessment Idea
With the increasing focus on coupling and superposition of urban disaster risks, the urban safety and security assessment needs to comprehensively analyze and evaluate the risks of various hazard events within a certain space and time range, which includes overall analysis of all risk events and in-depth analysis of critical emergency events. To meet the requirements of complete coverage, prominent focus, operability, and guidance in the practice of urban safety and security assessment, the urban safety and security assessment idea of “overall screening, key analysis, comprehensive evaluation” emerges. Risk assessment and treatment are at the core of risk management. Based on the Risk Management Guidelines [31], a flowchart of urban safety and security risk management is developed, as shown in Figure 2.
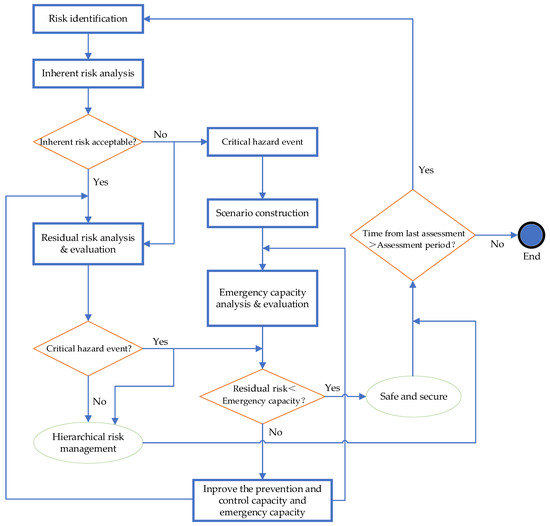
Figure 2.
Flowchart of urban safety and security risk management.
Based on the flowchart of urban safety and security risk management, the urban safety and security assessment idea of “overall screening, key analysis, comprehensive evaluation” is introduced as follows:
- (1)
- An overall risk assessment is the basis for the refined and intelligent management of urban safety and security risks. On the one hand, risk assessments should be done for all hazard events, and risks should be managed hierarchically according to risk levels. On the other hand, the degree of control of the risks of a few critical hazard events in an urban area determines its overall safety and security status, and these critical hazard events also need to be screened through overall risk assessment. Meanwhile, the higher the inherent risk of a hazard event, the stricter the urban managers’ prevention and control of such events, thus, the residual risk of events with high inherent risks may not be high. However, strong prevention and control capacity cannot guarantee that high-risk events will not evolve into emergencies. Therefore, critical hazard events should be determined based on the initial hazard and vulnerability (i.e., inherent risks) of hazard events.
- (2)
- Many types of disasters and a large body of hazard sources are involved in urban areas, but the comprehensive risk of the urban area depends on a few critical hazards. Therefore, for regional-level urban safety and security assessment, in-depth analysis of all hazard events is difficult and unnecessary. Critical hazard events are the objects of key analysis in the urban safety and security assessment. The selective analysis of critical hazard events focuses on the post-event, so the selected critical emergency events are the critical hazard events that are screened out. The purpose of key analysis is to develop more effective risk treatments through in-depth study of the evolution process of such events.
- (3)
- Only by an overall analysis of various risk events and an in-depth analysis of critical emergency events can the urban safety and security status of the whole area be described. The realistic threats to urban safety and security come from the transformation of potential risk events into emergency events. Therefore, the impact of specific hazard events on urban safety and security can be measured by the matching level of residual risks and emergency capacities. In addition, the critical hazard events can represent the overall safety and security level. Therefore, by integrating the residual risks and emergency capacities of various critical hazard events, the overall urban safety and security status can be objectively evaluated.
As a complete urban safety and security risk management flowchart, some other information in Figure 2 other than the assessment idea should also be clarified. If the residual risk level is lower than the emergency capacity level, it means that the assessed area is safe. If this is not the case, it means that the assessed area should develop capacity improvement measures and reassess it to ensure that the area is safe after implementing these measures. In addition, when the time from the last assessment reaches the specific assessment period, a new round of assessment should be conducted.
2.2. Specific Process
Urban safety and security assessment is cyclical work. Following the concept of “overall screening, key analysis, comprehensive evaluation”, we have established an assessment process for a single urban safety and security assessment, as shown in Figure 3. It divides urban safety and security assessment into three stages: risk assessment, emergency capacity assessment, and urban safety and security assessment. The first two are the basis of urban safety and security assessment, while inherent risk analysis in risk assessment is the premise of emergency capacity assessment.
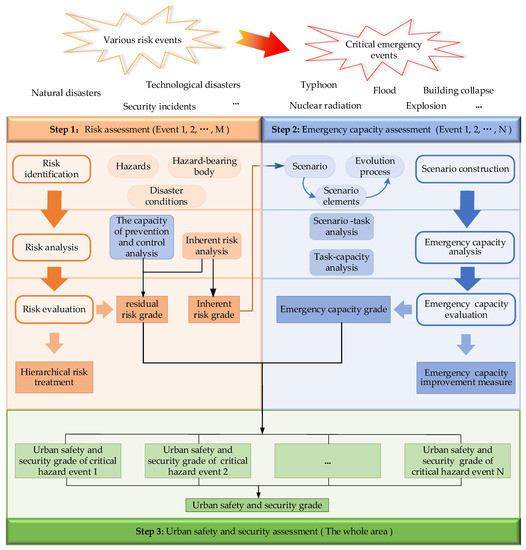
Figure 3.
Urban safety and security assessment (for a single assessment).
There are two key tasks in the risk assessment stage for a specific risk event: determining the inherent risk level and residual risk level of different types of risk events. The former is the basis for screening and selecting critical emergency events to focus on, while the latter is the basis for treating risk hierarchically.
The emergency capacity assessment stage for a specific emergency event follows the principle of “worst-envisioned consequences” and uses scenario construction methods to sort out the specific emergency tasks and the corresponding capacity requirements at each stage of an emergency, including preparedness, response, coping, and recovery. The gap between existing emergency capacity requirements is analyzed from two main aspects: timeliness and effectiveness. This is to provide a basis for formulating targeted measures for improving emergency capacity.
The stage of urban safety and security assessment of the whole area, which integrates various critical hazard events, follows two steps. First, by comparing the gap between residual risks and emergency capacities, the urban safety and security grade under the influence of a specific critical hazard event is evaluated. Second, the urban safety and security grades during various critical hazard events are synthesized to evaluate the overall safety and security grade of the urban area.
3. Assessment Methodology
In Section 2, the general idea (Figure 2) and implementation process (Figure 3) of urban safety and security assessment are introduced. The final results of assessment should be values or grades that can be compared against. Thus, this section aims to study two questions: (i) how to calculate the value of risk, emergency capacity, and urban safety and security and (ii) how to judge the grade of risk, emergency capacity, and urban safety and security.
3.1. The Framework of Methodology
As shown in Figure 3, the grade of urban safety and security is obtained by integrating the residual risk grade and emergency capacity grade of all critical hazard events. Residual risks are calculated by combining inherent risks and risk prevention and control capacity. Therefore, taking inherent risks, risk prevention and control capacity, and emergency capacity as the first-class indicators, the framework of the assessment methodology proposed in this paper is shown in Figure 4. First, we construct a three-class indicator system composed of (1) inherent risk, (2) prevention and control capacity, and (3) emergency capacity, as well as their characteristic elements, and establish “1–5” scoring criteria for each third-class indicator. Second, we aggregate the third-class indicator scoring values to form the second-class indicators evaluation value by a weighting model or a function model. Finally, we calculate the evaluation value of the first-class indicators with the second-class indicators evaluation value by the function model.
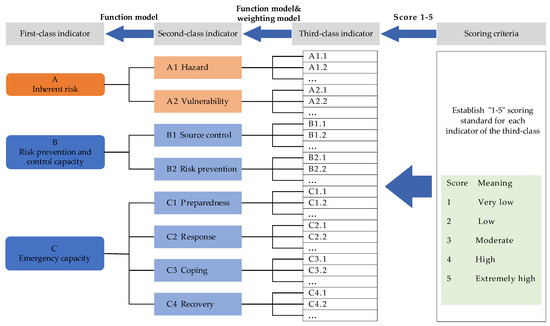
Figure 4.
The framework of urban safety and security assessment methodology.
However, the hazard elements of different disasters have distinctive characteristics, and the targeted third-class indicators and quantitative criteria should be formulated according to the specific disaster characteristics. Additionally, the hazard assessment methods for some disasters are already matured, so these methods should be preferred. If there are no mature hazard assessment methods, the weighting model proposed in this paper should be adopted.
3.2. Weighting Model
The weighting model is a common method of aggregating indicators in comprehensive evaluation and has been widely used in various kinds of assessments. In this paper, the weight used for the evaluation is determined by the combination of subjective and objective weight. The evaluation value of the second-class indicators of inherent risk, prevention and control capacity, and the evaluation value of emergency preparedness capacity are calculated by Equation (1):
where is the subjective weight of the i-th third-class indicator, calculated by the G1-method [10], with the range of [0, 1]; is the objective weight of the i-th third-class indicator, calculated by entropy weight method, with a range of [0, 1]; and are the weights of and , respectively, with the range of [0, 1], and satisfy the equation of ; is the evaluation value of the i-th third-class indicator, ; is the number of the third-class indicators. All of these parameters are dimensionless. This paper takes with the consideration that subjective weight and objective weight are equally important.
3.3. Function Model
Based on the logical relationship among the elements of urban safety and security assessment, we establish a risk assessment model for specific risk events, an emergency capacity assessment model for specific emergency events, and an urban safety and security assessment model for the whole area.
3.3.1. Risk Assessment Model for Specific Risk Events
- (1)
- Inherent risk (, )
Based on the risk quantification expression proposed by the United Nations [32], in general, the inherent risk is calculated by Equation (2):
where refers to the hazard evaluation value of the i-th event and refers to the vulnerability evaluation value of the i-th event. The two parameters are both dimensionless and calculated by Equation (1).
The inherent risk evaluation considering the comprehensive triggering effect is the base for screening critical emergency events. Due to the high concentration of people and buildings in urban areas, the amplification of the triggering effect on risks cannot be ignored. Therefore, the comprehensive triggering effect of the i-th event for k secondary events is introduced (only considering the first-class triggering effect), which is expressed by the risk enhancement coefficient . Finally, the inherent risk considering the comprehensive triggering effect is calculated by Equation (3):
where is the hazard evaluation value of the i-th event; is the vulnerability evaluation value of the i-th event; and is the risk enhancement coefficient of the i-th event with a range of [1, 1.5] and calculated by Equation (4). All of these parameters are dimensionless.
Considering the comprehensive triggering effect for k secondary events, the risk enhancement coefficient of the i-th event is calculated by Equation (4):
where is the comprehensive risk evaluation value of the i-th event considering the triggering effect, calculated by Equation (5), and is the dimensionless parameter with a range of [0, 25]. Here, is a coefficient by standardizing the comprehensive risk value () of multi-hazard risks from [0, 25] to [1, 1.5]. When , it means that there is no triggering effect; in other words, . In this paper, the upper limit of the triggering effect on risk amplification is set to 0.5, in which .
The comprehensive risk evaluation value of the i-th event considering the triggering effect for k secondary events is:
where, is the probability parameter of triggering effect caused by the i-th event, calculated by Equation (6), with a range of [0, 1]; is the inherent risk evaluation value of the j-th event in general, calculated by Equation (2), with a range of [1, 25]. These parameters are both dimensionless.
The probability parameter of the triggering effect caused by the i-th event is calculated by Equation (6):
where is the inherent risk evaluation value of the i-th event in general, calculated by Equation (2), and is the dimensionless parameter with a range of [1,25].
- (2)
- Residual risk ()
According to the logical relationship between the risk and the prevention and control capacity, the residual risk is calculated by Equation (7):
where is the source control capacity coefficient of the i-th event, is the risk prevention capacity coefficient of the i-th event, calculated by Equation (8), with a range of [0.8, 1]; is the risk enhancement coefficient of the i-th event, calculated by Equation (4), with a range of [1, 1.5]. All of these parameters are dimensionless.
and are a coefficient by standardizing the source control capacity evaluation value () and the risk prevention capacity evaluation value (), respectively, from [0, 5] to [0.8, 1]. In this paper, the maximum value of the capacity to mitigate risk is set to 0.2, in which . When , it means that capacity has little to do with risk, in other words, . and are calculated by Equation (8):
where represents or ; represents the source control capacity evaluation value () or the risk prevention capacity evaluation value () of the i-th event.
Evidently, the assessment models change the relatively uniform distribution of the original data. Taking the simplest Equation (2) as an example, the original value of and are uniformly distributed in [1, 5]. However, the value of multiplied by and is not uniformly distributed in [1, 25], but more concentrated in the region near value 5. Natural breaks based on clustering thinking are a reasonable classification method for non-uniformly distributed values [33]. Therefore, this paper uses the natural breaks to classify the evaluation value of inherent risk and residual risk, which are calculated by Equations (3) and (7), respectively, into five grades. The specific judgment criteria are shown in Table 1.

Table 1.
Judgment criteria of inherent risk and residual risk.
3.3.2. Emergency Capacity Assessment Model for Specific Emergency Events
The overall emergency capacity for specific emergency events is determined by the capacity of preparedness, response, coping, and recovery. Preparedness is the basic work in the early stage of dealing with emergency, including the establishment of emergency organizations, emergency plans, monitoring of risk sources, training, etc. In the terminology related to disaster risk reduction, response refers to actions taken directly before, during, or immediately after a disaster in order to save lives, reduce health impacts, ensure public safety, and meet the basic subsistence needs of the people affected [30]. However, in order to develop a better evaluation model, this paper redefines response by dividing it into two parts: actions taken from receiving alert information to arriving at the scene are defined as response, and actions taken from arriving at the scene to the end of the emergency are defined as coping. Recovery refers to actions that restore the normal functioning of the affected areas after the emergency.
The internal relationship of emergency capacities in each stage is shown in Figure 5. Disaster consequence is characterized as the changes of the hazard-bearing body from the normal state to the damaged or destroyed state. Coping capacity and recovery capacity are the factors that directly inhibit the state change of hazard-bearing body. Response capacity is the time factor that directly affects the state change of the hazard-bearing body. Preparedness capacity indirectly affects the state change of the hazard-bearing body by affecting the reliability of response, coping, and recovery. At the same time, response and coping are the pivotal capacities to control the development of events. Therefore, response capacity and coping capacity are evidently more important compared to recovery capacity.
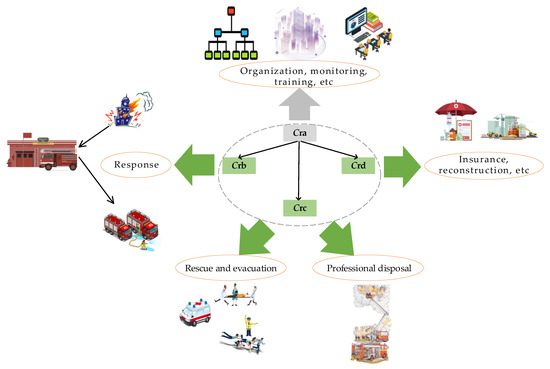
Figure 5.
Internal relationship between emergency capacity elements (taking fire rescue as an example).
Based on the analysis of the internal relationship among the emergency capacity elements, the overall emergency capacity of the i-th emergency event is calculated by Equation (9):
where is the reliability parameter of response capacity, coping capacity, and recovery capacity, calculated by Equation (10); is the evaluation value of response capacity, calculated by Equations (11) and (12); is the evaluation value of coping capacity, calculated by Equations (13)–(15); is the evaluation value of recovery capacity, calculated by Equations (16)–(18); , , are the weight of response capacity, coping capacity, and recovery capacity, respectively, with the range of [0, 1], and satisfy the equation of . All of these parameters are dimensionless, with a range of [0, 1].
is a coefficient found by standardizing the preparedness capacity evaluation value ()from [1, 5] to [0.2, 1] and is calculated by Equation (10):
where is the evaluation value of preparedness capacity.
The tasks of emergency coping can be divided into two categories: the first one is personnel rescue and evacuation; and the second one is professional disposal, such as fire extinction of high-rise buildings, risk elimination of dangerous chemical storage and transportation facilities, and rush-repair of power communication facilities. However, for different types of emergency events, the importance of the two tasks is different. For example, when long-distance oil and gas pipeline accidents happen in a sparsely populated area, the focus of rescue should be professional disposal. Whereas in most fire accidents happening in densely populated places, personnel rescue and evacuation and professional disposal are equally important.
In addition, response and coping capacity can be measured by the timeliness and effectiveness of rescue and disposal. Timeliness means the efficiency of response and coping. Effectiveness means the rescue and coping effect, which can be represented by the severity of the event consequences. Here, referring to the judgment criteria of natural and technological disasters in China, the event consequences are divided into five grades: particularly significant (Grade 5), significant (Grade 4), relatively large (Grade 3), general (Grade 2), and below general (Grade 1). Casualties, direct economic loss, and characteristic consequences (such as the burned area of forest fires, the amount of oil spill offshore, etc.) are used as evaluation indicators. Therefore, this paper analyzes the response efficiency and effectiveness of personnel rescue and evacuation tasks according to the casualties and analyzes the efficiency and effectiveness of professional disposal tasks according to direct economic loss or characteristic consequences.
Response capacity includes the response efficiency of personnel rescue and evacuation task and the response efficiency for the professional disposal task. Thus, the response capacity for the i-th event is calculated by Equation (11):
where and are the response efficiency parameters of personnel rescue and evacuation tasks and professional disposal tasks, respectively, calculated by Equation (12); and are the weight of personnel rescue and evacuation tasks and professional disposal tasks, respectively, and satisfy the equation of . All the parameters are dimensionless with a range of (0, 1].
Response capacity is represented by the efficiency of response tasks, which can be characterized by the relationship between the actual response time and the escalation time of event. In China, fire brigades are comprehensive rescue teams involved in the disposal of various emergencies at the earliest moment. According to Article 13 of China’s Construction Standard of Urban Fire Station, a basic requirement for fires stations is that fire brigades should reach the edge of the jurisdiction within 5 min after receiving instructions. Therefore, this paper assumes that if rescuers can reach the scene within 5 min, the response efficiency reaches the upper limit 1; if rescuers reach the scene after 5 min and are above or equal to 100 times of the escalation time of event, it means that the response efficiency is particularly low and reaches the lower limit 0.01. Then, the response efficiency parameter of the i-th event is calculated by Equation (12):
where represents the time from the occurrence of the event to the accident situation reaching the Grade 2 in minutes; represents the time from the occurrence of the event to the arrival of the first rescue or professional disposal personnel at the accident site in minutes.
Coping capacity is represented by the efficiency and effectiveness of coping tasks. Thus, the coping capacity for the i-th event is calculated by Equation (13):
where , and are efficiency parameters of personnel rescue and evacuation tasks and professional disposal tasks, respectively, calculated by Equation (14); and are effectiveness parameters of personnel rescue and evacuation tasks and professional disposal tasks, respectively, calculated by Equation (15); and are the weight of personnel rescue and evacuation tasks and professional disposal tasks, respectively, and satisfy the equation of . All of these parameters are dimensionless, with a range of (0, 1].
The efficiency of coping tasks is represented by the relationship between actual coping time and optimal coping time. If optimal coping time is no shorter than actual coping time, the coping efficiency reaches the upper limit 1. If the actual coping time is above or equal to 100 times of optimal coping time, it means that the coping efficiency is particularly low, and reaches the lower limit 0.01. Then, the efficiency parameters of personnel rescue and evacuation tasks and professional disposal tasks of the i-th event are calculated by Equation (14):
where represents the optimal time of rescue and disposal in minutes; represents the time from the arrival of the first rescue or personnel rescue team or professional disposal team to the end of rescue and disposal tasks in minutes.
The effectiveness of rescue and disposal tasks is represented by the increase in accident grade during coping emergency and can be calculated by Equation (15):
where represents the accident grade when the first personnel rescue team or professional disposal team arrives on the accident scene; represents the accident grade at the end of rescue and disposal tasks, . The two parameters are both dimensionless.
The post-disaster recovery process is complex and is affected by time, space, and many other variables [34]. The most direct characteristic factors of recovery capacity are recovery time and recovery degree, but these two factors are very difficult to quantify. However, it is certain that self-recovery capacity, social support, and government support are the three important aspects of the post-disaster recovery. Thus, the recovery capacity for the i-th event is calculated by Equation (16):
where is the overall damage degree parameter of the disaster area, , and the greater the damage degree, the worse the self-recovery capacity is; is the social support degree parameter, calculated by Equation (17), and is a dimensionless parameter with a range of [0, 1]; is the government support degree parameter and is the dimensionless parameter with a range of [0, 1]; , , and represent the weight of the self-recovery capacity, the social support degree, and the government support degree of the disaster area, respectively, and the three satisfy Equation (18).
Social forces, including mainly insurance agencies and social groups, can help the recovery of disaster areas such as funds, temporary physical assistance and long-term psychological assistance. Insurance, as a means of sharing the risk of disaster areas, plays an important role in post-disaster recovery. The effect of insurance in disaster recovery is easy to quantify. Therefore, this paper measures the degree of social support from the coverage rate and coverage degree of insurance and calculates the social support degree parameter by Equation (17):
where and represent the number of affected persons and affected property covered by the insurance, respectively; and represent the total number of affected persons and affected property, respectively; and represent the guarantee degree of the insurance for affected persons and affected property, respectively, which are both dimensionless and with a range of [0, 1]. However, and have a consistent unit, and the same for and .
In the process of post-disaster recovery, the worse the self-recovery capacity is, the more important the social and government support are. Here, the social support and government support are assumed to be equally important. However, no matter how seriously damaged the disaster area is, it cannot completely rely on the society and the government. Therefore, this paper sets the lower limit of self-recovery capacity as 0.2, which is obtained when the damage degree of the disaster area is 5. Finally, the weight of self-recovery capacity (), social support degree (), and government support degree () in disaster area should satisfy Equation (18):
Similarly to judgment criteria of inherent risk and residual risk, this paper uses the natural breaks to classify the evaluation value of emergency capacity, which is calculated by Equation (9) and into 5 grades. The specific judgment criteria are shown in Table 2.
Table 2.
Judgment criteria of emergency capacity.
3.3.3. Urban Safety and Security Assessment Model for the Whole Area
In the case of a critical hazard event, if the emergency capacity of the event is sufficient to resist the residual risk, the affected area will be in a relatively safe state. Therefore, this paper uses the ratio of emergency capacity grade value to residual risk grade value to measure the safety grade of the urban area in a single critical hazard event. Then, the urban safety and security evaluation value of the whole urban area is calculated by Equation (19):
where represents the residual risk grade value of the i-th critical hazard event; represents the emergency capacity grade value of the i-th critical hazard event; is the number of screened critical hazard events. All of these parameters are dimensionless.
Similarly to judgment criteria of inherent risk, residual risk, and emergency capacity, this paper uses the natural breaks to classify the evaluation value of urban safety and security, which is calculated by Equation (19) and divided into 5 grades. The specific judgment criteria are shown in Table 3.
Table 3.
Judgement criteria of urban safety and security.
4. Case Study
4.1. Overview of the Investigated Area
This paper takes an urban area in China’s Pearl River Delta Metropolitan Region (“Area A”) as an example for urban safety and security assessment. Area A is a coastal urban area in a low hilly area with high terrain in the northeast. It is surrounded by sea on three sides, and its forest coverage rate is over 70%. The sea area takes up about 300 square kilometers, accounting for approximately half of the total urban area, with a coast line over 120 km. There are about 60 rivers with a watershed area exceeding 1 km2, and the total length of the main rivers is nearly 200 km, while only 13 rivers have a watershed area exceeding 5 km2. The runoff, flow, and flood peaks of these rivers are closely tied to precipitation. Due to a subtropical marine monsoon climate, the average annual rainfall in the last five years was more than 1900 mm. Most of the urban area’s crucial rain is brought by the summer monsoon, which falls between April and September. Tourism, energy, and light industry are the main industries in this urban area.
This paper assesses the urban safety and security state of Area A in 2015 and 2020 based on geographical conditions, socio-economic characteristics, its five-year plan and execution report, and basic data of urban safety and security management. All information comes from the local government, selective enterprises, and field research.
4.2. Process
In this section, the specific assessment process will be introduced in three parts: risk assessment of major risk events, emergency capacity assessment of critical emergency events, and urban safety and security assessment of the whole area.
- (1)
- Risk assessment of major risk events
According to the assessment process described in Section 2.2, the risk assessment of major hazard events in Area A was carried out in three steps: risk identification, risk analysis, and risk evaluation.
- (i)
- Risk identification
There are many risk events in urban areas. In order to improve the efficiency of the assessment, the local authorities and the expert group jointly screened out the main hazard events in Area A according to local geographical features and industrial characteristics. As listed in Table 4, the main hazard events in Area A include five natural disasters and nine technological disasters.
Table 4.
The analysis process of the risk enhancement effect for main hazard events under the influence of triggering effect.
Some notes need to be made on major hazard events. First, the same hazard events in different industries have different risk characteristics, such as differences in hazards between dust explosions and hazardous chemical explosions, and differences in vulnerability to hazardous chemical explosions between production and transportation. Therefore, the difference of risk characteristics has been considered when selecting the major hazard events. Second, due to different administrative departments, fire accidents in assembly occupancies are divided into fire accidents in profit-oriented assembly occupancies (No. 13) and fire accidents in public assembly occupancies (No. 14).
- (ii)
- Risk analysis
First, we determined the weights and scores of risk, vulnerability, source management and control capacity, and risk prevention capacity of the 14 major hazard events and calculated the evaluation value using Equation (1). Second, we analyzed the trigger relationships among the major hazards based on the statistics in references [35,36] and the realities of Area A and then calculated the risk enhancement coefficient of the major hazard events under the triggering effect using Equations (2) and (6)–(8). The results of the risk enhancement coefficient () are shown in Table 4. Third, we calculated the inherent risk value () of the 14 major hazard events using Equation (3) and the residual risk value () for the major hazard events using Equations (4) and (5).
- (iii)
- Risk evaluation
After getting the inherent risk value () and the residual risk value () of the 14 major hazard events, the corresponding inherent risk grade and residual risk grade can be determined according to Table 1.
- (2)
- Emergency capacity assessment of critical emergency events
Critical emergency events (i.e., critical hazard events) are selected based on the criterion of inherent risk grade that reach “higher” and above. There were six categories of events in 2015 and nine categories in 2020. According to the assessment process described in Section 2.2, the emergency capacity assessment of critical emergency events in Area A was carried out in three steps: scenario construction, emergency capacity analysis, and emergency capacity evaluation.
- (i)
- Scenario construction
We take the case of an oil spill from waterborne transport of hazardous chemicals in 2020 to introduce the process of scenario construction. The event context is as follows: Vessel A (oil tanker, 2500 t oil capacity, 23 crew) entered the main channel from the anchorage for calling port at 8:10 pm; Vessel B (sandstone vessel, empty, 13 crew) completed unloading operations in port and departed for home. Because the radar was blocked by the island and the automatic identification system was switched off while Vessel B was underway off the coast, Vessel A collided with Vessel B, causing an oil spill. The key time points and response measures to the incident are shown in Table 5.
Table 5.
Overview of the process of an oil spill from a waterborne transport of hazardous chemicals.
- (ii)
- Emergency capacity analysis
First, we determined the weights and scores of emergency preparedness capacity indicators for critical emergency events and calculated their evaluation values using Equation (1). Second, by analyzing the evolution of the critical emergency events, we extracted the data of emergency response capacity, emergency coping capacity, and emergency recovery capacity and used it to calculate the emergency capacity evaluation values based on Equations (9)–(18).
Again, we take the case of the above-mentioned oil spill to introduce the process of emergency capacity analysis. The completion of oil clean-up is the end point of this emergency coping task, and subsequent pollution clean-up and wreck salvage are emergency recovery tasks. The incident resulted in three personal injuries, 550 t of oil spill (2000 t of oil at risk of secondary spillage), and approximately 12 km of coastline and 25 km2 area were contaminated. The process of basic data extraction and capacity analysis for the emergency capacity parameters are shown in Table 6. The final emergency capacity evaluation value () for the accident is calculated by Equation (9) to be 0.52.
Table 6.
Parameters and basic data for the analysis of emergency capacity in the oil spill from a waterborne transport of hazardous chemicals.
According to the emergency capacity analysis process of the oil spill from waterborne transport of hazardous chemicals in 2020, we calculated the emergency capacity evaluation value () of other critical emergency events in 2015 and 2020.
- (iii)
- Emergency capacity evaluation
After getting the emergency capacity value () of all the critical emergency events in 2015 and 2020, we determined the corresponding emergency capacity grade according to Table 2.
- (3)
- Urban safety and security assessment of the whole area
After obtaining the residual risk grades and emergency capacity grades for critical hazard events in 2015 and 2020, the urban safety and security evaluation values for 2015 and 2020 were calculated by Equation (19) respectively. Then, the urban safety and security grade was determined against the judgment criteria in Table 3.
4.3. Results
Table 7 summarizes the results of the urban safety and security assessment of Area A in 2015 and 2020, as can be seen from Table 7:
Table 7.
Urban safety and security assessment results ofArea A in 2015 and 2020.
In 2015, there were six types of critical hazard events, of which four types of safety and security grades under the influence of a single event were at grade 3 or above. Combining the grades of the six critical hazard events, the safety and security grade of the whole urban area is grade 2 (safety and security evaluation value of 1.26), which is an unsafe status.
In 2020, there were nine types of critical hazard events, and the safety and security grades under the influence of every single event were at grade 3 or above. The safety and security grade of the whole urban area is at grade 3 (safety and security evaluation value of 1.46), which is in a critical safe status.
The results of the risk assessment of 2015 and 2020 are shown in Figure 6. It can be found that:
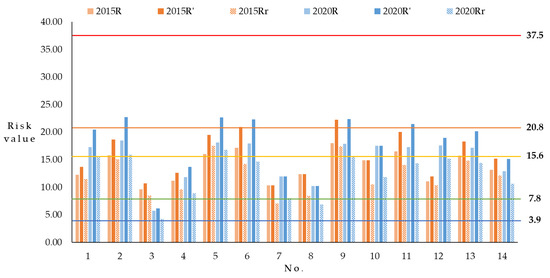
Figure 6.
The risk assessment results of the Area A in 2015 and 2020.
- (1)
- , considering the combined triggering effect, increased significantly compared to (by an average increase of 16.41% in 2015 and 18.65% in 2020), indicating that the combined triggering effect had a significant impact on risk.
- (2)
- was significantly lower (by an average decrease of 22.82% in 2015 and 30.02% in 2020) than , taking into account the combined triggering effect, indicating that prevention and control capacity has had a significant controlling effect on risk.
- (3)
- In 2020, the of 10 categories of hazard events, except No. 3, 7, 8, 14, increased to varying degrees compared to 2015, with an average increase of 19.63%.
Emergency capacity assessment results of Area A in 2015 and 2020 are shown in Table 8. It can be found that the number of critical hazard events in 2020 has increased significantly (by up to 50%) compared to 2015. However, at the same time, the percentage of critical hazard events with the emergency capacity grade reaching higher and above () has also increased significantly (by up to 50%). Overall, the average emergency capacity evaluation value in 2020 is approximately 41.67% higher than in 2015, indicating a significant increase in the emergency capacity in Area A.
Table 8.
Emergency capacity assessment results of Area A in 2015 and 2020.
5. Discussion
5.1. Analysis of the Overall Planning Impact on the Inherent Risk for Area A
From 2016 to 2020, the socio-economic development plan of Area A included three main aspects: ecology, economy, and livelihood. These aspects are closely related to the hazard of urban risks and the vulnerability of the hazard-bearing body and directly affect inherent risk. In terms of environmental protection, Area A proposed plans for forestry renovation projects and regional ecological restoration projects. In terms of economic development, Area A focused on three characteristic industries: tourism, biology, and marine, and proposed specific plans to build an intelligent, convenient, and efficient transportation system, to improve urban facilities, and to promote the construction of new urban infrastructure. In terms of people’s livelihood, Area A put forward specific planning goals in terms of education coverage, social security coverage, medical level, and service accessibility.
Considering the triggering effect, the inherent risk () is jointly determined by the hazard (), vulnerability (), and risk enhancement coefficient (). Figure 7 shows the analysis results of each hazard event in Area A in 2015 and 2020. Further comparative analysis results are shown in Table 9.
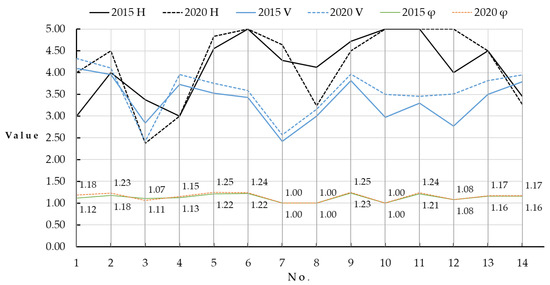
Figure 7.
Analysis results of inherent risk indicators in Area A in 2015 and 2020.
Table 9.
Comparative analysis results of inherent risk indicators in Area A in 2015 and 2020.
- (1)
- Except for landslide and lightning, the hazard risk of the other three natural disasters has increased, and the overall hazard risk of natural disasters has slightly increased. The improvement of ecology and environment has fundamentally reduced the probability and intensity of landslide and natural forest fires. The hazard risk of landslide has been significantly reduced (−29.59%). However, the booming tourism has caused significant hazard risks of forest fires due to human factors. Therefore, the hazard risk of forest fires still shows an upward trend (6.15%). At the same time, affected by the change of global climate, the hazard risks of typhoon and flood have increased significantly (33.33% and 12.50%, respectively) as well.
- (2)
- The changing trend of each technical disaster is different, and their overall hazard risk has increased slightly. Technical disasters related to hazardous chemicals have always been the critical technical disasters in Area A. Except for fire and explosion accident in road transport of dangerous chemicals (No. 9), other technical disasters related to dangerous chemicals all have the highest hazard evaluation values. Specific measures corresponding to Area A’s economic development orientation have improved the traffic conditions for vehicles loading dangerous chemicals. It reduced the probability of fire and explosion accident in road transport of dangerous chemicals (No. 9). Therefore, the hazard risk of such a disaster has decreased slightly (−4.66%). In addition, the number of urban construction projects in Area A has increased from 86 in 2015 to 178 in 2020. Large-scale construction projects have been launched throughout the urban area, and the hazard risk of construction accidents has increased significantly (25.00%).
- (3)
- Except for landslide, the vulnerability of the remaining 13 disasters has increased, and the vulnerability of all disasters has increased by 6.40% on average. This is mainly due to two factors. On the one hand, urban construction and development have increased the density of population, buildings, and infrastructure in some affected areas, leading to increased exposure of the hazard-bearing body. On the other hand, population aging and social income gap have increased, leading to a rise in the overall vulnerability level.
5.2. Analysis of the Special Safety Planning Impact on the Capacities for Area A
From 2016 to 2020, Area A’s special safety plan mainly involved three aspects: safety supervision capacity building, emergency capacity building, and safety culture promotion. It included nine main tasks and seven key projects. In terms of safety supervision capacity building, Area A proposed specific plans for the implementation of industry-wide hidden risk checks, disaster source management, risk investigation, and hierarchical management and control. In terms of emergency capacity building, Area A proposed measures such as improving the emergency command system, updating and perfecting emergency plans, optimizing the emergency material reserve system, and strengthening the construction of emergency rescue teams. In terms of safety culture promotion, Area A proposed plans for increasing the coverage and effectiveness of safety publicity and education.
Figure 8 shows the evaluation values of source control and risk prevention capacities of various hazard events in Area A in 2015 and 2020. It can be seen that the source control capacity () and risk prevention capacity () of various disasters in Area A have generally improved. Through further calculations, we find that, compared with 2015, the average increase of source control and risk prevention capacities in 2020 were 29.69% and 26.64%, respectively and both capacities were significantly enhanced. The main reason for this improvement is the application of various dynamic supervision systems for dangerous sources, mobile law enforcement platforms, and other technical means, which has increased the coverage and frequency of supervision by industry authorities and the source control capacity. The construction and maintenance of natural disaster prevention and mitigation infrastructure, such as flood control facilities and lightning protection facilities; the installation and upgrading of fire safety facilities, such as smoke detection alarms and automatic sprinkler systems in crowded places; as well as the diversification of publicity and education, have all improved the risk prevention capacity of hazard-bearing bodies.
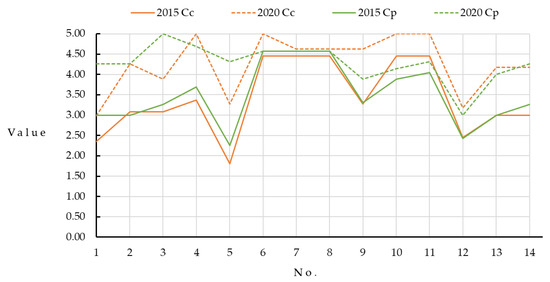
Figure 8.
Evaluation results of relevant indicators of prevention and control capacity in Area A in 2015 and 2020.
Table 10 shows the analysis results of the second-class indicators of emergency capacity for each critical hazard event in Area A in 2015 and 2020. As can be seen from Table 10, the average value of emergency preparedness, response, coping, and recovery capacities of Area A in 2020 have shown a significant upward trend compared to the one in 2015. The average increase of emergency preparedness and response capacities is relatively large, and the overall emergency capacity is significantly enhanced. However, we also found that, in terms of the individual second-class indicators of emergency capacity, the changes in the capacities of each critical hazard event show significant differences.
Table 10.
Evaluation results of each secondary assessment indicator of emergency capacity in 2015 and 2020.
The emergency preparedness and response capacities of Area A in 2020 are generally at the highest level (grade 5) and are significantly improved compared with 2015. The main reason is that during the implementation of the plan in Area A, it not only established an emergency command system for various emergencies, which systematically updated and improved the four-class emergency plan system for districts, streets, communities, and enterprises, but also strengthened the monitoring and early warning techniques for various disasters. Therefore, the emergency preparedness capacity of various risks greatly improved. Outstandingly, the emergency preparedness capacity for fire and explosion accident in road transport of dangerous chemicals (No. 9) has increased by up to 131.72%. The main reason is that during the implementation of the plan in Area A, it not only established special emergency command organization and corresponding emergency plans but also incorporated hazardous chemical transportation vehicles throughout the region into the dynamic supervision system, thereby greatly improving emergency preparedness capacity. The significant improvement in emergency response capacity benefited from not only the improvement of the emergency on-duty system but, more importantly, the overall optimization of the road network in the whole area, which has greatly improved the efficiency of emergency response. However, the emergency response of the oil spills in water transportation (No. 10) still faces problems, such as more blind spots in sea area communication and insufficient number of marine patrol vessels, and therefore, the emergency response capacity is at a low level.
Compared with 2015, the overall emergency coping capacity of Area A in 2020 improved, but the range of changes in the capacity of diverse critical hazard events is significantly different. During the implementation of the plan, the number of emergency equipment (especially for hazardous chemical accidents) has increased with the performance enhanced. The number of professional rescue teams and expert teams, such as forest fire fighting, professional rescue for hazardous chemical accidents, and various special rescues (for electric power facilities, communication facilities, roads, bridges, etc.) have increased with the capacity strengthened. The emergency coping capacity of all disasters has improved to varying degrees. Compared with the other critical hazard events, flooding (No. 2) and chemical spills in pipeline transportation (No. 11) were already at a high level in 2015. Therefore, the increase in 2020 was relatively low.
Similar to the emergency coping capacity, compared with 2015, the emergency recovery capacity of Area A in 2020 presents the characteristics of a significant overall improvement and obvious differences in the change magnitude. On the whole, during the implementation of the plan, the level of basic livelihood security, such as healthcare and education, has been improved. The coverage rate and degree of social insurance, such as medical insurance, employment injury insurance, and career insurance, have increased and deepened, enhancing the self-recovery capacity and social support of the disaster area. Meanwhile, the government’s natural disaster relief plan has increased the government support for major natural disasters, so the overall emergency recovery capacity has improved. The variation range of the emergency recovery capacity of each event is also mainly affected by the base size (the value of the emergency recovery capacity in 2015).
6. Conclusions
Due to the intertwining of risks, systematically and efficiently assessing the urban safety and security under the effect of multi-hazard risks is significant. It will provide a strong guarantee for the systematic and targeted counter-measures of urban safety and security development. The assessment of urban safety and security requires not only a comprehensive analysis of all risk events within a certain time and space, but also an in-depth analysis of the emergency capacity of critical emergency events. This paper proposes the idea of “overall screening, key analysis, and comprehensive evaluation” for urban safety and security assessment and, on this basis, constructs the framework of urban safety and security assessment methodology. The proposed methodology framework, which is composed of a weighting model and a function model, can provide rapid assessment of various hazard events, effective screening and in-depth analysis of critical hazard events, and evaluatation of the overall urban safety and security of the area. In the overall risk assessment stage, the weighting model is used to calculate the evaluation value of secondary indicators, and then, the inherent risk and residual risk of specific hazard events can be quickly assessed by the risk assessment model considering comprehensive triggering effect. In the emergency capacity assessment stage, the weighting model is only used to calculate the evaluation value of emergency preparedness capacity, while the evaluation model considering the evolution process of emergency is used to calculate the emergency capacities of response, coping, and recovery. The latter three emergency capacities need to be deeply analyzed through scenario construction to make the evaluation results more accurate. In the comprehensive assessment stage, the urban safety and security evaluation value considering the comprehensive effect of all critical hazard events represents the overall safety and security state of the urban area.
This paper applies the proposed methodology framework to the urban safety and security assessment of a coastal urban area in China and analyzes the effectiveness of the measures by comparing the urban safety and security assessment results before and after the implementation. The application results show that the proposed methodology can reflect the objective situation of the assessment area and help to analyze the implementation effect of urban safety and security management measures, which proves the methodology to be operable and instructive. However, in the process of application, it is also found that the in-depth analysis of critical hazard events has high professional requirements. Therefore, the cooperation of the government, front-line employees, experts, and scholars will help to improve the accuracy of the assessment. In addition, as many scholars have pointed out, the assessment indicators and their judgment criteria have a scale effect [13,37]. In practical application, we should reasonably select the indicators according to the assessment object and formulate targeted judgment criteria.
Author Contributions
G.C. administrated and supervised this study, acquired funding and data, and provided suggestions on the manuscript. Q.Y. developed the methodology and its application, analyzed the results, drafted the manuscript, and finalized it. X.C. contributed to manuscript writing and proofreading. K.H. and T.Z. provided suggestions on the manuscript and polished the manuscript. Z.Y. provided suggestions on this study. All authors have read and agreed to the published version of the manuscript.
Funding
This study was supported by Science and Technology Planning Project of Guangdong Province, China (2019B020208011), and the China Scholarship Council (201906150057 and 202006150080).
Data Availability Statement
The data presented in this study are available on request from the corresponding author. The data are not publicly available due to confidentiality.
Acknowledgments
Acknowledgment is due to the local authorities and expert groups of Area A, as well as to all contributors.
Conflicts of Interest
The authors declare no conflict of interest.
References
- Marana, P.; Eden, C.; Eriksson, H.; Grimes, C.; Hernantes, J.; Howick, S.; Labaka, L.; Latinos, V.; Lindner, R.; Majchrzak, T. Towards a resilience management guideline—Cities as a starting point for societal resilience. Sustain. Cities Soc. 2019, 48, 1–19. [Google Scholar] [CrossRef]
- Marc, V.; Beniamino, R.; Martínez-Gomariz, E. Integrated Assessment of Climate Change Impacts and Urban Resilience: From Climate and Hydrological Hazards to Risk Analysis and Measures. Sustainability 2020, 12, 6430. [Google Scholar] [CrossRef]
- Lacinák, M.; Ristvej, J. Smart City, Safety and Security. Procedia Eng. 2017, 192, 522–527. [Google Scholar] [CrossRef]
- Ristvej, J.; Lacinák, M.; Ondrejka, R. On Smart City and Safe City Concepts. Mob. Netw. Appl. 2020, 25, 836–845. [Google Scholar] [CrossRef]
- United Nations Office for Disaster Risk Reduction. Global Assessment Report on Disaster Risk Reduction. 2019. Available online: https://gar.undrr.org/report-2019 (accessed on 1 December 2020).
- Hizbaron, D.R.; Baiquni, M.; Sartohadi, J.; Rijanta, R. Urban Vulnerability in Bantul District, Indonesia—Towards Safer and Sustainable Development. Sustainability 2012, 4, 2022–2037. [Google Scholar] [CrossRef]
- Hadumaon, S.T.; Purhadi, P.; Suhartono, S.; Hamonangan, R. Social vulnerability to natural hazards in Indonesia: Driving factors and policy implications. Nat. Hazards 2014, 70, 1603–1617. [Google Scholar] [CrossRef]
- Xuesong, G.; Naim, K. Assessing social vulnerability to earthquake disaster using rough analytic hierarchy process method: A case study of Hanzhong City, China. Saf. Sci. 2020, 125, 104625. [Google Scholar] [CrossRef]
- Nuthammachot, N.; Stratoulias, D. Multi-criteria decision analysis for forest fire risk assessment by coupling AHP and GIS: Method and case study. Environ. Dev. Sustain. 2021, 1–16. [Google Scholar] [CrossRef]
- Lou, T. Risk assessment and application of dust explosion risk in industrial enterprises based on SCL and G1 methods. In Proceedings of the 34th Annual Conference of the Asia-Pacific Occupational Safety and Health Organization (APOSHO), Guiyang, China, 5–8 September 2019. [Google Scholar] [CrossRef]
- Sepehri, M.; Malekinezhad, H.; Hosseini, S.Z.; Ildoromi, A.R. Assessment of flood hazard mapping in urban areas using entropy weighting method: A case study in Hamadan city, Iran. Acta Geophys. 2019, 67, 1435–1449. [Google Scholar] [CrossRef]
- Qi, K.; Wang, Q.; Duan, Q.; Gong, L.; Sun, J.; Liew, K.M.; Jiang, L. A multi criteria comprehensive evaluation approach for emergency response capacity with interval 2-tuple linguistic information. Appl. Soft Comput. 2018, 72, 419–441. [Google Scholar] [CrossRef]
- Cutter, S.L.; Burton, C.G.; Emrich, C.T. Disaster Resilience Indicators for Benchmarking Baseline Conditions. J. Homel. Secur. Emerg. Manag. 2010, 7, 1–22. [Google Scholar] [CrossRef]
- Duzgun, H.S.B.; Yucemen, M.S.; Kalaycioglu, H.S.; Celik, K.; Kemec, S.; Ertugay, K.; Deniz, A. An integrated earthquake vulnerability assessment framework for urban areas. Nat. Hazards 2011, 59, 917–947. [Google Scholar] [CrossRef]
- Carreño, M.L.; Cardona, O.D.; Barbat, A.H. New methodology for urban seismic risk assessment from a holistic perspective. Bull. Earthq. Eng. 2012, 10, 547–565. [Google Scholar] [CrossRef]
- Guodong, W.; Aihua, Y.; Ruifang, H.; Binbin, C.; Yang, Y.; Shuhao, G. Research and practice of urban safety risk assessment method system. China Saf. Sci. J. 2019, 15, 46–50. [Google Scholar] [CrossRef]
- Qiang, Z.; Jianzhong, Z.; Chao, Z. Flood disaster risk analysis based on principle of maximum entropy and attribute interval recognition theory. Adv. Water Sci. 2012, 23, 323–333. [Google Scholar] [CrossRef]
- Kameshwar, S.; Cox, D.T.; Barbosa, A.R.; Farokhnia, K.; Park, H.; Alam, M.S. Probabilistic decision-support framework for community resilience: Incorporating multi-hazards, infrastructure interdependencies, and resilience goals in a Bayesian network. Reliab. Eng. Syst. Saf. 2019, 191, 10656. [Google Scholar] [CrossRef]
- Verseveld, H.; Dongeren, A.; Plant, N.G.; Jger, W.S.; Heijer, C.D. Modelling multi-hazard hurricane damages on an urbanized coast with a Bayesian Network approach—ScienceDirect. Coast. Eng. 2015, 103, 1–14. [Google Scholar] [CrossRef]
- Rong, L.; Liu, Y. Modeling the evaluation for regional disaster chain risk based on elements at risk. J. Syst. Eng. 2019, 34, 132–146. [Google Scholar] [CrossRef]
- Tao, Z.; Guohua, C.; Reniers, G.; Yunfeng, Y. Methodology for quantitative risk analysis of domino effects triggered by flood. Process Saf. Environ. Prot. 2021, 147, 866–877. [Google Scholar] [CrossRef]
- Maxx, D.; Robert, C.; Uwe, D.; Arthur, L.; Margaret, A. Natural Disaster Hotspots: A Global Risk Analysis; World Bank Group: Washington, DC, USA, 2005; pp. 35–60. [Google Scholar]
- Birkmann, J.W. Torsten Assessing the risk of loss and damage: Exposure, vulnerability and risk to climate-related hazards for different country classifications. Int. J. Glob. Warm. 2015, 8, 191–212. [Google Scholar] [CrossRef]
- Zánická Hollá, K.; Ristvej, J.; Šimák, L. Systematic method of risk assessment in industrial processes. In Risk Analysis VII: Simulation and Hazard Mitigation—Southampton; WIT Transaction on Information and Communication Technologies; WIT Press: Southampton, UK, 2010; Volume 43, pp. PI115–PI126. ISBN 9781845644727. [Google Scholar] [CrossRef]
- Wang, W.; Xia, C.; Ma, D.; Su, J. Multi-hazard comprehensive risk assessment based on coupling incentive mechanism. China Saf. Sci. J. 2019, 29, 251–264. [Google Scholar] [CrossRef]
- Almeida, M.C.; Telhado, M.J.; Morais, M.; Barreiro, J.; Lopes, R. Urban resilience to flooding: Triangulation of methods for hazard identification in urban areas. Sustainability 2020, 12, 2227. [Google Scholar] [CrossRef]
- Li, J.; Chen, C. Modeling the dynamics of disaster evolution along causality networks with cycle chains. Physical A 2014, 401, 251–264. [Google Scholar] [CrossRef]
- Sagara, B. Resilience Measurement Practical Guidance Note Series 2: Measuring Shocks and Stresses; US Agency for International Development: Washington, DC, USA, 2018; pp. 2–4.
- United Nations Office for Disaster Risk Reduction. Sendai Framework for Disaster Risk Reduction 2015–2030. 2015. Available online: https://www.ifrc.org/docs/IDRL/Sendai_Framework_for_Disaster_Risk_Reduction_2015-2030 (accessed on 1 December 2020).
- United Nations Office for Disaster Risk Reduction. Report of the Open-Ended Intergovernmental Expert Working Group on Indicators and Terminology Relating to Disaster Risk Reduction. 2016. Available online: https://www.preventionweb.net/files/50683_oiewgreportenglish (accessed on 1 December 2020).
- ISO 31000. Risk Management—Guideline; The International Organization for Standardization: Switzerland, Switzerland, 2018. [Google Scholar]
- Pappa, M. Social Vulnerability to Coastal Floods in Denmark: Investigating the Spatial Patterns among the Danish. 2019. Available online: https://projekter.aau.dk/projekter/files/307155336/PappaMariathesis.pdf (accessed on 1 December 2020).
- Jenks Natural Breaks Classification. Available online: http://wiki.gis.com/wiki/index.php/Jenks_Natural_Breaks_Classification (accessed on 2 March 2021).
- Caverzan, A.; Solomos, G. Review on Resilience in Literature and Standards for Critical Built-Infrastructure; Publications Office of the European Union: Luxembourg, 2014; pp. 1–41. [Google Scholar] [CrossRef]
- Tilloy, A.; Malamud, B.D.; Winter, H.; Joly-Laugel, A. A review of quantification methodologies for multi-hazard interrelationships. Earth Sci. Rev. 2019, 196, 102881. [Google Scholar] [CrossRef]
- Ricci, F.; Moreno, V.C.; Cozzani, V. A comprehensive analysis of the occurrence of Natech events in the process industry. Process Saf. Environ. Prot. 2021, 147, 703–713. [Google Scholar] [CrossRef]
- Fang, Y.; Qin, D.; Ding, Y. Global main approaches of risk and vulnerability assessment and implementation in scale transformation. Arid Land Geogr. 2009, 32, 319–326. [Google Scholar] [CrossRef]
Publisher’s Note: MDPI stays neutral with regard to jurisdictional claims in published maps and institutional affiliations. |
© 2021 by the authors. Licensee MDPI, Basel, Switzerland. This article is an open access article distributed under the terms and conditions of the Creative Commons Attribution (CC BY) license (https://creativecommons.org/licenses/by/4.0/).