
Exploratory Analysis of Urban Sustainability by Applying a Strategy-Based Tailor-Made Weighting Method


Abstract
1. Introduction
- Kiss (2015) [28] performed a detailed analysis of energy-related interventions from Pécs, Hungary. Although his paper focused on a given sustainability aspect at the city level, it cannot be treated as a comprehensive urban sustainability analysis;
- Sebestyén, Somogyi, Szőke, and Utasi (2018) [29] used the SDEWES index to describe the sustainability of two Hungarian cities by involving 35 indicators in 7 categories. It is unquestionably a comparison-based analysis; however, the applied methodology is not unique concerning the Hungarian context; furthermore, it encompasses only two cities;
- Ehnert, Frantzeskaki et al. (2018) [10] analyzed five European cities (one of them was Budapest) in terms of urban sustainability transition aspects by comparing planning-oriented activities;
- three Hungarian cities, namely Győr, Pécs, and Miskolc, have been involved in governance- and development-oriented analysis conducted by Lux (2015) [30];
- Bajmócy, Gébert, Málovics, Berki, and Juhász (2020) [31] assessed urban strategic planning issues in Hungary by paying attention to practice-oriented features of Pécs, Szeged, and Kecskemét;
- Kovács et al. (2019) [32] focused on urban sprawl patterns in case of Budapest as one of the most relevant sustainability challenges regarding the Hungarian capital;
- finally, Buzási and Jäger (2020) [33] applied a 30-indicator assessment methodology to describe the overall and sustainability dimensions-related performance of the districts of Budapest.
2. Materials and Methods
3. Results
4. Discussion
- firstly, the indicator selection process is always a crucial point of sustainability analyses. In this study, 30 indicators have been involved, paying attention to a wide range of urban sustainability, proven by correlation analysis. Although the selected variables are closely related to universal sustainability dimensions, such as economic, social and environmental aspects, they reflect the Hungarian urban context. In this matter, selected indicators are context-specific based on their availability; however, generalization is feasible because the covered sustainability aspects and challenges are quite similar in the developed world, especially in the Central-Eastern European region. Because the indicator collection process was based on data availability, using the database of the Central Statistical Office, the analysis can be expanded to other municipalities in Hungary.
- Secondly, the applied SBTM weighting methodology refers to the perception of different urban planners and decision-makers through identifying the weights from the emphases of urban development strategies. Selecting weighting methodology is always a subjective process, although the widely accepted and applied methods try to reduce this subjectivity by using mathematical solutions to define weights. Nevertheless, in this study, a tailor-made weighting process was elaborated and selected to reveal the most relevant sustainability issues regarding each selected city without overrepresenting any aspects. According to the Government Decree 314/2012 (8 November), developing an Integrated Settlement Development Strategy is compulsory at the urban level; consequently, this analysis can be repeated in every Hungarian city based on the structure of the medium-term goals of their development strategies.
- Finally, composite indices concerning such a complex issue as urban sustainability often hide the microscale aspects behind the overall value. Furthermore, city-scale assessments cannot be applied to distinguish complicated socioeconomic and environmental indicators. Nevertheless, the comparative analysis conducted in this study was devoted to defining the main spatiotemporal differences regarding selected Hungarian studies by providing insight about comprehensive sustainability issues. However, further analysis might pay attention to district-scale evaluation, although, data availability of socioeconomic valuables for Hungarian cities (except Budapest) is limited from this analysis perspective.
5. Conclusions
Author Contributions
Funding
Institutional Review Board Statement
Informed Consent Statement
Conflicts of Interest
References
- Ali-Toudert, F.; Ji, L. Modeling and measuring urban sustainability in multi-criteria based systems—A challenging issue. Ecol. Indic. 2017, 73, 597–611. [Google Scholar] [CrossRef]
- Durrant, R.; Barnes, J.; Kern, F.; Mackerron, G. The acceleration of transitions to urban sustainability: A case study of Brighton and Hove. Eur. Plan. Stud. 2018, 26, 1537–1558. [Google Scholar] [CrossRef]
- Elmqvist, T.; Andersson, E.; Frantzeskaki, N.; McPhearson, T.; Olsson, P.; Gaffney, O.; Takeuchi, K.; Folke, C. Sustainability and resilience for transformation in the urban century. Nat. Sustain. 2019, 2, 267–273. [Google Scholar] [CrossRef]
- Akande, A.; Cabral, P.; Gomes, P.; Casteleyn, S. The Lisbon ranking for smart sustainable cities in Europe. Sustain. Cities Soc. 2019, 44, 475–487. [Google Scholar] [CrossRef]
- Petit-Boix, A.; Llorach-Massana, P.; Sanjuan-Delmás, D.; Sierra-Pérez, J.; Vinyes, E.; Gabarrell, X.; Rieradevall, J.; Sanyé-Mengual, E. Application of life cycle thinking towards sustainable cities: A review. J. Clean. Prod. 2017, 166, 939–951. [Google Scholar] [CrossRef]
- Yigitcanlar, T.; Dur, F.; Dizdaroglu, D. Towards prosperous sustainable cities: A multiscalar urban sustainability assessment approach. Habitat Int. 2015, 45, 36–46. [Google Scholar] [CrossRef]
- Cohen, M. A systematic review of urban sustainability assessment literature. Sustainability 2017, 9, 2048. [Google Scholar] [CrossRef]
- Verma, P.; Raghubanshi, A.S. Urban sustainability indicators: Challenges and opportunities. Ecol. Indic. 2018, 93, 282–291. [Google Scholar] [CrossRef]
- Albrechts, L.; Barbanente, A.; Monno, V. Practicing transformative planning: The territory-landscape plan as a catalyst for change. City Territ. Archit. 2020, 7, 1–13. [Google Scholar] [CrossRef]
- Ehnert, F.; Frantzeskaki, N.; Barnes, J.; Borgström, S.; Gorissen, L.; Kern, F.; Strenchock, L.; Egermann, M. The acceleration of urban sustainability transitions: A comparison of Brighton, Budapest, Dresden, Genk, and Stockholm. Sustainability 2018, 10, 612. [Google Scholar] [CrossRef]
- Deng, D.; Liu, S.; Wallis, L.; Duncan, E.; McManus, P. Urban Sustainability Indicators: How do Australian city decision makers perceive and use global reporting standards? Aust. Geogr. 2017, 48, 401–416. [Google Scholar] [CrossRef]
- Steiniger, S.; Wagemann, E.; de la Barrera, F.; Molinos-Senante, M.; Villegas, R.; de la Fuente, H.; Vives, A.; Arce, G.; Herrera, J.C.; Carrasco, J.A.; et al. Localising urban sustainability indicators: The CEDEUS indicator set, and lessons from an expert-driven process. Cities 2020, 101, 102683. [Google Scholar] [CrossRef]
- Huang, L.; Yan, L.; Wu, J. Assessing urban sustainability of Chinese megacities: 35 years after the economic reform and open-door policy. Landsc. Urban Plan. 2016, 145, 57–70. [Google Scholar] [CrossRef]
- Michael, F.L.; Noor, Z.Z.; Figueroa, M.J. Review of urban sustainability indicators assessment—Case study between Asian countries. Habitat Int. 2014, 44, 491–500. [Google Scholar] [CrossRef]
- Regmi, M.B. Measuring sustainability of urban mobility: A pilot study of Asian cities. Case Stud. Transp. Policy 2020, 8, 1224–1232. [Google Scholar] [CrossRef]
- Cortinovis, C.; Haase, D.; Zanon, B.; Geneletti, D. Is urban spatial development on the right track? Comparing strategies and trends in the European Union. Landsc. Urban Plan. 2019, 181, 22–37. [Google Scholar] [CrossRef]
- Gonzalez-Garcia, S.; Manteiga, R.; Moreira, M.T.; Feijoo, G. Assessing the sustainability of Spanish cities considering environmental and socio-economic indicators. J. Clean. Prod. 2018, 178, 599–610. [Google Scholar] [CrossRef]
- Sartison, K.; Artmann, M. Edible cities—An innovative nature-based solution for urban sustainability transformation? An explorative study of urban food production in German cities. Urban For. Urban Green. 2020, 49, 126604. [Google Scholar] [CrossRef]
- Altamirano-Avila, A.; Martínez, M. Urban sustainability assessment of five Latin American cities by using SDEWES index. J. Clean. Prod. 2021, 287, 125495. [Google Scholar] [CrossRef]
- Currie, P.K.; Musango, J.K. African Urbanization: Assimilating Urban Metabolism into Sustainability Discourse and Practice. J. Ind. Ecol. 2017, 21, 1262–1276. [Google Scholar] [CrossRef]
- Nagendra, H.; Bai, X.; Brondizio, E.S.; Lwasa, S. The urban south and the predicament of global sustainability. Nat. Sustain. 2018, 1, 341–349. [Google Scholar] [CrossRef]
- Xu, G.; Dong, T.; Cobbinah, P.B.; Jiao, L.; Sumari, N.S.; Chai, B.; Liu, Y. Urban expansion and form changes across African cities with a global outlook: Spatiotemporal analysis of urban land densities. J. Clean. Prod. 2019, 224, 802–810. [Google Scholar] [CrossRef]
- Duinker, P.N.; Ordóñez, C.; Steenberg, J.W.N.; Miller, K.H.; Toni, S.A.; Nitoslawski, S.A. Trees in canadian cities: Indispensable life form for urban sustainability. Sustainability 2015, 7, 7379–7396. [Google Scholar] [CrossRef]
- Opp, S.M. The forgotten pillar: A definition for the measurement of social sustainability in American cities. Local Environ. 2017, 22, 286–305. [Google Scholar] [CrossRef]
- Opp, S.M.; Saunders, K.L. Pillar Talk: Local Sustainability Initiatives and Policies in the United States—Finding Evidence of the “Three E’s”: Economic Development, Environmental Protection, and Social Equity. Urban Aff. Rev. 2013, 49, 678–717. [Google Scholar] [CrossRef]
- Hu, R. Sustainability and competitiveness in Australian cities. Sustainability 2015, 7, 1840–1860. [Google Scholar] [CrossRef]
- Thornton, A. “The Lucky country”? A critical exploration of community gardens and city–community relations in Australian cities. Local Environ. 2017, 22, 969–985. [Google Scholar] [CrossRef]
- Kiss, V.M. Modelling the energy system of Pécs—The first step towards a sustainable city. Energy 2015, 80, 373–387. [Google Scholar] [CrossRef]
- Sebestyén, V.; Somogyi, V.; Szőke, S.; Utasi, A. Adapting the SDEWES Index to Two Hungarian Cities. Hungarian J. Ind. Chem. 2018, 45, 49–59. [Google Scholar] [CrossRef]
- Lux, G. Minor Cities in a Metropolitan World: Challenges for Development and Governance in Three Hungarian Urban Agglomerations. Int. Plan. Stud. 2015, 20, 21–38. [Google Scholar] [CrossRef]
- Bajmócy, Z.; Gébert, J.; Málovics, G.; Berki, B.M.; Juhász, J. Urban Strategic Planning from the Perspective of Well-Being: Evaluation of the Hungarian Practice. Eur. Spat. Res. Policy 2020, 27, 221–241. [Google Scholar] [CrossRef]
- Kovács, Z.; Farkas, Z.J.; Egedy, T.; Kondor, A.C.; Szabó, B.; Lennert, J.; Baka, D.; Kohán, B. Urban sprawl and land conversion in post-socialist cities: The case of metropolitan Budapest. Cities 2019, 92, 71–81. [Google Scholar] [CrossRef]
- Buzási, A.; Jäger, B.S. District-scale assessment of urban sustainability. Sustain. Cities Soc. 2020, 62, 102388. [Google Scholar] [CrossRef]
- Corredor-Ochoa, Á.; Antuña-Rozado, C.; Fariña-Tojo, J.; Rajaniemi, J. Challenges in assessing urban sustainability. Urban Ecol. 2020, 355–374. [Google Scholar] [CrossRef]
- Ahvenniemi, H.; Huovila, A.; Pinto-Seppä, I.; Airaksinen, M. What are the differences between sustainable and smart cities? Cities 2017, 60, 234–245. [Google Scholar] [CrossRef]
- Feleki, E.; Vlachokostas, C.; Moussiopoulos, N. Characterisation of sustainability in urban areas: An analysis of assessment tools with emphasis on European cities. Sustain. Cities Soc. 2018, 43, 563–577. [Google Scholar] [CrossRef]
- Gouda, A.A.; Masoumi, H.E. Certifications systems as independent and rigorous tools for assessing urban sustainability. Int. J. Urban Sci. 2018, 22, 308–321. [Google Scholar] [CrossRef]
- Merino-Saum, A.; Halla, P.; Superti, V.; Boesch, A.; Binder, C.R. Indicators for urban sustainability: Key lessons from a systematic analysis of 67 measurement initiatives. Ecol. Indic. 2020, 119, 106879. [Google Scholar] [CrossRef]
- Gan, X.; Fernandez, I.C.; Guo, J.; Wilson, M.; Zhao, Y.; Zhou, B.; Wu, J. When to use what: Methods for weighting and aggregating sustainability indicators. Ecol. Indic. 2017, 81, 491–502. [Google Scholar] [CrossRef]
- Sharifi, A.; Dawodu, A.; Cheshmehzangi, A. Neighborhood Sustainability Assessment Tools: A Review of Success Factors. J. Clean. Prod. 2021, 67, 125912. [Google Scholar] [CrossRef]
- Tao, Y.; Li, F.; Crittenden, J.; Lu, Z.; Ou, W.; Song, Y. Measuring urban environmental sustainability performance in China: A multi-scale comparison among different cities, urban clusters, and geographic regions. Cities 2019, 94, 200–210. [Google Scholar] [CrossRef]
- Farinha, F.; Oliveira, M.J.; Silva, E.M.J.; Lança, R.; Pinheiro, M.D.; Miguel, C. Selection process of sustainable indicators for the Algarve region-OBSERVE project. Sustainability 2019, 11, 444. [Google Scholar] [CrossRef]
- Sdoukopoulos, A.; Pitsiava-Latinopoulou, M.; Basbas, S.; Papaioannou, P. Measuring progress towards transport sustainability through indicators: Analysis and metrics of the main indicator initiatives. Transp. Res. Part D Transp. Environ. 2019, 67, 316–333. [Google Scholar] [CrossRef]
- Shi, Y.; Ge, X.; Yuan, X.; Wang, Q.; Kellett, J.; Li, F.; Ba, K. An Integrated Indicator System and Evaluation Model for Regional Sustainable Development. Sustainability 2019, 11, 2183. [Google Scholar] [CrossRef]
- Marquez-Ballesteros, M.J.; Mora-López, L.; Lloret-Gallego, P.; Sumper, A.; Sidrach-de-Cardona, M. Measuring urban energy sustainability and its application to two Spanish cities: Malaga and Barcelona. Sustain. Cities Soc. 2019, 45, 335–347. [Google Scholar] [CrossRef]


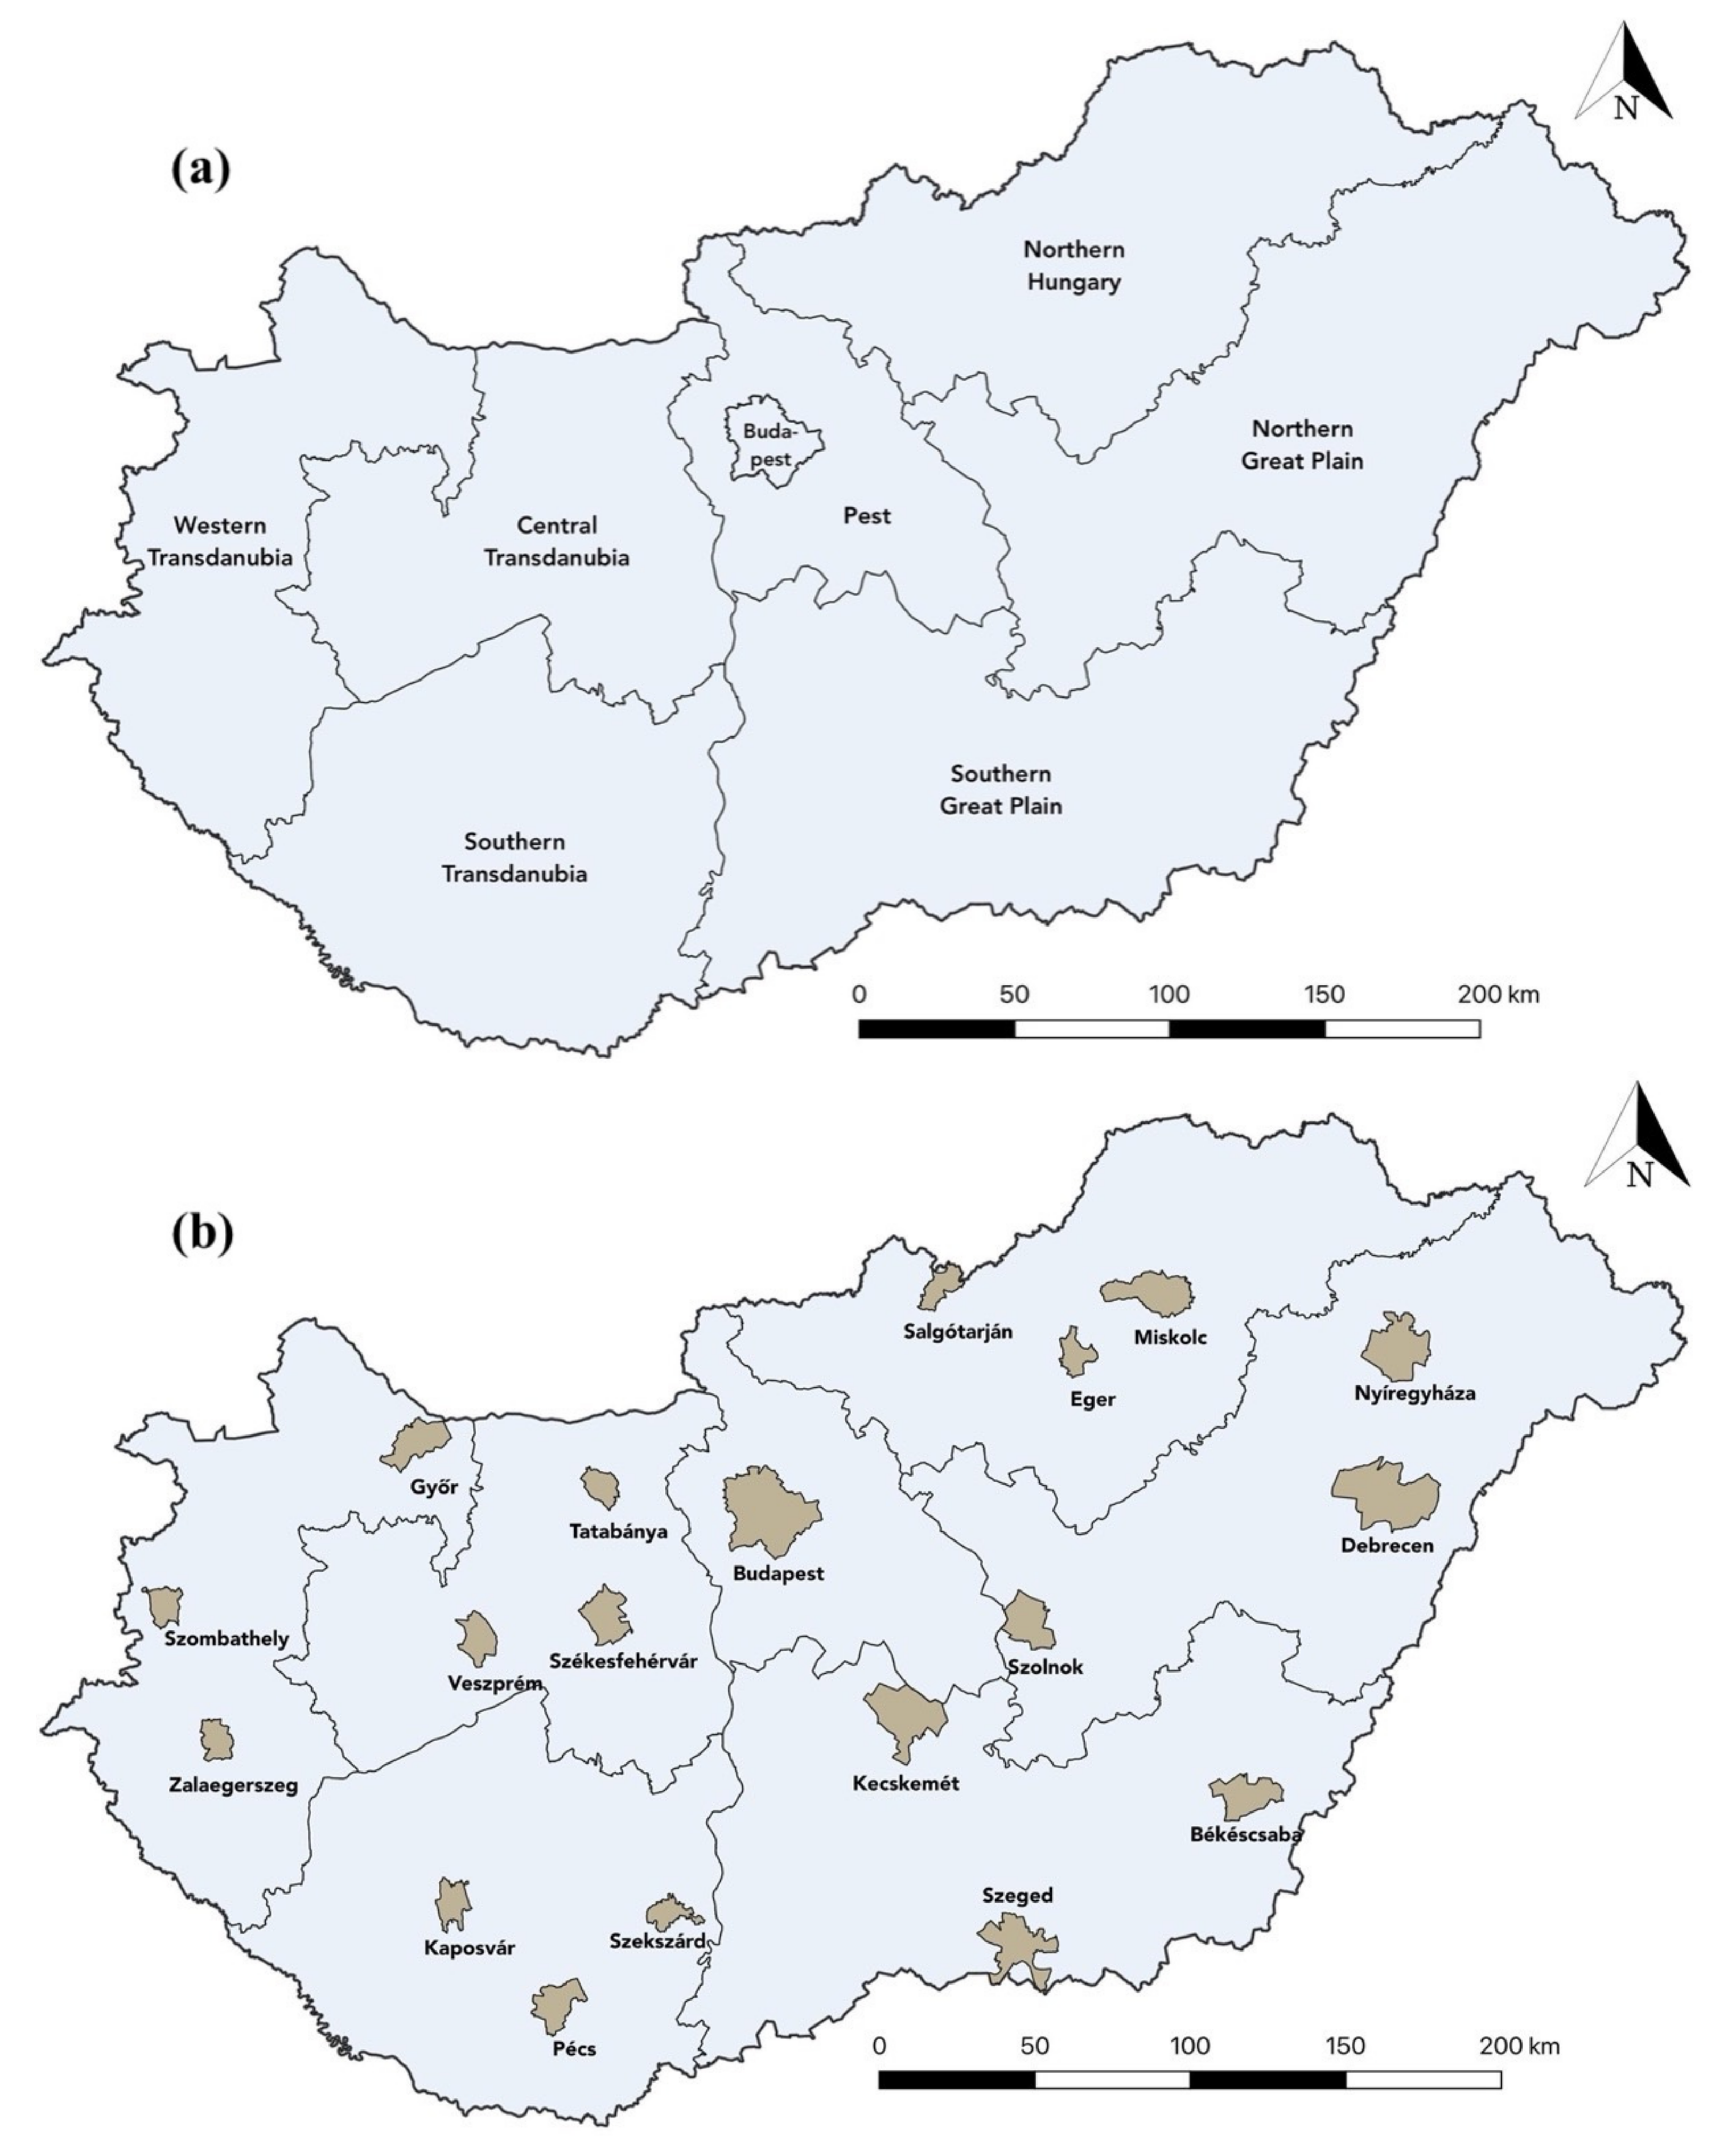
| City | County | Area Size of Cities (km2) | Population Size of Cities (Number of Inhabitants) | Source |
|---|---|---|---|---|
| Békéscsaba | Békés | 193.93 | 59,057 | TeIR |
| Budapest | Pest | 525.14 | 1,675,370 | TeIR |
| Debrecen | Hajdú-Bihar | 461.66 | 201,081 | TeIR |
| Eger | Heves | 92.21 | 51,980 | TeIR |
| Győr | Győr-Moson-Sopron | 174.62 | 124,287 | TeIR |
| Kaposvár | Somogy | 113.59 | 62,611 | TeIR |
| Kecskemét | Bács-Kiskun | 322.57 | 110,116 | TeIR |
| Miskolc | Borsod-Abaúj-Zemplén | 236.67 | 157,544 | TeIR |
| Nyíregyháza | Szabolcs-Szatmár-Bereg | 274.54 | 119,765 | TeIR |
| Pécs | Baranya | 162.78 | 146,721 | TeIR |
| Salgótarján | Nógrád | 97.97 | 34,877 | TeIR |
| Szeged | Csongrád-Csanád | 281 | 161,755 | TeIR |
| Székesfehérvár | Fejér | 170.89 | 95,714 | TeIR |
| Szekszárd | Tolna | 96.28 | 32,126 | TeIR |
| Szolnok | Jász-Nagykun-Szolnok | 187.24 | 69,643 | TeIR |
| Szombathely | Vas | 97.5 | 76,085 | TeIR |
| Tatabánya | Komárom-Esztergom | 91.42 | 68,140 | TeIR |
| Veszprém | Veszprém | 126.92 | 55,247 | TeIR |
| Zalaegerszeg | Zala | 102.46 | 56,959 | TeIR |
| Békéscsaba | Békés | 193.93 | 59,057 | TeIR |
| Economy | Source | Society | Source | Environment | Source |
|---|---|---|---|---|---|
| Number of taxpayers per 1000 capita | KSH | Aging indicator | TeIR | Scale of green areas per capita | TeIR |
| Long-term unemployment rate | TeIR | Migration balance | TeIR | Annual proportion of days above the limit value of NO2 | OMSZ |
| Unemployment rate of new entrants | TeIR | Number of deaths per 1000 capita | KSH | Water consumption per capita | KSH |
| Retired entrepreneur per 1000 retirees | TeIR | Number of divorces per 1000 capita | TeIR | Energy consumption per capita | TeIR |
| Number of operating enterprises per 1000 capita | KSH | Number of abortions per 1000 capita | TeIR | Area of playgrounds, gymnasiums, rest areas per capita | TeIR |
| Proportion of professional and scientific enterprises within operating enterprises per 1000 capita | TeIR | Number of crimes per 1000 capita | KSH | Proportion of bicycle paths | TeIR |
| Number of retail stores per 10,000 capita | KSH | Number of GPs and pediatricians per 1000 capita | TeIR | Proportion of waste collected selectively | KSH |
| Number of guest nights per 1000 capita | KSH | Number of internet subscriptions per apartment | TeIR | Amount of waste per capita | KSH |
| Proportion of newly built housing stock | TeIR | Price per square meter of the residential real estate sold | ingatlannet.hu | Number of passengers transported in public transport correlate to the permanent population | TeIR |
| PIT basic income | KSH | Number of cultural events per 1000 capita | TeIR | Road load | TeIR |
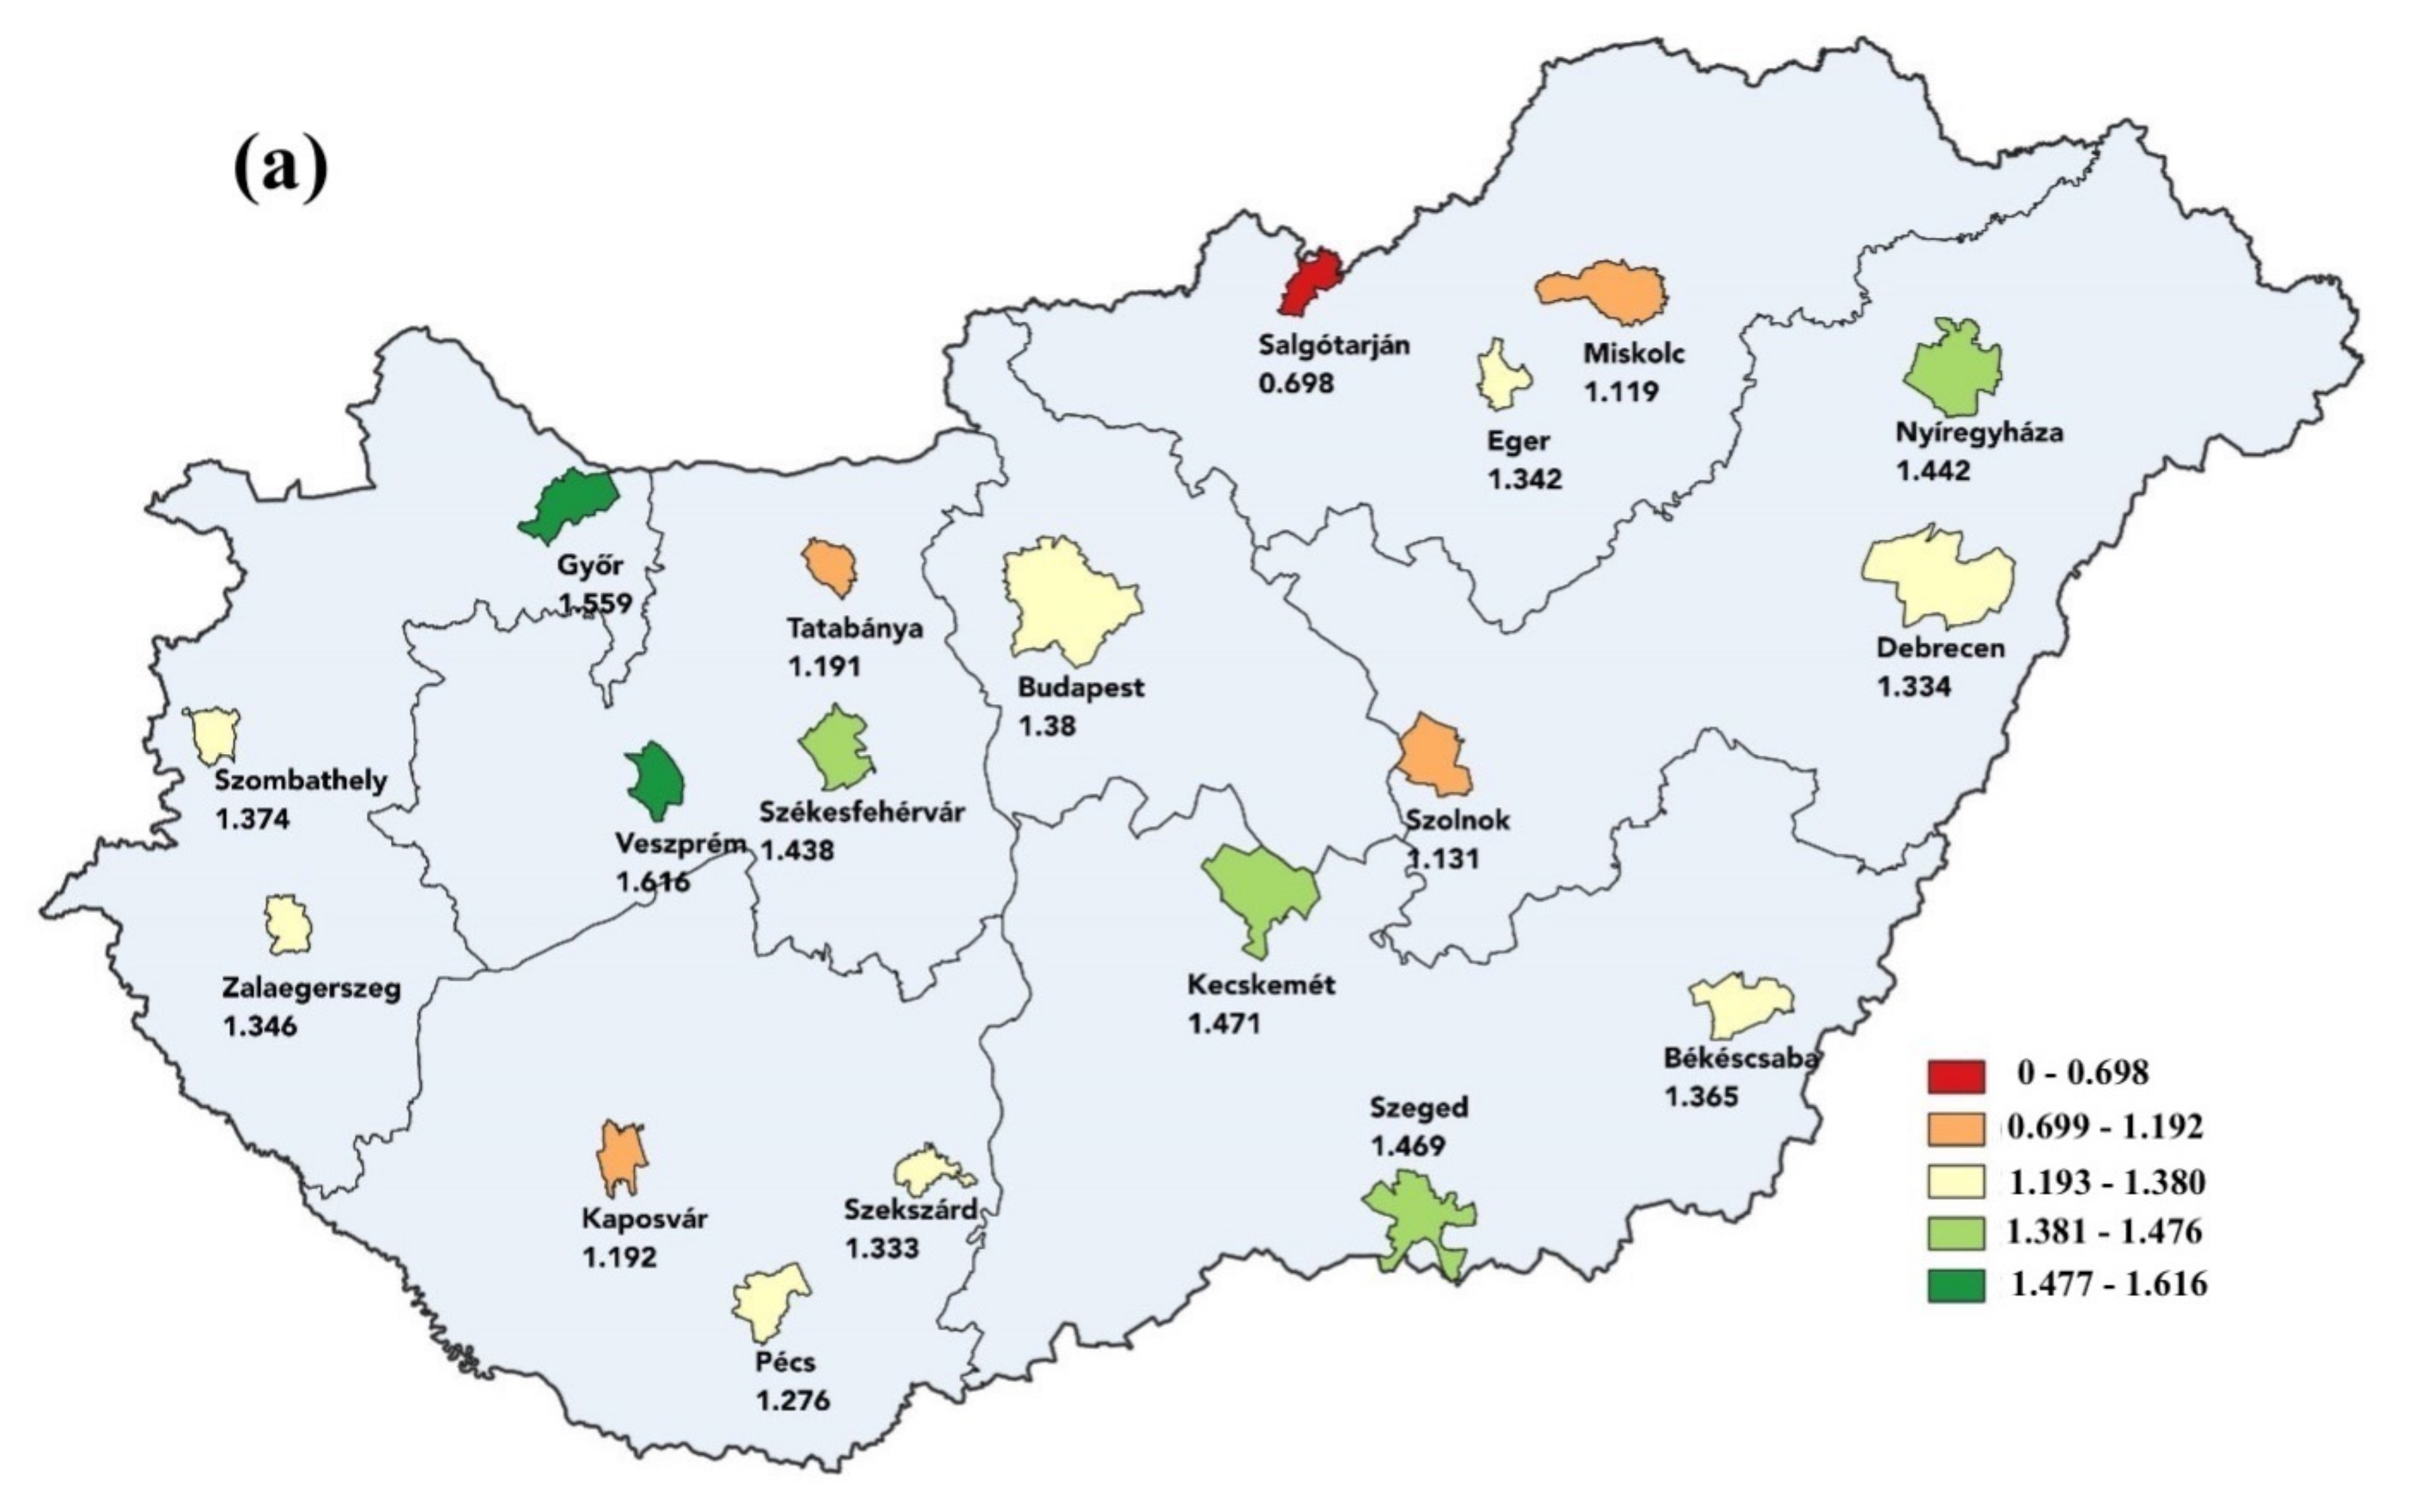
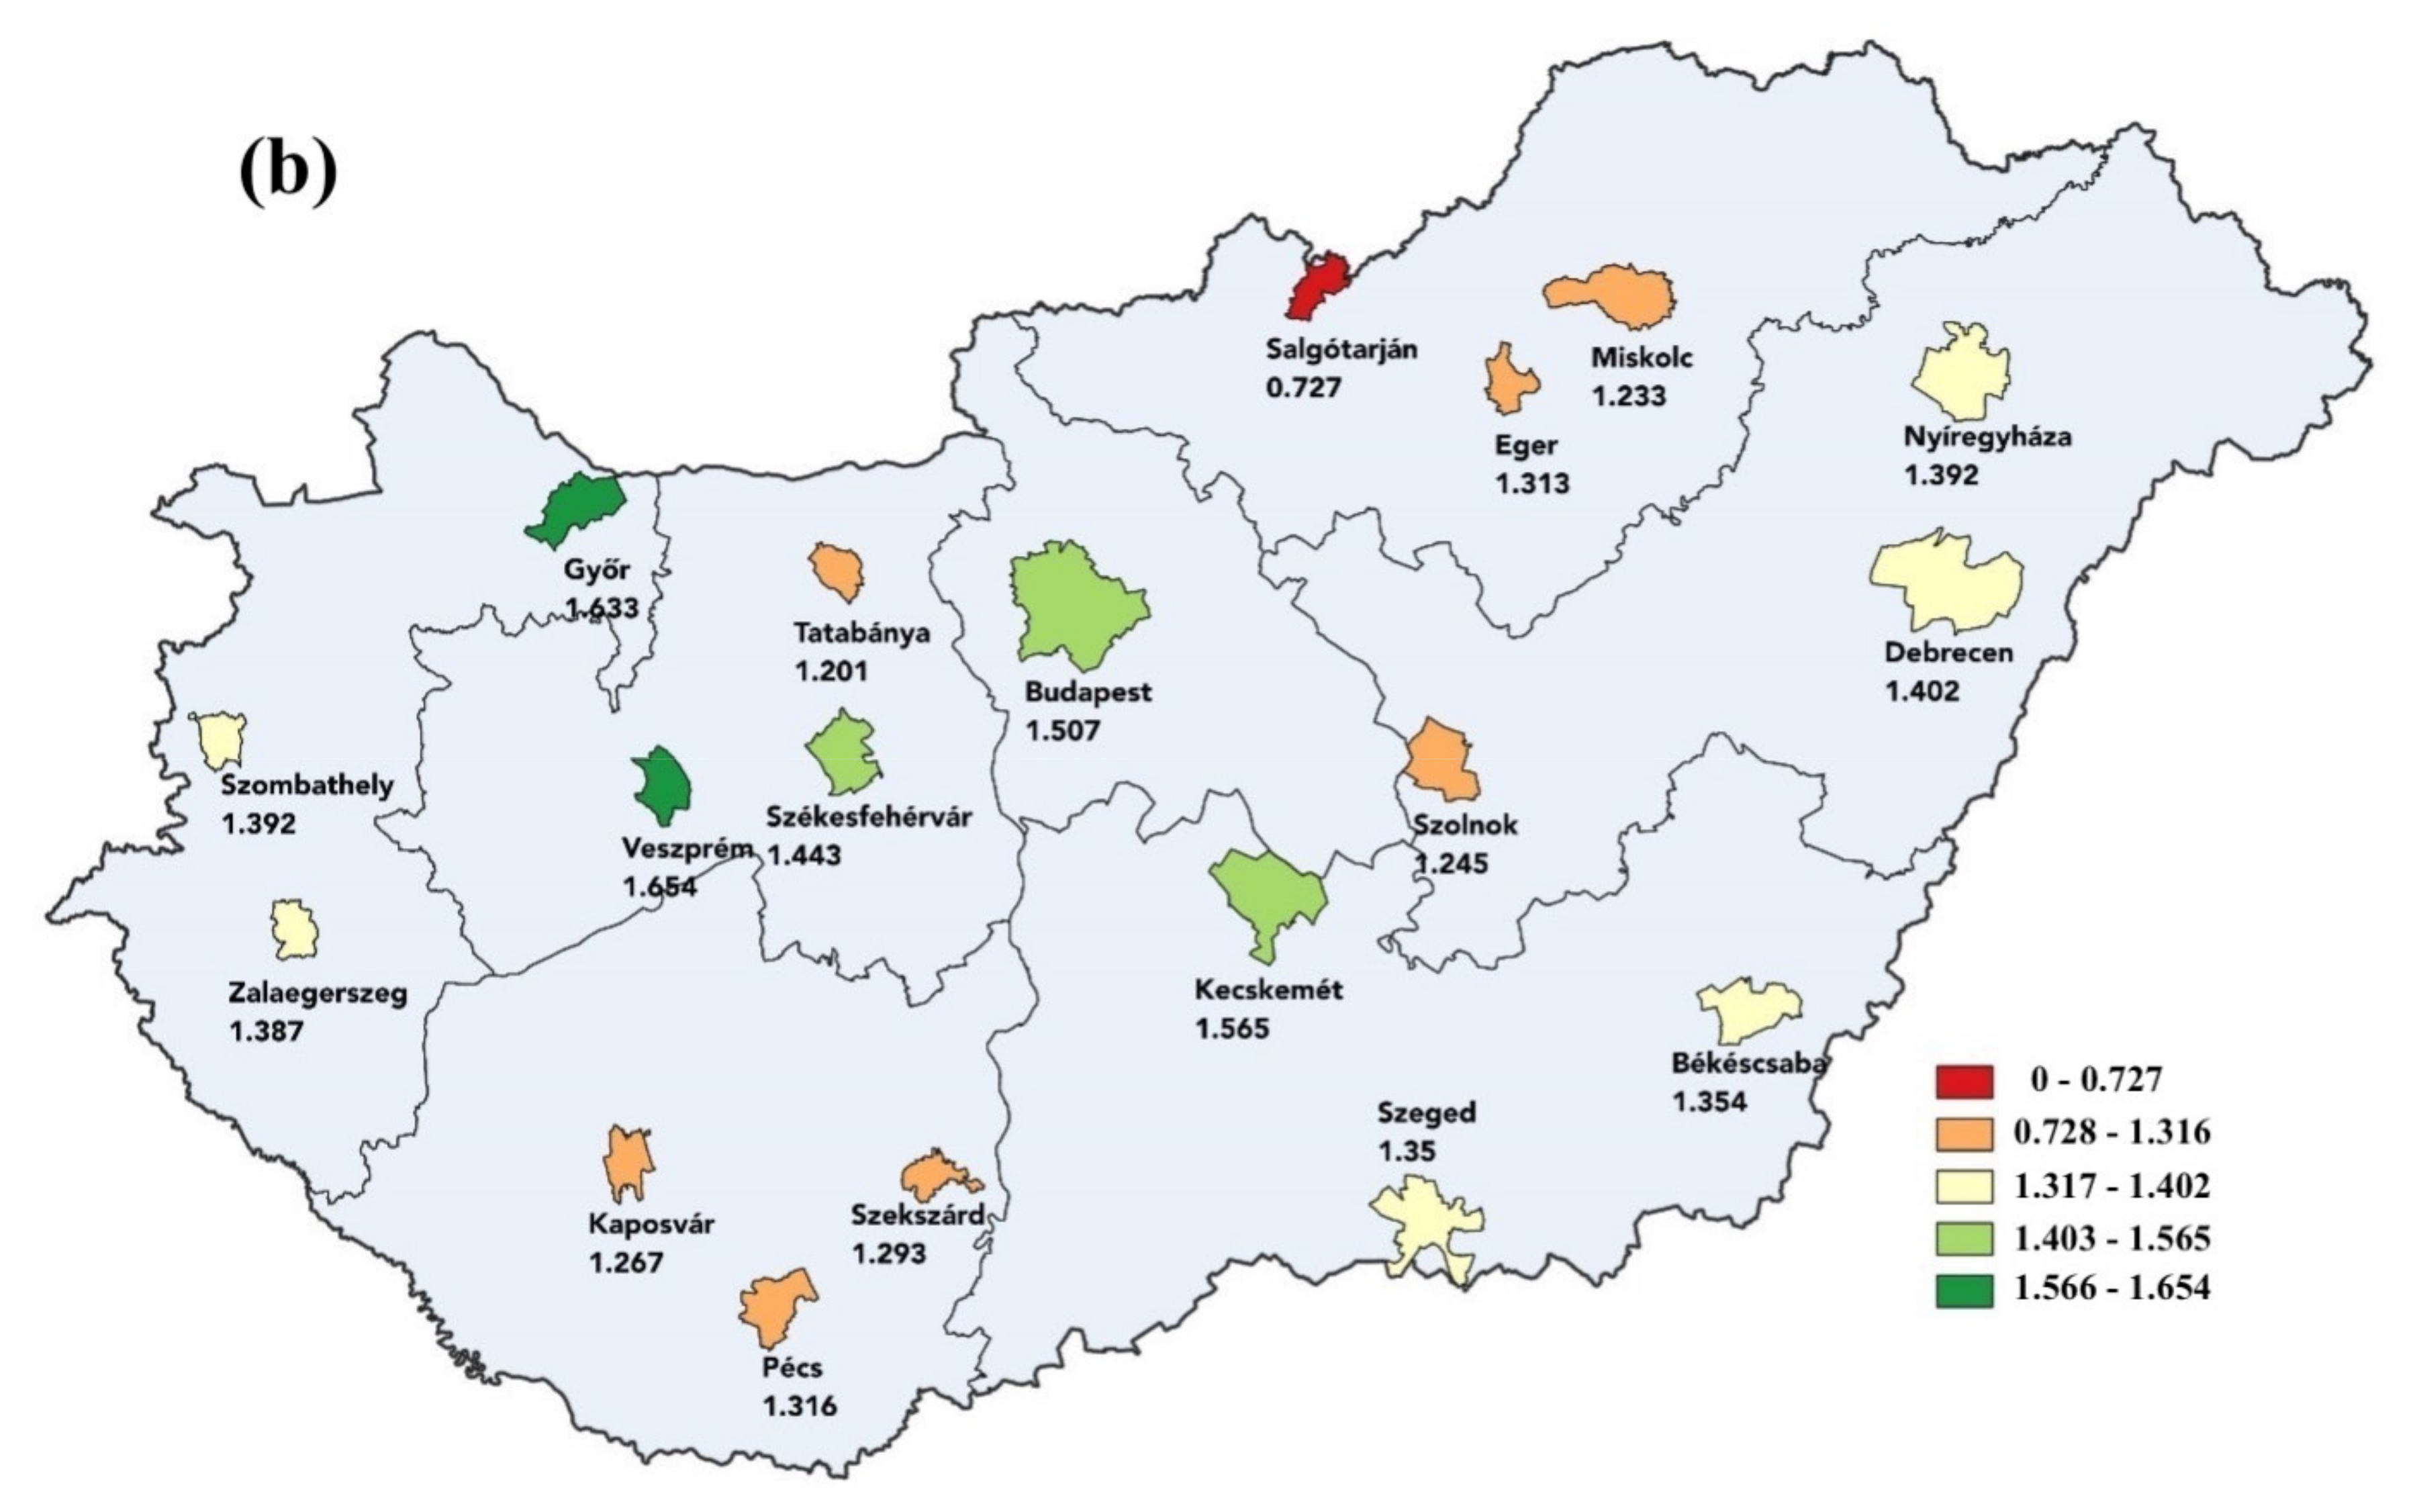
| City | Environment | Economy | Society | Overall | ||||
|---|---|---|---|---|---|---|---|---|
| 2014 | 2018/19 | 2014 | 2018/19 | 2014 | 2018/19 | 2014 | 2018/19 | |
| Békéscsaba | 0.50 | 0.50 | 0.41 | 0.43 | 0.46 | 0.43 | 1.36 | 1.35 |
| Budapest | 0.24 | 0.28 | 0.61 | 0.66 | 0.53 | 0.56 | 1.38 | 1.51 |
| Debrecen | 0.32 | 0.44 | 0.41 | 0.34 | 0.60 | 0.62 | 1.33 | 1.40 |
| Eger | 0.33 | 0.35 | 0.52 | 0.51 | 0.49 | 0.45 | 1.34 | 1.31 |
| Győr | 0.43 | 0.46 | 0.59 | 0.61 | 0.54 | 0.56 | 1.56 | 1.63 |
| Kaposvár | 0.54 | 0.54 | 0.31 | 0.35 | 0.35 | 0.38 | 1.19 | 1.27 |
| Kecskemét | 0.57 | 0.59 | 0.36 | 0.49 | 0.54 | 0.48 | 1.47 | 1.57 |
| Miskolc | 0.46 | 0.51 | 0.23 | 0.27 | 0.43 | 0.45 | 1.12 | 1.23 |
| Nyíregyháza | 0.55 | 0.51 | 0.42 | 0.41 | 0.47 | 0.47 | 1.44 | 1.39 |
| Pécs | 0.47 | 0.52 | 0.24 | 0.26 | 0.57 | 0.54 | 1.28 | 1.32 |
| Salgótarján | 0.39 | 0.37 | 0.15 | 0.21 | 0.16 | 0.14 | 0.70 | 0.73 |
| Szeged | 0.38 | 0.36 | 0.40 | 0.43 | 0.69 | 0.55 | 1.47 | 1.35 |
| Székesfehérvár | 0.40 | 0.45 | 0.46 | 0.46 | 0.57 | 0.53 | 1.44 | 1.44 |
| Szekszárd | 0.35 | 0.37 | 0.45 | 0.47 | 0.53 | 0.45 | 1.33 | 1.29 |
| Szolnok | 0.37 | 0.39 | 0.37 | 0.37 | 0.40 | 0.49 | 1.13 | 1.25 |
| Szombathely | 0.39 | 0.37 | 0.39 | 0.44 | 0.59 | 0.58 | 1.37 | 1.39 |
| Tatabánya | 0.45 | 0.36 | 0.24 | 0.33 | 0.50 | 0.52 | 1.19 | 1.20 |
| Veszprém | 0.35 | 0.39 | 0.60 | 0.65 | 0.67 | 0.61 | 1.62 | 1.65 |
| Zalaegerszeg | 0.46 | 0.50 | 0.41 | 0.38 | 0.48 | 0.51 | 1.35 | 1.39 |
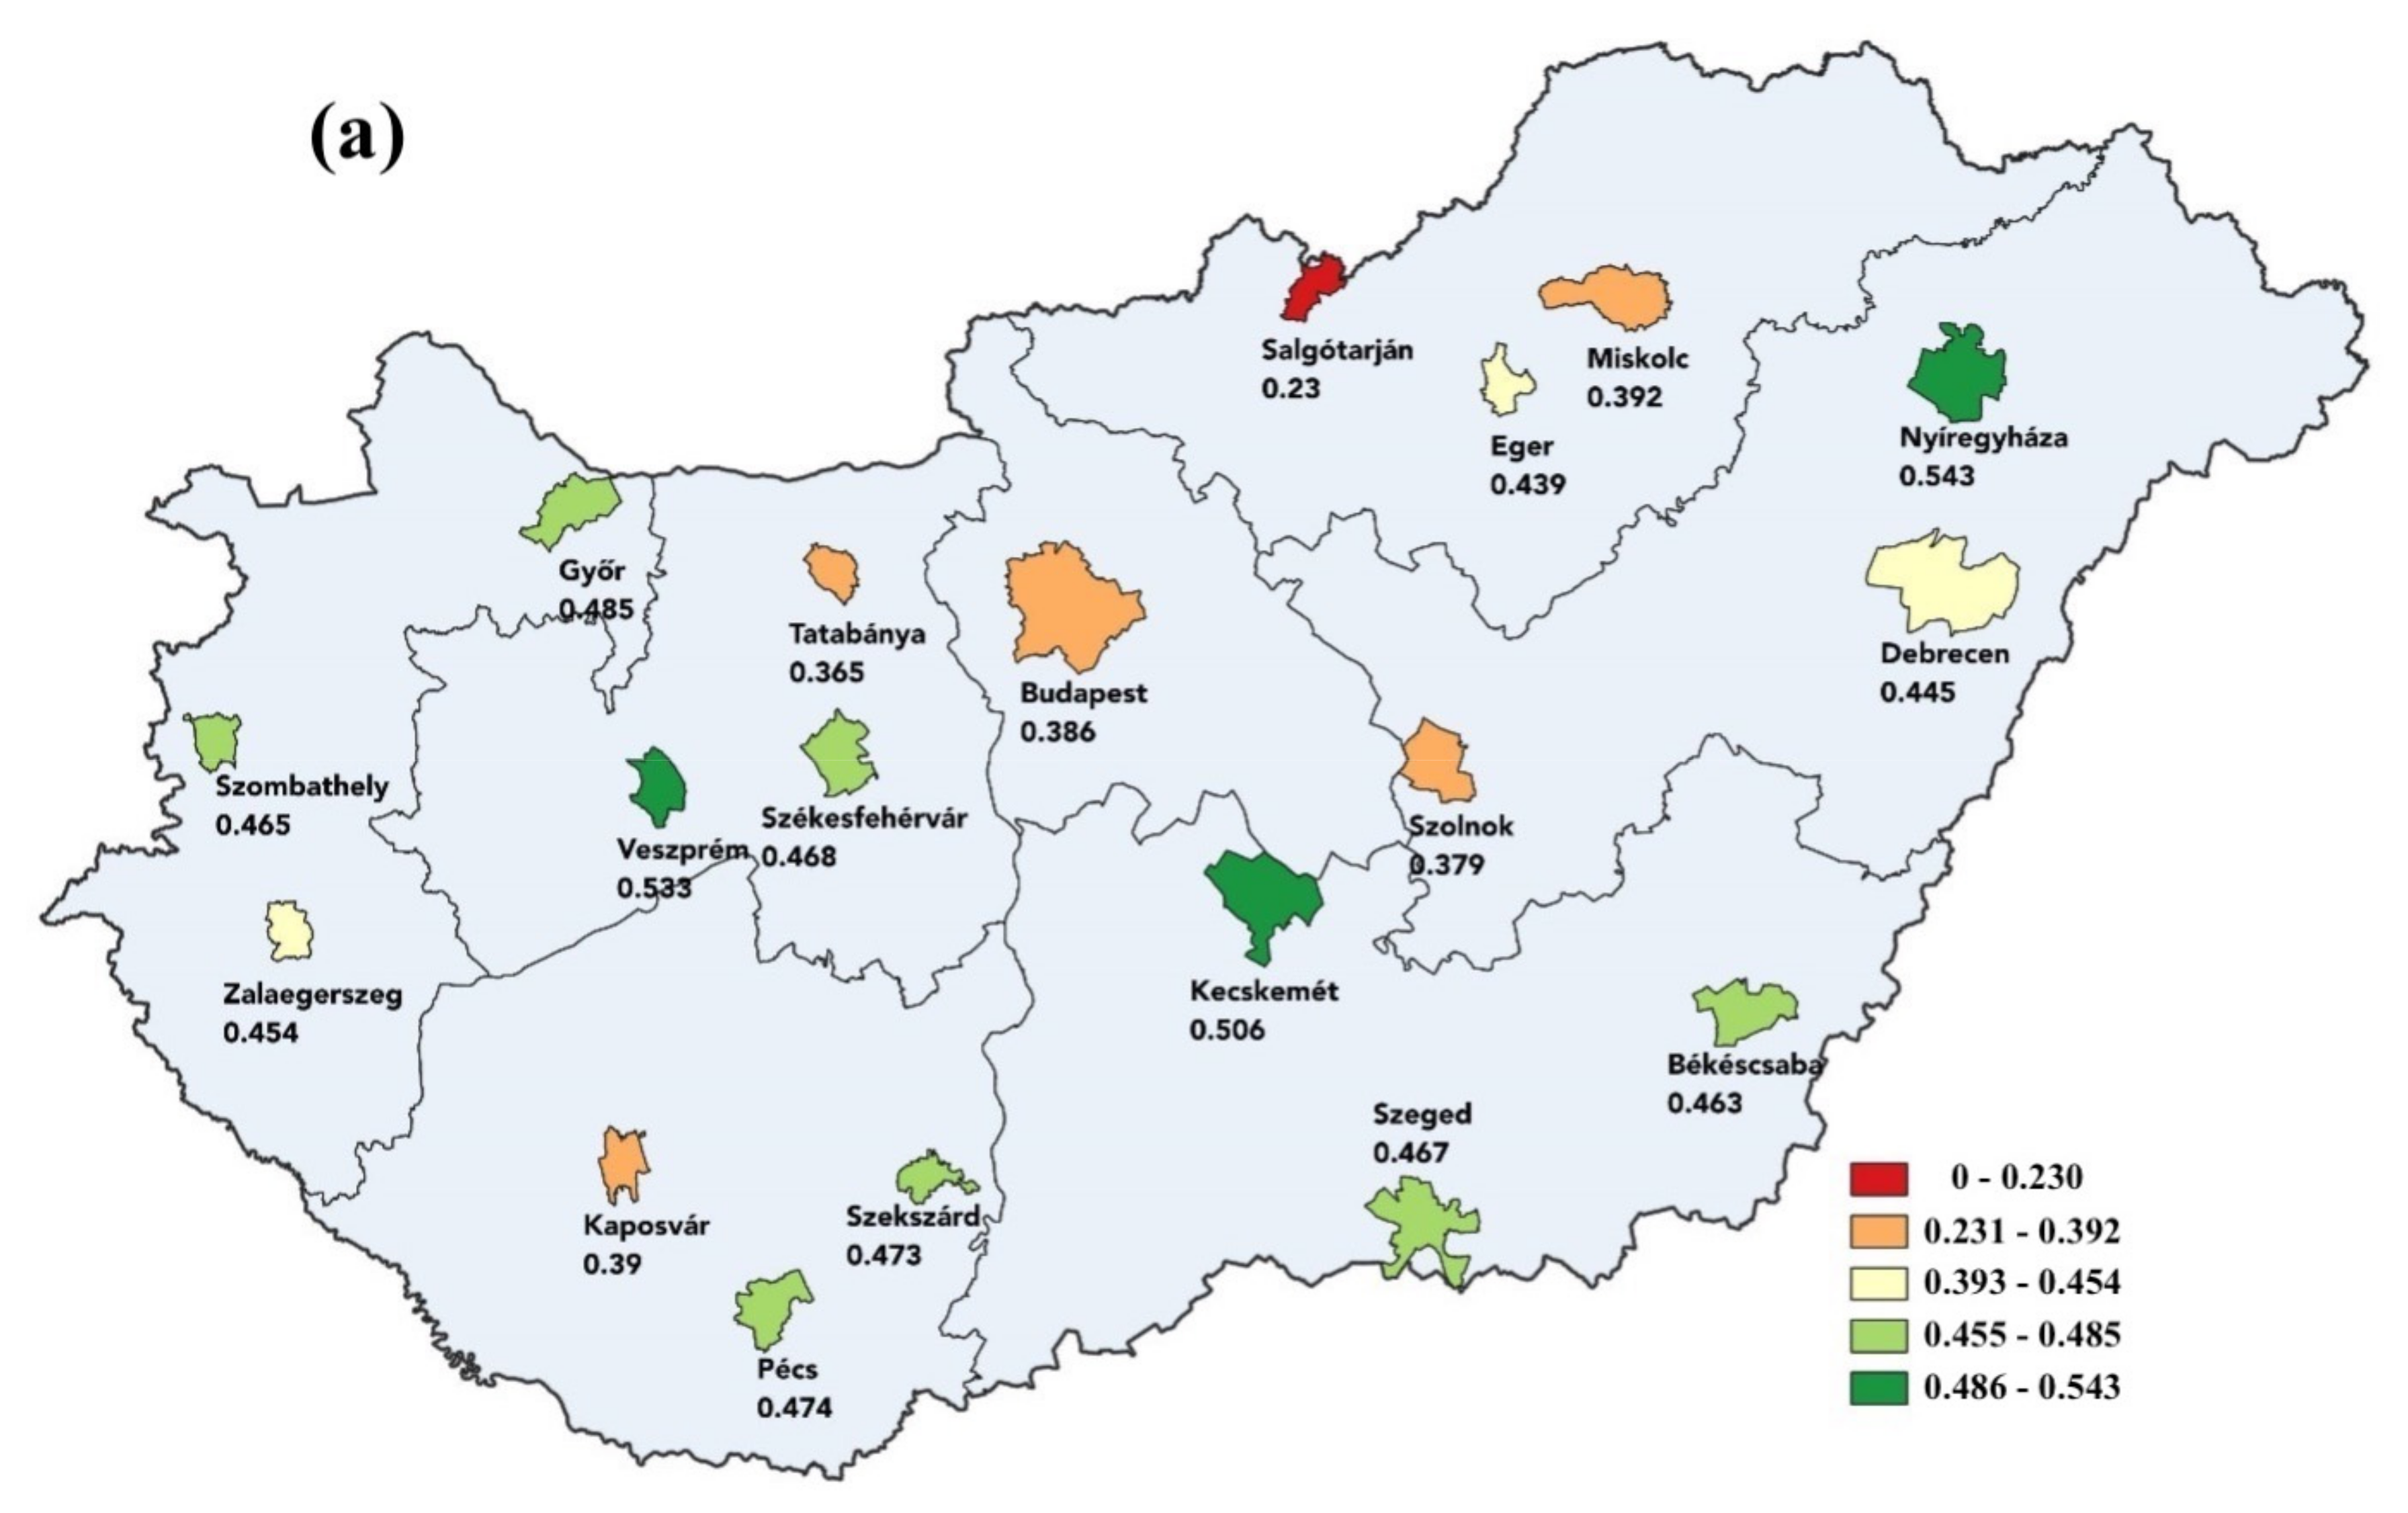
| City | Environment | Economy | Society | Overall | ||||
|---|---|---|---|---|---|---|---|---|
| 2014 | 2018/19 | 2014 | 2018/19 | 2014 | 2018/19 | 2014 | 2018/19 | |
| Békéscsaba | 0.18 | 0.18 | 0.12 | 0.12 | 0.16 | 0.15 | 0.46 | 0.46 |
| Budapest | 0.13 | 0.15 | 0.09 | 0.1 | 0.17 | 0.18 | 0.39 | 0.43 |
| Debrecen | 0.09 | 0.13 | 0.18 | 0.15 | 0.17 | 0.18 | 0.44 | 0.45 |
| Eger | 0.12 | 0.13 | 0.19 | 0.18 | 0.13 | 0.12 | 0.44 | 0.43 |
| Győr | 0.26 | 0.28 | 0.13 | 0.14 | 0.09 | 0.1 | 0.49 | 0.51 |
| Kaposvár | 0.16 | 0.16 | 0.11 | 0.12 | 0.12 | 0.13 | 0.39 | 0.42 |
| Kecskemét | 0.24 | 0.26 | 0.11 | 0.14 | 0.16 | 0.14 | 0.51 | 0.54 |
| Miskolc | 0.16 | 0.18 | 0.06 | 0.06 | 0.18 | 0.19 | 0.39 | 0.43 |
| Nyíregyháza | 0.16 | 0.15 | 0.18 | 0.18 | 0.2 | 0.2 | 0.54 | 0.53 |
| Pécs | 0.19 | 0.21 | 0.04 | 0.04 | 0.24 | 0.23 | 0.47 | 0.49 |
| Salgótarján | 0.13 | 0.12 | 0.05 | 0.07 | 0.05 | 0.05 | 0.23 | 0.24 |
| Szeged | 0.1 | 0.09 | 0.2 | 0.22 | 0.17 | 0.14 | 0.47 | 0.45 |
| Székesfehérvár | 0.16 | 0.18 | 0.15 | 0.15 | 0.15 | 0.14 | 0.47 | 0.48 |
| Szekszárd | 0.04 | 0.04 | 0.21 | 0.22 | 0.22 | 0.19 | 0.47 | 0.45 |
| Szolnok | 0.16 | 0.18 | 0.1 | 0.1 | 0.12 | 0.14 | 0.38 | 0.42 |
| Szombathely | 0.14 | 0.14 | 0.1 | 0.11 | 0.22 | 0.22 | 0.47 | 0.47 |
| Tatabánya | 0.05 | 0.04 | 0.12 | 0.16 | 0.2 | 0.21 | 0.36 | 0.41 |
| Veszprém | 0.12 | 0.13 | 0.2 | 0.22 | 0.22 | 0.2 | 0.53 | 0.55 |
| Zalaegerszeg | 0.2 | 0.21 | 0.12 | 0.11 | 0.14 | 0.15 | 0.45 | 0.47 |
| City | Change | |
|---|---|---|
| Unweighted | Weighted | |
| Békéscsaba | −0.84% | −1.16% |
| Budapest | 9.19% | 10.35% |
| Debrecen | 5.10% | 2.09% |
| Eger | −2.18% | −1.63% |
| Győr | 4.76% | 4.96% |
| Kaposvár | 6.33% | 6.72% |
| Kecskemét | 6.39% | 6.13% |
| Miskolc | 10.21% | 9.68% |
| Nyíregyháza | −3.45% | −2.93% |
| Pécs | 3.09% | 2.37% |
| Salgótarján | 4.09% | 4.09% |
| Szeged | −8.09% | −4.40% |
| Székesfehérvár | 0.41% | 1.68% |
| Szekszárd | −2.97% | −4.86% |
| Szolnok | 10.04% | 9.76% |
| Szombathely | 1.35% | 0.43% |
| Tatabánya | 0.76% | 11.45% |
| Veszprém | 2.33% | 2.33% |
| Zalaegerszeg | 3.07% | 3.80% |
| Dimension | Overall Sustainability-Unweighted | |
|---|---|---|
| 2014 | 2018/19 | |
| Economic | 0.601 | 0.606 |
| Social | 0.726 | 0.666 |
| Environmental | 0.000 | 0.030 |
| Dimension | Overall Sustainability-Weighted | |
|---|---|---|
| 2014 | 2018/19 | |
| Economic | 0.308 | 0.139 |
| Social | 0.337 | 0.265 |
| Environmental | 0.062 | 0.148 |
Publisher’s Note: MDPI stays neutral with regard to jurisdictional claims in published maps and institutional affiliations. |
© 2021 by the authors. Licensee MDPI, Basel, Switzerland. This article is an open access article distributed under the terms and conditions of the Creative Commons Attribution (CC BY) license (https://creativecommons.org/licenses/by/4.0/).
Share and Cite
Buzási, A.; Jäger, B.S. Exploratory Analysis of Urban Sustainability by Applying a Strategy-Based Tailor-Made Weighting Method. Sustainability 2021, 13, 6556. https://doi.org/10.3390/su13126556
Buzási A, Jäger BS. Exploratory Analysis of Urban Sustainability by Applying a Strategy-Based Tailor-Made Weighting Method. Sustainability. 2021; 13(12):6556. https://doi.org/10.3390/su13126556
Chicago/Turabian StyleBuzási, Attila, and Bettina Szimonetta Jäger. 2021. "Exploratory Analysis of Urban Sustainability by Applying a Strategy-Based Tailor-Made Weighting Method" Sustainability 13, no. 12: 6556. https://doi.org/10.3390/su13126556
APA StyleBuzási, A., & Jäger, B. S. (2021). Exploratory Analysis of Urban Sustainability by Applying a Strategy-Based Tailor-Made Weighting Method. Sustainability, 13(12), 6556. https://doi.org/10.3390/su13126556