
Effect of Space Configurational Attributes on Social Interactions in Urban Parks

Abstract
:1. Introduction
2. Methodology
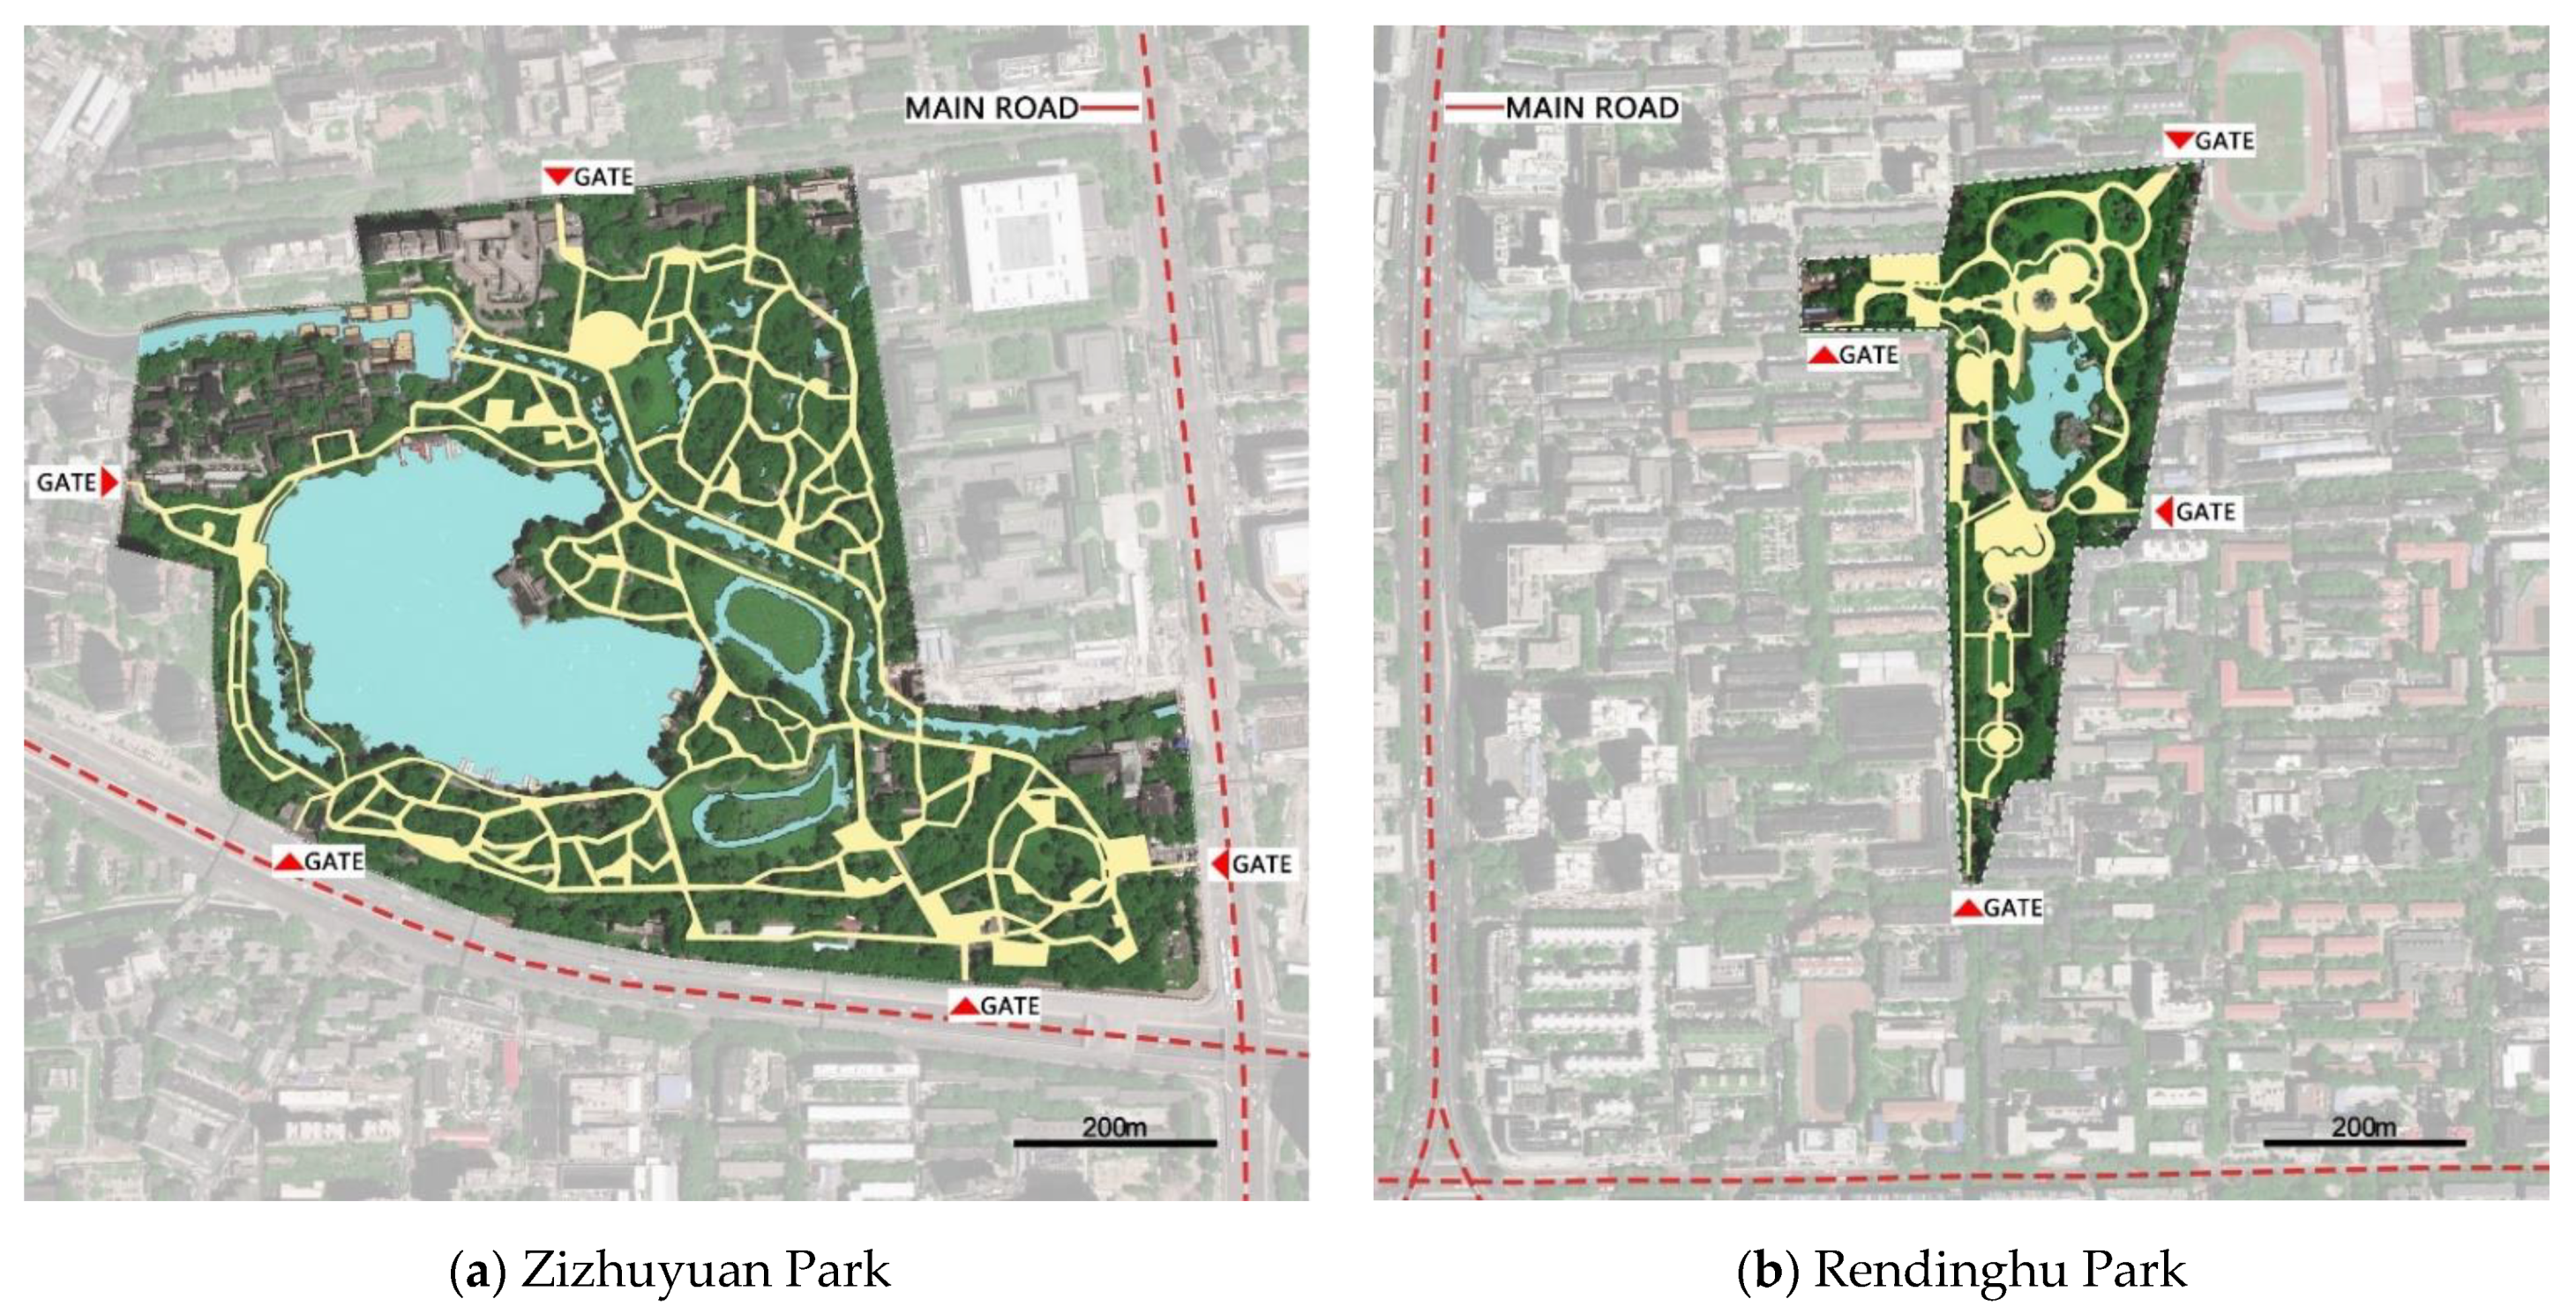
2.1. Study Sites
2.2. Measurements of Social Interactions in the Park: Observation
2.3. Space Configurational Attributes: Space Syntax Analysis
- (1)
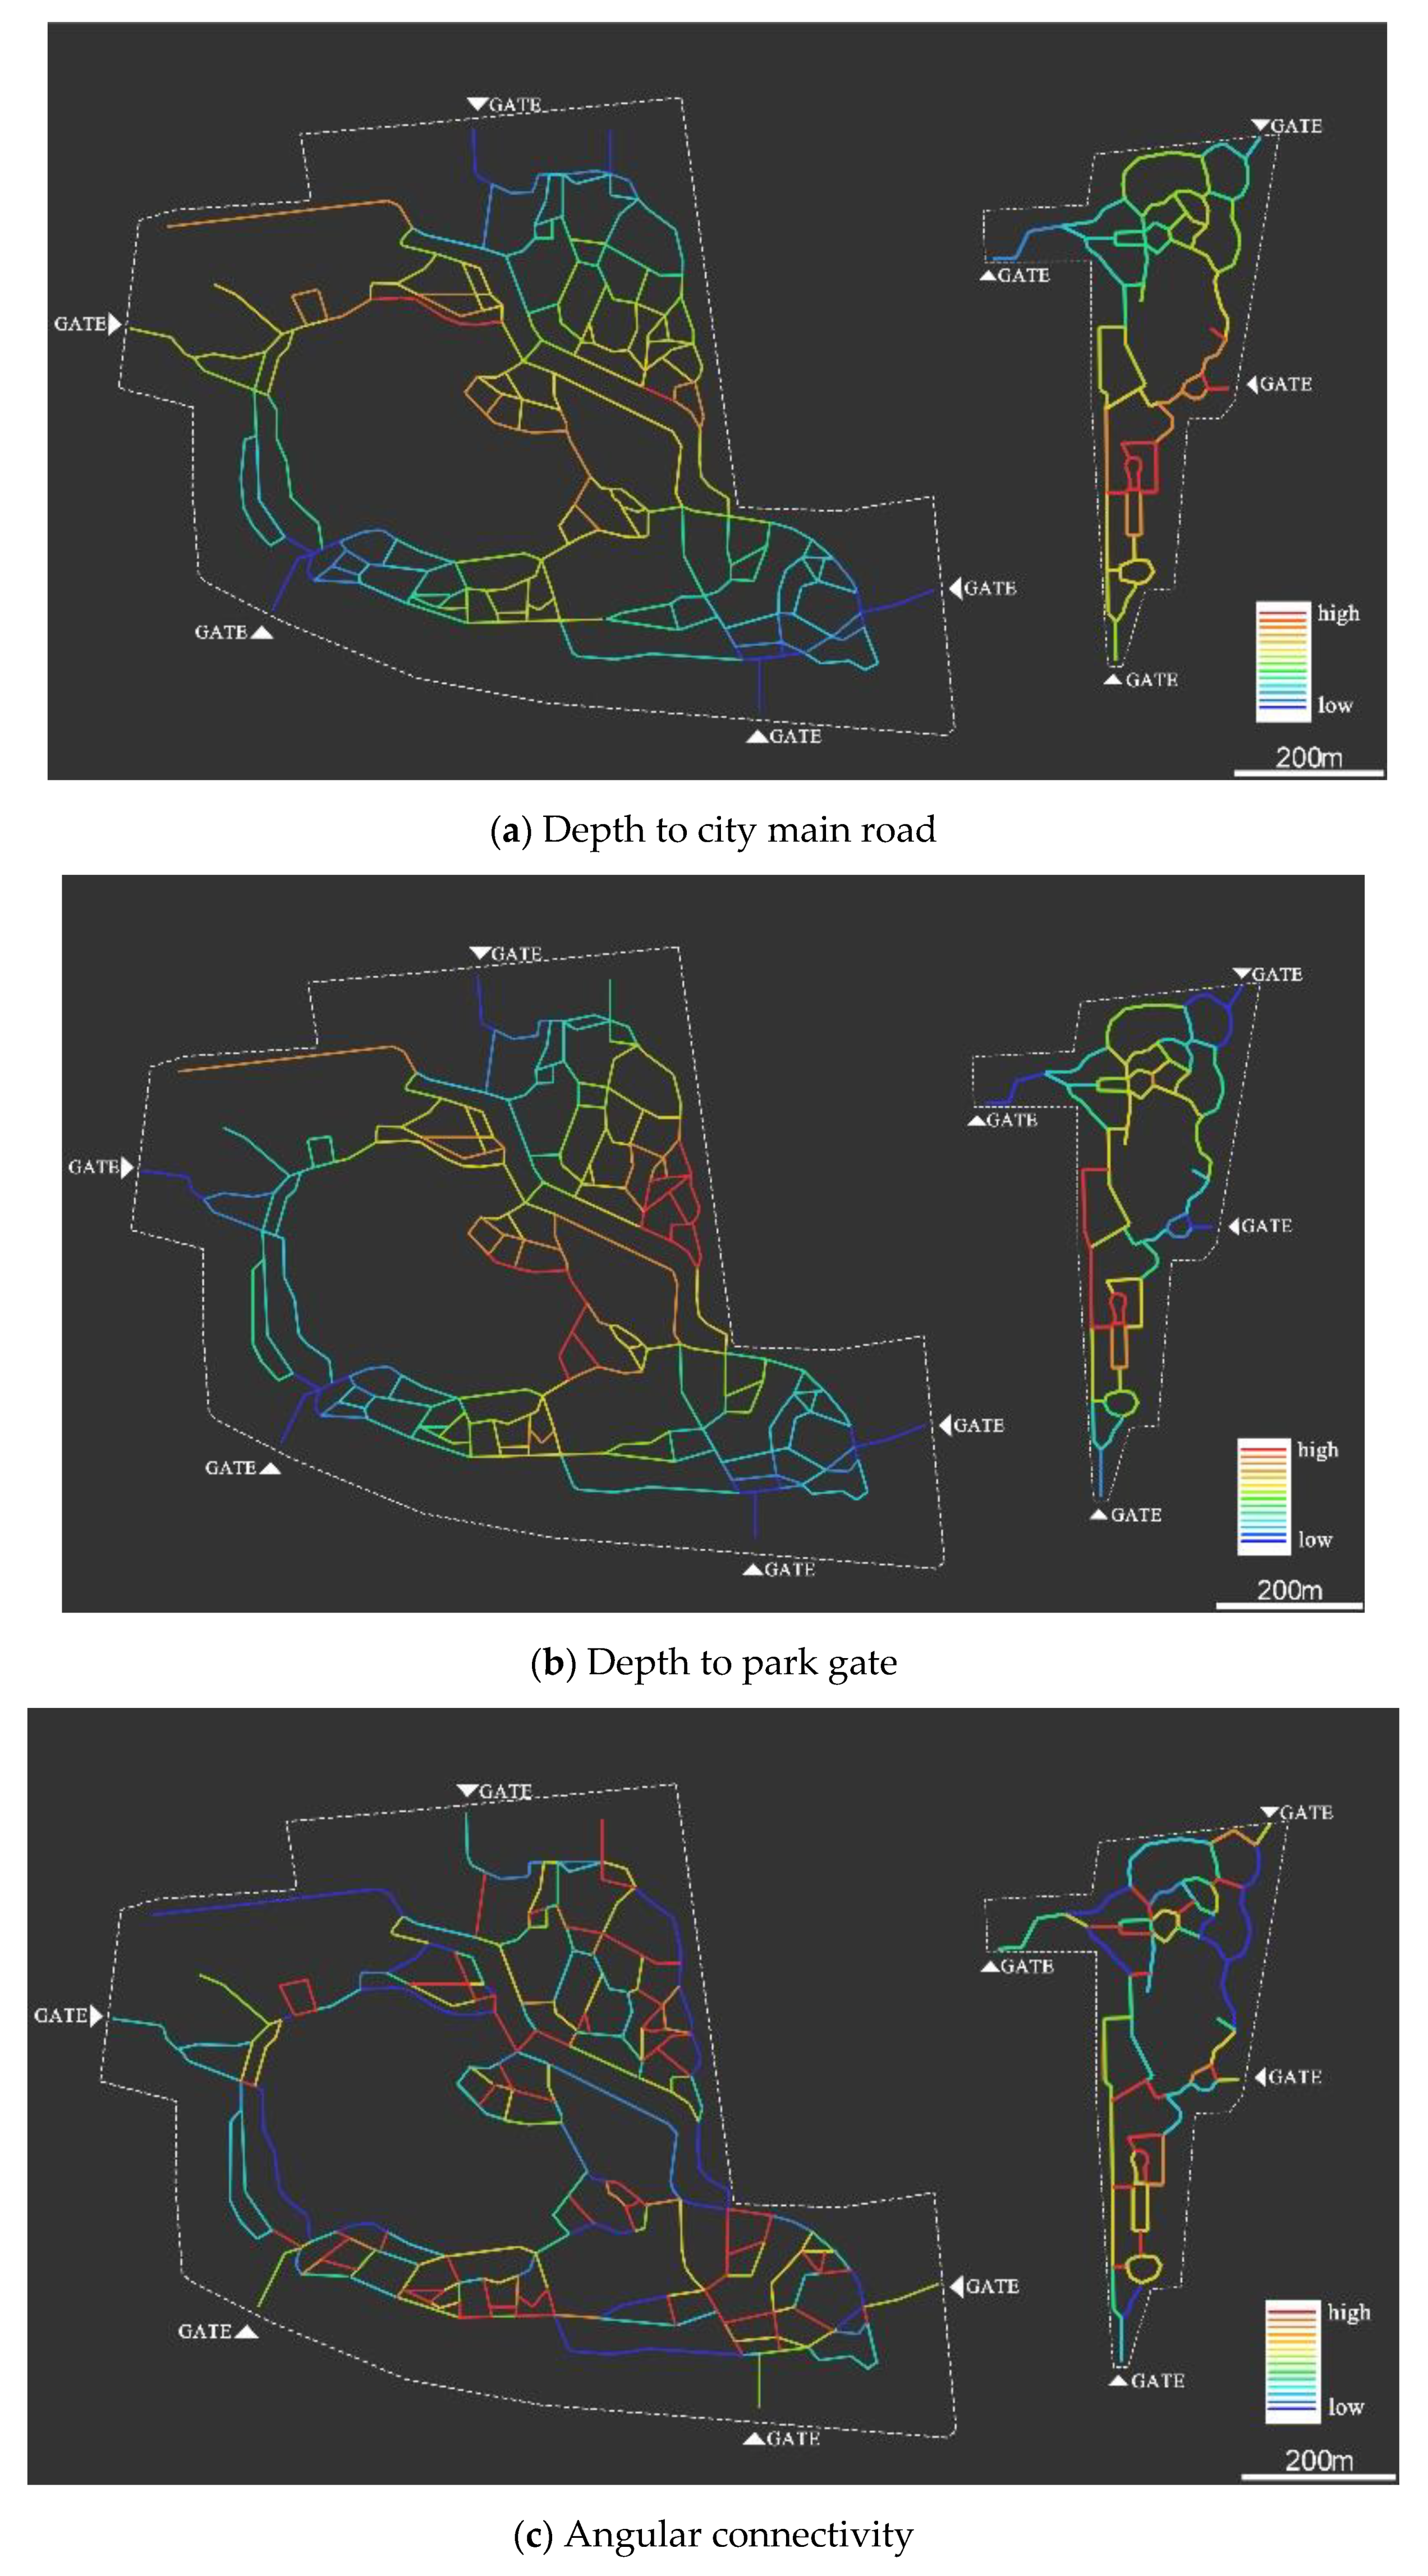
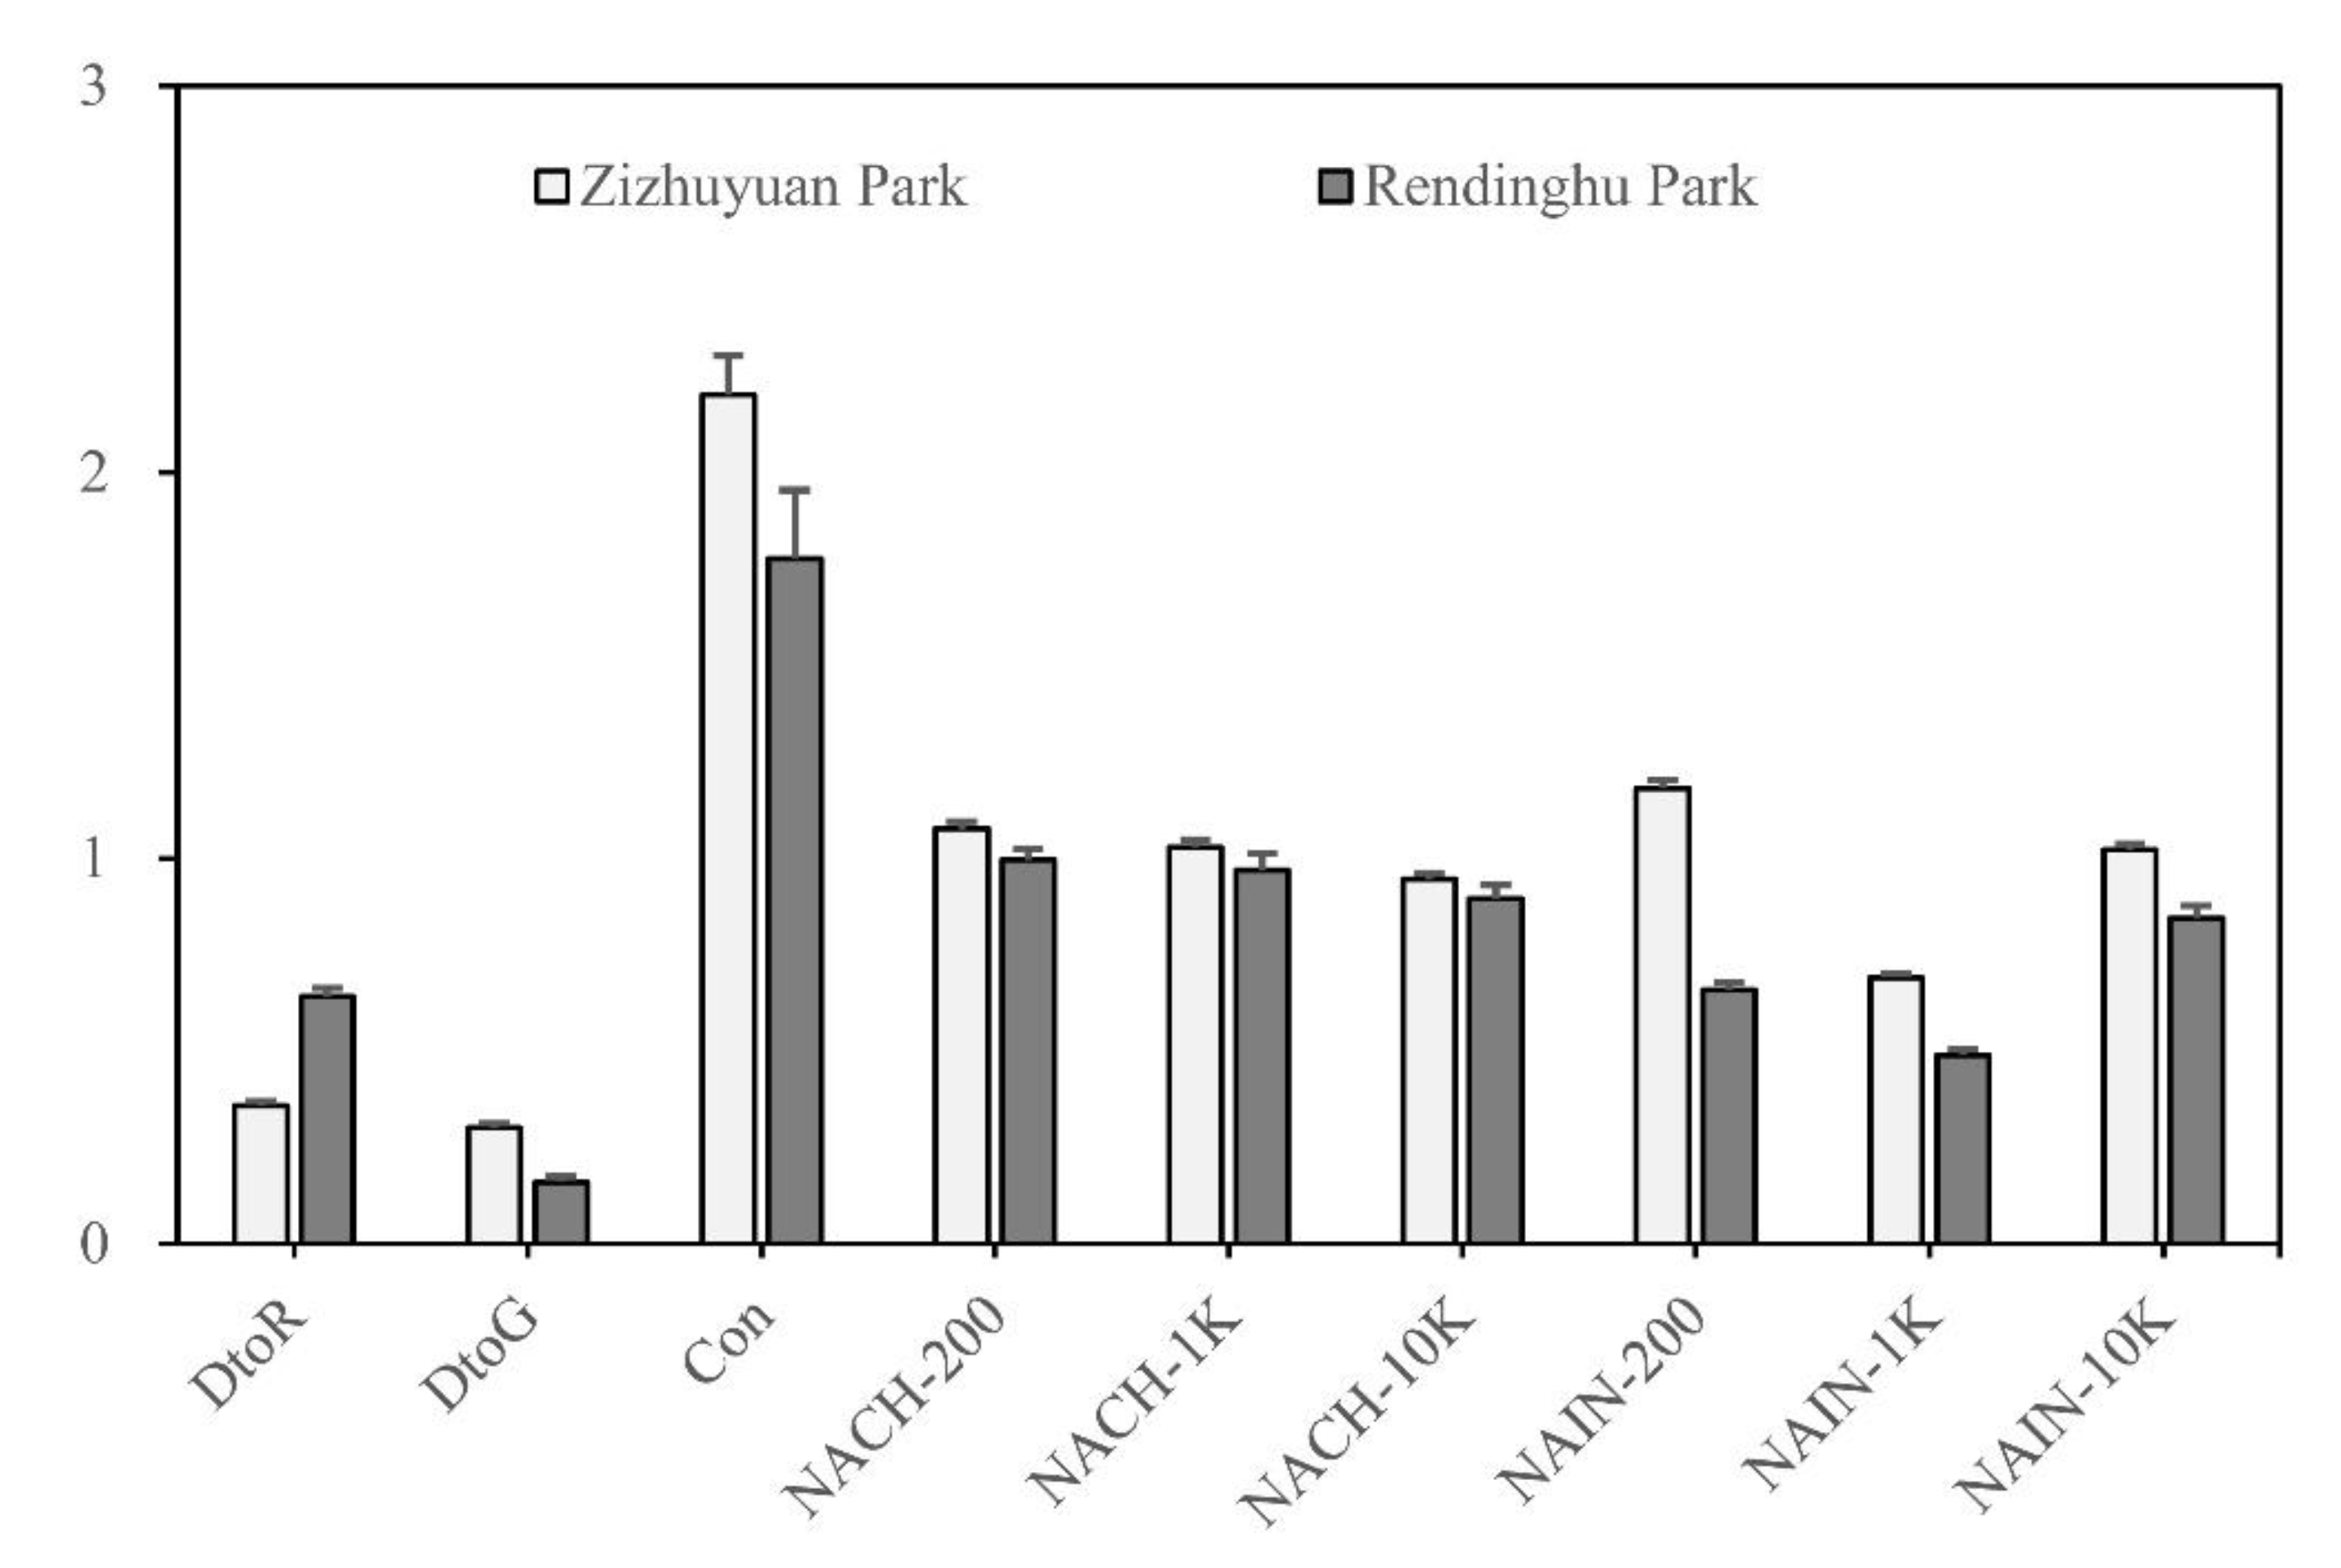
- Depth. Depth is the basic measure of space syntax, which measures the spatial distance between the starting space and the terminal space [41]. Angular depth is suggested for evaluating the shortest journeys through the spatial network by considering the cost of the connection angle [42]. In this study, metric step depth (MSD) is used, which follows the shortest angular path from the whole system to the selected space. Depth to gate (DtoG) and depth to city main road (DtoR) are calculated to represent the spatial distance from the staring space to the entrance of the parks and the city road network;
- (2)
- Connectivity. Connectivity represents how many spaces are directly connected to the staring space. The angular connectivity offers a better description of space relationships by considering the weight of each connected space according to the turn angle (0 for 0 degree, 0.5 for 45 degrees, and 1 for 90 degrees). In this study, the calculation of connectivity for each space follows the rules of angular connectivity;
- (3)
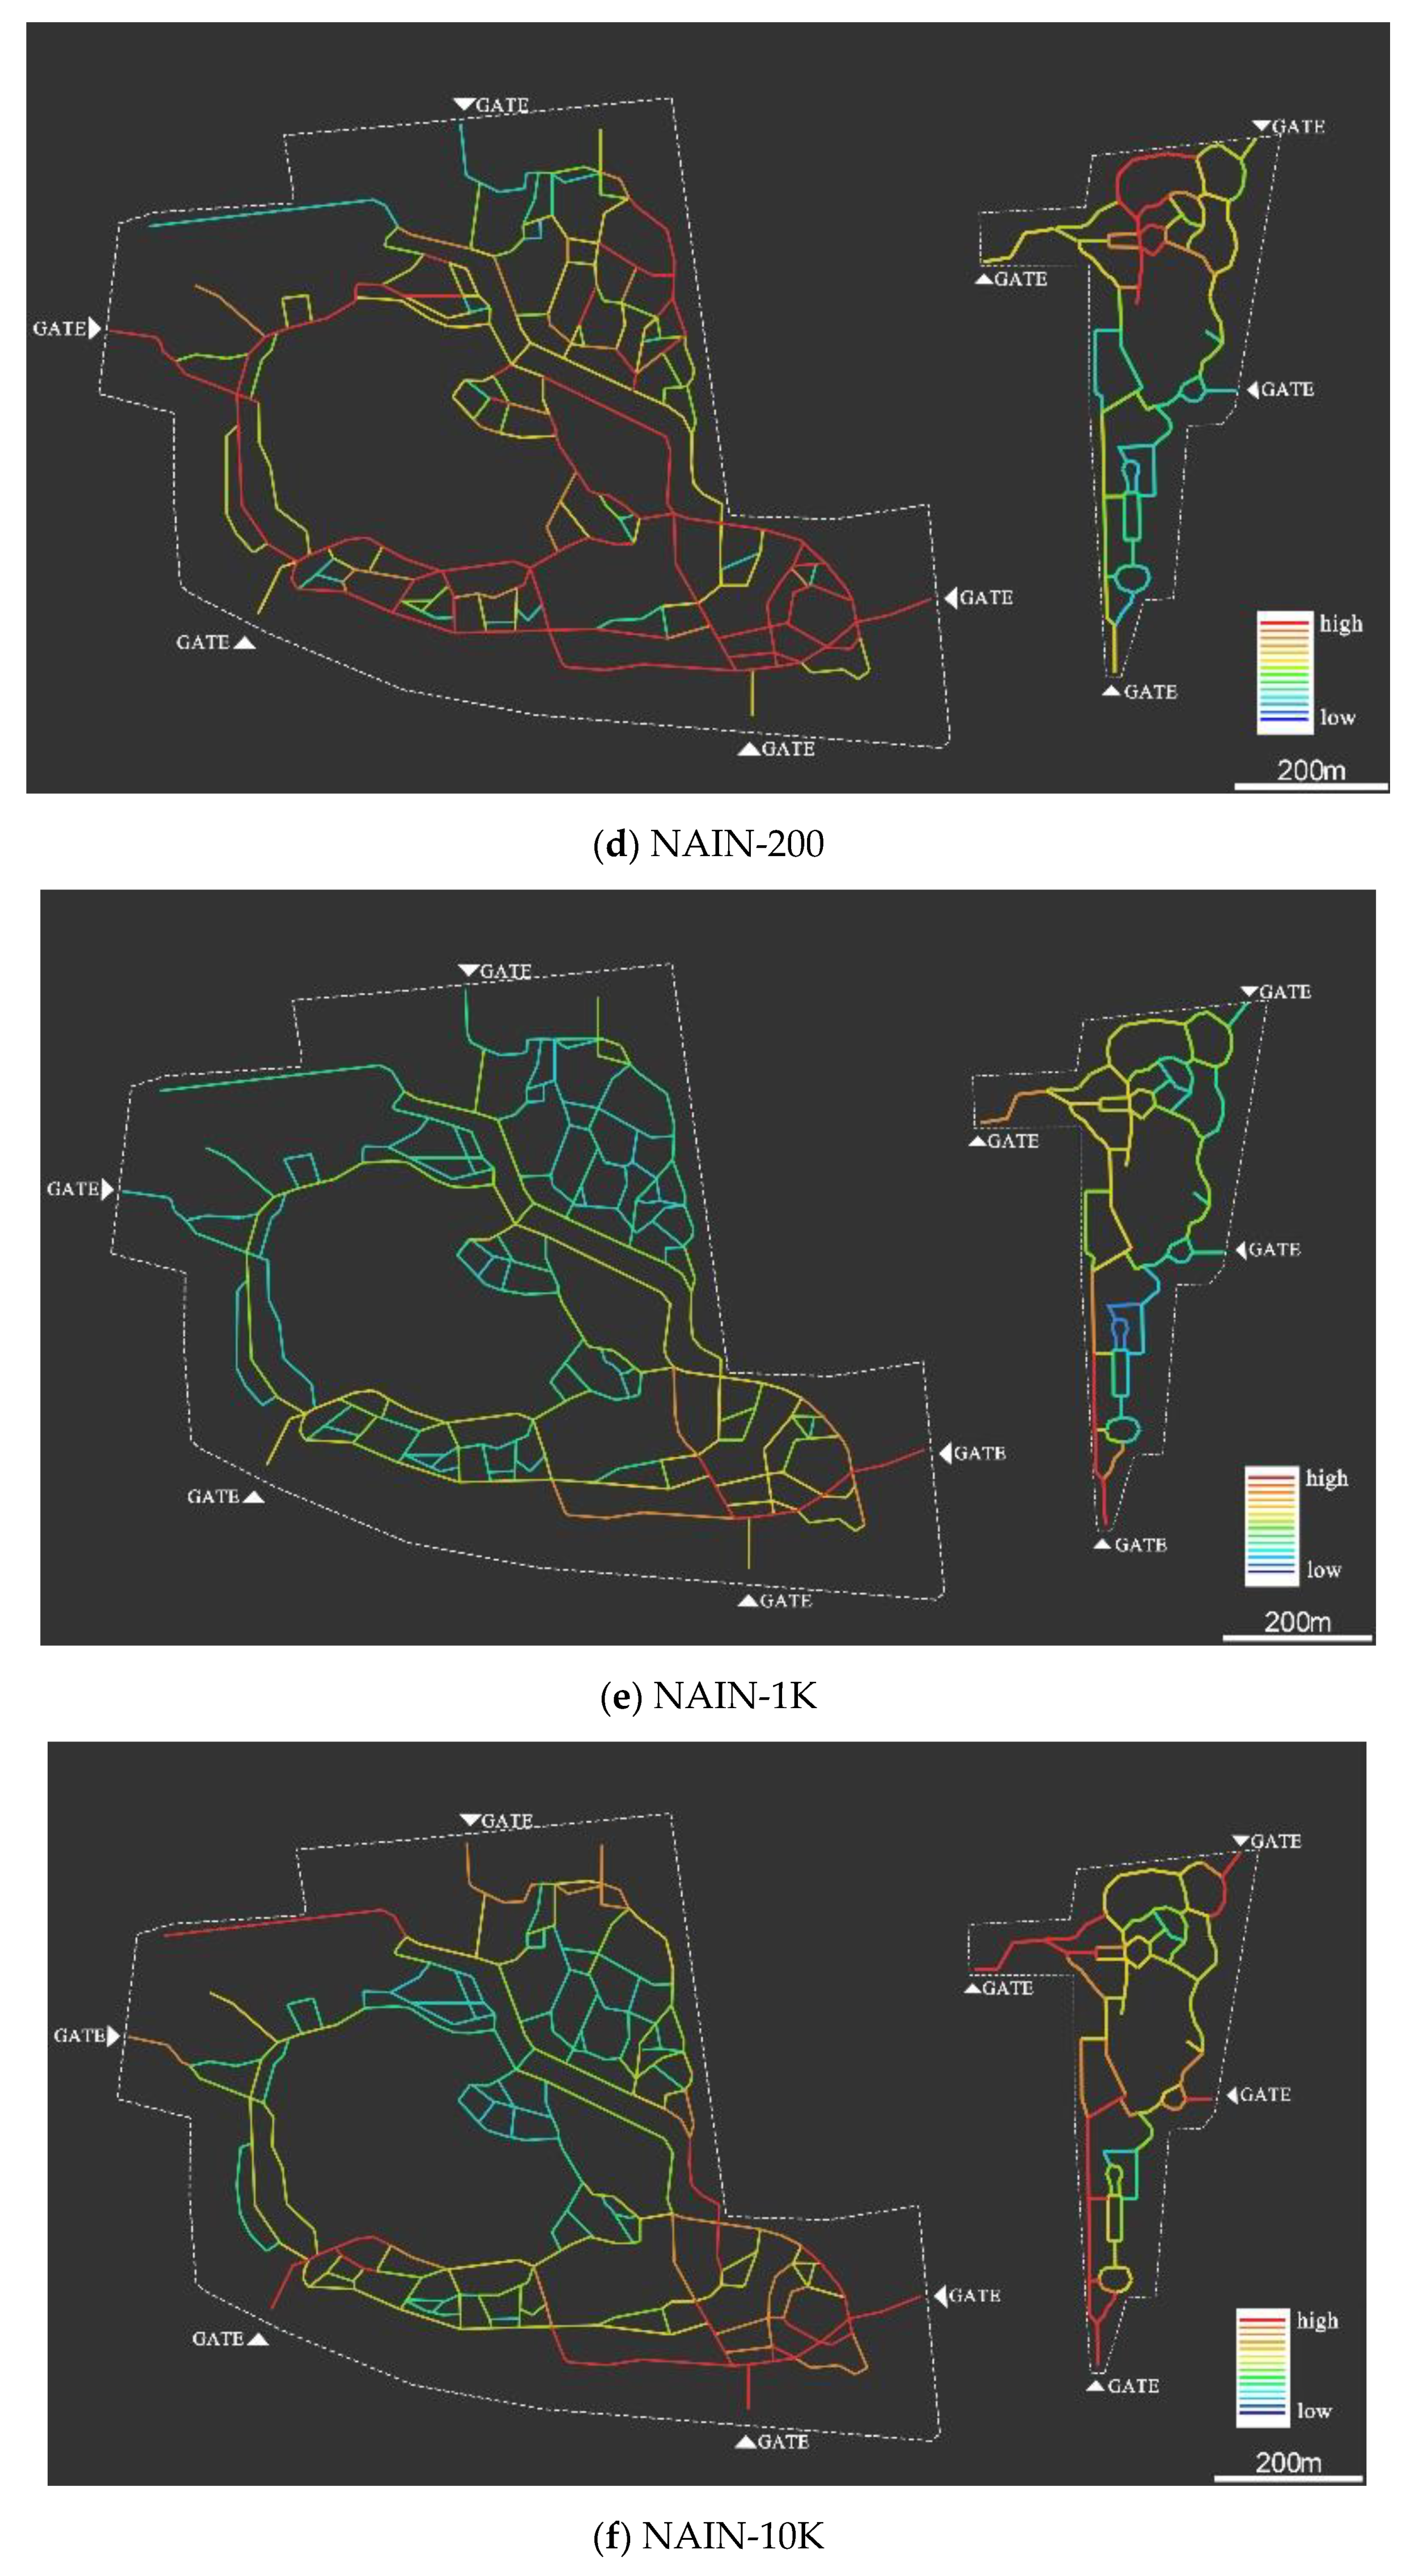
- Integration. Integration is the most widely used index in space syntax and represents how easily a space can be reached from other spaces [42]. A higher integration value indicates that the space is more accessible within the given spatial network on average. To enable the comparison between systems of different sizes, normalized angular integration (NAIN) was suggested by Hiller and Yang, which was used in this study as the measure of the integration for each space [43];
- (4)
- Global integration calculates the integration of the starting space to the whole system [23,28]. However, when focusing on people’s behavior or movement patterns, the local integration is commonly used by applying a calculation radius [39,44]. In this study, two radii, 200 and 1000 m, were first selected according to the range of the park scales to represent walking accessibility. In addition, a larger radius of 10,000 m was also selected to analyze the spatial accessibility of the whole city traffic network through multiple methods of transportation;
- (5)
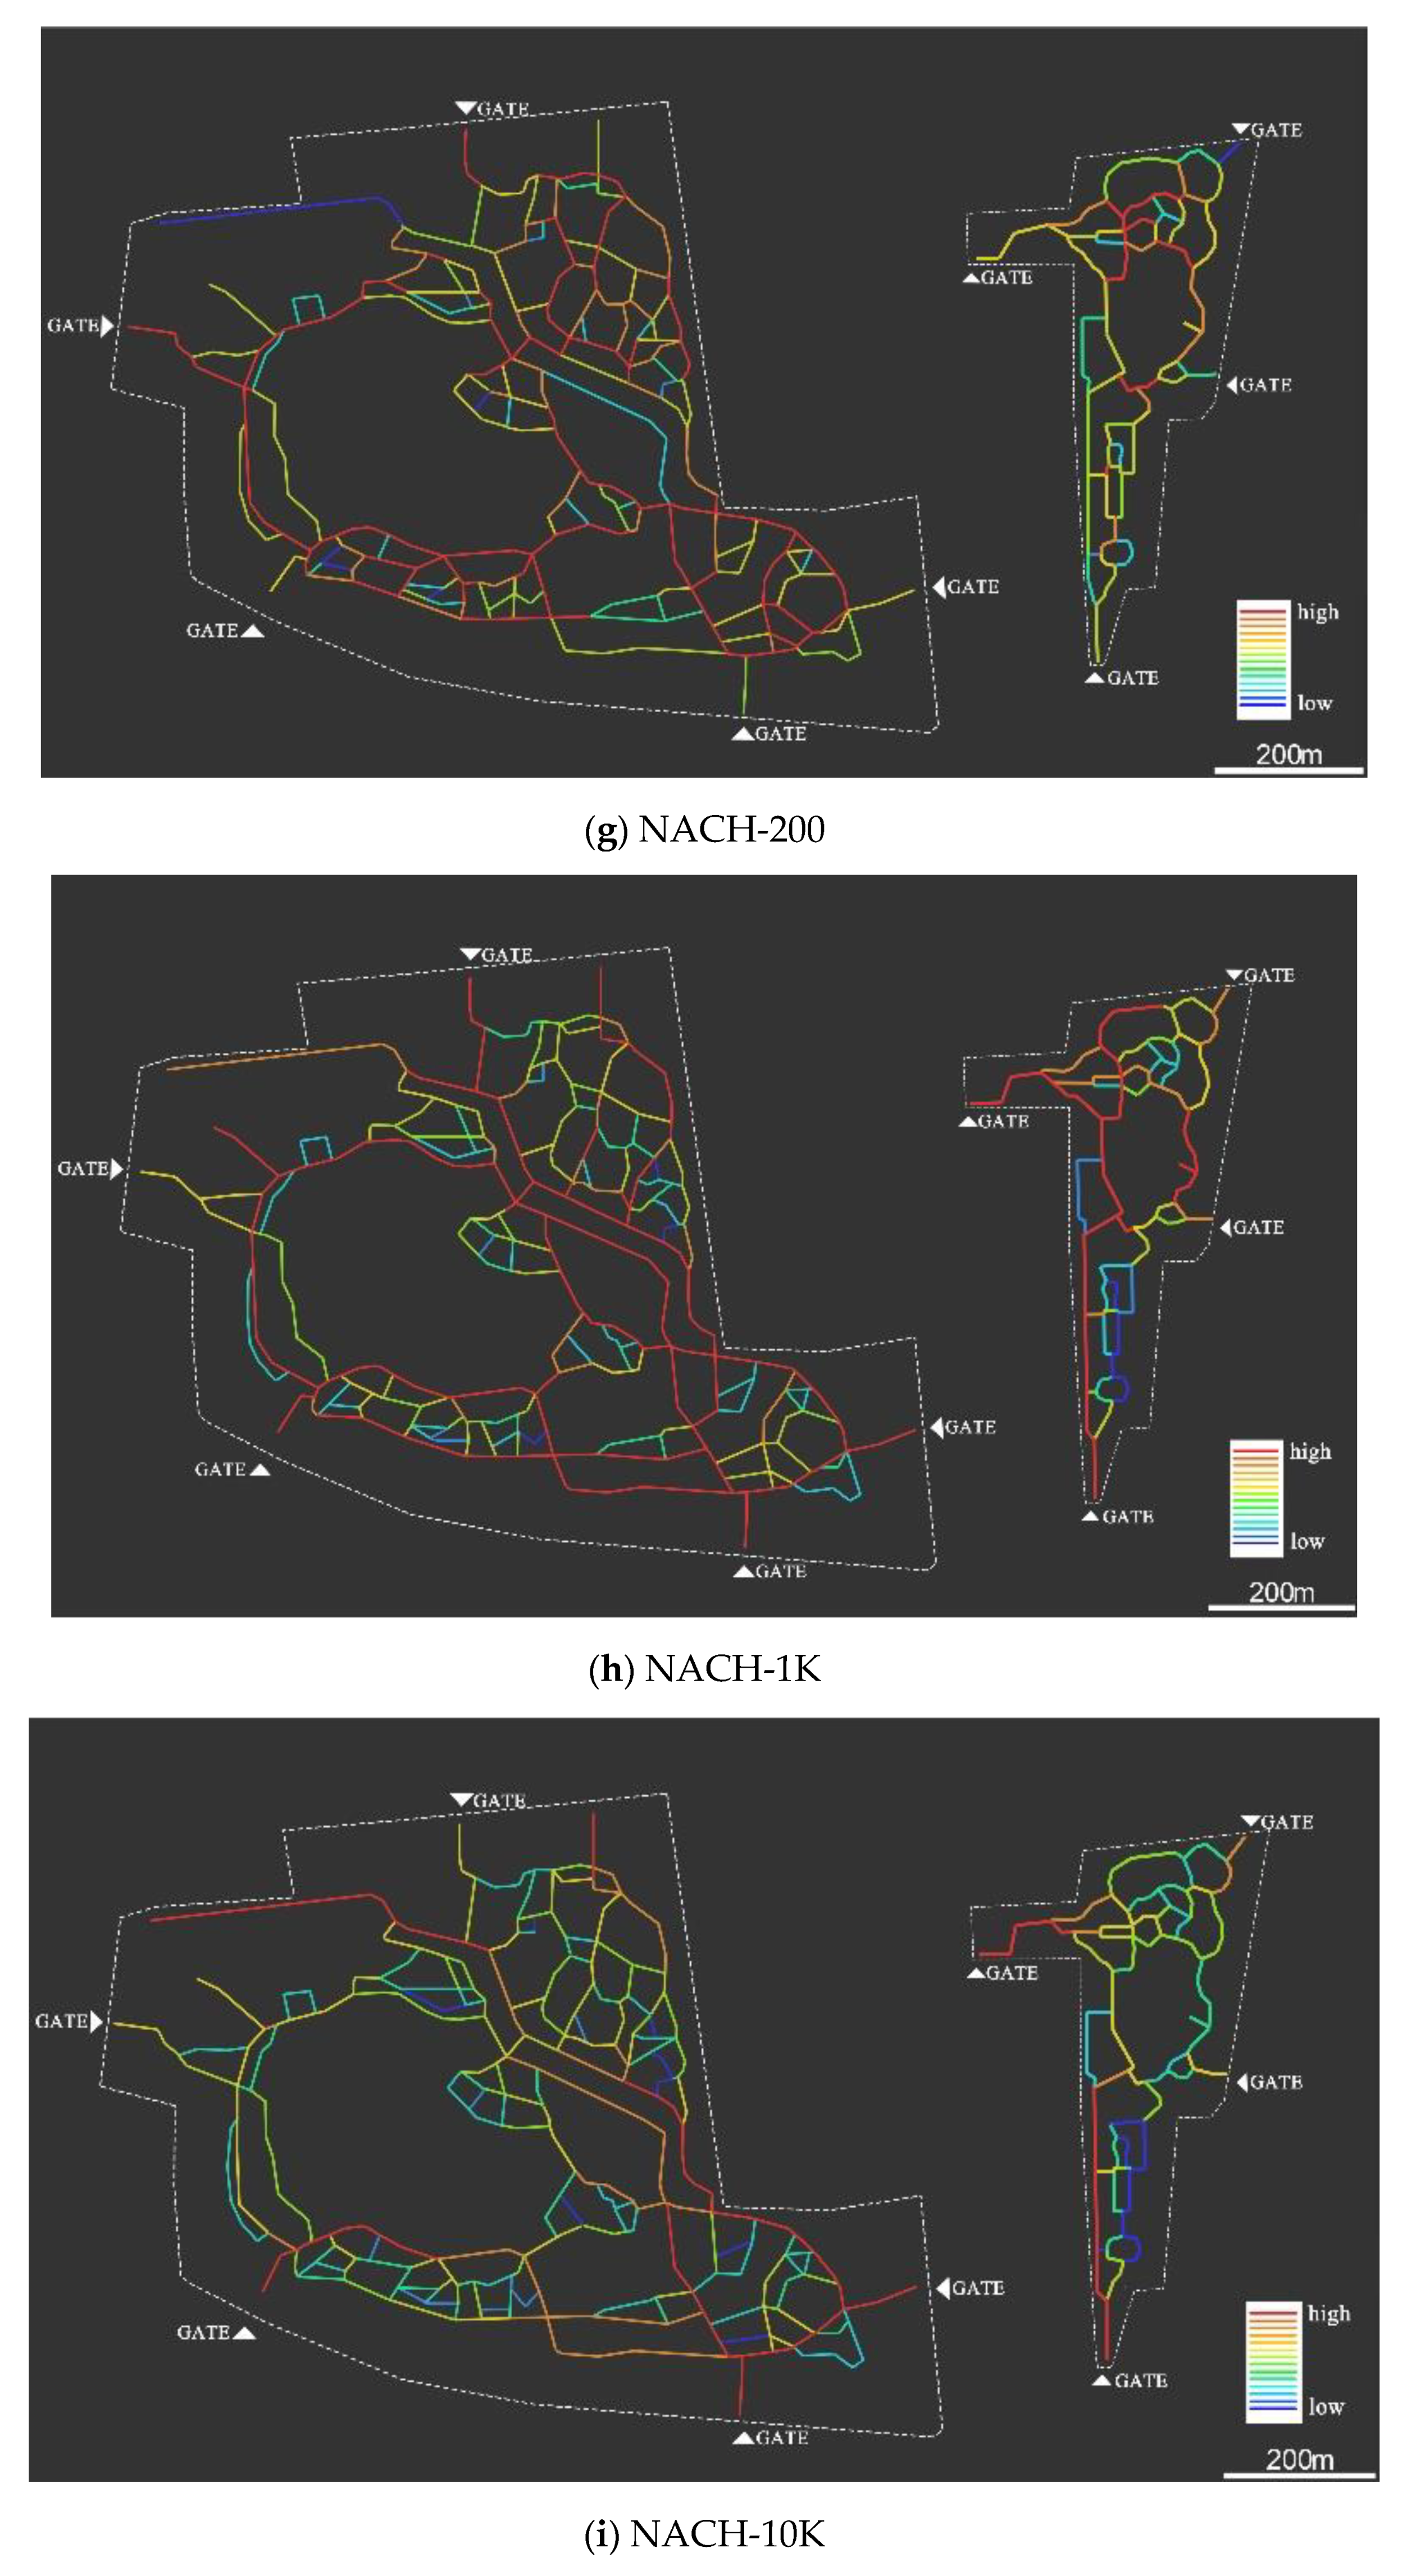
- Choice. Choice is a measure of space usability that considers the potential for each segment element to be selected as the shortest path [45]. A higher choice value indicates that the calculated space is more likely to select by the through-movement in the network. Same as the integration, the normalized angular choice (NACH) with three calculation radii (200, 1000, and 10,000 m) was applied to represent local usability in this study.
3. Results
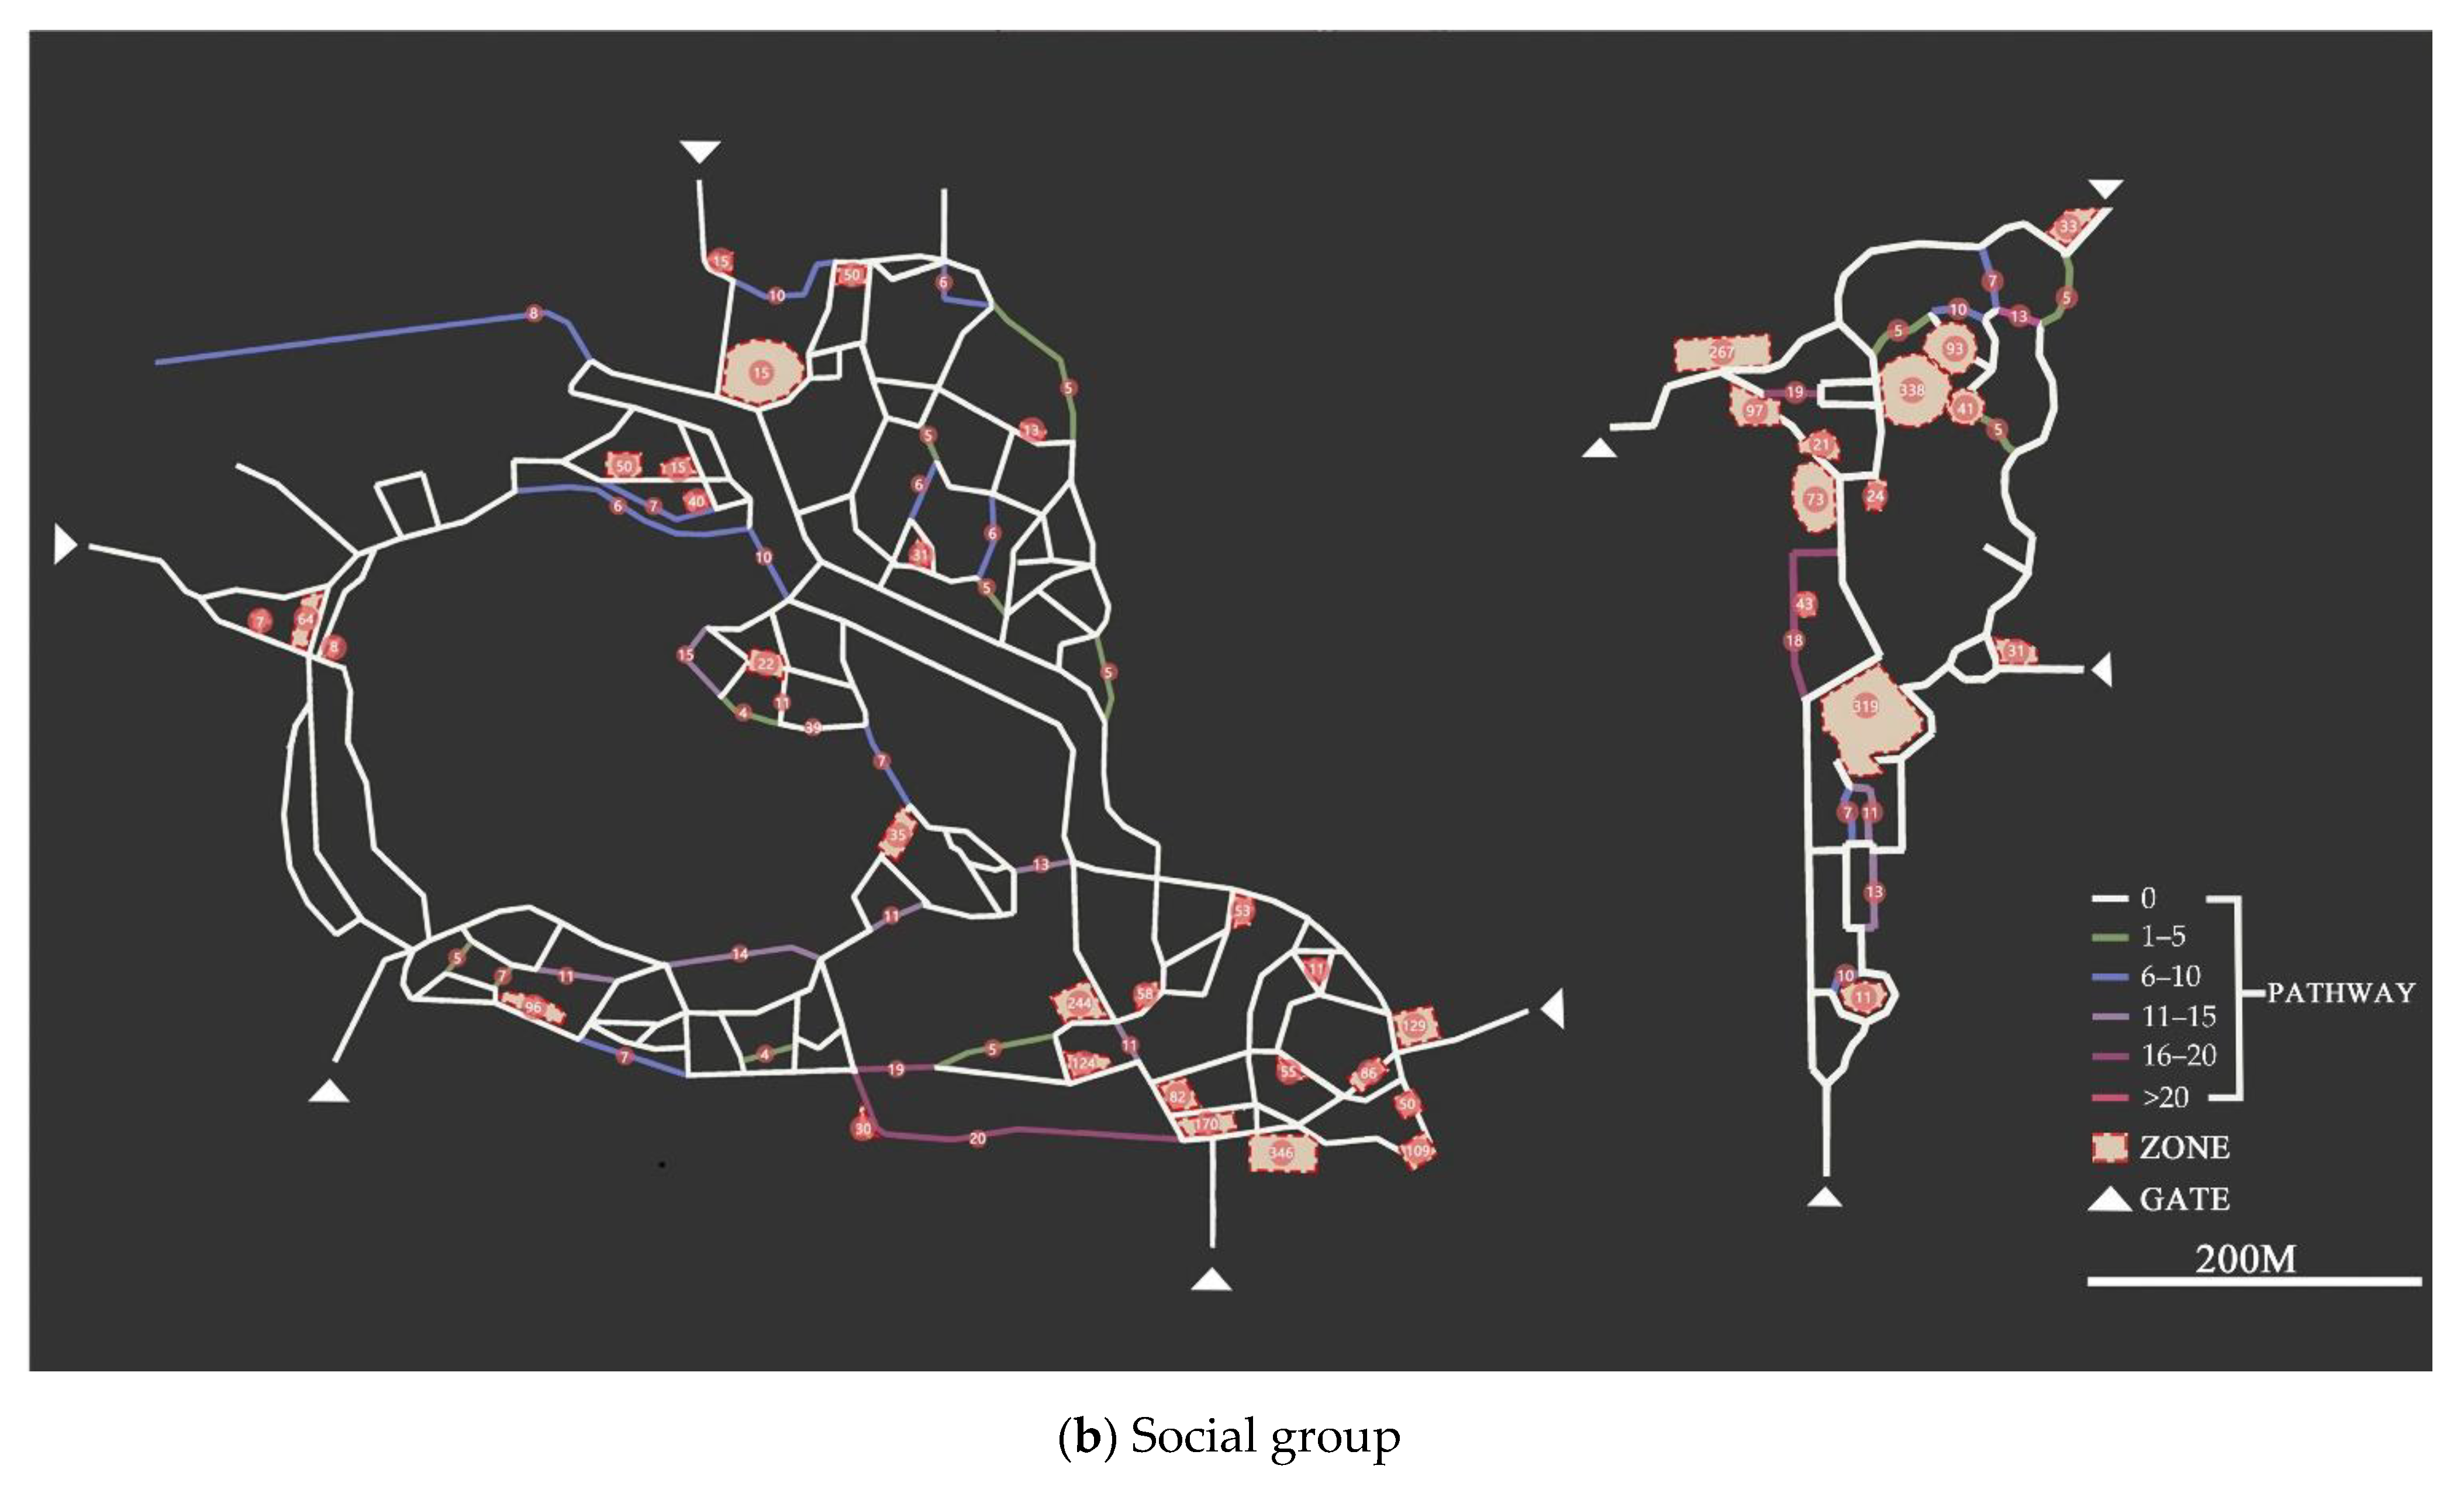
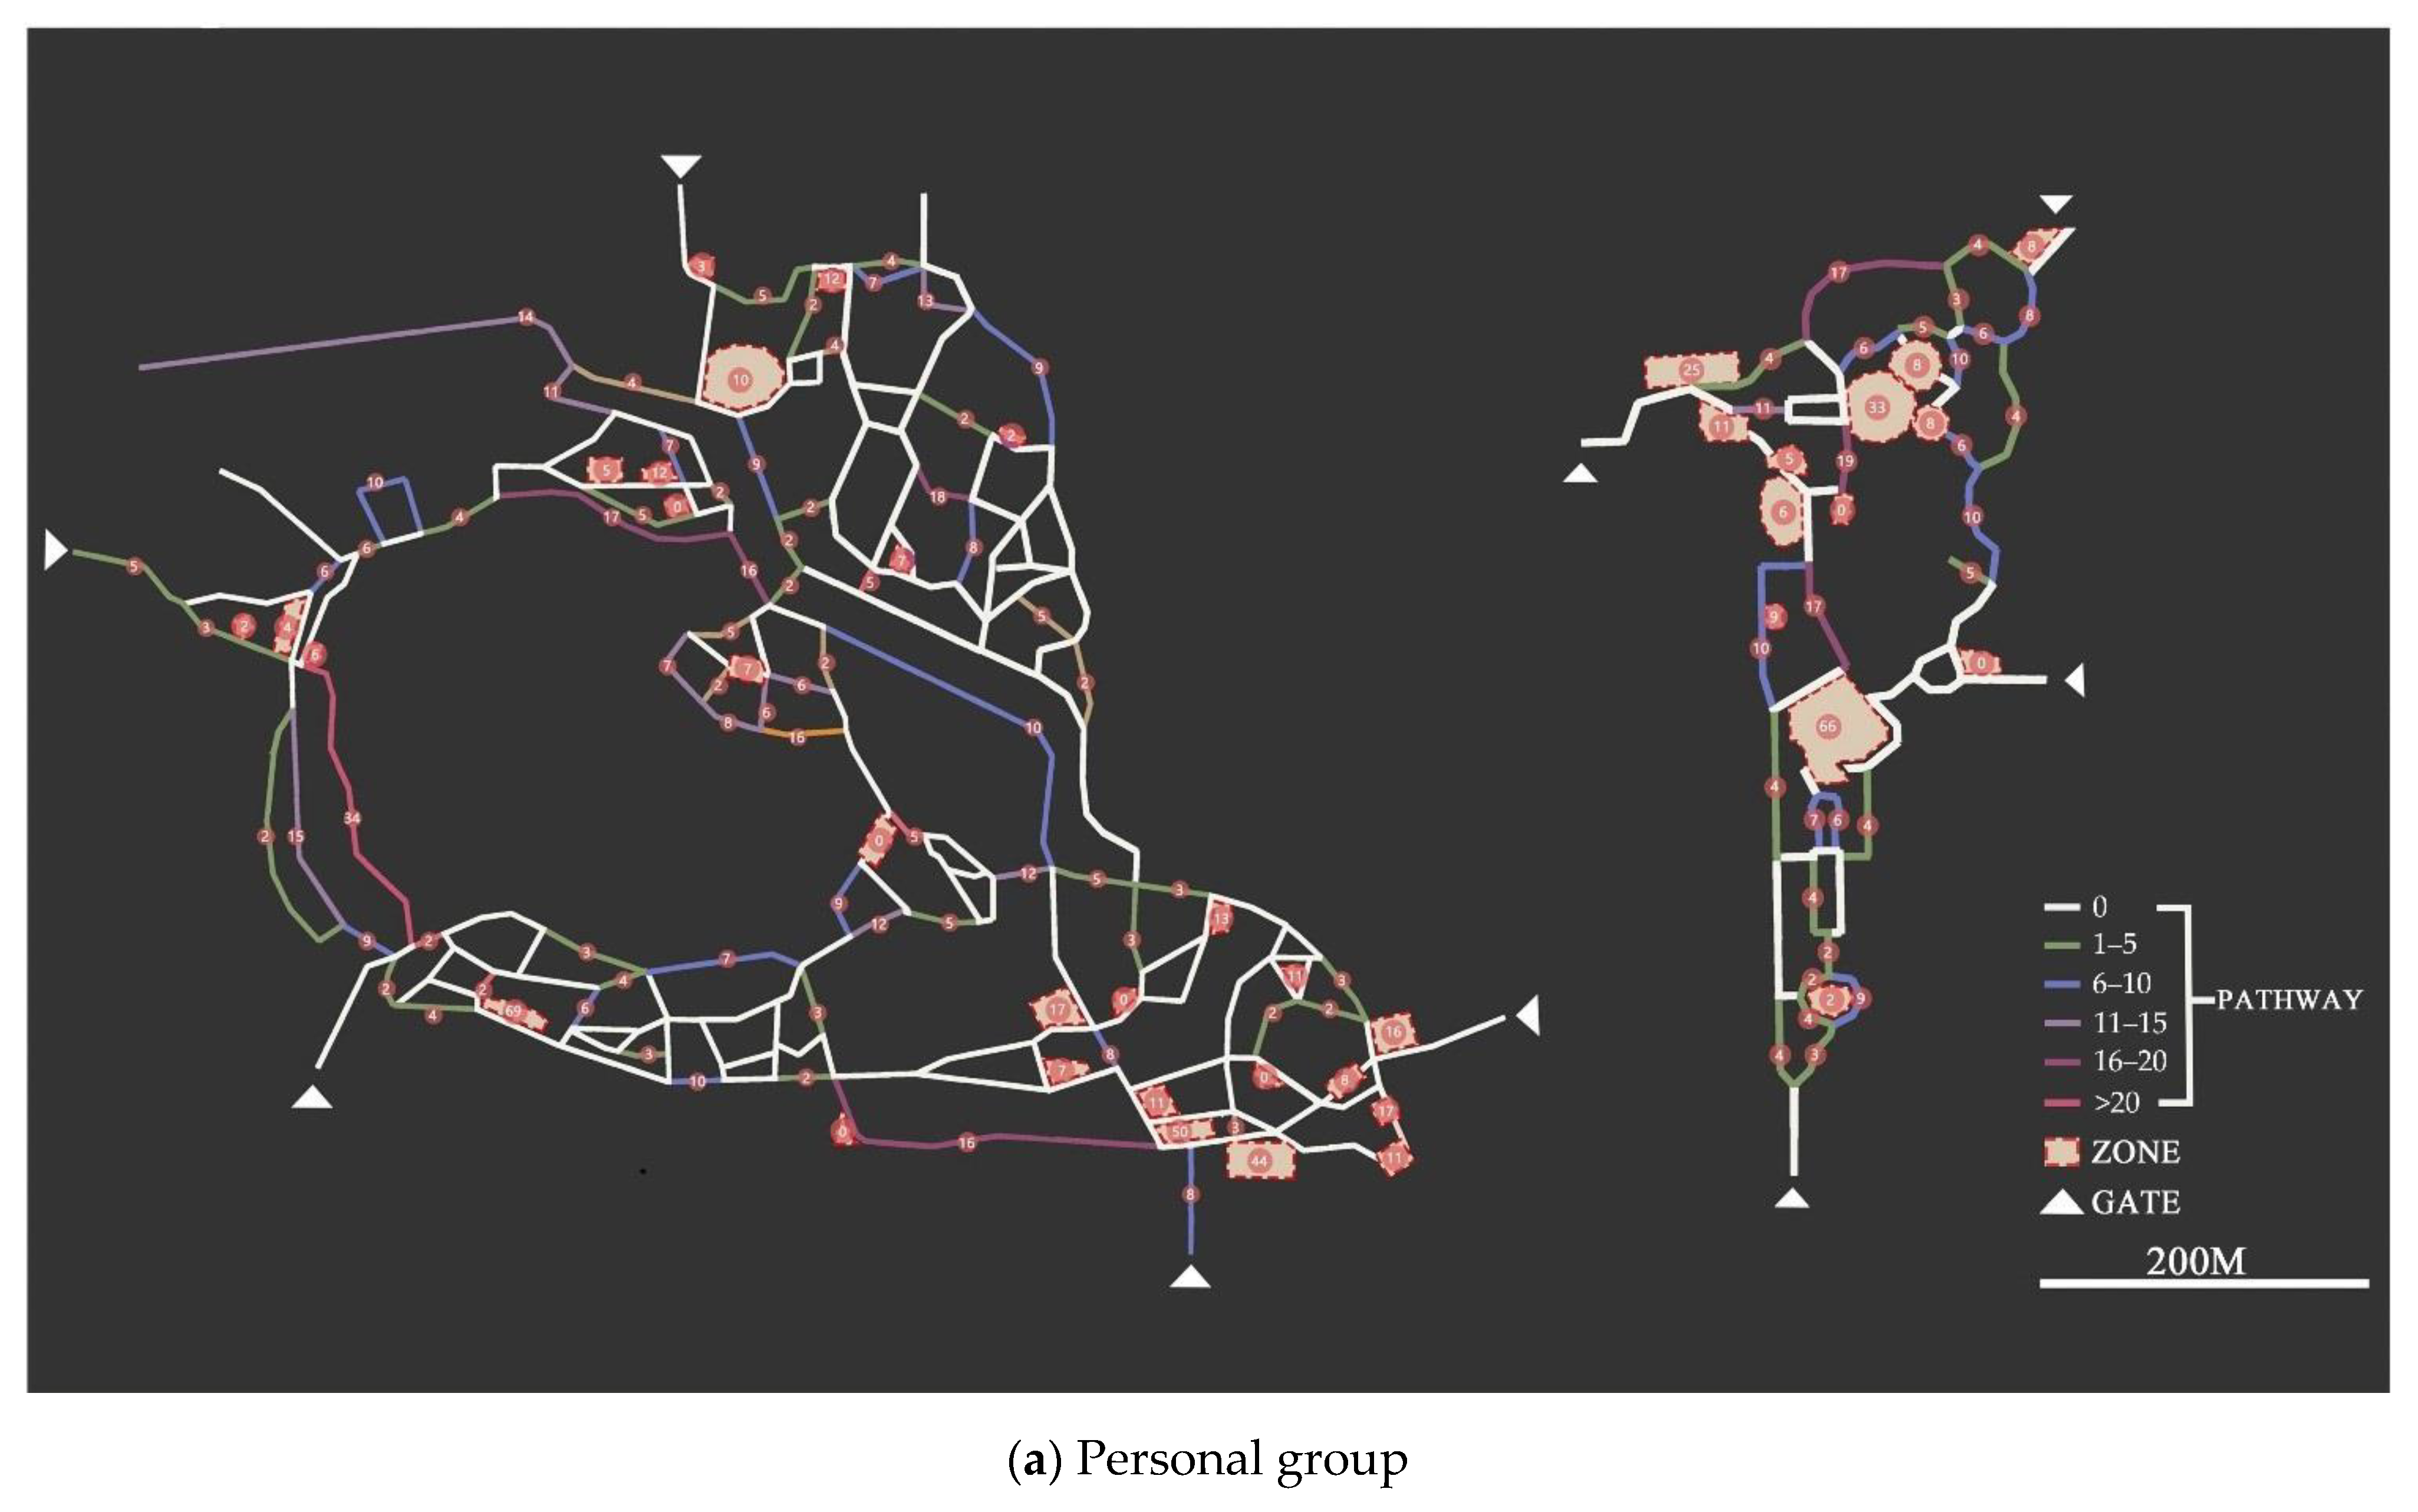
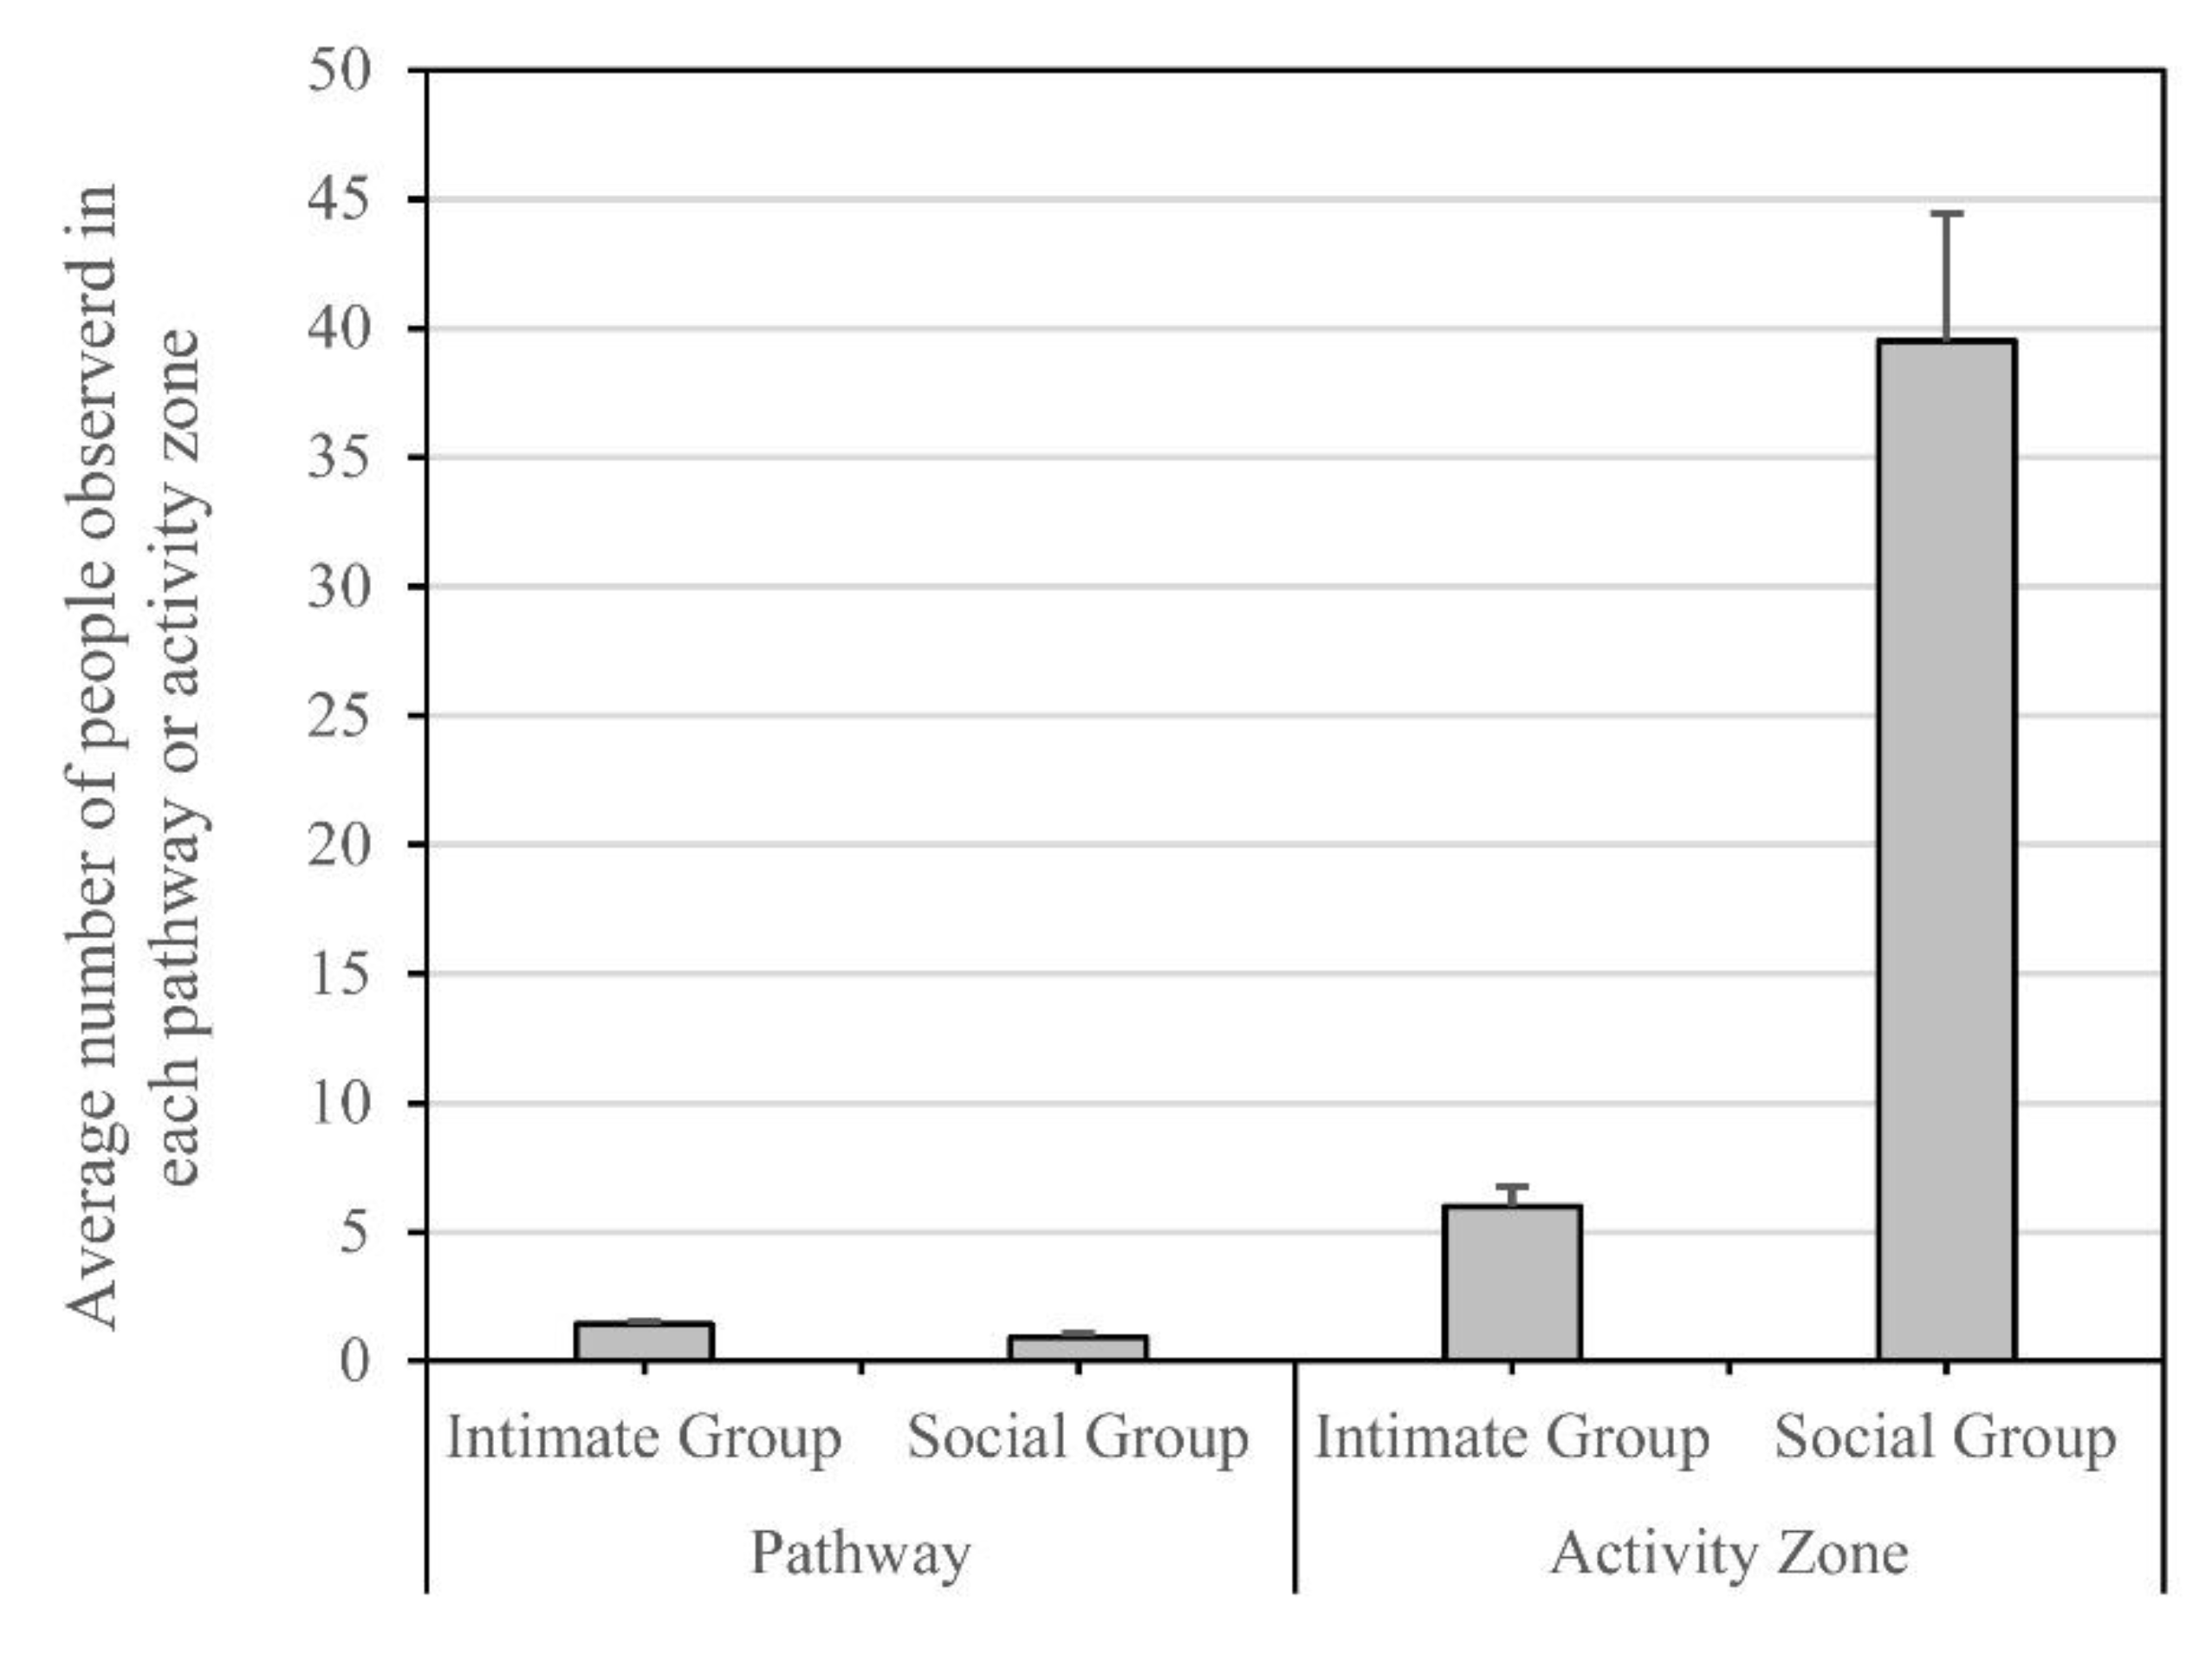
3.1. Social Interactions Observed in Urban Parks
3.2. Spatial Configuration Characteristics in the Parks
3.3. Relationship between Space Characteristics and Social Interaction
4. Discussions and Conclusions
Author Contributions
Funding
Institutional Review Board Statement
Informed Consent Statement
Data Availability Statement
Acknowledgments
Conflicts of Interest
References
- McPherson, M.; Smith-Lovin, L.; Brashears, M.E. Social isolation in America: Changes in core discussion networks over two decades. Am. Sociol. Rev. 2006, 71, 353–375. [Google Scholar] [CrossRef] [Green Version]
- Luo, F.; Guo, L.; Thapa, A.; Yu, B. Social isolation and depression onset among middle-aged and older adults in China: Moderating effects of education and gender differences. J. Affect. Disord. 2021, 283, 71–76. [Google Scholar] [CrossRef]
- Prince, M.J.; Harwood, R.H.; Blizard, R.A.; Thomas, A.; Mann, A.H. Impairment, disability and handicap as risk factors for depression in old age. The Gospel Oak Project V. Psychol. Med. 1997, 27, 311–321. [Google Scholar] [CrossRef]
- Bedimo-Rung, A.L.; Mowen, A.J.; Cohen, D.A. The significance of parks to physical activity and public health: A conceptual model. Am. J. Prev. Med. 2005, 28, 159–168. [Google Scholar] [CrossRef]
- Markevych, I.; Schoierer, J.; Hartig, T.; Chudnovsky, A.; Hystad, P.; Dzhambov, A.M.; de Vries, S.; Triguero-Mas, M.; Brauer, M.; Nieuwenhuijsen, M.J.; et al. Exploring pathways linking greenspace to health: Theoretical and methodological guidance. Environ. Res. 2017, 158, 301–317. [Google Scholar] [CrossRef]
- Krellenberg, K.; Welz, J.; Reyes-Päcke, S. Urban green areas and their potential for social interaction—A case study of a socio-economically mixed neighbourhood in Santiago de Chile. Habitat Int. 2014, 44, 11–21. [Google Scholar] [CrossRef]
- Wright Wendel, H.E.; Zarger, R.K.; Mihelcic, J.R. Accessibility and usability: Green space preferences, perceptions, and barriers in a rapidly urbanizing city in Latin America. Landsc. Urban Plan. 2012, 107, 272–282. [Google Scholar] [CrossRef]
- Cohen, D.A.; Han, B.; Nagel, C.J.; Harnik, P.; McKenzie, T.L.; Evenson, K.R.; Marsh, T.; Williamson, S.; Vaughan, C.; Katta, S. The First National Study of Neighborhood Parks: Implications for Physical Activity. Am. J. Prev. Med. 2016, 51, 419–426. [Google Scholar] [CrossRef] [PubMed] [Green Version]
- Huang, B.X.; Chiou, S.C.; Li, W.Y. Accessibility and street network characteristics of urban public facility spaces: Equity research on parks in Fuzhou City based on gis and space syntax model. Sustainability 2020, 12, 3618. [Google Scholar] [CrossRef]
- Kaczynski, A.T.; Potwarka, L.R.; Saelens, P.B.E. Association of park size, distance, and features with physical activity in neighborhood parks. Am. J. Public Health 2008, 98, 1451–1456. [Google Scholar] [CrossRef]
- Shu, S.; Ma, H. Restorative effects of urban park soundscapes on children’s psychophysiological stress. Appl. Acoust. 2020, 164, 107293. [Google Scholar] [CrossRef]
- Kabisch, N.; Kraemer, R.; Masztalerz, O.; Hemmerling, J.; Püffel, C.; Haase, D. Impact of summer heat on urban park visitation, perceived health and ecosystem service appreciation. Urban For. Urban Green 2021, 60, 127058. [Google Scholar] [CrossRef]
- Sallis, J.F.; Cerin, E.; Conway, T.L.; Adams, M.A.; Frank, L.D.; Pratt, M.; Salvo, D.; Schipperijn, J.; Smith, G.; Cain, K.L.; et al. Physical activity in relation to urban environments in 14 cities worldwide: A cross-sectional study. Lancet 2016, 387, 2207–2217. [Google Scholar] [CrossRef] [Green Version]
- Sreetheran, M.; van den Bosch, C.C.K. A socio-ecological exploration of fear of crime in urban green spaces—A systematic review. Urban For. Urban Green 2014, 13, 1–18. [Google Scholar] [CrossRef]
- Basu, S.; Nagendra, H. Perceptions of park visitors on access to urban parks and benefits of green spaces. Urban For. Urban Green 2021, 57, 126959. [Google Scholar] [CrossRef]
- Siewe, S.; Vadjunec, J.M.; Caniglia, B. The politics of land use in the Korup National Park. Land 2017, 6, 7. [Google Scholar] [CrossRef] [Green Version]
- Rupprecht, C.D.D. Informal urban green space: Residents’ perception, use, and management preferences across four major Japanese shrinking cities. Land 2017, 6, 59. [Google Scholar] [CrossRef]
- Ali, L.; Haase, A.; Heiland, S. Gentrification through green regeneration? Analyzing the Interaction between Inner-City green space development and neighborhood change in the context of regrowth: The Case of Lene-Voigt-Park in Leipzig, Eastern Germany. Land 2020, 9, 24. [Google Scholar] [CrossRef] [Green Version]
- Reyes, M.; Páez, A.; Morency, C. Walking accessibility to urban parks by children: A case study of Montreal. Landsc. Urban Plan. 2014, 125, 38–47. [Google Scholar] [CrossRef]
- Kaczynski, A.T.; Henderson, K.A. Environmental correlates of physical activity: A review of evidence about parks and recreation. Leis. Sci. 2007, 29, 315–354. [Google Scholar] [CrossRef]
- Paul, S.; Nagendra, H. Factors influencing perceptions and use of urban nature: Surveys of park visitors in Delhi. Land 2017, 6, 27. [Google Scholar] [CrossRef] [Green Version]
- Zhai, Y.; Li, D.; Wu, C.; Wu, H. Urban park facility use and intensity of seniors’ physical activity—an examination combining accelerometer and GPS tracking. Landsc. Urban Plan. 2021, 205, 103950. [Google Scholar] [CrossRef]
- Zhai, Y.; Baran, P.K. Do configurational attributes matter in context of urban parks? Park pathway configurational attributes and senior walking. Landsc. Urban Plan. 2016, 148, 188–202. [Google Scholar] [CrossRef]
- Baran, P.K.; Smith, W.R.; Moore, R.C.; Floyd, M.F.; Bocarro, J.N.; Cosco, N.G.; Danninger, T.M. Park Use Among Youth and Adults: Examination of Individual, Social, and Urban Form Factors. Environ. Behav. 2014, 46, 768–800. [Google Scholar] [CrossRef]
- Moran, M.R.; Rodríguez, D.A.; Cotinez-O’Ryan, A.; Miranda, J.J. Park use, perceived park proximity, and neighborhood characteristics: Evidence from 11 cities in Latin America. Cities 2020, 105, 102817. [Google Scholar] [CrossRef]
- Baran, P.K.; Rodríedguez, D.A.; Khattak, A.J. Space syntax and walking in a New Urbanist and suburban neighbourhoods. J. Urban Des. 2008, 13, 5–28. [Google Scholar] [CrossRef]
- Ozbil, A.; Peponis, J.; Stone, B. Understanding the link between street connectivity, land use and pedestrian flows. Urban Des. Int. 2011, 16, 125–141. [Google Scholar] [CrossRef]
- Lee, S.; Yoo, C.; Seo, K.W. Determinant factors of pedestrian volume in different land-use zones: Combining space syntax metrics with GIS-based built-environment measures. Sustainability 2020, 12, 8647. [Google Scholar] [CrossRef]
- Can, I.; Heath, T. In-between spaces and social interaction: A morphological analysis of Izmir using space syntax. J. Hous. Built Environ. 2016, 31, 31–49. [Google Scholar] [CrossRef] [Green Version]
- Soares, I.; Yamu, C.; Weitkamp, G. The relationship between the spatial configuration and the fourth sustainable dimension creativity in university campuses: The case study of Zernike campus, Groningen, the Netherlands. Sustainability 2020, 12, 9263. [Google Scholar] [CrossRef]
- Zerouati, W.; Bellal, T. Evaluating the impact of mass housings’ in-between spaces’ spatial configuration on users’ social interaction. Front. Archit. Res. 2019. [Google Scholar] [CrossRef]
- Lipovská, B.; Štěpánková, R. Assessing Observation Methods for Landscape Planning Practice in Rural Villages. Curr. Urban Stud. 2013, 01, 102–109. [Google Scholar] [CrossRef] [Green Version]
- Cosco, N.G.; Moore, R.C.; Islam, M.Z. Behavior mapping: A method for linking preschool physical activity and outdoor design. Med. Sci. Sports Exerc. 2010, 42, 513–519. [Google Scholar] [CrossRef] [PubMed] [Green Version]
- Hall, E.T. The Hidden Dimension; Peter Smith Pub: Gloucester, MA, USA, 1992. [Google Scholar]
- Cao, J.; Kang, J. Social relationships and patterns of use in urban public spaces in China and the United Kingdom. Cities 2019, 93, 188–196. [Google Scholar] [CrossRef]
- Li, D.; Zhai, Y.; Xiao, Y.; Newman, G.; Wang, D. Subtypes of park use and self-reported psychological benefits among older adults: A multilevel latent class analysis approach. Landsc. Urban Plan. 2019, 190, 103605. [Google Scholar] [CrossRef]
- Hillier, B. Space Is the Machine: A Configurational Theory of Architecture; Cambridge University Press: Cambridge, UK, 1996. [Google Scholar]
- Raman, S. Designing a liveable compact city physical forms of city and social life in urban neighbourhoods. Built Environ. 2010, 36, 63–80. [Google Scholar] [CrossRef]
- Esposito, D.; Santoro, S.; Camarda, D. Agent-based analysis of urban spaces using space syntax and spatial cognition approaches: A case study in Bari, Italy. Sustainability 2020, 12, 4625. [Google Scholar] [CrossRef]
- Tannous, H.O.; Major, M.D.; Furlan, R. Accessibility of green spaces in a metropolitan network using space syntax to objectively evaluate the spatial locations of parks and promenades in Doha, State of Qatar. Urban For. Urban Green 2021, 58. [Google Scholar] [CrossRef]
- Bafna, S. Space syntax: A brief introduction to its logic and analytical techniques. Environ. Behav. 2003, 35, 17–29. [Google Scholar] [CrossRef]
- Hillier, B.; Iida, S. Network effects and psychological effects: A theory of urban movement. In Proceedings of the Fifth Space Syntax Symposium, Delft, The Netherlands, 13–17 June 2005. [Google Scholar]
- Hillier, B.; Yang, T.; Turner, A. Normalising least angle choice in Depthmap and how it opens new perspectives on the global and local analysis of city space new perspectives on the global and local analysis of city space. J. Sp. Syntax 2012, 3, 155–193. [Google Scholar]
- Al-Sayed, K.; Turner, A.; Hillier, B.; Iida, S.; Penn, A. Space Syntax Methodology, 4th ed.; Bartlett School of Architecture-UCL: London, UK, 2018. [Google Scholar]
- Turner, A.B.T. Angular analysis. In Proceedings of the 3rd International Symposium on Space Syntax, Atlanta, GA, USA, 1 May 2001. [Google Scholar]
- Bjerke, T.; Østdahl, T.; Thrane, C.; Strumse, E. Vegetation density of urban parks and perceived appropriateness for recreation. Urban For. Urban Green. 2006, 5, 35–44. [Google Scholar] [CrossRef]
- Bocarro, J.N.; Floyd, M.F.; Smith, W.R.; Edwards, M.B.; Schultz, C.L.; Baran, P.; Moore, R.A.; Cosco, N.; Suau, L.J. Social and environmental factors related to boys’ and girls’ park-based physical activity. Prev. Chronic Dis. 2015, 12, 1–10. [Google Scholar] [CrossRef] [PubMed] [Green Version]
- Shirazi, M.R. Compact urban form: Neighbouring and social activity. Sustainability 2020, 12, 1987. [Google Scholar] [CrossRef] [Green Version]
- Staats, H.; Gatersleben, B.; Hartig, T. Change in mood as a function of environmental design: Arousal and pleasure on a simulated forest hike. J. Environ. Psychol. 1997, 17, 283–300. [Google Scholar] [CrossRef]
- Kaplan, R.; Kaplan, S.; Brown, T. Environmental Preference: A Comparison of Four Domains of Predictors. Environ. Behav. 1989, 21, 509–530. [Google Scholar] [CrossRef] [Green Version]


| Activity Type | Space Type | |||
|---|---|---|---|---|
| Pathway | Zone | Total | ||
| Number of People | Personal Group | 643 (13%) | 516 (10%) | 1159 (23%) |
| Social Group | 425 (9%) | 3399 (68%) | 3824 (77%) | |
| Total | 1068 (21%) | 3915 (79%) | 4983 (100%) | |
| Number of Activity | Personal Group | 267 (36%) | 179 (24%) | 446 (61%) |
| Social Group | 60 (8%) | 229 (31%) | 289 (39%) | |
| Total | 327 (44%) | 408 (56%) | 735 (100%) | |
| DtoR | DtoG | Connectivity | NACH-200 | NACH-1K | NACH-10K | NAIN-200 | NAIN-1K | NAIN-10K | |
|---|---|---|---|---|---|---|---|---|---|
| DtoR | 1 | ||||||||
| DtoG | 0.16 * | 1 | |||||||
| Connectivity | −0.13 | 0.10 | 1 | ||||||
| NACH-200 | −0.20 ** | −0.03 | −0.20 ** | 1 | |||||
| NACH-1K | −0.19 ** | −0.09 | −0.23 ** | 0.63 ** | 1 | ||||
| NACH-10K | −0.24 ** | −0.13 | −0.24 ** | 0.54 ** | 0.86 ** | 1 | |||
| NAIN-200 | −0.61 ** | 0.21 ** | 0.00 | 0.59 ** | 0.45 ** | 0.43 ** | 1 | ||
| NAIN-1K | −0.69 ** | 0.06 | 0.03 | 0.41 ** | 0.57 ** | 0.52 ** | 0.81 ** | 1 | |
| NAIN-10K | −0.65 ** | −0.21 ** | 0.00 | 0.28 ** | 0.52 ** | 0.57 ** | 0.60 ** | 0.83 ** | 1 |
| Source | SS | df | MS | F | Sig. | |
|---|---|---|---|---|---|---|
| Time | 9.896 | 1 | 9.896 | 0.046 | 0.830 | 0.000 |
| Space Type | 67,216.550 | 1 | 67,216.550 | 311.516 | 0.000 ** | 0.226 |
| Activity Type | 6625.210 | 1 | 6625.210 | 30.705 | 0.000 ** | 0.028 |
| Lateral Visibility | 1009.242 | 2 | 504.621 | 2.345 | 0.096 | 0.004 |
| Controlled Variables (Number and Percentage of Observed People) | Predictor Variables | Coef. (B) | SE | Sig. | VIF | Overall Model | |
|---|---|---|---|---|---|---|---|
| Pathway | Personal Group (643, 13%) | Length | 0.027 | 0.003 | 0.000 | 1.026 | R2adj = 0.147; Sig. = 0.000 |
| NAIN-1K | −4.983 | 1.151 | 0.000 | 1.385 | |||
| NACH-10K | 2.758 | 0.865 | 0.002 | 1.370 | |||
| Social Group (425, 9%) | DtoR | 0.003 | 0.000 | 0.003 | 1.014 | R2adj = 0.028; Sig. = 0.000 | |
| Length | 0.011 | 0.004 | 0.006 | 1.014 | |||
| Activity Zone | Personal Group (516, 10%) | Area | 0.37 | 0.042 | 0.000 | 1.108 | R2adj = 0.492; Sig. = 0.000 |
| NAIN-1K | 120.333 | 22.275 | 0.000 | 1.108 | |||
| Social Group (3915, 68%) | Area | 0.056 | 0.008 | 0.000 | 1.170 | R2adj = 0.351; Sig. = 0.000 | |
| DtoR | −0.016 | 0.004 | 0.000 | 1.170 | |||
Publisher’s Note: MDPI stays neutral with regard to jurisdictional claims in published maps and institutional affiliations. |
© 2021 by the authors. Licensee MDPI, Basel, Switzerland. This article is an open access article distributed under the terms and conditions of the Creative Commons Attribution (CC BY) license (https://creativecommons.org/licenses/by/4.0/).
Share and Cite
Sheng, Q.; Wan, D.; Yu, B. Effect of Space Configurational Attributes on Social Interactions in Urban Parks. Sustainability 2021, 13, 7805. https://doi.org/10.3390/su13147805
Sheng Q, Wan D, Yu B. Effect of Space Configurational Attributes on Social Interactions in Urban Parks. Sustainability. 2021; 13(14):7805. https://doi.org/10.3390/su13147805
Chicago/Turabian StyleSheng, Qiang, Dongyang Wan, and Boya Yu. 2021. "Effect of Space Configurational Attributes on Social Interactions in Urban Parks" Sustainability 13, no. 14: 7805. https://doi.org/10.3390/su13147805
APA StyleSheng, Q., Wan, D., & Yu, B. (2021). Effect of Space Configurational Attributes on Social Interactions in Urban Parks. Sustainability, 13(14), 7805. https://doi.org/10.3390/su13147805