Abstract
This paper used the sectional data of Chinese counties to analyze the spatial distribution characteristics of sustainable development of e-commerce for agricultural products in China at the county-level. The standard deviation ellipses and Moran’s index were used to research this subject. Then, by constructing spatial measurement models, the spatial spillover effects and influencing factors of the development of county-level agricultural products e-commerce were analyzed from economic development, economic structure, economic vitality, and agricultural development. The results show that: (1) the top 100 counties of agricultural products e-commerce mainly concentrate in southeastern China, spreading along the northeast and southwest; (2) the county-level agricultural products e-commerce shows significant negative spatial spillover effects; (3) the level of economic development and public services have a positive impact on the development of county-level agricultural products e-commerce, while the level of industrial development shows a negative correlation; (4) the level of agricultural development and industrial development have a significant negative external effect on the development of agricultural products e-commerce. This study is of great significance to promote the sustainable development of agricultural products e-commerce, the process of rural urbanization and the optimization of county industrial patterns.
1. Introduction
Nowadays, e-commerce has become an important channel for the circulation of global commodities. Almost all companies are trying to expand their customers by trading online. In 2019, the sales volume of agricultural products e-commerce in China was 397.5 billion yuan, up 27% year-on-year and nearly eight times that of 2013. The huge population of China provides enough consumers to assist the standardized development of the agricultural products e-commerce market. Chinese e-commerce of agricultural products is in a period of stable growth, which can be used for reference by other countries, especially countries dominated by agriculture.
At present, the Chinese economy is transiting from the traditional to the new. In the process of implementing the supply-side structural reform, e-commerce plays an important role as the link of industrial integration [1]. Since 2015, the Chinese government has issued several policies to promote the development of rural e-commerce [2]. Encouraged by various measures, e-commerce of agricultural products has developed rapidly and contributed to poverty alleviation. In 2019, the online retail sales of agricultural products in China’s counties was 269.31 billion yuan that is a 28.5% increase compared with the last year. Among them, the total sales amount of 823 poverty-stricken counties is 19.08 billion yuan. In China, the per capita average area of cultivated land is too small and the modernization of agriculture has not had a comprehensive implementation yet. Through the development of e-commerce, the added value of agricultural products has increased, which helps to improve agricultural productivity.
E-commerce is being used increasingly by consumers to buy high value-added agricultural products with geographical indication, green, and organic labels [3]. E-commerce can control product quality by controlling the source, information tracing and customizing [4]. It makes the sale and purchase of agricultural products more convenient and provides new business opportunities for agriculture [5]. During COVID-19, the online food supply chain, which provided convenience for home segregation, reduced unnecessary population gathering and exposure [6,7]. E-commerce for agricultural products helps to build a green environment and promotes the sustainable development of agriculture [8,9].
E-commerce lets farmers obtain market information easier, expanding the sale space of agricultural products. It has changed the status that farmers are forced to accept prices, eased the periodic fluctuation of the price of agricultural products, and helped to sell agricultural products from rural areas to cities [10,11,12]. The development of e-commerce for agricultural products has promoted the expectation price and marginal revenue of pollution-free agricultural products, thus promoting the development of green agriculture [13,14]. Although the development of e-commerce provides more opportunities for the cross-border trade of agricultural products, it does not change the deficit of trade [15,16]. At present, the e-commerce business of agricultural products’ leading enterprises has not ushered in explosive growth yet. With the gradual perfection of e-commerce departments, the enterprise profits will sustain growth [17]. Only with agricultural products as the core, will the sustainable development of rural e-commerce be achieved [18,19].
According to the results of recent research, the expected return of e-commerce will be improved with the increasing freshness of agricultural products. Only safe, high-quality, and trustworthy agricultural products can obtain better prices and higher sales volume through e-commerce. Improving the seller’s reputation and providing high-quality after-sales service can help to enhance the loyalty of consumers in e-commerce [20,21,22,23,24,25]. Agricultural products with unique cultural connotations and the added value of being ecologically friendly are more suitable for the development of e-commerce, so the characteristic agricultural production areas have the obvious advantages in the development of e-commerce [21,26,27]. Increasing the type of packaged products and improving the brand image of agricultural products can be used to enhance the added value of agricultural products [28].
As most farmers tend to avoid risks and in a disadvantageous position in the contractual relationship of e-commerce, government intervention is needed to help its development [19,29,30]. The development of agricultural products e-commerce can be hindered by underdeveloped industry, weak processing capacity of agricultural products, the lack of agricultural products for online sales, remote geographical location, high entry barriers for B2C platforms and difficulties marketing in C2C platforms [31,32]. The over-investment in information technology will not necessarily lead to the development of e-commerce, but the opening of county-level e-government is conducive [33,34].
Moran’s index and the e-commerce development index, analytic hierarchy process, social network analysis, entropy method, spatial econometric model, and data envelopment analysis are widely used in the existing research on e-commerce of agricultural products [35,36,37,38,39,40,41,42,43]. At present, the correlation study of e-commerce focuses on the use of robust models, such as theory of planned behavior (TPB), and statistical analysis is generally completed by the structural equation model [5,44].
Because the lack of official statistical data on agricultural products e-commerce in China, the data used by scholars in correlation study are generally from the Alibaba platform, including the county e-commerce development index released by Alibaba Group in 2015 and the number of shops major managed in the agricultural products sections of Taobao and T-mall platforms in various regions [42,43,45,46]. Therefore, the research on the development of agricultural products e-commerce in China is mostly qualitative analysis, with less quantitative research.
Based on the top 100 counties for agricultural products e-commerce in China, this study makes a quantitative analysis of the development of agricultural products e-commerce in China at the county-level. By drawing the standard deviation ellipses, which depend on the geographic coordinates of the counties, the spatial distribution characteristics of agricultural products e-commerce development in China at the county-level in the past two years were analyzed. Using data from the China County Statistical Yearbook, the spatial econometric models, based on economic gap and geographical gap, have been constructed to work out the influencing factors which can influence the development of agricultural products e-commerce in the county.
2. Materials and Methods
2.1. The Research Methods
2.1.1. Standard Deviational Ellipse
The standard deviation ellipse (SDE) was proposed by Lefever in 1926, is mainly used to show the spatial distribution characteristics of geographical elements, and has been widely used in geography, ecology, economy, and other fields. The SDE quantitatively describes the basic characteristics of geographical elements’ spatial distribution which include the dispersal direction, discrete degree, the distribution of subject area, and other information, through its center, major and minor axes, azimuth, and other parameters [47,48,49]. In this paper, the SDE was used to analyze the spatial distribution of the top 100 counties in China. The SDE is only drawn based on the geographical coordinates of each county, the unweighted method is adopted here to calculate the parameters of SDE. The concrete calculating method is as follows:
Mean central coordinate:
Azimuth:
X-axis standard deviation:
In the formula is the geographical coordinates of the research subject; and are the deviations from the geographical coordinates of the research subject to the average central coordinates, and are the standard deviations of the X-axes and Y-axes.
2.1.2. Moran’s Index
In this study, Moran’s index was used as a preliminary test of the spatial relationship of agricultural products e-commerce in counties. It is the most popular measure mode of spatial autocorrelation. The value of Moran’s index is between −1 and 1. If Moran’s I > 0 it means that there is positive correlation, and the high value is adjacent to the high value, the higher the value is, the stronger the spatial correlation will be; if Moran’s I < 0 it means that there is negative correlation, and the high value is adjacent to the low value, the smaller the value, the stronger the spatial difference will be; if Moran’s I = 0 it means that there is no spatial autocorrelation [50,51,52]. In this paper, the global Moran’s index was used to test the spatial correlation of the development degree of agricultural products e-commerce among counties. The formula of the global Moran’s index is as follows:
In the formula Wij is the element of spatial weight matrix, considering that the development of agricultural products e-commerce in different areas may be affected by both geographical and economic aspects. In this study, the nested weight matrix of spatial economy and geography is constructed by using the geographical distance and the per capita GDP [53]. The formula of the spatial weight matrix is as follows:
In the formula GDPi and GDPj are the per capita GDP of county i and county j in 2018; dij is the distance between the centers of county i and county j [54,55,56].
2.1.3. Spatial Econometric Model
In this study, the spatial effect of the development of agricultural products e-commerce in the county is analyzed by constructing the weighted least squares (WLS), spatial lag model (SLM) and spatial Durbin model (SDM). The SLM model mainly examines the influence of the spatial lag term, while the SDM model examines the influence of the spatial lag term and the dependent of the dependent variable on the explanatory variables in other regions. The general structure of the two models is as follows:
WLS Model:
SLM Model:
SDM Model:
In the formula, is spatial auto regressive coefficient, ɛ is random error, W is spatial weight matrix, X is explanatory variables, is coefficient vector [57,58].
2.2. Variable Selection and Data Description
2.2.1. Variable Selection
In this study, the ratio of e-commerce sales volume of agricultural products and the added value of primary industry is used to measure the development degree of agricultural products e-commerce in each county. Considering that agricultural products sold by e-commerce are generally from the crops of the previous year, so the ratio of the retail sales of agricultural products e-commerce in 2019 and the added value of the primary industry in 2018 was used as the dependent variable. Because of the limitations of county data acquisition, the explanatory variables are mainly selected from four aspects that include economic development level, industrial structure, economic vitality, and agricultural conditions [59]. The influencing factors and their descriptions are shown in Table 1.

Table 1.
Variable selection and measurement indicators description.
- Economic Development Level
Generally, economic level is positively correlated with transportation development level, science, and education level, human resources level, and other factors restricting the development of agricultural products e-commerce [60,61,62]. The economic level dimension mainly selects four indicators: per capita GDP, per capita savings, public service level, and financial development level. The per capita GDP is calculated by dividing the GDP by the household registered population; the per capita savings are calculated by dividing the balance of savings deposits of residents by the household registered; the level of public service is measured by the proportion of public budget expenditure in regional gross domestic product, which is calculated by dividing public budget expenditure by regional gross domestic product. The level of financial development is measured by the proportion of the loan balance of financial institutions at the end of the year in the GDP, which is calculated by dividing the loan balance of financial institutions at the end of the year by the GDP.
- Economic Development Level Industrial Structure
The industrial structure refers to the internal structure of the economic system, which reflects the economic development stage and growth level, which can be used to reflect the development differences between regions [63,64]. The dimensions of the industrial structure include four indicators: the development level of the primary industry, the development level of the secondary industry, the proportion of employees in the secondary industry, and the proportion of employees in the tertiary industry. The development level of the primary industry is calculated by dividing the primary industry’s added value by the regional GDP; the development level of the secondary industry is calculated by dividing the added value of the secondary industry by the regional GDP; the proportion of employees in the secondary industry is calculated by dividing the number of employees in the secondary industry by the registered population; the proportion of employees in the tertiary industry is calculated by dividing the number of employees in the tertiary industry by the registered population.
- Economic Vitality
The industrial development level will have an impact on the finishing of agricultural products, thus indirectly affecting the development of agricultural products e-commerce. The development of e-commerce is inseparable from the network, so the development level of telecommunications will also have an impact on the development of agricultural products e-commerce. In this study, the development level of industrial and telecommunications are classified as the dimension of economic vitality. The industrial development level is measured by the number of industrial enterprises above a designated size; the telecommunications development level is calculated by dividing the number of fixed telephones by the registered households.
- Agricultural Conditions
Agricultural products are different from industrial products. It has a strong dependence on natural conditions, so the level of agricultural development will also have some influences on the development of agricultural products e-commerce [65]. The agricultural conditions dimension mainly selects four indicators: the number of characteristic agricultural products, the agricultural mechanization level, the facility agriculture development level and the cultivated land coverage. The number of characteristic agricultural products originated from China’s Agricultural Products business information public service platform; the agricultural mechanization level is measured by the ratio of the total power of agricultural machinery to the crop sown area; the facility agriculture development level is measured by the ratio of facility agricultural area to the crop sown area; the cultivated land coverage is measured by the ratio of crop sown area to administrative area.
2.2.2. Data Description
The data of agricultural products e-commerce sales volume in counties used in this study are from the Report on the Development of Nationwide Digital Agriculture and Rural E-commerce in Counties in 2020, which was jointly issued by the Ministry of Agriculture and Rural Information Center and the Institute of International Electronic Commerce Center of China on 30 April 2020. The data are mainly from Table 2, Table 3, Table 4 and Table 5, the top 100 counties of agricultural products in online retail in 2019. The date of characteristic agricultural products are counted from China’s Agricultural Products business information public service platform. The data involved in other indicators came from the China County Statistical Yearbook 2018 (County and City Volume) and the county’s e-government platform.
Table 2.
The results of multicollinearity test between measurement indicators data.
Table 3.
The factors contribution rate and eigenvalue after factor analysis.
Table 4.
The load of each factor after rotation.
Table 5.
Variables of factor interpretation.
The average variance inflation factor of the original data is 3.15 more than 1, indicating that there is multicollinearity. The calculated results are shown in Table 2. So, this study planned to use factor analysis to extract common factors.
The KMO value and Bartlett’s ball test were worked out with Stata software. The KMO value of the data is 0.798, which is more than 0.5. The Bartlett’s ball test strongly rejected the original hypothesis, indicating that the data accord with condition of factor analysis. In this study, five main factors were extracted from 14 independent variables by maximum likelihood factor method. The contribution rate and characteristic values of the factors are shown in Table 4. As can be seen from Table 3, there were five factors with an eigenvalue more than 1, and the cumulative contribution rate of variance is 87%. It means that the five factors can represent most of the information of the original data. The component matrix after rotation is shown in Table 4.
According to Table 4, it can be seen that f1 mainly explains the five variables of per capita GDP, per capita savings, secondary industry scale, tertiary industry scale, and telecommunication development level, which is defined as economic development level factors; f2 mainly explains the two variables of the level of agricultural mechanization and the facility agriculture development level, which are defined as agricultural development level factors; f3 mainly explains the two variables of the primary industry development level and the secondary industry development level, which is defined as industrial structure factors; f4 mainly explains the industrial development level, which is defined as the industrial development level factor; f5 mainly explains the public service level, which is defined as the public service-level factor. See Table 5 for details. The two indicators of the number of characteristic agricultural products and cultivated land coverage are not reflected in the above five factors. This study tried to delete the two indicators or regression with them as independent factors but did not get a better regression model. Therefore, the subsequent regression calculations are based on the above five factors as the basic data. Table 6 is the matrix of the factor score coefficient, and then the values of each factor were calculated according to Table 6 and the original data.
Table 6.
The component score coefficient matrix.
3. Results
3.1. The Results of Standard Deviation Ellipse
Based on the geographic coordinates of the top 100 counties of agricultural products e-commerce sales volume which were published in 2018 and 2019 in the Report on the Development of Nationwide Digital Agriculture and Rural E-commerce in Counties, the standard deviation ellipse of the top 100 counties’ distribution in the past two years were drawn by ArcGis. They are shown in Figure 1; and the specific parameters of the standard deviation ellipses are shown in Table 7. Because the ellipse was drawn based on geographical coordinates, the values of the perimeter, area, and XY axis length of the ellipse listed in Table 7 only play a role of trend comparison, and there is no practical significance.
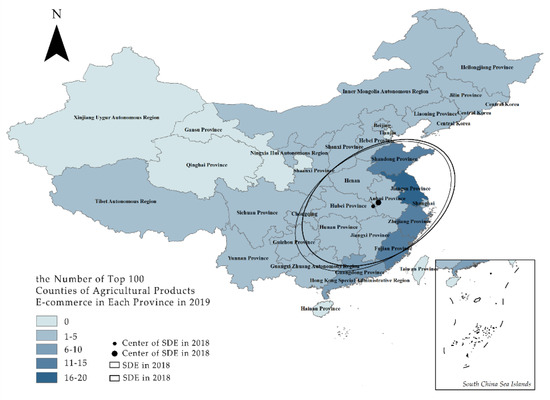
Figure 1.
The distribution and standard deviation ellipse of the top 100 counties in the sales volume of agricultural products e-commerce.
Table 7.
The standard deviation ellipse parameters of county distribution in 2018 and 2019.
In Figure 1, the color of the Chinese map was filled according to the number of the top 100 counties of agricultural products e-commerce in each province in 2019. According to this picture, we can see clearly that most of the top 100 counties are concentrated in the southeast coastal areas, and then spread to the northwest. Xinjiang, Qinghai, and Gansu are connected in the northwest of China, and there are no top 100 agricultural products e-commerce counties. The picture shows that agricultural products e-commerce in the east is developed more than the west.
The standard deviation ellipse in Figure 1 was drawn based on the geographic coordinate of the top 100 counties of agricultural products e-commerce in the past two years. The elliptical area contains 68% of the top 100 counties. It can be seen from Figure 1 that in the past two years, the top 100 counties for agricultural products e-commerce in China have shown a spatial distribution pattern of “northeast–southwest”. The main distribution is in southeast of China, mostly concentrated in coastal provinces. The distribution directions in 2018 and 2019 are basically the same, both extending along the direction of Guangxi–Jiangsu.
According to the data in Table 7, the azimuth of the 2019 ellipse is 1.663° larger than that of 2018. It indicates that compared with 2018, the ellipse in 2019 rotated clockwise by 1.663°, which means that the overall distribution direction also rotated clockwise by 1.663°. The geographical coordinate of the distribution center of the top 100 counties in 2018 is (115.591, 30.914), which is in Luotian County, Huanggang City, Hubei Province. The geographical coordinate of the distribution center of the top 100 counties in 2019 is (116.201, 31.323), which is in Huoshan County, Lu’an City, Anhui Province.
Comparing the standard deviation ellipse parameters of two years, the standard deviation ellipse area of the top 100 counties in 2019 is slightly smaller than that in 2018, indicating that the distribution of the top 100 counties is more intensive. The center and distribution region of the ellipse moved to the northeast in 2019. This shows that the development of agricultural products e-commerce in the northeast of China is stronger than the northwest in 2019. In the past two years, the width of the distribution ellipse, that is, the length of the short axis, is almost the same; but the length, that is, the length of the long axis is slightly shortened. It shows that the direction of the distribution of the top 100 counties for agricultural products e-commerce development in the county is slightly weakened.
3.2. The Results of Moran’s Index
Using a nested weight matrix that includes both economic distance and geographic distance, the global Moran’s index of the development degree of agricultural products e-commerce in each county in 2019 is calculated.
The result shows that: Moran’s p < 0.05, |Z| > 1.96, Moran’s index is significantly less than 0. It shows that there is a negative correlation between the development degree of agricultural products e-commerce in each county, the spatial distribution of the top 100 counties is scattered, and there are spatial differences. The county with a high level of agricultural products e-commerce development and a county with a low level of agricultural products development are adjacent in geographical and economic distance. The counties with close geographical distance and similar per capita GDP have different levels of agricultural products e-commerce development. Moran’s index is significantly less than 0, it means that it has passed the spatial correlation test, and the spatial econometric analysis can be carried out further.
3.3. The Results of Regression Analysis
Taking the ratio of agricultural products e-commerce sales volume of each county to the value added of the primary industry as the dependent variable, the economic development level factor f1, agricultural development level factor f2, industrial structure factor f3, industrial development level factor f4, and public service-level factor f5 are the independent variables. WLS, SLM, and SDM are constructed, and the measurement model is as follows:
WLS Model:
SLM Model:
SDM Model:
In the formula, i and j represent different counties; W represents the spatial matrix weight; y is the explained variable; f represents the explanatory factors; is the spatial autocorrelation regression coefficient; δ and β are the coefficients of the explanatory factor and the explanatory factor spatial lag; ɛ is random error term.
The White statistic of the data is , strongly rejecting the null hypothesis, indicating that the data has heteroscedasticity. So, the weighted least squares method is used to eliminate the influence of heteroscedasticity. The results of the WLS estimation, the SLM estimation, and the SDM estimation are shown in Table 8.
Table 8.
The results of WLS estimation, SLM estimation and SDM estimation.
According to Table 8, three models are obtained as follows:
WLS Model:
SLM Model:
SDM Model:
According to the results in Table 8, the estimated results in WLS of industrial structure factor f3, industrial development level factor f4, public service-level factor f5, and constant term regression are all significant at the 5% level; economic development level factor f1 is significant at the 20% level. In the SLM model, the estimated results of economic development level factor f1, industrial development level factor f4, and the constant term are all significant at the 5% level, and the public service-level factor f5 is significant at the 10% level. In the SDM model, the economic development level factor f1 and the public service-level factor f5 are significant at the 5% level, the spatial lag term of the agricultural development level factor w_f2 is significant at the 10% level, and the spatial lag term of the industrial structure factor w_f3 and the spatial lag term of industrial development level factor w_f4 is significant at the 20% level. The spatial autocorrelation coefficient ρ is significant negative at the 100% level.
Comprehensively, economic development level factor f1, public service-level factor f5, and the spatial lag of industrial structure factor w_f3 have a significant positive effect on agricultural products e-commerce. However, industrial development level factor f4, the spatial lag of agricultural development level factor w_f2, and the spatial lag of industrial development level factor w_f4 have a significant negative effect on it.
Table 5 and Table 8 show per capita GDP, per capita savings, financial development level, the proportion of employees in secondary, the proportion of employees in tertiary, telecommunications development level, and public service level are positively correlated with the development of county-level agricultural products e-commerce. Industrial development level is negatively correlated with the development of county-level agricultural products e-commerce. The agricultural mechanization level, the facility agriculture development level, primary industry development level, secondary industry development level, and industrial development level are negatively correlated with the development of county-level agricultural products e-commerce from a spatial perspective. The spatial autocorrelation coefficient is significantly less than 0, indicating that there is a significant negative spatial spillover effect of the county-level agricultural products e-commerce.
4. Discussion
The standard deviation ellipse result shows that the top 100 counties of agricultural products e-commerce in China are mainly concentrated in the cities of the southeast coast, which also happens to be the most economically developed region in China. The regions with developed economy have perfect infrastructure, abundant human resources, and efficient information transmission, which can respond to market changes in a timely manner, so economically developed regions can lead the development of the industry better. The clustering scope of the top 100 counties moved to the northeast, that indicates the rapid development of agricultural e-commerce in northeast of China in 2019. Relying on the advantages of geographical resources, the northeast region is the big granary of China. With the nourishing of the black soil, the crops are developing well [66], so agricultural products are favored by more people. Because of the underdeveloped economy and the late start of e-commerce development, the development of agricultural products e-commerce has been slow in Northeast China.
In recent years, the Chinese government has paid more and more attention to agricultural products e-commerce. The Chinese e-commerce market is increasingly active, and e-commerce outsourcing services have become more and more perfect. Many county-level governments in northeast China cooperate with e-commerce operation companies in the south, which complement each other and promote the e-commerce development of county agricultural products in northeast China [65]. Because of the early start of e-commerce and the perfect supporting technology, the coastal areas have taken the lead in the development of e-commerce. However, with the continuous improvement of e-commerce technology, the development speed of agricultural products e-commerce in northeast China has been steadily improving.
These indicators, which include per capita GDP, per capita savings, financial development level, the proportion of employees in secondary, the proportion of employees in tertiary, telecommunications development level, and public service level are the symbols of regional economic prosperity. E-commerce will help to promote the green and sustainable development of agriculture [67,68]. It has played a positive role in environmental and social development [69]. More and more consumers prefer shopping online, which provides an incentive for farmers to open online sales channels [70,71]. Developed areas pay more attention to the green development of the social, economic, and ecological environment, so agricultural products e-commerce is improving better [72].
The measurement results show that the level of industrial development has a negative impact on the development of county-level agricultural products e-commerce, which is the opposite of the assumption at the beginning of the model design. It was originally assumed that the level of industrial development would affect the finishing of agricultural products, and the development of county-level agricultural products e-commerce by affecting the types of packaged agricultural products. However, the finishing of agricultural products only needs to be equipped with corresponding production equipment, and the general industrial development level can be satisfied. Therefore, the advanced industrial level cannot bring a significant positive impact on county-level agricultural products e-commerce [73].
At the same time, the productivity of industry is significantly higher than that of agriculture. So, counties with high levels of industrial development will focus on developing industry, and resources such as labor and financial would tend to shift toward industry [74]. At present, the grain–labor coupling model of agricultural production in China is in the stage of simultaneous growth of grain and labor [75]. Industrially developed counties have high levels of urbanization, low land utilization, and fewer laborers engaged in agricultural production. The development of county-level agricultural products e-commerce would be inevitable [76,77]. Conversely, counties with backward industrial development will receive more agricultural production support and hope to get rid of poverty through the development of agricultural products e-commerce. Therefore, the industrial development level factor has a negative impact on the development of county-level agricultural products e-commerce.
The agricultural mechanization level, the facility agriculture development level, and primary industry development level represent the agricultural maturity. Secondary industry development level and industrial development level represent the industrial maturity. The regression coefficients of their spatial lag are negative, which shows a negative external effect on the development of county-level agricultural products e-commerce. The Moran’s index is consistent with the spatial autoregressive coefficient, which is significantly less than 0. That is, the development of agricultural products e-commerce of neighboring counties causes reciprocal inhibition, and it shows a negative spatial spillover effect. The development of agricultural products e-commerce will plunder resources in neighboring counties that should be the reason of reciprocal inhibition. Some scholars have studied the spatial characteristics of county retail e-commerce in Zhejiang Province of China and found a similar conclusion [78].
The growth of crops is greatly affected by geographical conditions, so there is a serious homogenization of agricultural products produced in neighboring counties, which also makes competition more intense. Counties with well-known products are more likely to be favored by consumers and get more turnover. Therefore, the development of county-level agricultural products e-commerce shows a negative spatial spillover effect. The distribution of developed counties is scattered. Additionally, the developed counties become growth poles that show a polarization effect. Because the weight matrix used in spatial measurement also includes the economic distance, the Moran’s index, and the spatial autocorrelation coefficient are significantly less than zero, also showing that the development of agricultural products e-commerce is different in counties with similar per capita GDP.
5. Conclusions and Limitations
5.1. Conclusions
According to the results of this paper, the following conclusions can be drawn. First, areas with a developed agricultural foundation can improve the development speed of e-commerce by purchasing mature e-commerce services. Second, advanced e-commerce technology can rapidly improve the development of agricultural products e-commerce in the initial stage, but it is not obvious in the mature stage. Third, economic development, economic vitality, and infrastructure construction have a positive effect on the development of county-level agricultural products e-commerce. However, the industrial development level will have a negative effect on it. Agricultural development level and industrial development level inhibit the development of county-level agricultural products e-commerce in surrounding counties. Fourth, the county-level agricultural products e-commerce has a negative spatial spillover effect, and there are differences in neighboring counties with similar geographical location and per capita GDP. The distribution of the counties which are developed in agricultural products e-commerce is scattered. Additionally, the developed counties become the growth poles in surrounding counties.
To promote the development of agricultural products e-commerce, the government should strengthen the construction of e-commerce demonstration centers and make it a growth pole in the region, through the strategic cooperation with the surrounding counties which are developed in agricultural products e-commerce to weaken the inhibitory effect of neighboring counties. This can be done by improving the finish machining capacity of agricultural products, increasing the categories of commodities on sale, building agricultural products traceability system, upgrading agricultural transportation and preservation technology to segment the market and capture greater market share. Of course, it is also necessary to strengthen the construction of rural infrastructure, increase the reserve of rural e-commerce talent pool, and improve the efficiency of rural logistics. Internet companies should provide streamlined online sales software that can run at high speed on low configuration mobile phones, to make online transactions easier for people with lower education.
With the continuous development of the internet and digital financial technology, new commodity trading models have been formed, and agricultural products are also changing from traditional trading models to electronic trading models. The combination of e-commerce and commodity traceability technology ensures that consumers can easily and quickly obtain safer and more assured food. At the same time, it can also increase the added value of agricultural products and increase the total value of the entire industrial chain of agricultural products. In many developing countries, agriculture has not yet been fully modernized. The development of agricultural products e-commerce can promote the intensive and modern production of agriculture. According to the practical experience of the Chinese people, it is found that the sustainable development of agricultural products e-commerce can not only help the underdeveloped areas out of poverty, but also help to promote the process of local urbanization. It is hoped that this study can provide some references for the sustainable development of county-level agricultural products e-commerce, agricultural modernization, and rural urbanization in regions dominated by agriculture.
5.2. Limitations
This paper studies the development of agricultural products e-commerce based on the county-level, so there are some difficulties in data acquisition. Therefore, this study has the following limitations: first, the model only takes the top 100 agricultural products e-commerce counties in China as the research subject, and fails to include more counties into the research object; second, this article lacks the research on the spatial heterogeneity and evolution of spatial distribution in the development of county-level agricultural products e-commerce; third, because the statistical data at the county level in China is not perfect, this study has not considered the factors that can influence the development of agricultural products e-commerce, such as informatization and transportation.
In future research, it will be necessary to expand the sample data and incorporate into the model factors that influence the development of e-commerce, such as the level of information and supply chains. Additionally, according to the different geographical locations and conditions, it is also a significant direction to study the spatial heterogeneity of agricultural products e-commerce development at the county-level.
Author Contributions
Conceptualization, Z.C. and W.S.; methodology, Z.C. and W.S.; software, H.G. and W.S.; validation, Z.C. and W.S.; formal analysis, Z.C.; resources, Z.C.; data curation, C.P.; writing—original draft preparation, Z.C. and H.G.; writing—review and editing, W.S. and H.G.; visualization, Z.C.; supervision, C.P.; project administration, Z.C.; funding acquisition, H.G., Z.C. and C.P. All authors have read and agreed to the published version of the manuscript.
Funding
This research was funded by the Science and Technology Development Plan Project of Jilin Province, China, grant No.20200101130FG; MOE (Ministry of Education in China) Project of Humanities and Social Sciences, grant/award No.18YJC630128; Social Science Fund Project of Jilin Province, China, grant No.2018BS33; Social Science Fund Project of “the 13th Five-Year” of Education Department of Jilin Province, China, grant No.JJKH20190736SK; and Social Science Fund Project of China, grant No.19BGJ050.
Institutional Review Board Statement
Not applicable.
Informed Consent Statement
Not applicable.
Data Availability Statement
Data sharing is not applicable to this article.
Conflicts of Interest
The authors declare no conflict of interest.
References
- Huamei, D. Analysis on the Reconstruction of E-commerce ecosystem by Block chain Technology. China J. Commer. 2020, 14, 26–27. [Google Scholar] [CrossRef]
- Hongling, L.; Xin, H.; Xiaoxiao, Z. A research on the government’s behavior in the development of Taobao Village: A perspective from inclusive innovation theory and policy text analysis. Sci. Res. Manag. 2020, 41, 75–84. [Google Scholar] [CrossRef]
- Li, X. The impact of place-of-origin on price premium for agricultural products: Empirical evidence from Taobao.com. Electron. Commer. Res. 2020, 1–24. [Google Scholar] [CrossRef]
- Mortimer, G.; Hasan, S.; Andrews, L.; Martin, J. Online grocery shopping: The impact of shopping frequency on perceived risk. Int. Rev. Retail. Distrib. 2016, 26, 202–223. [Google Scholar] [CrossRef]
- Eliana, V.; Luis, R.; Alejandro, V.; Edgar, P. Electronic Commerce: Factors Involved in its Adoption from a Bibliometric Analysis. J. Theor. Appl. Electron. Commer. Res. 2018, 13, 39–70. [Google Scholar] [CrossRef]
- Hobbs, J.E. Food supply chains during the COVID-19 pandemic. Can. J. Agric. Econ. Rev. Can. Agroecon. 2020, 68. [Google Scholar] [CrossRef]
- Huang, J. Impacts of COVID-19 on agriculture and rural poverty in China. J. Integr. Agric. 2020, 19, 2849–2853. [Google Scholar] [CrossRef]
- Xue, J.; Li, G.; Li, N. Does green and sustainable engagement benefit online platforms in supply chains? The role of green and public concern. Int. J. Logist. 2021, 13, 1–16. [Google Scholar] [CrossRef]
- Utami, H.N.; Alamanos, E.; Kuznesof, S. ‘A social justice logic’: How digital commerce enables value co-creation at the bottom of the pyramid. J. Mark. Manag. 2021, 1–40. [Google Scholar] [CrossRef]
- Tiancheng, X.; Zhulin, S. The present situation, existing problems and Countermeasures of Rural Electronic Commerce. Mod. Econ. Res. 2016, 11, 40–44. [Google Scholar] [CrossRef]
- Xu, Y.; Jun, L. Cooperative Game: Interaction between Government and Social Organization in Rural Poverty Govern-ance. J. Huazhong Agric. Univ. Soc. Sci. Ed. 2018, 3, 81–89. [Google Scholar] [CrossRef]
- Goldfarb, A.; Tucker, C. Digital Economics. J. Econ. Lit. 2019, 57, 3–43. [Google Scholar] [CrossRef]
- Xiaojing, L.; Zhe, C.; Fei, L.; Xianli, X. Does Participating in E-commerce Promote the Adoption of Green Production Technologies by Kiwifruit Growers? A Counterfactual Estimation Based on Propensity Score Matching Method. Chin. Rural Econ. 2020, 3, 118–135. [Google Scholar]
- Xinyu, P.; Mengmi, L. Study on the Influence Mechanism of Modern Service Industry on the Price of Agricultural Product. Issues Agric. Econ. 2017, 38, 78–83. [Google Scholar]
- Weihong, C.; Ying, W.; Xiaowei, W. Analysis of the Impact of E-commerce Development on Agricultural Products Import and Export Trade. J. Agrotech. Econ. 2020, 4, 134–142. [Google Scholar]
- Ting, C.; Junnan, H. Analysis on the Diversified Logistics Mode of Agricultural products in Cross-border E-commerce in China. J. Commer. Econ. 2020, 10, 106–109. [Google Scholar]
- Jinli, X.; Bingchuan, H. Analysis of the influence of E-commerce of Agricultural products on leading Enterprises of Agricultural industrialization—Based on propensity score matching (PSM) estimation. Rural Econ. 2020, 129–136. [Google Scholar]
- Tao, H.; Yong, H. Review of the Development of Agricultural products E-commerce in China in 2016 and Prospect in 2017. J. Commer. Econ. 2017, 88–92. [Google Scholar] [CrossRef]
- Xintian, W.; Chunpeng, K.; Xiangdong, W. Research on the Factors of Poverty Subjects’ Acquired Sense under the Background of E-commerce Poverty Alleviation. Issues Agric. Econ. 2020, 3, 112–124. [Google Scholar]
- Song, Z.; He, S. Contract coordination of new fresh produce three-layer supply chain. Ind. Manag. Data Syst. 2019, 119, 148–169. [Google Scholar] [CrossRef]
- Zeng, Y.; Guo, H.; Yao, Y.; Huang, L. The formation of agricultural e-commerce clusters: A case from China. Growth Chang. 2019, 50, 1356–1374. [Google Scholar] [CrossRef]
- Ji, C.; Chen, Q.; Zhuo, N. Enhancing consumer trust in short food supply chains. J. Agribus. Dev. Emerg. Econ. 2019, 10, 103–116. [Google Scholar] [CrossRef]
- Guojun, C.; Guoen, W. Research on the Economic Mode of Hema Villages under the New Retail in China. Issues Agric. Econ. 2020, 7, 14–24. [Google Scholar] [CrossRef]
- Vásquez, F.; Vera-Martínez, J. From E-Quality and Brand Perceptions to Repurchase: A Model to Explain Purchase Behaviour in a Web-Store. J. Theor. Appl. Electron. Commer. Res. 2020, 15. [Google Scholar] [CrossRef]
- Lu, B.; Zhang, S. A Conjoint Approach to Understanding Online Buyers’ Decisions towards Online Marketplaces. J. Theor. Appl. Electron. Commer. Res. 2020, 15. [Google Scholar] [CrossRef]
- Guoqiang, H. Mode and Technology Support of E-commerce Marketing of Specialty Agricultural Products. J. Guangxi Univ. Natl. Philos. Soc. Sci. Ed. 2019, 41, 77–84. [Google Scholar]
- Yiwu, Z.; Hongdong, G. The Formation Mechanism of Agro-Taobao Village: A Multiple-Case Study. J. Agrotech. Econ. 2016, 37, 39–48. [Google Scholar]
- Erpeng, W.; Zhifeng, G.; Xianhui, G. Where does the Added Value of Processed AgriculturalProducts come from? J. Agrotech. Econ. 2020, 1, 80–91. [Google Scholar]
- Hongtao, T.; Kaige, G. Can E-commerce Mode of Agricultural Products Achieve Optimal Production Efficiency? J. Bus. Econ. 2020, 2, 5–16. [Google Scholar]
- Jiabao, L.; Qian, H. A study on the influencing factors of E-commerce absorption of Agricultural products in Enterprises—The regulating role of Government support. J. Agrotech. Econ. 2017, 12, 110–124. [Google Scholar]
- Haina, W.; Xu, C.; Yinsheng, Y.; Yanliang, Y. Study on the differences between the East and the West in the Development of Agricultural products E-commerce. Stat. Decis. 2020, 36, 93–96. [Google Scholar]
- Dancheng, L.; Yue, H.; Yanyan, P. Analysis of the present situation and Strategy of Agriculture-related E-commerce—A comment on “New Agriculture, Countryside and Farmers and Electronic Commerce”. Issues Agric. Econ. 2017, 38, 91–92. [Google Scholar]
- Cheng, J.; Chunping, X. Performance evaluation of county agricultural products e-commerce and its influencing factors from the perspective of information technology. J. China Agric. Univ. 2020, 25, 183–195. [Google Scholar] [CrossRef]
- Gang, L.; Haicheng, Q. Research on the Evaluation Index system of Information Poverty degree in Rural Poverty-stricken areas under the background of Poverty Alleviation. J. Agrotech. Econ. 2017, 5, 120–128. [Google Scholar] [CrossRef]
- Hongpeng, G.; Yanliang, Y.; Yang, Z. Pattern and Influencing Factors of Agricultural Operators Spatial Distribution on Agri-E-Commerce Platform: Based on Data from Alibaba E-Commerce Platform. J. Nanjing Agric. Univ. Soc. Sci. Ed. 2016, 16, 42–48. [Google Scholar]
- Xiaoyang, L.; Zhiwei, D.; Xiaodong, H.; Min, W.; Fazeng, W. Spatial Distribution Characteristics and Influence Factors of E-CommerceDevelopment Level in China: Based on EDI of 1915 Counties. Econ. Geogr. 2018, 38, 11-21+38. [Google Scholar] [CrossRef]
- Yunying, G.; Xiaoming, Z. Research on Spatial Clustering and Development Path of Rural E-commerce in Fujian Province. J. Fujian Prov. Comm. Party Sch. CPC Fujian Acad. Gov. 2019, 144–152. [Google Scholar] [CrossRef]
- Deshun, X.; Mingfeng, D. Research on the Construction and Measurement Method ofRegional e-business Development Index. J. Soc. Sci. 2018, 11, 31–40. [Google Scholar] [CrossRef]
- Xinyu, Y.; Lijie, D.; Yue, Y. Measurement of Development Index of Rural Electronic Commerce in China. J. Commer. Econ. 2019, 125–127. [Google Scholar] [CrossRef]
- Pengfei, L.; Jia, L.; Jianhong, W. Analysis on influencing factors of rural e-commerce poverty alleviation in Shannxi based on social network analysis. J. South. Agric. 2019, 50, 662–668. [Google Scholar] [CrossRef]
- Wang, T.; Huang, L. An Empirical Study on the Relationship between Agricultural Science and Technology Input and Agricultural Economic Growth Based on E-Commerce Model. Sustainability 2018, 10, 4465. [Google Scholar] [CrossRef]
- Yanliang, Y.; Hongpeng, G.; Yang, Z.; Jingfu, L. Spillover effect of central cities on regional e-commerce development. Stat. Decis. 2018, 34, 106–108. [Google Scholar] [CrossRef]
- Dan, S.; Yinsheng, Y. Effect of Agricultural Products E—Commerce Industry Agglomeration on Total Factor Productivity in Jilin Province: Based on Alibaba Platform Data. J. Appl. Stat. Manag. 2020, 39, 385–396. [Google Scholar] [CrossRef]
- Donghyun, K.; Ammeter, A.P. Shifts in Online Consumer Behavior: A Preliminary Investigation of the Net Generation. J. Theor. Appl. Electron. Commer. Res. 2018, 13, 1–25. [Google Scholar] [CrossRef]
- Jianwei, Z.; Chengyuan, P.; Zhen, F. Research on Spatial Differences and Influencing Factors of Rural E-commerce—Based on the analysis of rural e-commerce development indicators in Jiangsu Province. Price Theory Pract. 2019, 7, 144–148. [Google Scholar] [CrossRef]
- Yanliang, Y.; Jingfu, L. A comparative study on the development of agricultural products e-commerce between the north and the South. China Econ. Trade Her. 2018, 26, 29–33. [Google Scholar] [CrossRef]
- Lefever, D.W. Measuring Geographic Concentration by Means of the Standard Deviational Ellipse. Am. J. Sociol. 1926, 32, 88–94. [Google Scholar] [CrossRef]
- Ling, W.; Yang, Z.; Qiang, L.; Jianing, S. Study on Spatial Variation of China’s Territorial Ecological Space Based on Standard Deviation Ellipse. Ecol. Econ. 2020, 36, 176–181. [Google Scholar]
- Lu, Z.; Zuoquan, Z. Projecting the Spatial Variation of Economic Basedon the Specific Ellipses in China. Sci. Geogr. Sin. 2014, 34, 979–986. [Google Scholar] [CrossRef]
- Moran, A. Notes on Continuous Stochastic Phenomena. Biometrika 1950, 37, 17–23. [Google Scholar] [CrossRef]
- Yuming, W. Calculation of input-output elasticity of Regional Agricultural production factors in China—An empirical study based on Spatial econometric Model. Chin. Rural Econ. 2010, 6, 25–37. [Google Scholar] [CrossRef]
- Yuqing, Z.; Yingheng, Z.; Zhongyi, Y. Rural financial development, agricultural economic growth and farmers’ Income: An Empirical Analysis Based on spatial econometric model. J. Agrotech. Econ. 2013, 11, 50–56. [Google Scholar]
- Shoukun, W. Several Types of Weights Matrix and Their Extended Logic. J. Quant. Econ. 2013, 30, 57–63. [Google Scholar] [CrossRef]
- Yuan, F.; Yunqi, L.; Ruijie, L. Review on the evolution of spatial econometric models. Stat. Decis. 2016, 35–39. [Google Scholar] [CrossRef]
- Jun, H.; Feng, G.; Shuo, L. Persistence, Expectation and Inflation Spatial Dynamics in China: A Spatial Dynamic Panel Model Study. China Econ. Q. 2014, 13, 57–80. [Google Scholar] [CrossRef]
- Huajun, L.; Quan, Z.; Qian, Y. Urbanization, Spatial spillover and Regional Economic growth—Based on the partial differential method of Spatial regression Model and the empirical study of China. J. Agrotech. Econ. 2014, 10, 95–105. [Google Scholar]
- Yaohua, Z.; Zhenhua, W.; Guangsheng, Z. Analysis on the Influencing Factors and the Spatial Spillover Effect ofCounty-- level Economic Growth in China. Sci. Geogr. Sin. 2017, 33, 35–47. [Google Scholar] [CrossRef]
- Jiuwen, S.; Peng, Y. Research Paradigm and latest Development of Spatial Econometrics. Economist 2014, 27–35. [Google Scholar] [CrossRef]
- Yuehuan, T.; Qijing, Y.; Qiuyun, L.; Bohong, Z. The Development of E-commerce and the Increase of Farmers’ Income: An Examination Based on the Policies of E-commerce into RuralAreas. Chin. Rural Econ. 2020, 6, 75–94. [Google Scholar]
- Weixin, H.; Xinshu, G. Evaluation of the Development level of Open economy in China’s Border areas and an empirical Analysis of its influencing factors. Inq. Into Econ. Issues 2014, 39–45. [Google Scholar] [CrossRef]
- Bowen, C.; Yuqi, L.; Wenqian, K.; Changyan, W. Analysis on the measuring of the relationship between transportation accessibility and level of regional economic growth in Jiangsu: Based on spatial econometric perspective. Geogr. Res. 2015, 34, 2283–2294. [Google Scholar] [CrossRef]
- Jue, C.; Lei, L.; Jianlan, R.; Fengbo, L. The Measuring and Spatial Structure Between Comprehensive Transportation Accessibility and the Level of Economic Development at County Level: Case of of 91 counties in Shandong Province. Sci. Geogr. Sin. 2013, 33, 1058–1065. [Google Scholar] [CrossRef]
- Wei, L.; Hui, Z. Structural Change and Technical Advance in China’s Economic Growth. Econ. Res. J. 2008, 43, 4–15. [Google Scholar]
- Yifu, L.; Fang, C.; Zhou, L. An Analysis of the Regional Gap in the period of China’s Economic transition. Econ. Res. J. 1998, 6, 3–5. [Google Scholar]
- Liang, C. The Development Trend of Agricultural Products E-business from the Perspective of Ali Platform. China Bus. Mark. 2015, 29, 58–64. [Google Scholar]
- Xiaozeng, H.; Wenxiu, Z. Effects and Suggestions of Black Soil Protection and Soil Fertility Increase in Northeast China. Bull. Chin. Acad. Sci. 2018, 33, 206–212. [Google Scholar]
- Chen, L.-F. Green certification, e-commerce, and low-carbon economy for international tourist hotels. Environ. Sci. Pollut. Res. 2018, 26, 17965–17973. [Google Scholar] [CrossRef] [PubMed]
- Lu, L.; Thomas, R. An Economic Model of the Evolution of Food Retail and Supply Chains from Traditional Shops to Supermarkets to e-Commerce. Am. J. Agric. Econ. 2018, 100. [Google Scholar] [CrossRef]
- Oreku, G.S.; Mtenzi, F.J.; Ali, A.-D. A Viewpoint of Tanzania E-Commerce and Implementation Barriers. Comput. Sci. Inf. Syst. 2013, 10, 263–281. [Google Scholar] [CrossRef]
- Giampietri, E.; Trestini, S. Analysing farmers’ intention to adopt web marketing under a technology-organisation-environment perspective: A case study in Italy. Agric. Econ. 2020, 66, 226–233. [Google Scholar] [CrossRef]
- Yin, X.; Gao, H. Discussion on the Development Model of Electronic Commerce Economy in Township Areas. Front. Soc. Sci. Technol. 2019, 1, 110–115. [Google Scholar] [CrossRef]
- Conca, L.; Manta, F.; Morrone, D.; Toma, P. The impact of direct environmental, social, and governance reporting: Empirical evidence in European-listed companies in the agri-food sector. Bus. Strategy Environ. 2020, 30, 1080–1093. [Google Scholar] [CrossRef]
- Rajiv, B.; Sabyasachi, M.; Sambamurthy, V. The Effects of Digital Trading Platforms on Commodity Prices in Agricultural Supply Chains. MIS Q. 2011, 35, 599–611. [Google Scholar]
- Rahayu, S.; Fitriani, L.; Kurniawati, R.; Bustomi, Y. E-commerce based on the Marketplace in efforts to sell agricultural products using Xtreme programming approach. J. Phys. Conf. Ser. 2019, 1402, 066108. [Google Scholar] [CrossRef]
- Yangang, F.; Jianzhi, L. Coupled modes of grain yield and agricultural labor changes andrural development types at county level in Northeast China. Acta Geogr. Sin. 2020, 75, 2241–2255. [Google Scholar] [CrossRef]
- Deng, Z.; Zhao, Q.; Bao, H.X.H. The Impact of Urbanization on Farmland Productivity: Implications for China’s Requisition--Compensation Balance of Farmland Policy. Land 2020, 9, 311. [Google Scholar] [CrossRef]
- Jin, H.; Li, L.; Qian, X.; Zeng, Y. Can rural e-commerce service centers improve farmers’ subject well-being? A new practice of ‘internet plus rural public services’ from China. Int. Food Agribus. Manag. Assoc. 2020, 23, 1–16. [Google Scholar] [CrossRef]
- Shen, W.; Qin, Y.C.; Xie, Z.X. Research on the Spatial Features of the E-RetailingEconomic Linkages at County Level: A Case Study for Zhejiang Province, China. ISPRS Int. J. Geo Inf. 2019, 8, 324. [Google Scholar] [CrossRef]
Publisher’s Note: MDPI stays neutral with regard to jurisdictional claims in published maps and institutional affiliations. |
© 2021 by the authors. Licensee MDPI, Basel, Switzerland. This article is an open access article distributed under the terms and conditions of the Creative Commons Attribution (CC BY) license (https://creativecommons.org/licenses/by/4.0/).