Article

A Fixed Bed Pervious Concrete Anaerobic Bioreactor for Biological Sulphate Remediation of Acid Mine Drainage Using Simple Organic Matter

by
Sandisiwe Khanyisa Thisani
1,*,
Daramy Vandi Von Kallon
1 and
Patrick Byrne
2
1
Department of Mechanical and Industrial Engineering Technology, University of Johannesburg, Johannebsurg 2006, South Africa
2
School of Biological and Environmental Sciences, Liverpool John Moores University, Liverpool L2 2QP, UK
*
Author to whom correspondence should be addressed.
Sustainability 2021, 13(12), 6529; https://doi.org/10.3390/su13126529
Submission received: 16 May 2021 / Revised: 26 May 2021 / Accepted: 29 May 2021 / Published: 8 June 2021
(This article belongs to the Special Issue Chemical Pollution, Prevention, and Environmental Sustainability)

Abstract

:
The development of low-operational-cost and low-operational-complexity active sulphate (SO4) reducing bioremediation for Acid Mine Drainage (AMD) is an ongoing pursuit towards sustainable mining. This study introduces a fixed bed pervious concrete anaerobic bioreactor as a second stage AMD remediation process. The study investigated the pH self-regulation capabilities, SO4 remediation capabilities and the rate limiting parameters of the bioreactor using glucose as an organic matter source. The AMD was pre-treated using a permeable reactive barrier. A 21-day trial comprised of an increase in the SO4 loading rate while reducing the organic loading rate was undertaken to identify performance limiting conditions. A daily average SO4 concentration reduction rate of 55.2% was achieved over the initial 13 days of the experiments. The study found that a COD to SO4 ratio and VFA to alkalinity ratio below 5:1 and 0.5:1 respectively were performance limiting. The bioreactor was capable of self-regulating pH within the neutral range of 6.5 and 7.5. The study findings indicate that the bioreactor design can reduce operational costs and operational complexity of active AMD bioremediation.

1. Introduction

The mining of sulphide rich mineral ores is associated with the formation of a polluted water stream referred to as Acid Mine Drainage (AMD). The AMD stream is formed when oxygenated water comes into contact with exposed mine rock faces containing sulphide minerals in the presence of oxygen [1,2]. The sulphide minerals undergo oxidation to produce sulphuric acid, resulting in a low pH leachate which dissolves metals and other toxic elements in the surrounding flow path [3]. The resulting AMD can cause long term impairment to biodiversity, contaminate receiving water streams and aquifers, damage natural habitats and cause other environmental degradation [1,4]. The generation of AMD is the most significant environmental problem associated with the mining industry [5] and can continue to form on mining sites centuries after commercial mining operations have ceased [2,6,7].
The development of a remediation technology suitable for long term AMD treatment with low operation costs and a high degree of dissolved Sulphate (SO4) reduction remains the subject of numerous scholarly works [8,9,10,11]. Active bioreactors are one such attractive solution which can achieve effective AMD remediation for safe environmental discharge with moderate to high operational costs [12,13]. Active bioreactor technologies make use of the naturally occurring sulphur cycle where sulphate reducing prokaryotes convert SO4 to Hydrogen Sulphide (H2S) gas under anaerobic conditions [14,15]. The biologically produced H2S gas can react with dissolved metals, leading to precipitation as metal sulphides [16]. High concentrations of dissolved heavy metals and low pH are toxic to the consortium of microorganisms involved in Anaerobic Digestion (AD) and therefore pre-treatment steps to neutralise pH and reduce high concentrations of heavy metals are essential predecessors to AD treatment [17,18,19].
Sulphate reduction through AD comprises of four sequential and interdependent groups of microorganisms, namely (1) acidogenic bacteria, (2) acetogenic bacteria, (3) methanogenic bacteria and (4) sulphidogenic prokaryotes also known as Sulphate Reducing Prokaryotes (SRP) [20]. Acidogenic bacteria convert the monomer products from the hydrolysis of organic matter into Volatile Fatty Acids (VFAs), alcohols, Carbon Dioxide (CO2) and Hydrogen (H2) [20]. Acetogenic bacteria convert VFAs and alcohols into acetic acid, CO2 and H2. Methanogens convert acetates, H2 and CO2 into methane [20,21] while SRP compete with the methanogens for the products from acidogenesis and acetogenesis to convert sulphates into sulphides [14,19,22]. In the AD process, acidogenic and acetogenic bacteria (together classed as acidogens) are acidifying while methanogens and SRP are alkalising [23]. Acidogens have the highest growth rates due to their higher substrate uptake rate in comparison to methanogens and SRP [23]. The acidogens’ growth rate coupled with the acidity from AMD result in high levels of acidity in the bioreactor, which necessitates alkaline dosing to maintain the pH equilibrium required for optimal AD performance and microbial survival [24].
This paper introduces a fixed bed pervious concrete anaerobic bioreactor for second stage AMD remediation as a lower operational cost and lower operational complexity bioreactor design. The bioreactor follows a pre-treatment step comprising of initial pH correction and metal precipitation. This bioreactor configuration combines the passive alkaline generation and resulting precipitation associated with pervious concrete Permeable Reactive Barriers (PRBs), with the biological remediation of AD technologies. The porous channel network of pervious concrete enables the suspension of flocc particles containing microorganisms, provides high surface area for the growth of prokaryotes and can enable high retention of microbial colonies in the bioreactor. Pervious concrete is naturally alkaline with surface pH typically between 12 and 13 [25]. Pervious concrete as a fixed bed reactive medium can result in operational cost savings and reduced operational complexity as a result of the concrete’s neutralising capabilities to buffer the acidity produced by the acidogens as well as the acidity from the AMD.
From existing literature, the most optimal conditions for the metabolic function of SRP in the biological sulphate reduction of AMD are mostly anaerobic environments with a pH range of 6–7 [14,22] at mesophilic temperatures of 35 °C to 37 °C [14,17]. Studies have found that overly toxic concentrations of heavy metals, sulphides and other antimicrobial substances may inhibit the growth and metabolic function of SRP [17,19]. Insufficient availability of the nutrients Nitrogen (N), Phosphorus (P) and Potassium (K) [26], and the inability of the sulphidogenic prokaryotes to compete with methanogens for the available organic substrates [14,20] may further inhibit the growth of SRP. A major constraint to the bioreactor design for SO4 reduction is the relatively poor adhesion capability of SRP [17], leading to the research into various bioreactor configurations [14,15,18].
The primary objectives of this study were: (1) to investigate the pH self-regulation capabilities of the bioreactor; (2) to evaluate the SO4 remediation capabilities of the bioreactor during initial start-up; and (3) to investigate the rate-limiting parameters of the bioreactor during initial process start-up. The operating parameters evaluated in this study were the SO4 to Chemical Oxygen Demand (COD) ratio, the VFA to alkalinity ratio and the performance limiting availability of organic matter on VFA production. Glucose was used as the organic matter source in this study. The AD process was preceded by passive PRB treatment using pervious concrete for initial pH correction and precipitation of heavy metals, to reduce toxicity for the microorganisms.

2. Experimental Methodology

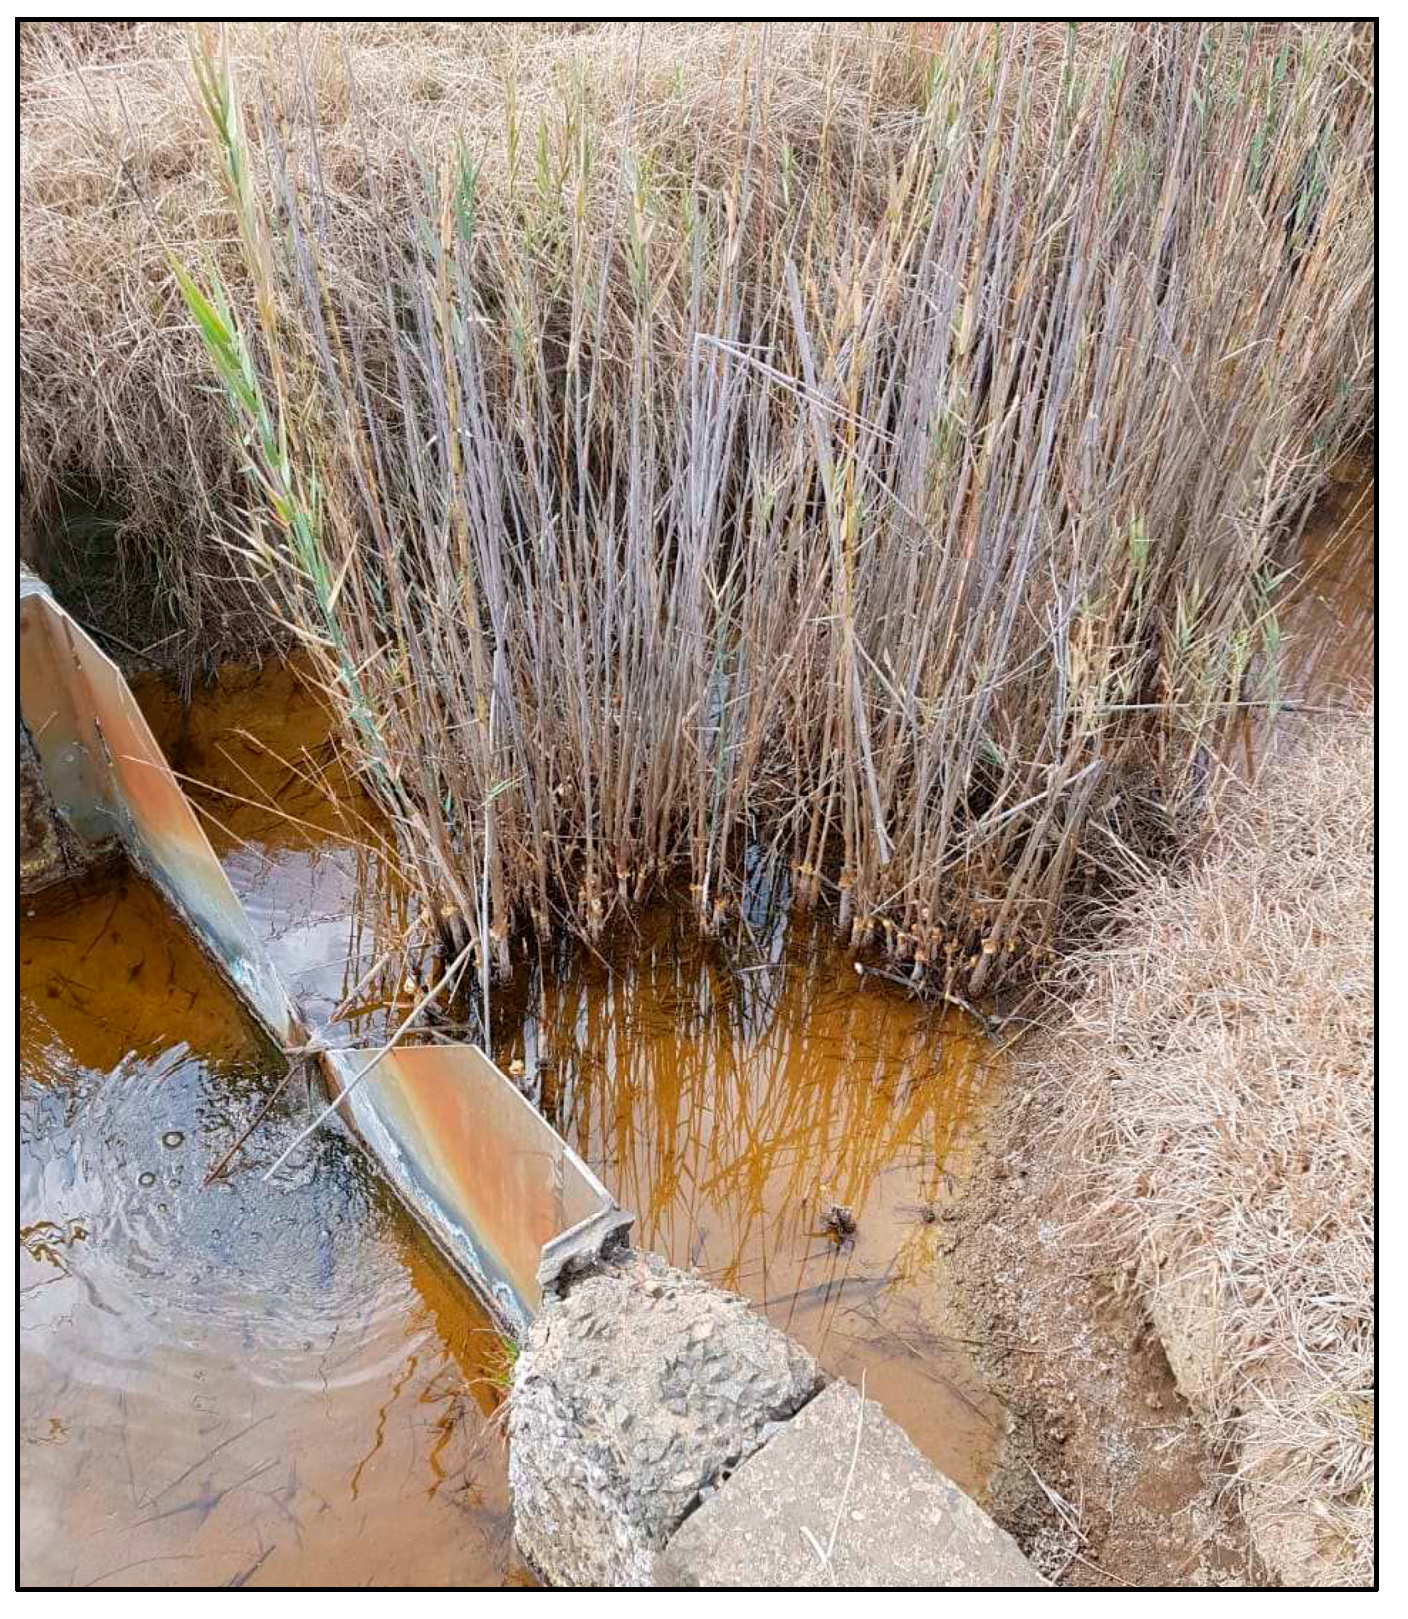
2.1. AMD Collection and Storage

The AMD was collected from a coal mine that was abandoned over 40 years ago in the north-eastern coal fields of the KwaZulu-Natal province of South Africa. The AMD was collected from the decant point where it exists at a mine tailing to the surrounding environment in 25 litre plastic containers, and kept refrigerated at 4 °C for 10 days before experimental works commenced. The AMD was collected following the rainy winter period, during which the dissolved metals and sulphate concentration were highest. The raw AMD determinands are given in Table 1. Figure 1 shows the mine tailing overflow weir where the AMD was collected.

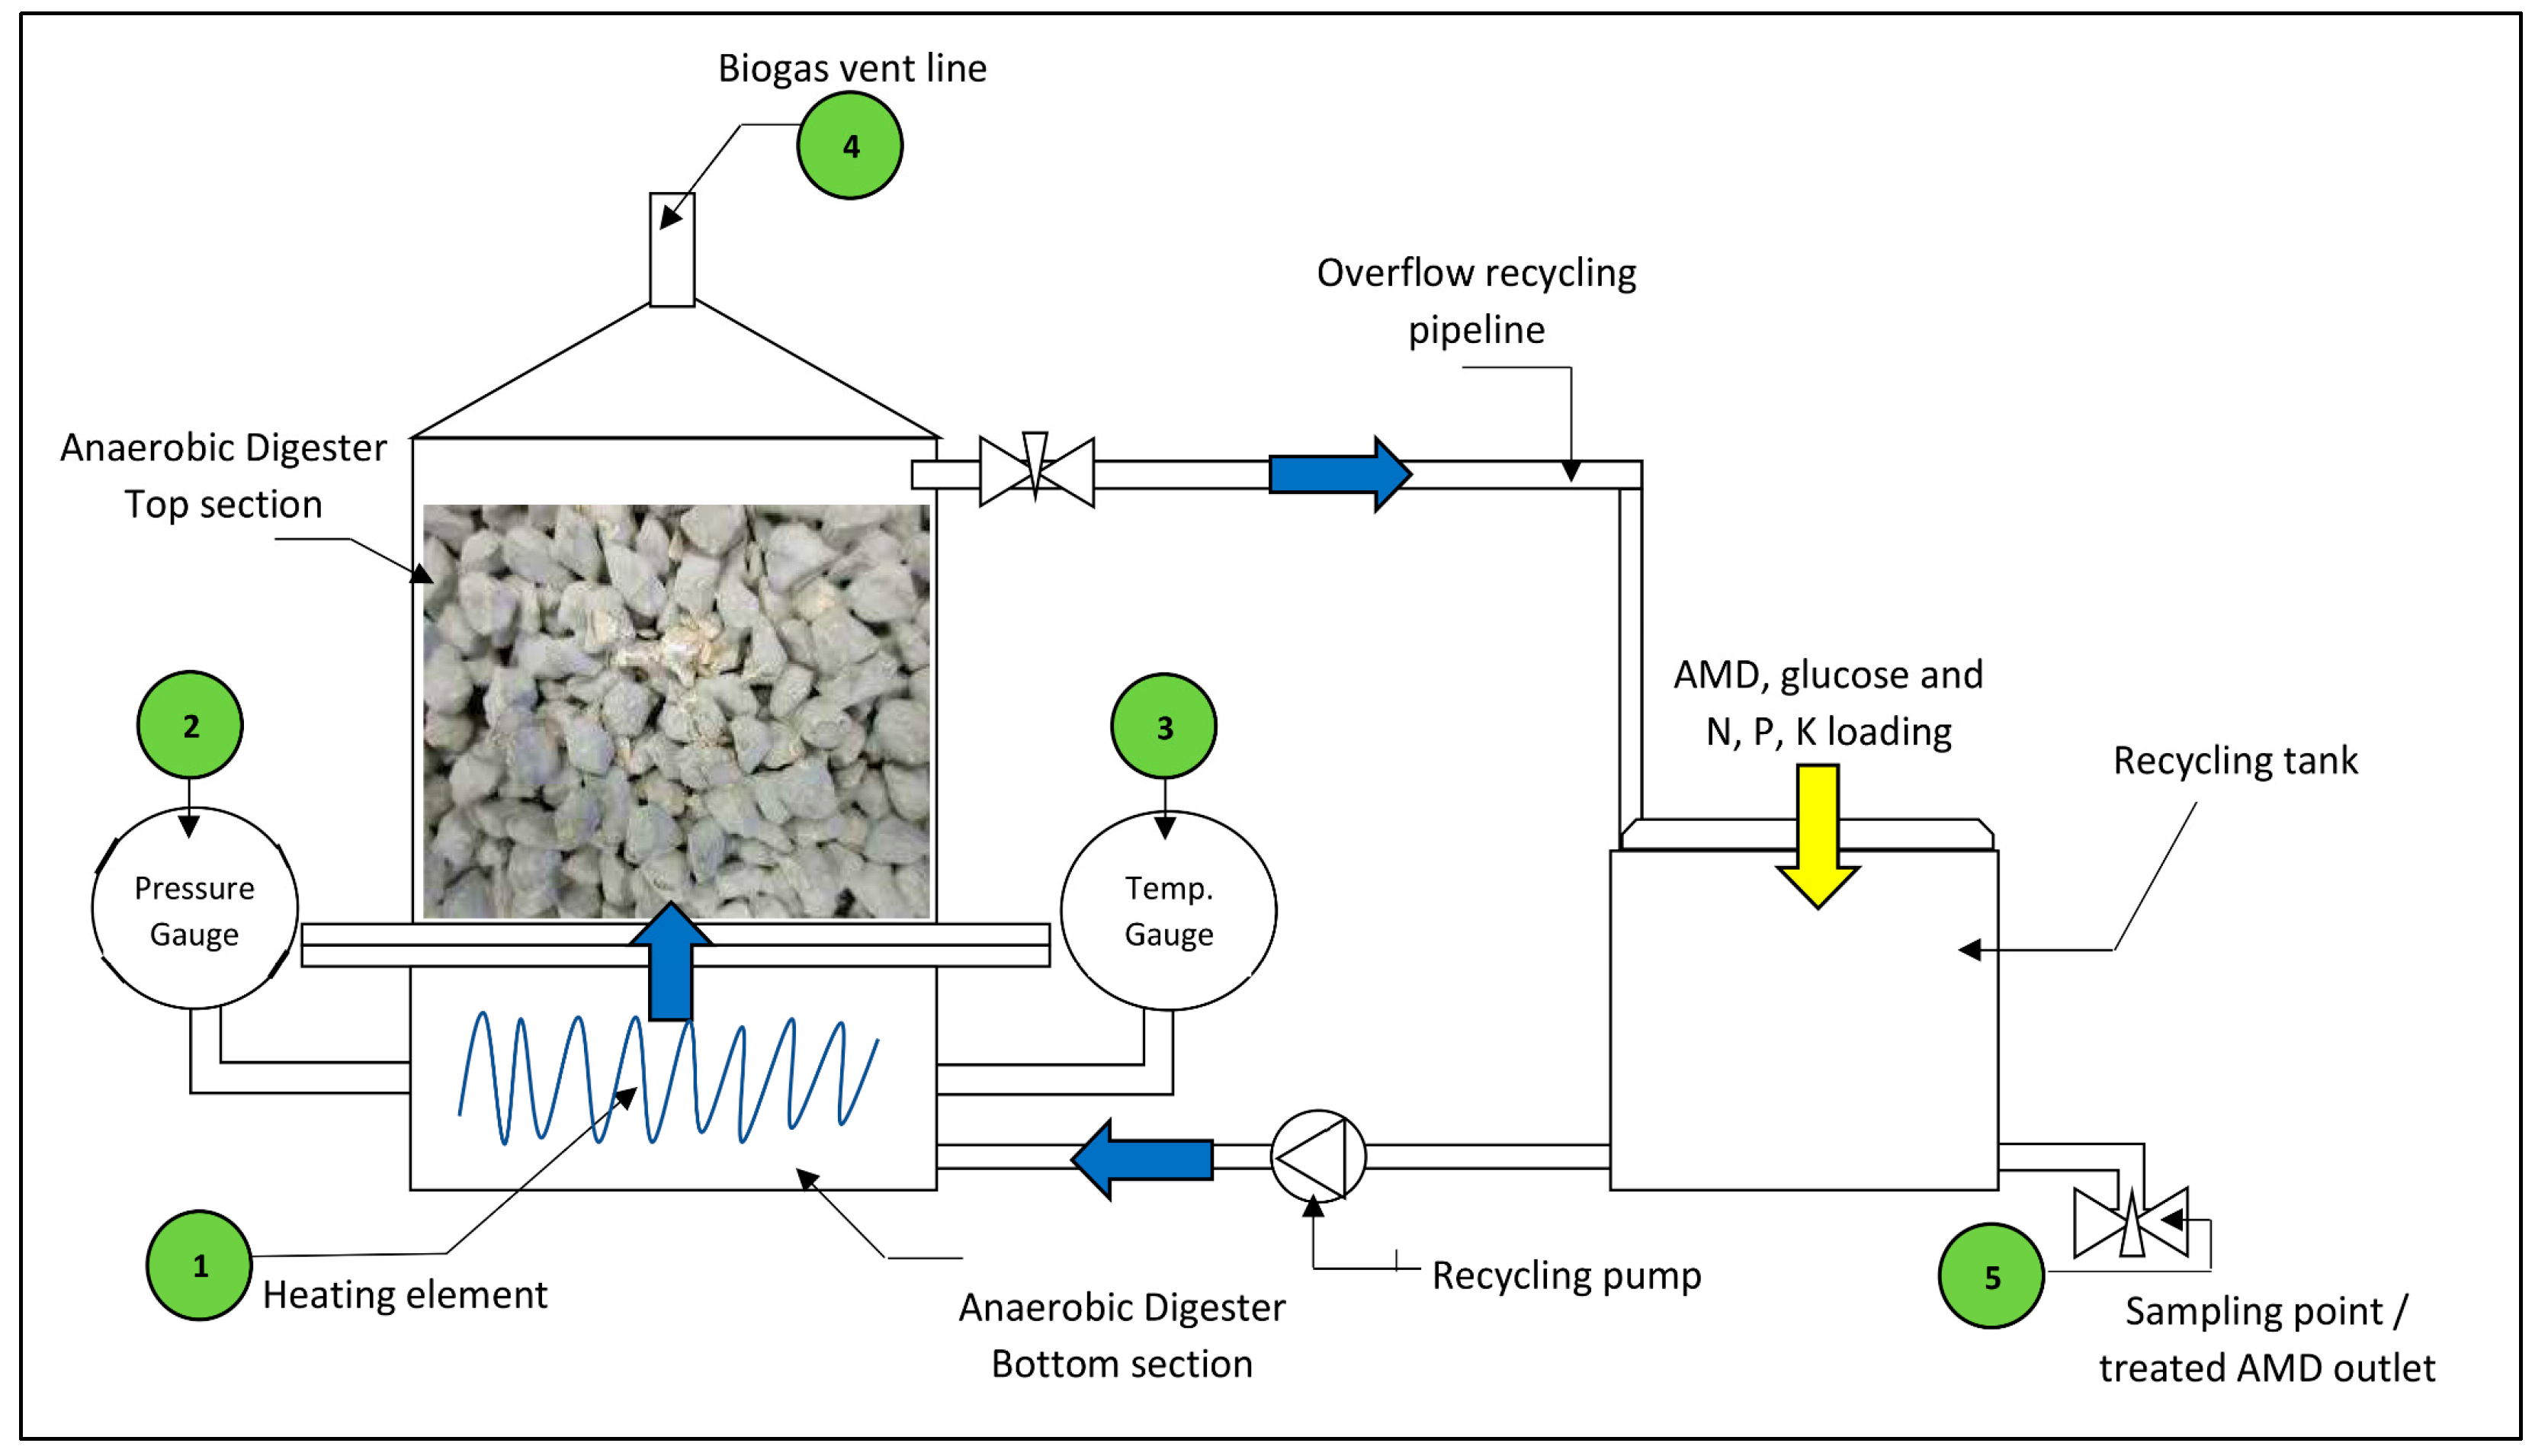
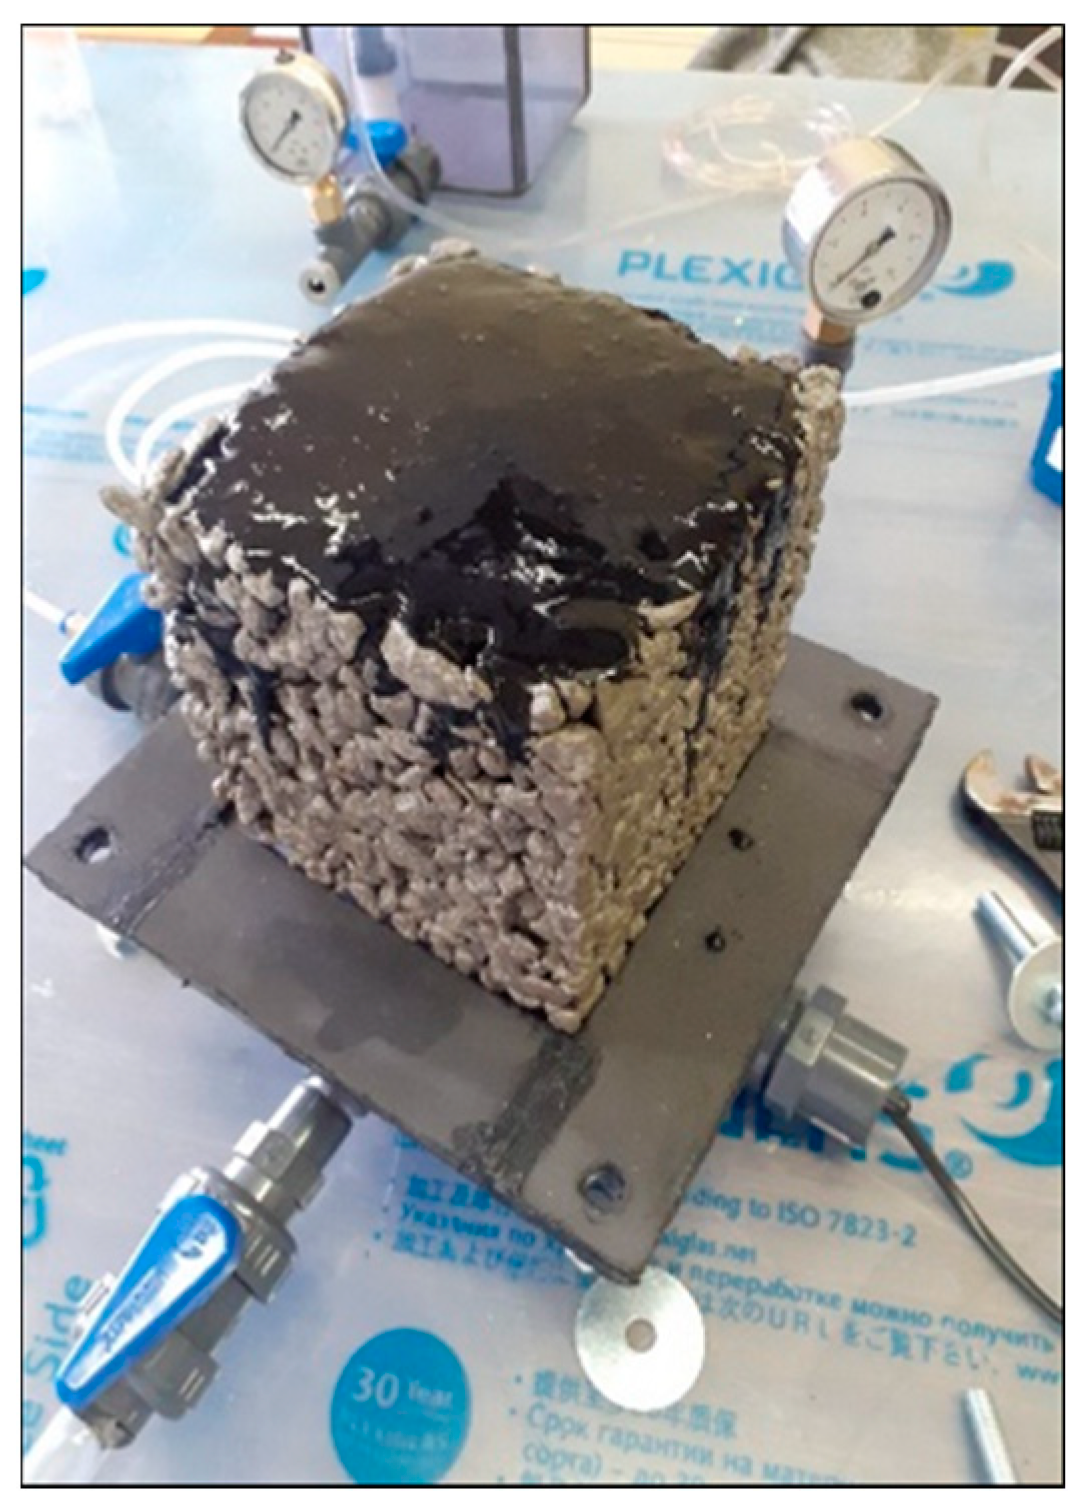
2.2. Process Design and Description

Pre-treatment was conducted by discharging raw AMD at the top of a 450 mm tall pervious concrete cube stack. The AMD was discharged using a peristaltic pump dosing at a flow rate of 200 mL/min. The 450 mm stack was comprised of three 150 × 150 × 150 mm3 concrete cubes placed one on top of another. The concrete stack was contained in a rectangular mould constructed from Perspex sheeting. The AMD was allowed to trickle through the pervious concrete under gravity and the effluent was stored in 2 litre containers. The 2 litre containers were used to settle the precipitated solids with the average time required for complete sedimentation measured. The supernatant was then decanted for further treatment in the AD process. Figure 2 shows a schematic layout of the pre-treatment process. Figure 3 shows the settling of the pre-treated AMD in the two litre containers.
The fixed bed pervious concrete AD process comprises of a bioreactor shell constructed from Perspex sheeting, a 150 × 150 × 150 mm3 pervious concrete cube housed within the bioreactor shell, a recycling tank constructed from Perspex sheeting and a recycling dosing pump for the continuous circulation of the AMD through the bioreactor. The bioreactor shell was split into two bolt connected flanged sections, a bottom section and a top section, for ease of assembly and disassembly. The bioreactor was fitted with the following accessories for process monitoring and control:
  • a 50 W fish tank heating element to maintain the liquid temperature between 36 °C and 38 °C,
  • a mechanical pressure gauge for monitoring the static pressure inside the bioreactor,
  • a mechanical temperature gauge, range 0–60 °C, for monitoring the AD fluid temperature,
  • a vent outlet at the top centre of the AD to release biogas,
  • a sampling valve on the recycling tank for daily AMD sample collection.
These accessories are labelled on Figure 4. The mechanical gauges were calibrated by the manufacturer before experimentation. To accelerate start-up of the biological process, glucose powder was selected as the carbon source for the AD process. Glucose can be easily solubilised leading to accelerated hydrolysis, and its simple carbon structure allows for easy biodegrading [27,28]. The bioreactor was loaded with seed sludge containing SRP prior to the commencement of experimental works. AMD was introduced to the process in batch mode by adding measured quantities into the recycling tank. The AMD was premixed with weighed quantities of glucose powder and nutrients N, P, K before entering the system. Figure 4 shows the schematic layout of the bioreactor design tested in this study.

2.3. Equipment and Materials

2.3.1. Pervious Concrete Materials and Construction

Pozzolanic CEM IV and granite stone were selected as the cement and aggregate type for the pervious concrete used in the pre-treatment concrete column and the fixed bed bioreactor due to the chemical resisting properties [29,30], and the proven AMD treatment capabilities from existing literature [30,31,32]. The CEM IV mix design was comprised of Portland CEM I with 4% Silica Fume CSF-90TM and 8% Siliceous Fly Ash. Granite stone size of 13.2 mm was selected for the bioreactor cube to increase the porosity for the seed sludge to fill some of the void volume. For the pre-treatment column, granite stone size 9.5 mm was selected for the cubes to minimise the porosity and thus increase the contact surface area between the AMD fluid and the concrete. Using the liquid displacement method, the porosity of the bioreactor cube and the pre-treatment column cubes were determined to be 33.2% and 21.5% respectively. Table 2 gives the mix designs for the pervious concrete cubes.

2.3.2. Seed Sludge Collection, Storage and Loading

Seed sludge containing a consortium of microorganisms, including SRP, was collected from the bottom of a still anoxic zone of a large aeration pond in the effluent treatment works of a pulp and paper company. The sludge samples were collected using a metal scoop and stored in two-litre plastic containers, which were kept sealed until the commencement of the experiment. The seed sludge was collected seven days prior to experimental works and was kept refrigerated at 4 °C. A day before commencement of experimental works, the seed sludge was removed from the refrigerator and kept at room temperature (approximately 21 °C). Once the sludge had reached room temperature, 10 g of glucose was added to each of the two-litre containers of sludge, followed by agitation, and the caps then closed to allow the sludge to ferment under anaerobic conditions for the remainder of the day. The sludge was then screened to remove solid particles greater than 2 mm, leaving behind a viscous slurry. One litre of the filtered seed sludge (accounting for approximately 25% of the bioreactor’s working volume) was loaded into the bioreactor by pouring it uniformly over the pervious concrete cube and allowing it to seep into the porous network for a period of 15 min before the unit was fed with AMD. Figure 5 shows the loading of the seed sludge into the bioreactor.

2.4. Operational Protocol

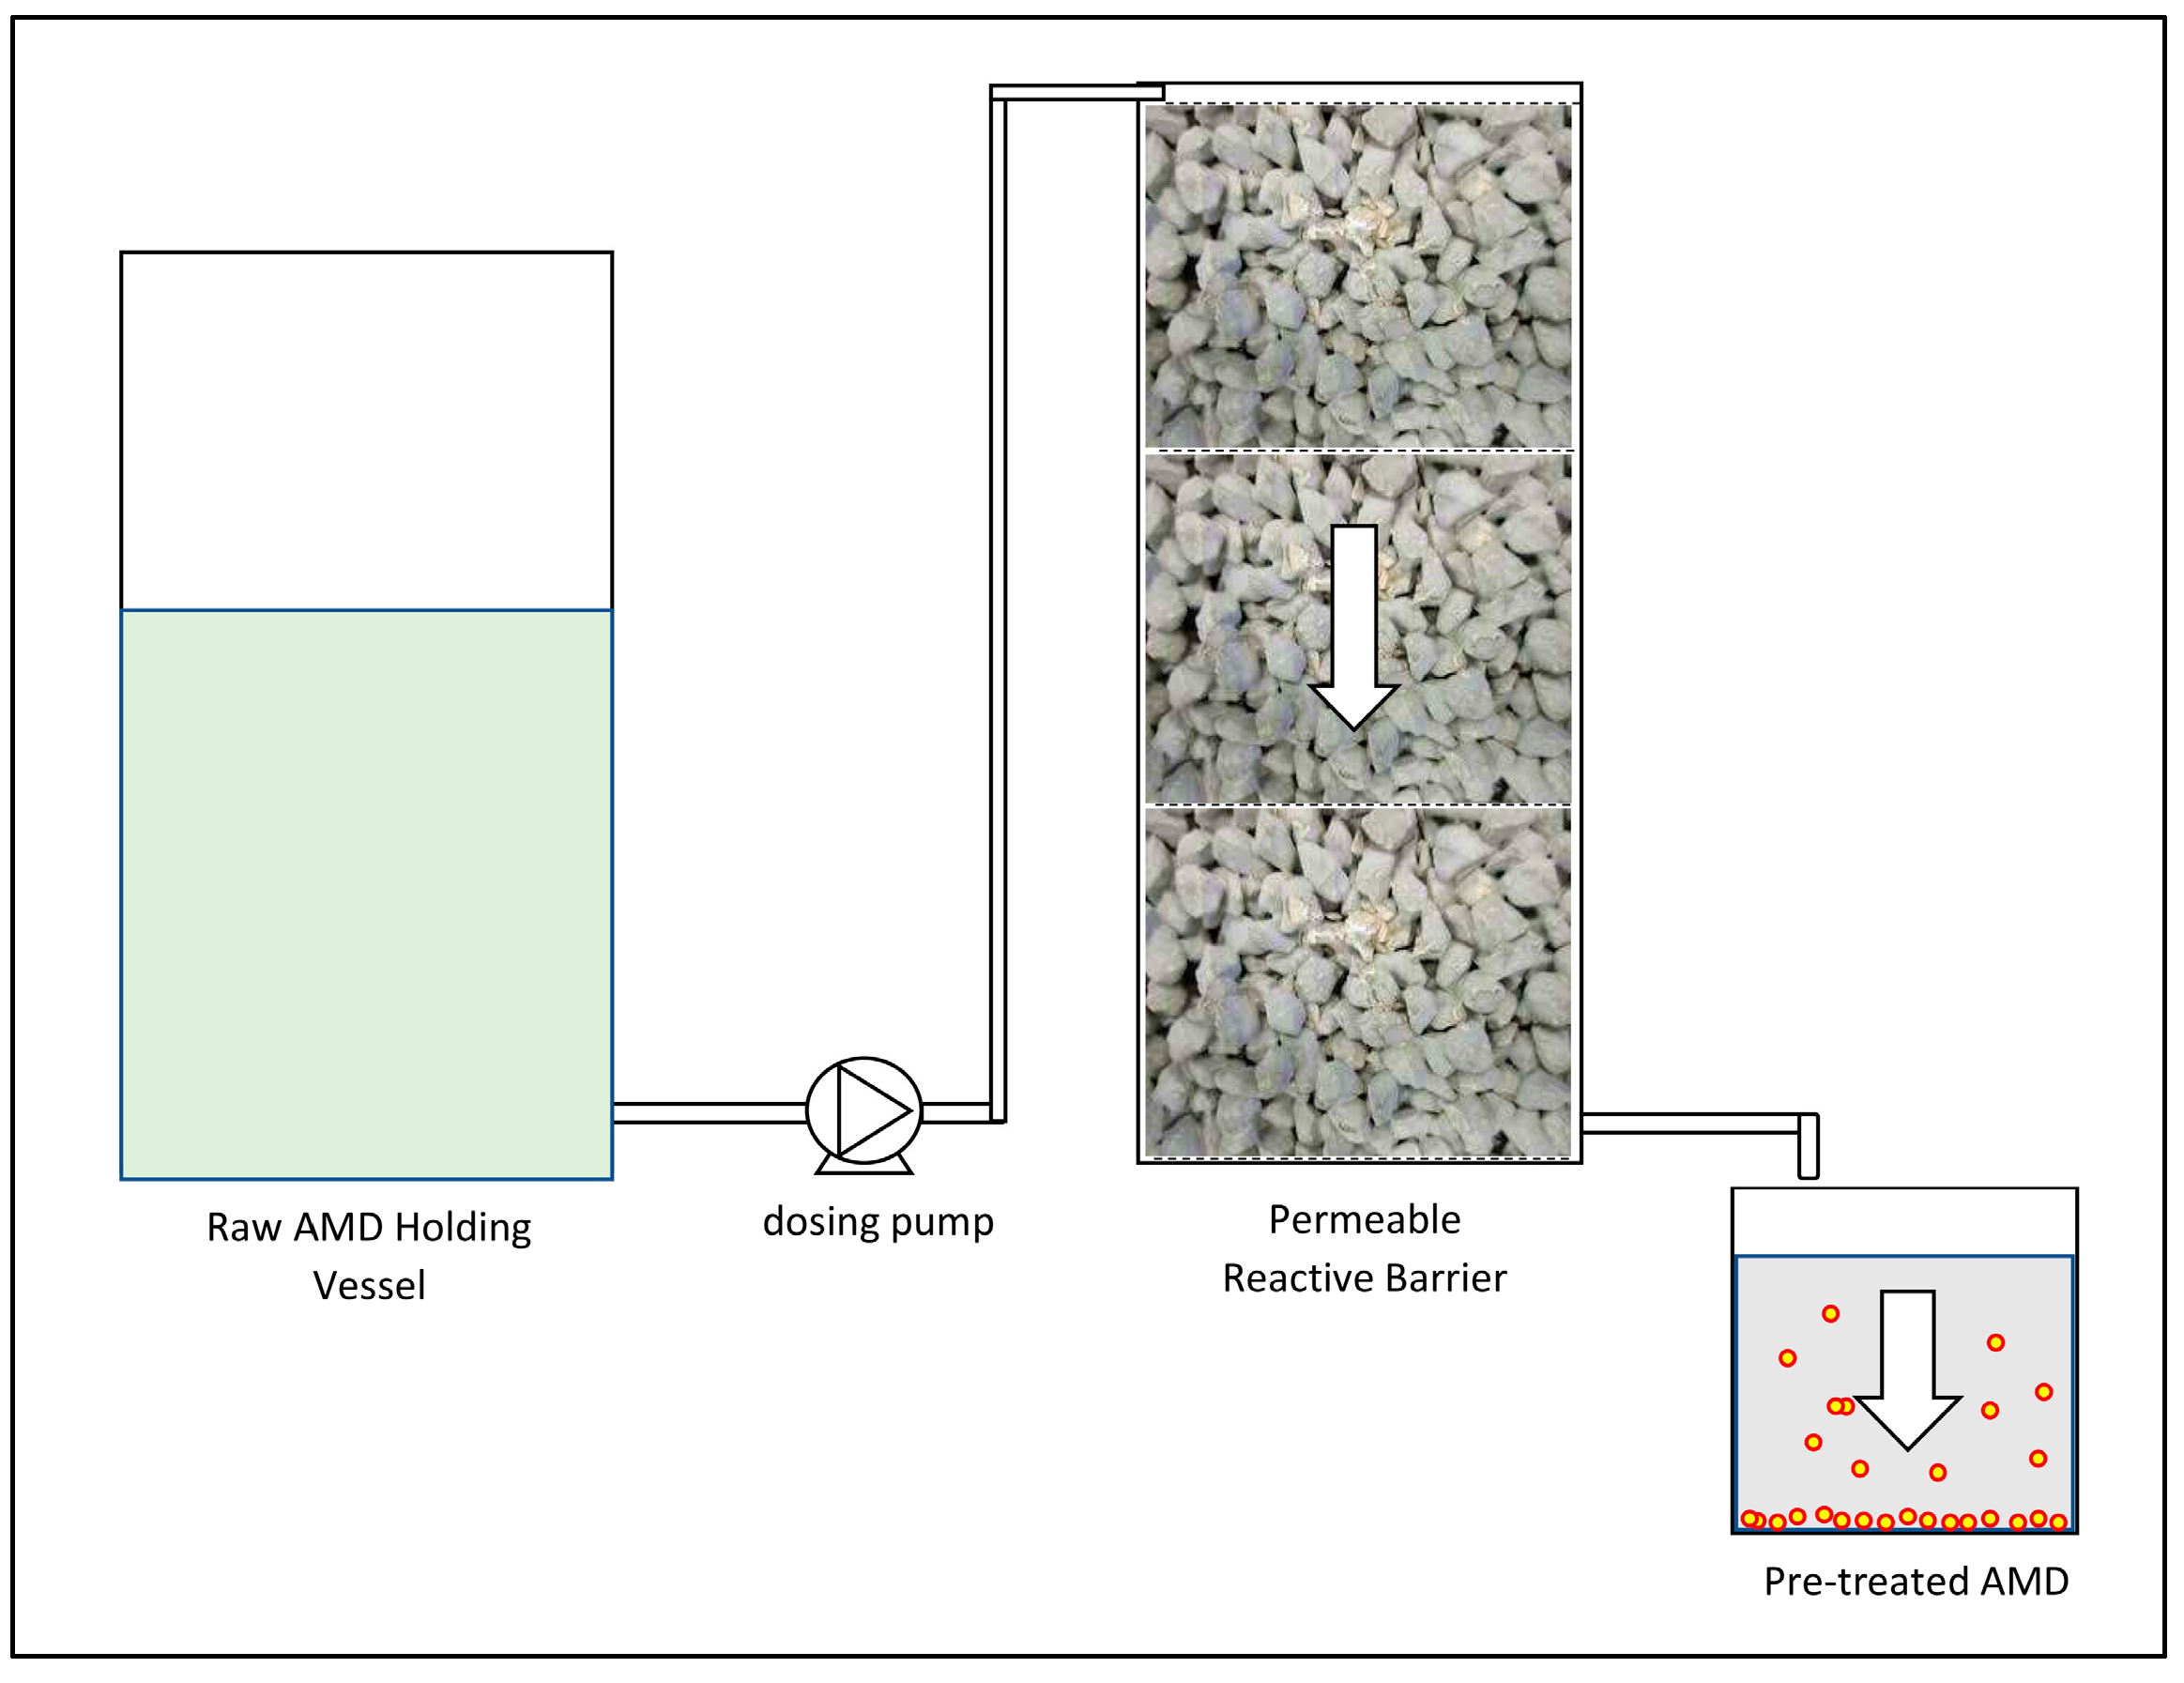
2.4.1. Pre-Treatment Operational Protocol

AMD was pre-treated using pervious concrete as a permeable reactive barrier following the methodology described in Section 2.2. The pre-treated AMD was homogenised in a 25-litre container. A sample of the homogenised pre-treated AMD was chemically analysed for key determinands.

2.4.2. Bioreactor Operational Protocol

The operational protocol for the bioreactor undertaken in this study was adopted from Neda et al. (2007). The experiment was conducted during the bioreactor’s initial ramp-up with the ramp-up conducted in batch mode. The bioreactor’s operational protocol comprised of a gradual increase in the SO4 loading rate while gradually reducing the organic matter to SO4 ratio and maintaining a constant supply of nutrients N, P and K throughout the experiment. The bioreactor’s operational protocol was designed to identify the limiting operational conditions for performance.
The bioreactor was operated over a period of 21 consecutive days. The operation comprised of the SO4 volumetric loading rate gradually increased from 0.015 kgSO4/m3/day on operational day 1, to a loading rate of 1.104 kgSO4/m3/day on operational day 19. Inversely, the glucose to SO4 loading ratio was gradually decreased from 82.6:1 (kg glucose/m3/day to kgSO4/m3/day) on operational day 1, to 1.77:1 on operational day 19. A total of nine SO4 loading ramp-up cycles were conducted during the experiment with a Hydraulic Retention Time (HRT) of 48 h between all but one ramp-up cycle, ramp-up cycle 7. The working volume of the bioreactor was 4.09 litres and was maintained throughout the experiment. The recycling tank’s low limit volume was maintained at 720 mL during the first nine days of experimentation, and was gradually increased to the high limit volume of 1.68 litres on experimental day 19 due to the additional volume of AMD necessary for SO4 loading ramp-up. The flow rate of the recycling pump was maintained at 15.4 mL/min throughout the experiment. The liquid up-flow velocity in the bioreactor was 1.2 mm/min, which equated to an HRT of ±266 min in the bioreactor per recycle cycle. The recycling tank’s lower limit HRT was 46 min and the upper limit HRT was 109 min. Equations (1) and (2) show the formulae used to determine the SO4 loading rate and the glucose loading rate respectively. Table 3 shows the SO4 and glucose loading rates for the duration of the AD process experiment.
SO 4   Loading   Rate   ( kgSO 4 / m 3 / day ) = SO 4 ( mg / L ) ×   Volume   added   per   day   ( m 3 / day ) 1000   ( g / kg ) × Reactor   volume   ( m 3 )
Glucose   Loading   Rate   ( kg / m 3 / day ) = Mass   added   per   day   ( kg / day ) Bioreactor   working   volume   ( m 3 )
An initial recycling tank sample was collected on day 1 following AD start-up and further samples were collected daily at 24-h intervals for chemical analyses. The daily sampling and testing regime was undertaken to identify changes in process performance and microbial responses to the COD and AMD loading. The sample volumes were between 350 mL and 400 mL, and the extracted volumes were replaced with an equal volume of equivalent AMD SO4 load, diluted with water when necessary, on non ramp-up days. On ramp-up cycle days the biologically treated AMD samples were extracted, followed by the addition of the ramp-up SO4 load. Where the AMD volume required to ramp up the SO4 volumetric loading was below the extracted 400 mL sample volume, the AMD was diluted with water to make up the ramp volume to the required loading rate. The liquid volumes in the recycling tank and the bioreactor were measured before ramp-up. Following the ramp-up of AMD and organic matter, the new concentrations of COD and SO4 in the process were determined through mass balance calculations. The mass balance was conducted using the known quantities of SO4 and glucose added to the process, summed up with their volumetric concentrations in the process determined from chemical analysis of the extracted samples. The COD mass balance was determined using the theoretical COD of glucose (C6H12O6) which is 1.067 mg/L of COD per 1 mg/L of glucose [33]. Equations (3) and (4) show the mass balance calculations used to determine the concentrations of SO4 and COD respectively post ramp-up.
SO 4 post = [ ( AMD   ramp   vol × AMD   SO 4 ) 1   000   000 + ( water   vol   × water   SO 4 ) 1   000   000 + AD   vol × AD   SO 4 1   000   000 ] × 1   000   000 AMD   ramp   vol + water   vol + AD   vol
where SO4 post is the SO4 concentration in the bioreactor post ramp-up (mg/L), AMD ramp vol is the ramp-up volume of AMD added to the recycling tank (litres), AMD SO4 is the concentration of SO4 in the pre-treated AMD (mg/L), water vol is the volume of ramp-up dilution water (litres), water SO4 is the concentration of SO4 in the dilution water (mg/L), AD vol is the liquid volume in the bioreactor and recycling tank before ramp-up (litres) and AD SO4 is the SO4 concentration in the bioreactor before ramp-up (mg/L).
Total   COD = ( glucose   mass AD   vol × 1.067 ) + AD   COD
where Total COD is the COD concentration in the bioreactor post glucose ramp-up (mg/L), AD vol is the liquid volume in the bioreactor and recycling tank before organic loading (litres), Glucose mass is the mass of glucose powder added to the recycling tank (mg), 1.607 is the conversion factor for glucose (mg/L) to COD (mg/L) and AD COD is the concentration of COD in the bioreactor before organic loading (mg/L).
A 5 mL solution consisting of the nutrients N, P, K was mixed with the ramp-up AMD before being added into the recycling tank on all of the ramp-up cycle days. The concentrations of N, P and K in the solution were 81,000 mg/L, 27,000 mg/L, and 81,000 mg/L respectively. To test the pH self-regulating capabilities of the fixed bed pervious concrete bioreactor, no attempt was made to externally regulate pH during process operation in this study.

2.5. Chemical Analysis

Chemical analyses were conducted to assess the treatment performance of the process. The analyses were conducted by South African commercial laboratories accredited by the South African National Accreditation System (SANAS). Samples were collected and refrigerated at 4 °C for a maximum period of 24 h prior to chemical analysis.

2.5.1. Dissolved Metals

Concentrations of the dissolved metals were determined using the Varian 700-ES Inductive Coupled Plasma Atomic Emission Spectroscopy (ICP-OES) instrument. The samples were prepared by filtering through a 0.45 µm cellulose nitrate filter paper and acidified with trace metal grade nitric acid.

2.5.2. Sulphate

The SO4 concentration was determined using a Thermo Scientific Aquakem 200 selective photometric analyser. The samples were diluted followed by precipitation of the Sulphate ion, using a strong acid medium with Barium Chloride. The resulting turbidity was measured photometrically at 405 nm against calibration standard solutions.

2.5.3. pH

The pH was measured immediately after sample collection using a Hanna Instruments HI9813-6 portable meter. The meter was manually calibrated using pH 7.01 and pH 4.01 buffer solutions before taking each pH reading.

2.5.4. Total Suspended Solids

The TSS was determined by agitating the sample and filtering through 2 µm filter paper with the residue retained dried at 105 ± 2 °C. The weight of the dried solids was measured to determine the TSS.

2.5.5. Chemical Oxygen Demand

COD was determined using a HACH DR3900 Spectrophotometer following the Reactor Digestion Method. The organic material in the samples was oxidised using a boiling mixture of sulphuric acid with a known excess of potassium dichromate (K2Cr2O7). Following the digestion, the amount of oxygen consumed was measured against standards at 420 nm for low wavelength ranges and 620 nm for high wavelength ranges using the spectrophotometer.

2.5.6. Alkalinity

Alkalinity was determined using a Thermo Scientific Orion 5-Star Plus portable multi-meter following the potentiometric titration method. Samples were titrated to pH 4.00 using a standard 0.1 M H2SO4 solution. Titrant was added in increments and the pH recorded for the corresponding titrant volume. The potentiometric titration end-point was detected using a titration curve. On completion of the titration process, the potential difference was measured using the multi-meter electrode. Alkalinity was calculated from the volume of titrate used.

2.5.7. Volatile Fatty Acids

VFA was determined using a Thermo Scientific Orion 5-Star Plus portable multi-meters following the potentiometric titration method. Samples were titrated to pH 7 using standard 0.10 Normality NaOH solution. Titrant was added in increments and the pH recorded for the corresponding titrant volume. The potentiometric titration end-point was detected using a titration curve. On completion of the titration process, the potential difference was measured using the multi-meter electrode. The volatile acids concentration was calculated from the volume of titrate used.

2.6. Microscopic Evaluation

Phase contrast and bright-field microscopy were used to evaluate sludge collected from the bioreactor at the end of the experimental works. The sludge was assessed for filamentous bacteria and protozoa. The filamentous bacteria were categories using Grain stain and Neisser strain tools to aid in identification. The phase contrast and bright-field microscopy was conducted using an Olympus B43 microscope with 4×, 10× and 40× objectives for phase contrast and 100× objective for bright-field.

2.7. Statistical Methods

The correlation relationship between the availability of organic matter and the production of VFAs as well as the availability of VFAs and the percentage reduction of SO4 was tested. Testing was done using the Pearson’s correlation method. The statistical analysis was conducted with the IBM SPSS 25 software and the Pearson’s correlation was conducted using two-tailed significance testing.

3. Results and Discussions

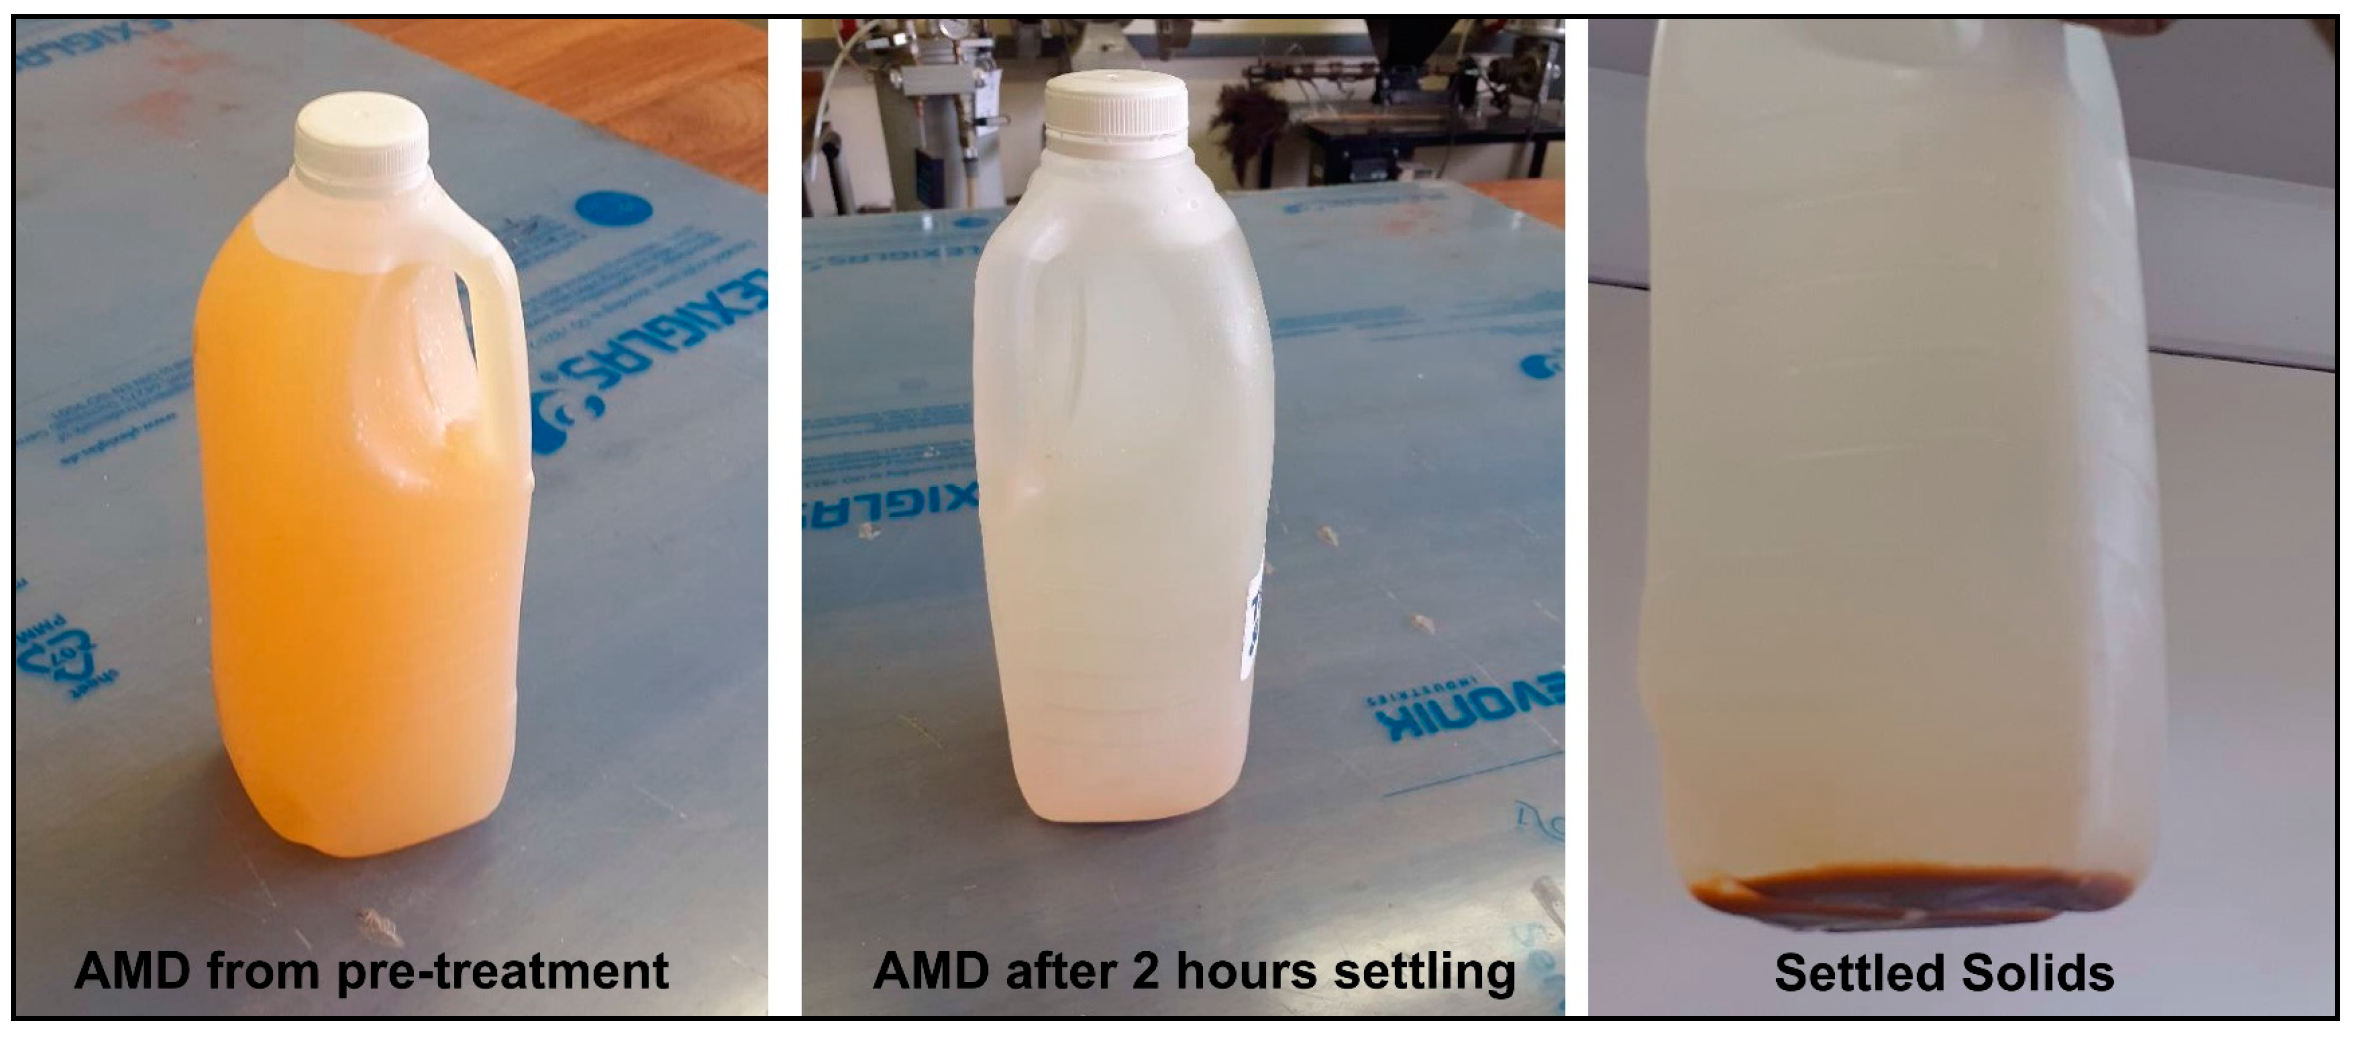
3.1. Permeable Reactive Barrier Pre-Treatment

The AMD was pre-treated using pervious concrete as a PRB. Pervious concrete remediates AMD through the dissolution of portlandite (Ca(OH)2), resulting in pH neutralisation and metal hydroxide precipitation [25,30]. Furthermore, Ca(OH)2 can react with SO4,resulting in crystallisation of gypsum (CaSO4). The precipitants in the pre-treated AMD solution were settled in two-litre containers with a liquid height of 230 mm. The raw AMD and clarified pre-treated AMD determinands are shown in Table 4.
Complete sedimentation of the precipitated solids was achieved after a retention time of 2 h. The pre-treatment process yielded a 99.7%, 83%, 22.9%, 17.5% and 10% reduction in the concentrations of Fe, Al, Mg, Na and SO4 respectively. The pH was raised from 2.7 to 4.3. The concentration of Ca was increased by 9% as a result of the leaching of portlandite from the concrete surface. The concentration of K was also increased by more than fourfold following the pre-treatment process. The increase in the concentration of K can be attributed to the leaching of the potassium oxide present in the pervious concrete [25,34].

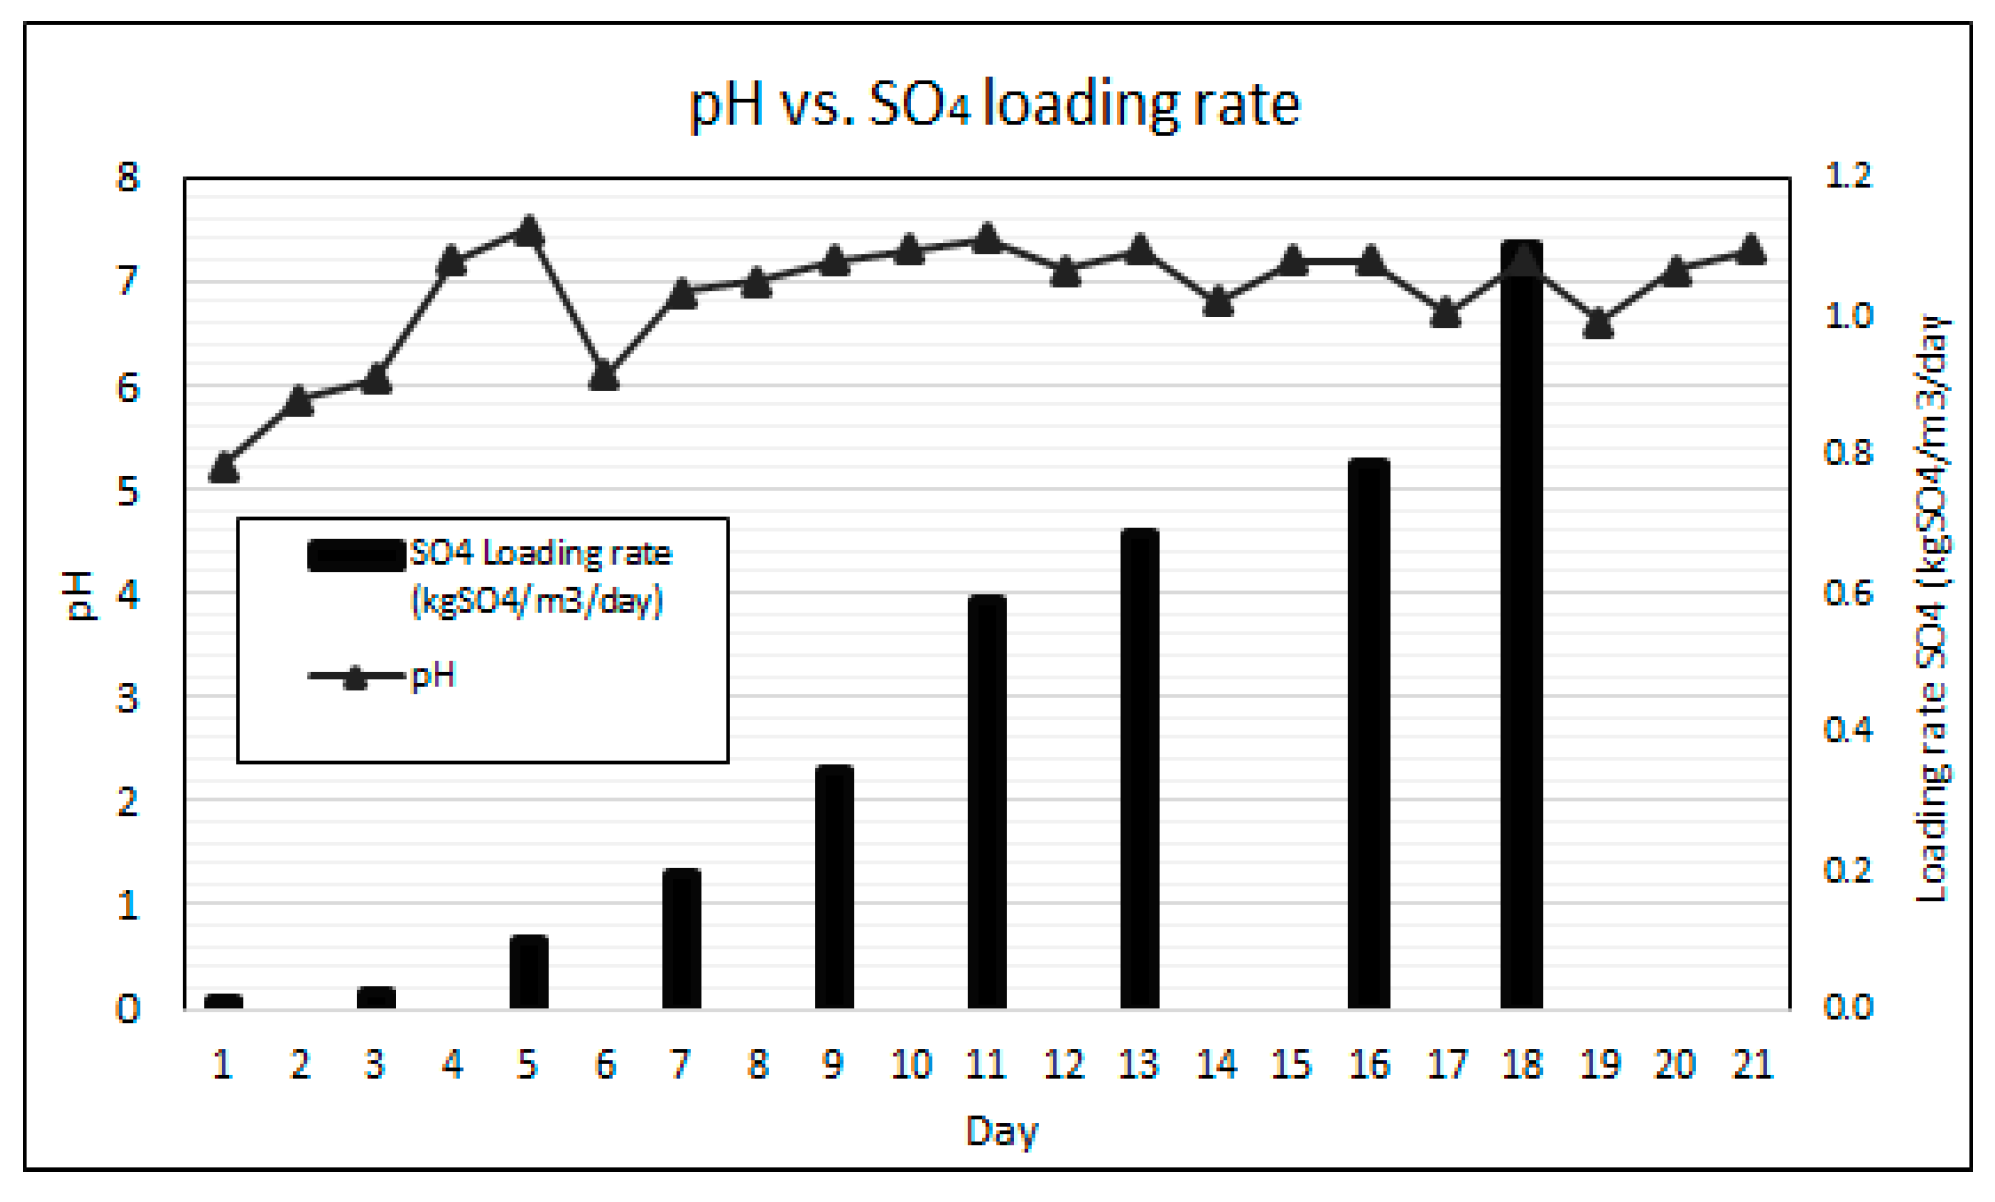
3.2. pH Self-Regulation

Key to the effective performance of the AD bioreactor process is maintaining the pH within the neutral range for optimal growth of the consortium of microorganisms [20]. Due to the higher growth rates of acidogens resulting in net acidity as well as the acidity present in AMD, an external supply of alkalinity is typically required to neutralise a bioreactor’s pH [23,35]. The pervious concrete fixed bed bioreactor was gradually ramped-up to a SO4 loading rate of 1.104 kgSO4/m3/day over the 21-day duration of the experiment without any external pH correction. Figure 6 graphically illustrates the SO4 loading rates and the daily measured bioreactor pH for the experimental duration.
The results show a gradual increase in pH from 4.3 to 6.1 over the first five days, and an eventual stabilisation of the pH between 6.5 and 7.5 throughout the remainder of the experiment. It was observed that the bioreactor’s pH dropped the day following each SO4 batch ramp-up cycle, indicated as the SO4 loading days on Figure 6, due to the additional acidity added by the pre-treated AMD. This observation illustrates that the system remains highly sensitive to acidity loading and careful operation is required to maintain pH within the optimum range. The dissolution of the pozzolanic concrete and the leaching of portlandite, adding alkalinity to the system, is attributed to the pH buffering [25,30]. The pH results demonstrate the capability of pervious concrete as a fixed bed reactive medium to self-regulate the process pH within the neutral range with increasing AMD loading rates and varying Volatile Fatty Acids (VFAs) generation. However, the most optimal pH range for anaerobic digestion is between pH 6.8 and 7.2 [36,37]. When pH drops below 6.8, as experienced in this experiment following the AMD ramp-ups, the undesired growth of filamentous bacteria and some Nocardioforms may occur [21]. The presence of filaments in the AD process is discussed later in this results section.

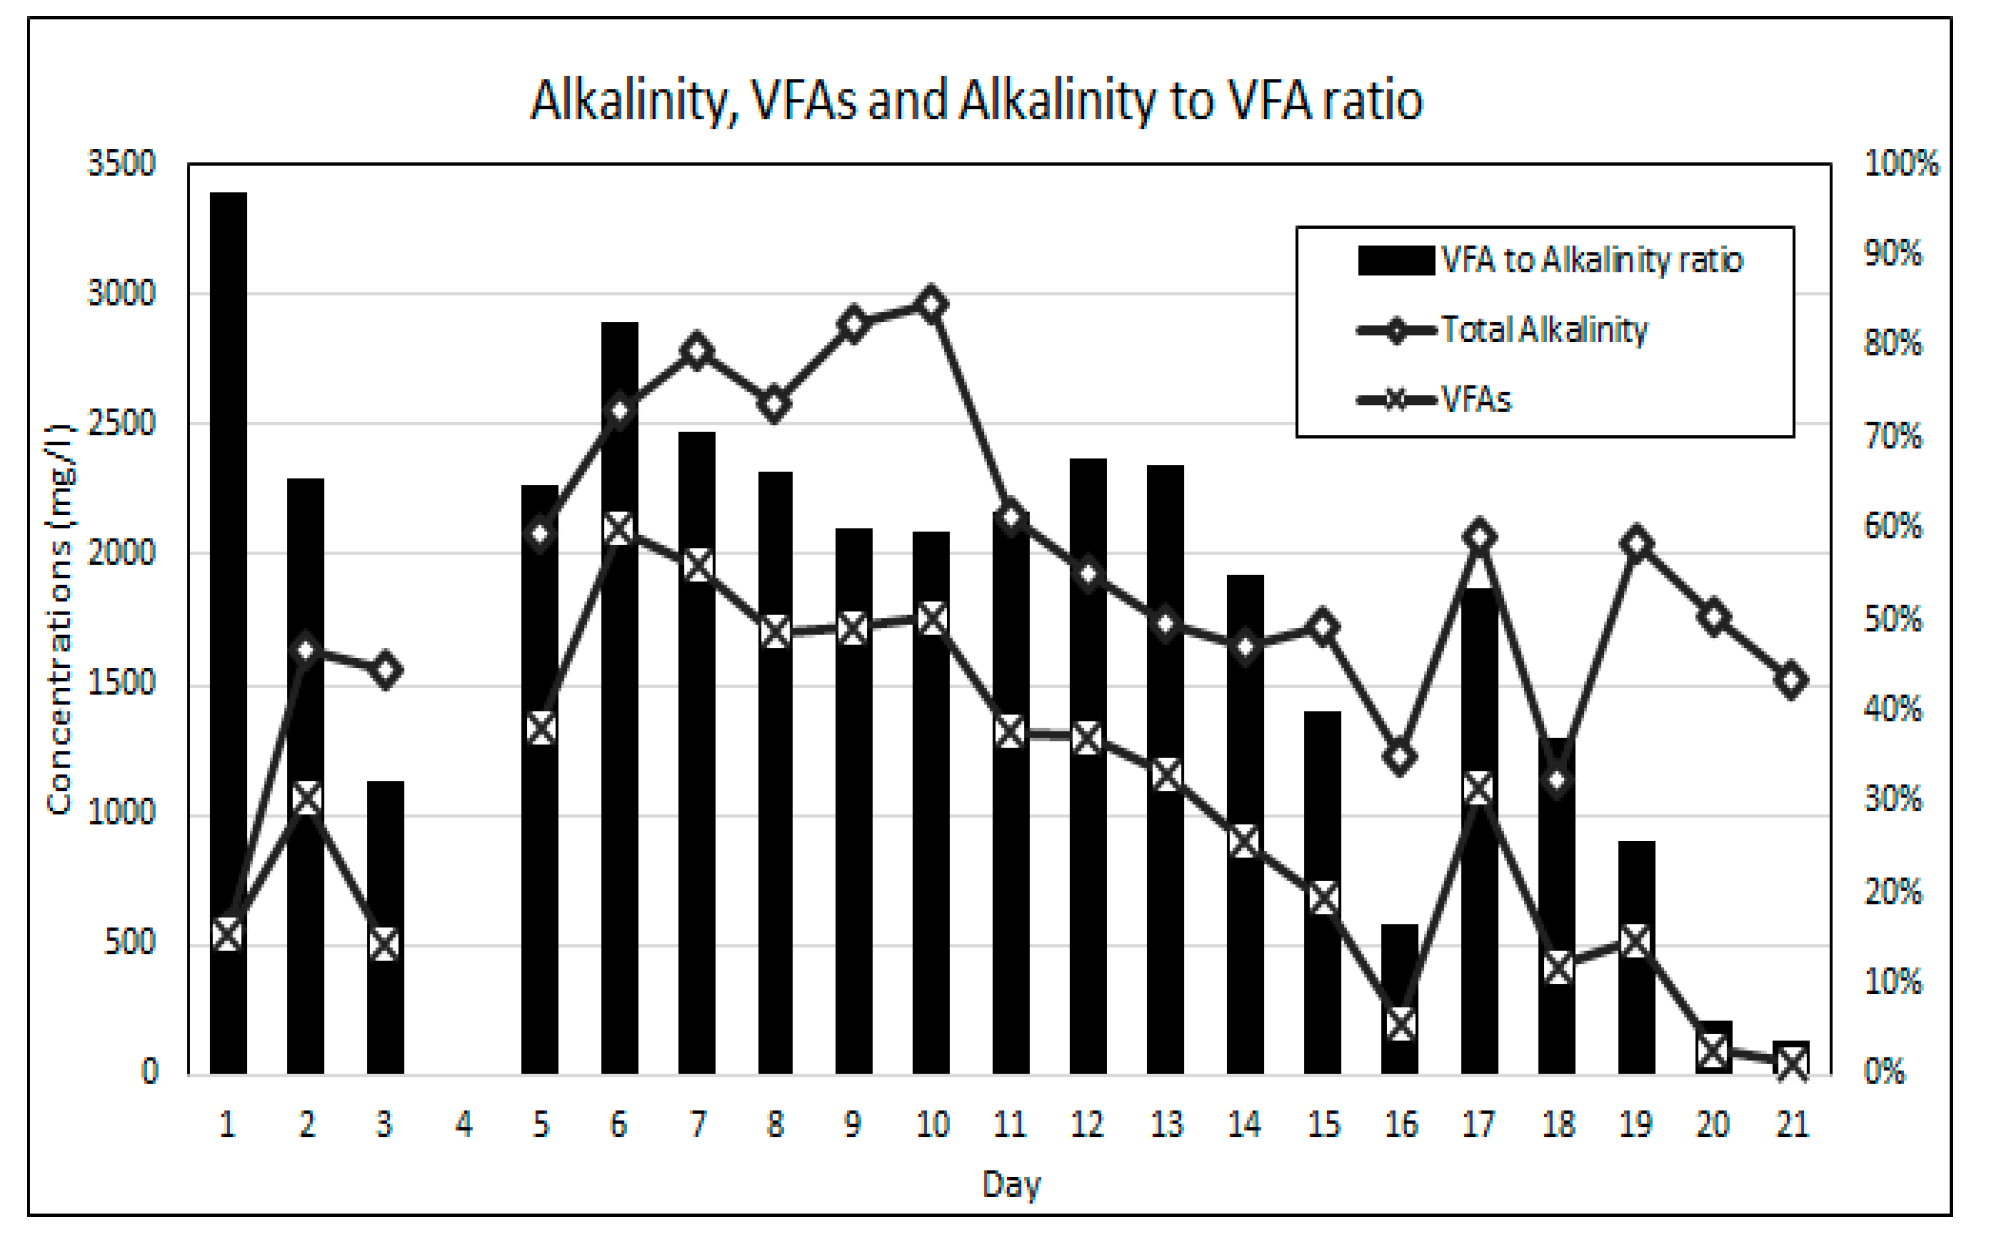
3.3. Alkalinity and Volatile Fatty Acids

Equally as important as maintaining stable neutral pH is the balance between the availability of alkalinity and VFAs for anaerobic bioremediation. VFAs are crucial intermediates in the transfer of carbon and energy in the methane formation and the SO4 reducing pathways [14,21]. The VFA to alkalinity ratio is an important indicator of the AD process conditions and the stability between the acidogenic and alkalising microorganisms [20]. The activity of these microorganisms is highly influenced by temperature. The bioreactor’s temperature was maintained within the mesophilic temperature range of 36 °C and 38 °C throughout this experiment. An alkalinity to VFA ratio of between 0.3 and 0.4 has generally been accepted as optimal for anaerobic digestion, while ratios exceeding 0.8 have been regarded as sub-optimal [38,39]. Figure 7 shows the change in the VFA and alkalinity concentrations over the duration of the experiment. The operational protocol for this experiment is comprised of an increasing ramp-up of the SO4 loading rate, while the simple organic matter source (measured as COD) was gradually reduced. Figure 8 shows the SO4 and COD concentrations measured daily. Figure 9 shows the relationship between the measured concentrations of COD and VFAs for the duration of the experiment.
It was found that the relationship between the availability of COD and the generation of VFAs was statistically significant with a two-tail significance value (p value) of less than 0.01 and a Pearson correlation coefficient (r value) of 0.756. The statistically significant relationship can be attributed to the rapid hydrolysis and acidogenesis of glucose due to its simple carbon structure [28,40]. The results indicate that the gradual reduction in the COD to SO4 ratio resulted in a reduction in the generation of VFAs. The high COD availability over the initial 13 days of the experiment resulted in high VFA to alkalinity ratios ranging from 0.96 to 0.59. This observation suggests that for high loading rates of simple organic matter in anaerobic bioreactors the methanogenesis and sulphidogenic processes are the rate limiting steps. A gradual reduction in the VFA concentration, resulting in a reduction in the VFA to alkalinity ratio, was observed over the duration of the experiment, which indicates a decline in acidogenic microbial activity as a result of the reducing COD to SO4 ratios.
From experimental day 5 to day 13, the VFA to alkalinity ratio remained relatively stable between 0.7 and 0.6, while the COD to SO4 ratio was greater than 20:1. During this period of high VFA generation, the greatest SO4 reduction rates were achieved with an average daily SO4 reduction rate of 52.5% over the period. From operational day 14 to day 18, the VFA to alkalinity ratio reduced from 0.55 to 0.25 as the COD to SO4 ratio was reduced from 4.2:1 to 1.8:1. In this period, where the VFA to alkalinity ratios were closest to the accepted optimal range, the SO4 reduction rates were significantly lower, with an average SO4 reduction rate of 18% per day for the period. On day 19 to 21, the VFA to alkalinity ratio dropped below 0.1 while the COD to SO4 ratio reduced to 1.5:1. Over this period the average daily SO4 reduction rate was 11%. The experimental results indicate that a COD to SO4 ratio of below 5:1 is performance limiting when using simple organic matter for AMD bioremediation.

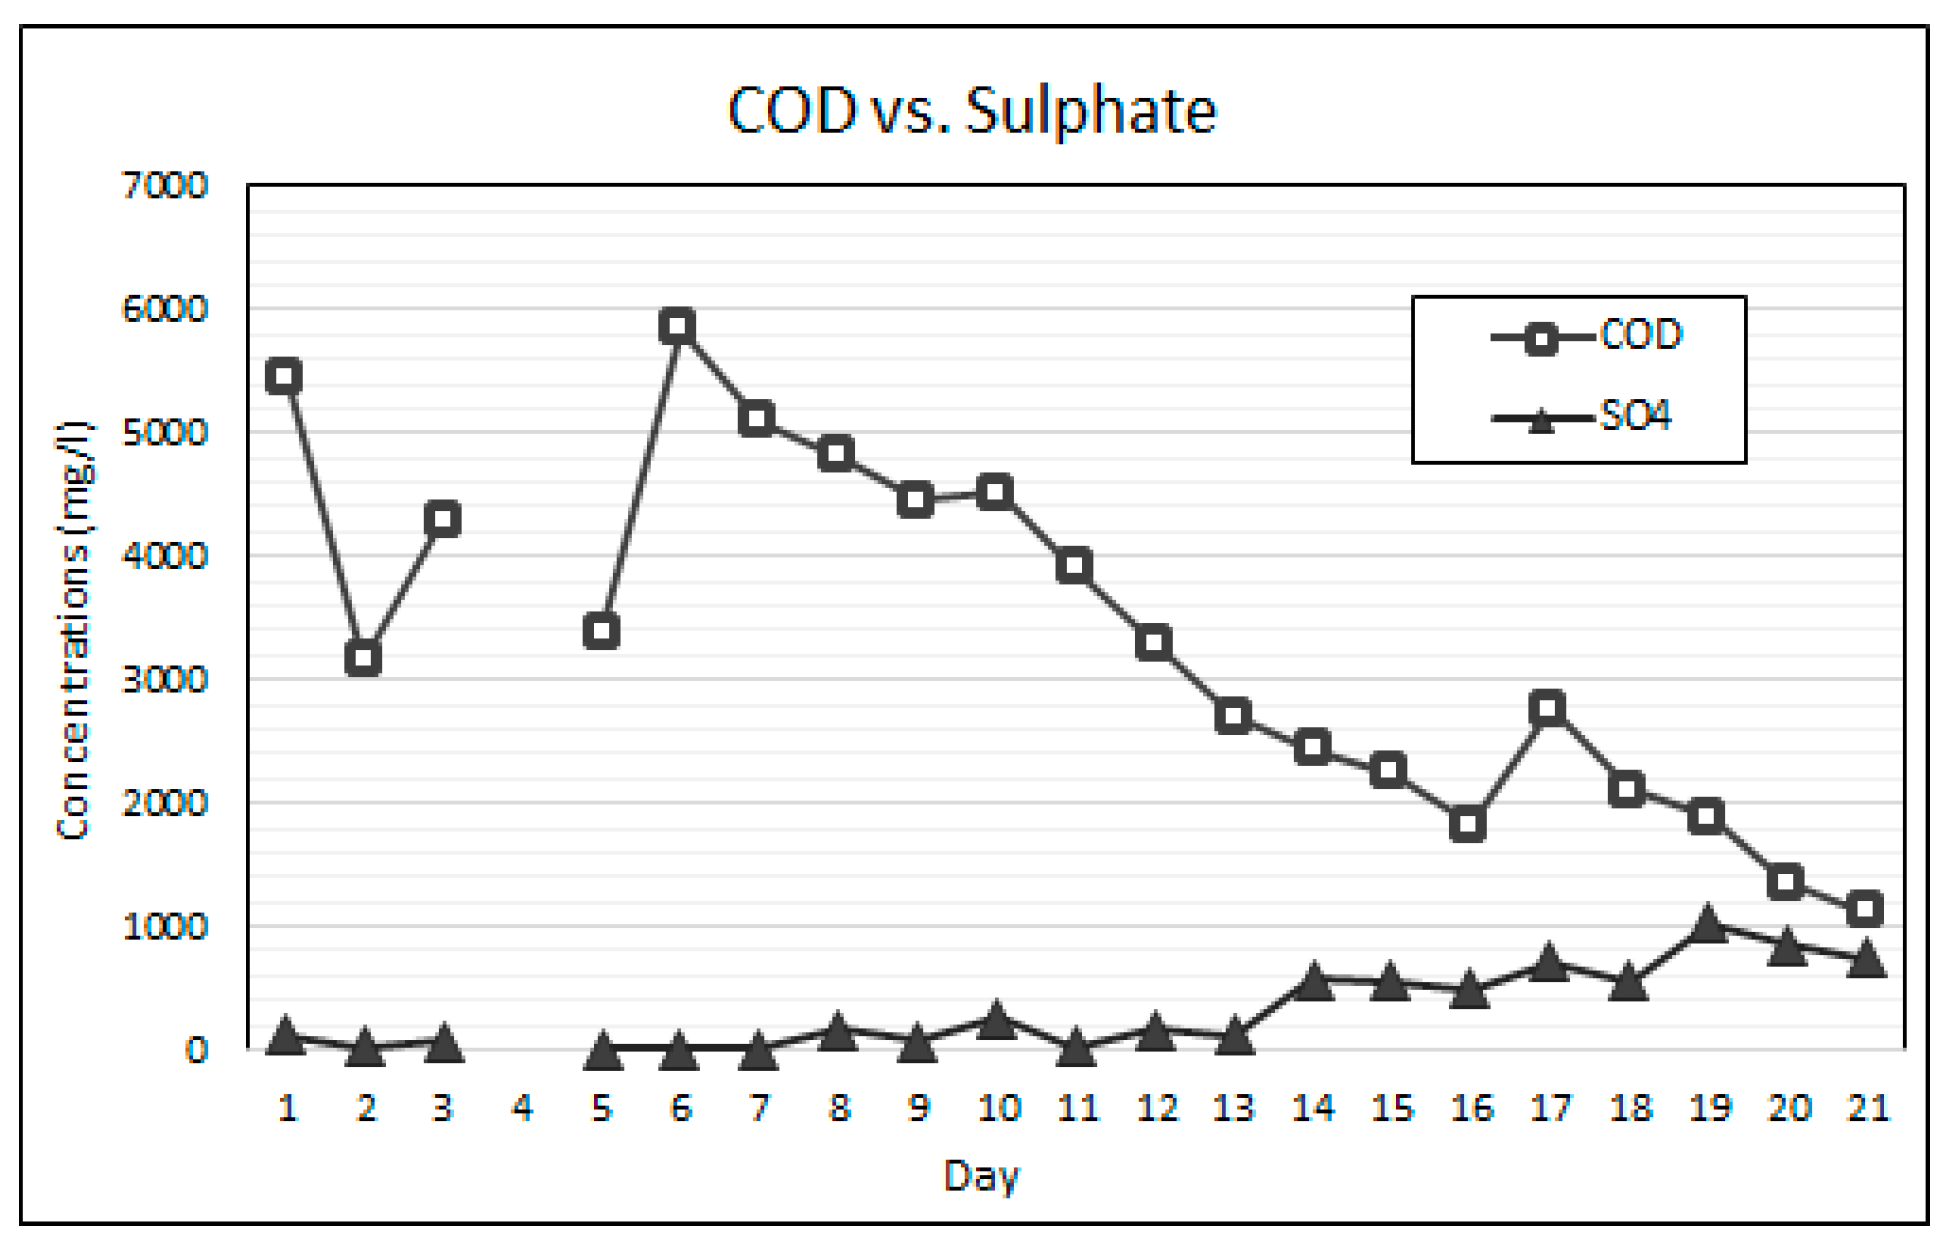
3.4. SO4 Reduction Results

Figure 10 shows the calculated percentage reductions in COD and SO4 concentrations over the duration of the experiment. The results for the percentage SO4 reduction fluctuates throughout the experiment. SO4 reduction rates were found to be highest following ramp-up days when the concentrations of COD, VFAs, nutrients and SO4 were highest. The COD reduction rates also fluctuated, to a lesser degree however, and peak reduction rates were also achieved post ramp-up days. During the initial 12 days of operation, with a VFA to alkalinity ratio of between 0.90–0.59, the SO4 reduction rates on the days following ramp-up cycles fluctuated between 96% and 55%. From day 13 to day 18, with a VFA to alkalinity ratio of between 67% and 36%, the SO4 reduction rates on the days following ramp-up cycles fluctuated between 30% and 11%. On days 19 to 21, the VFA to alkalinity ratio dropped below 25% and the SO4 reduction rate on the day following the ramp-up cycle was 20%. The COD reduction rates throughout the experimental duration were relatively stable, between 45% and 20% following ramp-up days.
Figure 11 shows a second order polynomial regression analysis of the relationship between the VFA to alkalinity ratios and the SO4 reduction rates achieved in this study. The polynomial regression model, with coefficient of determination (r2 value) of 0.39, predicts an increase in the SO4 reduction rates with an increase in the VFA to alkalinity ratio above 0.3. The regression model indicates that a VFA to alkalinity ratio of 0.5 and below is performance limiting with SO4 reduction rates of 20% and below. The regression model suggests that VFA to alkalinity ratios of between 0.6 and 0.85 is most optimal for SO4 reduction when using simple organic matter. The high SO4 reduction rates achieved at the high VFA to alkalinity ratios may be attributed to the greater availability of the VFA intermediaries required by the SRP for the reduction of SO4 to H2S.

3.5. Hydraulic Retention Time

The Hydraulic Retention Times (HRTs) in the bioreactor and the recycling tank were 220 min and 47 min on average respectively. This resulted in the AMD fluid spending 18% of the available retention time in the recycling tank where minimal bioremediation could take place. Ideally, the working fluid would be retained in the recycling tank for as brief a period as possible to promote the contact time between the AMD effluent and the microorganisms suspended in the pervious concrete. Due to the design geometry, nearly 9 h of the 48 h retention time between ramp-ups was not productive leaving room for process optimisation and improved remediation performance.
Due to the relatively low concentration of SO4 in the raw AMD, large AMD ramp-up volumes, with respective to the bioreactor’s working volume, were required to achieve loading rates greater than 0.5 kgSO4/m3/day. The limited working volume of the bioreactor resulted in spike loading of acidity and a drop in pH following each ramp-up cycle. The bioreactor proved capable of buffering the peak acidity loading throughout the experiment and was able to maintain the pH within the neutral range. However, a suboptimal pH fluctuation of ±1 unit was achieved following pH stabilisation from day 5 of the experiment. Optimisation of the bioreactor volumetric design can allow for sufficient buffering capacity of incoming acidity leading to reduced pH fluctuation and improved AD process performance.

3.6. Microscopic Results

Microscopic evaluation was conducted to assess the general composition of the sludge sample with regards to filamentous bacteria and protozoa. The floc structures observed from the final AD sludge were open structures, irregular shaped, medium sized and brown in colour. Filaments were present in the sludge flocs but were rarely observed in all flocs. Filamentous bacteria that were identified were Microthrix parvicella, Type 0041 and Type 1863. The abundant growth of filamentous bacteria Microthrix parvicella and Type 0041 is generally associated with low food to microorganisms (F/M) ratio conditions and a pH below 6.7 [21]. In this experiment, the operational protocol which reduced the supply of organic matter leading to a reduction in the availability of VFAs is attributed to causing the low F/M conditions. The presents of filamentous bacteria in an AD is undesirable, as these bacteria can lead to significant foaming problems within the bioreactor, thereby negatively impacting performance [41]. Filaments require aerobic conditions to grow, and thus their presence may be traced back to the feed sludge source which was collected following an aerobic basin process. Figure 12 shows the phase contrast and bright field microscopic images of the sludge floc structure and the filamentous bacteria observed.

4. Implications

Active anaerobic digestion is a promising AMD remediation solution with the potential to combine SO4, metals and acidity removal into a single process with significantly lower volumes of toxic waste sludge generation in comparison to the more commonly used chemical neutralization and precipitation methods [15,24]. However, high operational complexity, prolonged HRT requirements and high operational costs have been key limitations towards the large scale global implementation of active AMD bioremediation technologies [18,35].
Recently conducted studies on AMD bioremediation with technologies such as Moving Bed Biofilm Reactor (MBBR), Anaerobic Sludge Bed Reactor (UASB) and Continuously Stirred Tank Reactor (CSTR) without the use of external pH correction indicate that HRTs of between 3 and 5 days are required for treatment [8,13]. According to Akinpelu et al. (2020), HRTs below 3 days do not allow sufficient time for microbial activity to neutralize AMD acidity. This may be attributed to the acidifying reactions being more thermodynamically favourable, and the acidogenic microorganisms having the highest growth rates due to their higher substrate uptake rate [20,23]. This study found that the fixed-bed pervious concrete AD was capable of neutralizing AMD at increasing loading rates as well as the acidity generated by the acidogenic microorganisms within a 24-h HRT. The longevity and scalability of the pervious concrete as a neutralizing agent in the AD process requires further validation to assess suitability for pilot and industrial scaling. Research conducted by Shabalala et al. (2017) has already illustrated that pervious concrete can continue to neutralize AMD acidity for periods exceeding 300 days [25]. Capital investments for bioreactors are mostly dependent on the retention times required [16], and therefore the lower HRTs achieved when using the fixed-bed pervious concrete AD can result in smaller bioreactors and reduced capital costs.
The research results found a statistically significant correlation between the availability of COD from the simple organic matter and the production of VFA intermediaries by the acidogenic microorganisms. This finding can be attributed to the rapid bio-utilisation of the simple organic matter leading to accelerated acidogenesis [28,40]. During the initial 13 days of the experiment the bioreactor was operated under high VFA conditions, with VFA concentrations exceeding 1000 mg/L and VFA to alkalinity ratios exceeding 0.6, as a result of the high initial organic loading rates. These conditions would typically cause bioreactor acidification when using existing bioreactor technologies and would result in the loss in microbial colonies [38,39]. However, in this study not only did the pH remained stable throughout this phase of the experiment, the bioreactor was capable of achieving a daily average SO4 reduction rate of 52.5% in under 24 h effective retention time during this period. The high acidity neutralisation capabilities of the fixed bed pervious concrete medium can enable effective co-bioremediation of AMD with wastewaters comprised of high sugar content, such as confectionery manufacturing and soft drink industries where VFA production at high COD loading rates can exceed the conventional limits for AD technologies [42].
The operational costs of an AMD treatment bioreactor are primarily driven by the organic matter supply. The cost associated with the simple organic matter used in this experiment can be a limitation due to the high volume required for effective AMD remediation as a result of rapid utilisation [40]. In comparison to the limiting COD to SO4 ratio of 5:1 for glucose found in this study, comparative studies have found effective remediation performance with ratios of 2:1 when using complex organic matter such as sewage sludge [14,15]. The lower ratio requirements for the more complex sewage carbon source can be attributed to the slower hydrolysis and acidogenic digestion allowing for improved process equilibrium between acidogenic and alkalising microorganisms [21]. It is therefore thought that improved process stability and COD to SO4 ratios may be achieved when using more complex organic matter which can yield lower costs. Further evaluation of the bioreactor using industrial or sewage wastewater is recommended to evaluate COD to SO4 ratio improvements.

5. Conclusions

This study investigated the pH self-regulation capabilities, SO4 remediation capabilities and the optimal operating parameters of a laboratory-scale fixed-bed pervious concrete anaerobic bioreactor as a second stage AMD remediation process. AMD was pre-treated using pervious concrete as a PRB. The bioreactor process was operated over a 21 day period. The operational protocol comprising of a gradual ramp-up of the SO4 loading rate while gradually reducing the SO4 to COD ratio in order to identify performance limiting conditions. The study found that pervious concrete as a fixed bed medium is capable of regulating pH within the neutral range. The study further found that when using simple organic matter as a carbon source the performance limiting COD to SO4 ratio and VFA to alkalinity ratio were below 5:1 and 0.5:1, respectively. The specific findings of this study were as follows:
(I).
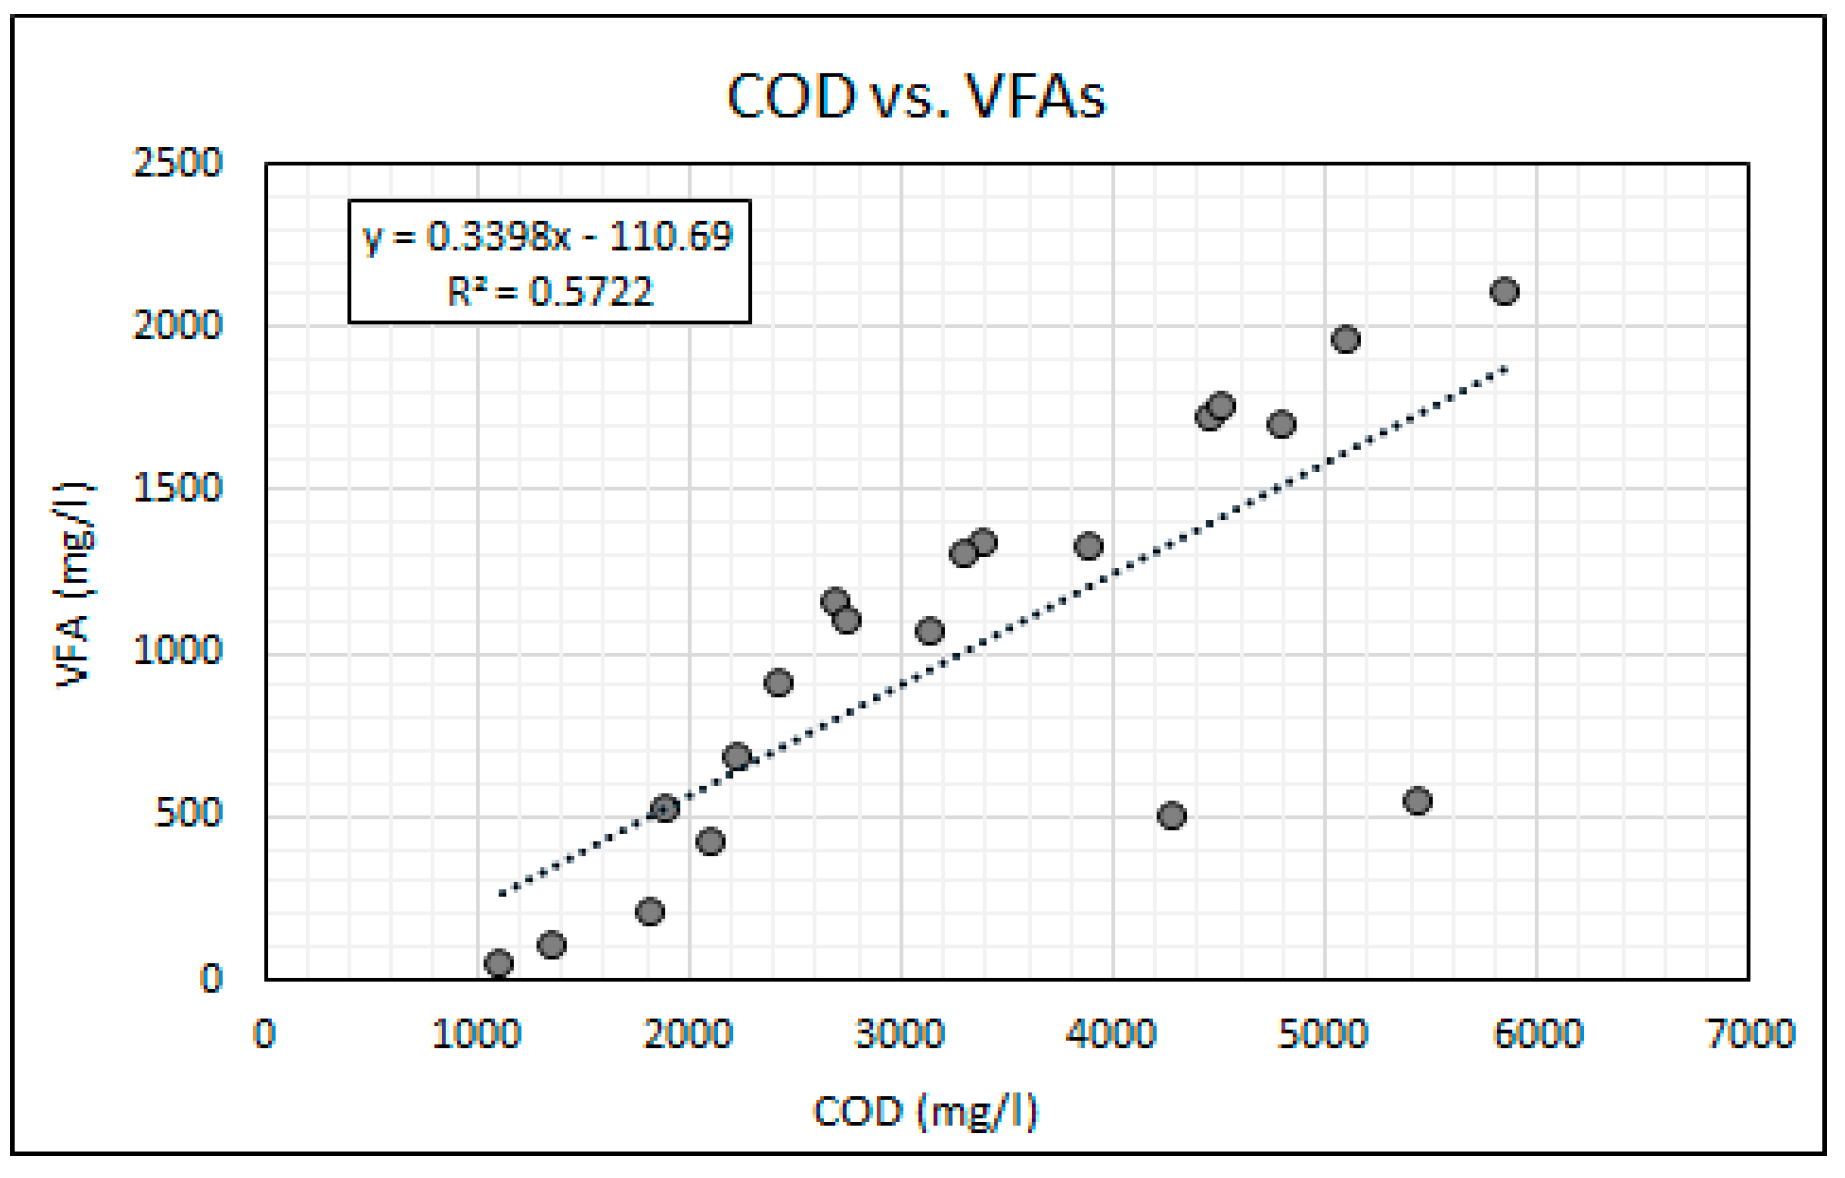
The study found a statistically significant relationship between the availability of COD from simple organic matter and the generation of VFAs with a two-tail significance value (p value) of less than 0.01 and r value of 0.756. The research findings indicate that when using simple organic matter for biological SO4 reduction, the methanogenesis and sulphidogenic processes are rate limiting.
(II).
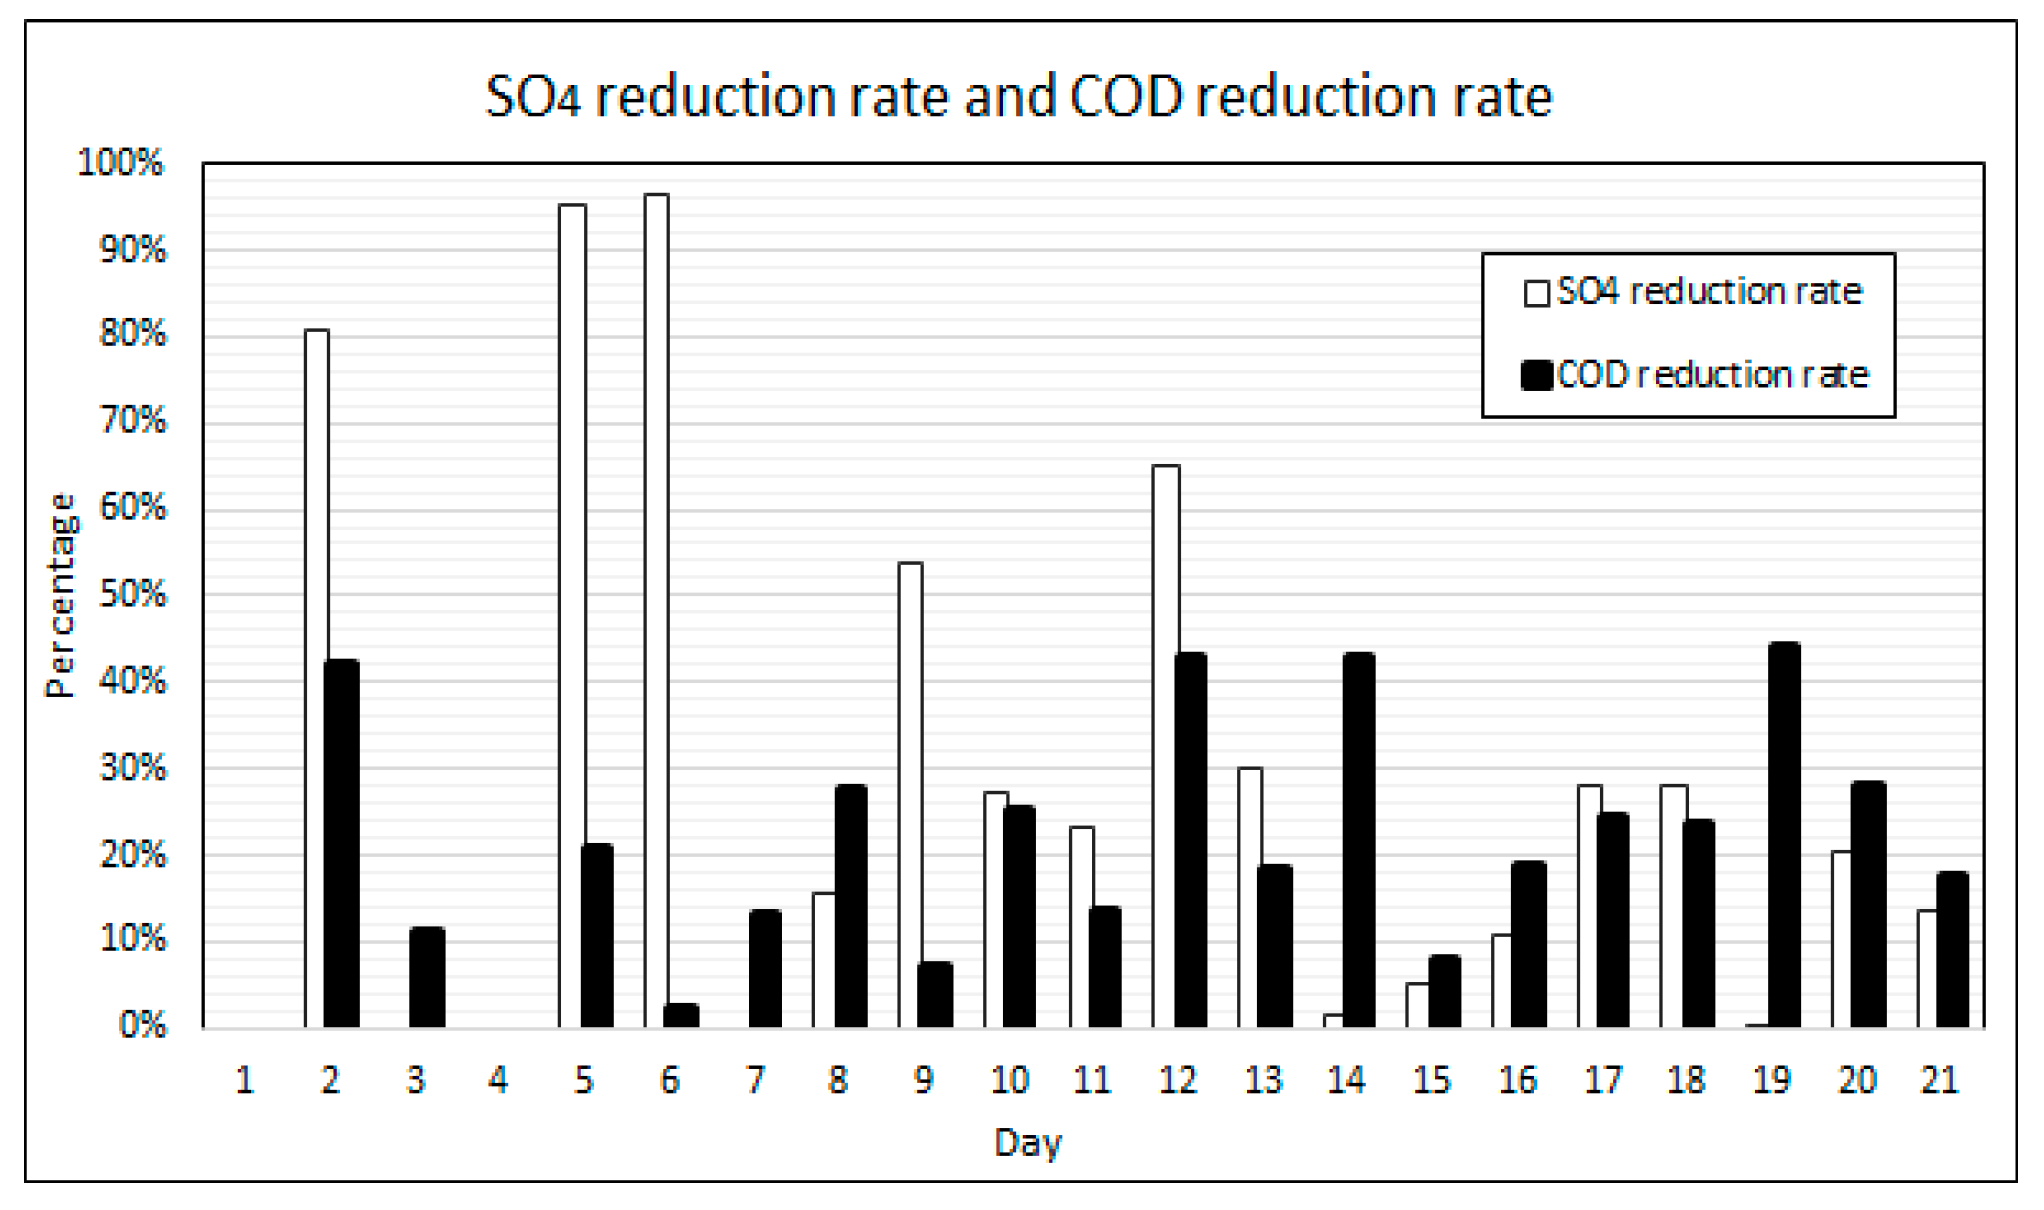
High SO4 reduction rates were achieved during the initial half of the experiment and it was found that the reduction rates were highly dependent on the availability of COD and the biological generation of VFAs. SO4 reduction rates ranging from 96% and 55% were achieved with VFA to alkalinity ratios above 0.6 and VFA concentrations exceeding 800 mg/L.
(III).
Pervious concrete as a fixed reactive medium was able to maintain the bioreactor pH between 6.5 and 7.5 upon process stability. The study findings indicate that the pH regulation performance of the pervious concrete medium is dependent on acidity loading rates and the volumetric design for buffering capacity. The self-regulation capabilities of pervious concrete can be a viable solution to reduce operational cost and operational complexity of AMD remediation bioreactors to promote viability of the process. Further investigation is required to assess the longevity of the pH regulation capabilities.
Based on the research findings, when using simple organic matter as a carbon source the recommended VFA to alkalinity ratio for optimal performance is between range 0.6 and 0.85 when the pH balance is maintained with a COD to SO4 ratio of greater than 5:1.

Author Contributions

Conceptualization, S.K.T.; methodology, S.K.T.; formal analysis, S.K.T.; resources, D.V.V.K. and S.K.T.; writing—original draft preparation, S.K.T.; writing—review and editing, D.V.V.K. and P.B.; supervision, D.V.V.K. and P.B.; funding acquisition, D.V.V.K. All authors have read and agreed to the published version of the manuscript.

Funding

This research was funded by the South African Systems Analysis Centre (SASAC)—Newton Fund. The funding was facilitated by SASAC and the British Council through the South African National Research Foundation (NRF).

Open Access Funding

The open access funding was provided by the University of Johannesburg Library, Doonfontein Campus (DFC), Doonfontein, Johannesburg 2006, South Africa.

Institutional Review Board Statement

Not applicable.

Informed Consent Statement

Not applicable.

Data Availability Statement

Data is contained within the article.

Acknowledgments

We would like to acknowledge the South African Systems Analysis Centre (SASAC)—Newton Fund for funding this research. We would also like to acknowledge the South African National Research Foundation (NRF) and the British Council for facilitating the funding.

Conflicts of Interest

The authors declare no conflict of interest.

References

  1. Akcil, A.; Koldas, S. Acid Mine Drainage (AMD): Causes, treatment and case studies. J. Clean. Prod. 2006, 14, 1139–1145. [Google Scholar] [CrossRef]
  2. Johnson, B.D.; Hallberg, K.B. Acid Mine Drainage Remediation Options: A Review. Sci. Total Environ. 2005, 338, 3–14. [Google Scholar] [CrossRef]
  3. McCarthy, S. The Impact of Acid Mine Drainage in South Africa. S. Afr. J. Sci. 2011, 107, 1–7. [Google Scholar] [CrossRef]
  4. de Klerk, A.R.; Oberholster, P.J.; van Wyk, J.H.; Truter, J.C.; Schaefer, L.M.; Botha, A.M. The Effect of Rehabilitation Measures on Ecological Infrustructure in Response to Acid Mine Drainage from Coal Mining. Ecol. Eng. 2016, 95, 463–474. [Google Scholar] [CrossRef]
  5. Udayabhanu, G.; Prasad, B. Studies on environmental impact of acid mine drainage generation and its treatment: An appraisal. Indian J. Environ. Prot. 2010, 30, 953–967. [Google Scholar]
  6. Rose, P. Long-term sustainability in the management of acid mine drainage wastewaters–development of the Rhodes BioSURE Process. Water S. Afr. 2013, 39, 583–592. [Google Scholar] [CrossRef] [Green Version]
  7. Thisani, S.K.; Kallon, D.V.V.; Byrne, P. Geochemical Classification of Global Mine Water Drainage. Sustainability 2020, 12, 10244. [Google Scholar] [CrossRef]
  8. Akinpelu, E.A.; Ntwampe, S.K.; Fosso-Kankeu, E.; Waanders, F. Comparative analysis of brewing wastewater and lactate as carbon sources for microbial community treating acid mine drainage in anaerobic MBBR systems. Environ. Technol. 2020, 1–8. Available online: https://www.tandfonline.com/doi/abs/10.1080/09593330.2020.1771431 (accessed on 3 June 2021). [CrossRef] [PubMed]
  9. Msagati, T.A.; Nkambule, T.I.; Kefeni, K.; Mamba, B. Synthesis and application of hematite nanoparticles for acid mine drainage treatment. J. Environ. Chem. Eng. 2018, 6, 1865–1874. [Google Scholar]
  10. Novhe, O.; Yibas, B.; Coetzee, H.; Atanasova, M.; Netshitungulwana, R.; Modiba, M.; Mashalane, T. Long-Term Remediation of Acid Mine Drainage from Abandoned Coal Mine Using Integrated (Anaerobic and Aerobic) Passive Treatment System, in South Africa: A Pilot Study. In Proceedings of the International Mine Water Association, Leipzig, Germany, 11–15 July 2016; pp. 668–674. [Google Scholar]
  11. Sun, R.; Li, Y.; Lin, N.; Ou, C.; Wang, X.; Zhang, L.; Jiang, F. Removal of heavy metals using a novel sulfidogenic AMD treatment system with sulfur reduction: Configuration, performance, critical parameters and economic analysis. Environ. Int. 2020, 136, 105457. [Google Scholar] [CrossRef]
  12. Janssen, A.J.; Ruitenberg, R.; Buisman, C.J. Industrial applications of new sulphur biotechnology. Water Sci. Technol. 2001, 44, 85–90. [Google Scholar] [CrossRef]
  13. Sanchez-Andrea, I.; Sanz, J.L.; Bijimans, M.F.; Stams, A.J. Sulfate reduction at low pH to remediate acid mine drainage. J. Hazard. Mater. 2014, 269, 98–109. [Google Scholar] [CrossRef]
  14. Neda, A.; Whittington-Jones, K.; Rose, P.D. Salinity, Sanitation and Sustainability Vol. 4: The Rhodes BioSURE Process; Water Research Commission: Pretoria, South Africa, 2007. [Google Scholar]
  15. Pionapen, J.; Wentzel, M.C.; Ekama, G.A. Biological sulphate reduction with primary sewage sludge in an upflow anaerobic sludge bed (UASB) reactor-Part 1: Feasibility study. Water SA 2009, 35, 525–534. [Google Scholar] [CrossRef] [Green Version]
  16. Foucher, S.; Battaglia-Brunet, F.; Ignatiadis, I.; Morin, D. Treatment by sulfate reducing bacteria of Chessy acid mine drainage and metal recovery. Chem. Eng. Sci. 2001, 56, 1639–1645. [Google Scholar] [CrossRef]
  17. Isa, Z.; Grusenmeyer, S.; Verstraete, W. Sulphate reduction relative to methane production in high rate anaerobic digestion: Microbiological aspects. Appl. Environ. Microbiol. 1986, 51, 580–587. [Google Scholar] [CrossRef] [Green Version]
  18. Papirio, S.; Villa-Gomez, D.K.; Esposito, G.; Pirozzi, F.; Lens, P.N. Acid Mine Drainage Treatment in Fluidized Bed Bioreactors by Sulfate Reducing Bacteria: A Critical Review. Crit. Rev. Environ. Sci. Technol. 2013, 43, 2545–2580. [Google Scholar] [CrossRef]
  19. Visser, A. The Anaerobic Treatment of Sulphate Containing Wastewater. Ph.D. Thesis, Wageningen Agricultural University, Wageningen, The Netherlands, 1995. [Google Scholar]
  20. Opollo, S.O. Integrated Anaerobic Digestion and UV Photocatalytic Treatment of Industrial Wastewater in Fluidized Bed Reactors. Ph.D. Thesis, Vaal University of Technology, Vanderbjilpark, South Africa, 2016. [Google Scholar]
  21. Gerardi, M.H. Wastewater Bacteria; John Wiley & Sons, Inc.: Hoboken, NJ, USA, 2006. [Google Scholar]
  22. Yang, P.Y.; Wang, M.L.; Viraraghaven, T. Biotechnology applications in wastewater treatment. Environ. Sanit. Rev. 1990, 29, 88. [Google Scholar]
  23. Archarya, B.K.; Mohana, S.; Madamwar, D. Anaerobic treatment of distillery spent wash-a study on upflow anaerobic fixed film bioreactor. Bioresour. Technol. 2008, 99, 621–4626. [Google Scholar]
  24. Kaksonen, A.H.; Sahinhaya, E. Review of sulfate reduction based bioprocesses for acid mine drainage treatment and metals recovery. Eng. Life Sci. 2007, 7, 541–564. [Google Scholar] [CrossRef]
  25. Shabalala, A.N.; Ekolu, S.O.; Diop, S.; Solomon, F. Pervious concrete reactive barrier for removal of heavy metals from acid mine drainage-column study. J. Hazard. Mater. 2017, 353, 641–653. [Google Scholar]
  26. Waybrant, K.R.; Blowes, D.W.; Ptacek, C.J. Selection of Reactive Mixtures for use in Permeable Reactive Walls for Treatment of Mine Drainage. Environ. Sci. Technol. 1998, 32, 1972–1979. [Google Scholar] [CrossRef]
  27. Klemps, R.; Cypionka, H.; Widdel, F.; Pfennig, N. Growth with hydrogen, and further physiological characteristics of Desulfotomaculum species. Arch. Microbiol. 1985, 142, 203–208. [Google Scholar] [CrossRef]
  28. McCauley, C.A.; O’Sullivan, A.D.; Milke, M.W.; Weber, P.A.; Trumm, D.A. Sulfate and metal removal in bioreactors treating acid mine drainage dominated with iron and aluminum. Water Res. 2009, 43, 961–970. [Google Scholar] [CrossRef]
  29. Cement & Concrete Institute. Cementitious Material for Concrete Standards, Selection and Properties; Cement & Concrete Institute: Midrand, South Africa, 2009. [Google Scholar]
  30. Ekolu, S.O.; Azane, F.Z.; Diop, S. A concrete reactive barrier for acid mine drainage treatment. Proc. Inst. Civ. Eng. Water Manag. 2014, 167, 373–380. [Google Scholar] [CrossRef] [Green Version]
  31. Mafanya, L.; Kallon, D.V.V. A Contribution to the Debate on the Problem of Acid Mine Drainage in South Africa. SAIIE31 2020, 718–729. [Google Scholar]
  32. Mafanya, L.; Kallon, D.V.V.; Simelane, S.P. Flow Properties Upon Treatment of Acid Mine Drainage Using Pervious Concrete Slabs SAIIE NeXXXt 2019, 399–403. Available online: https://conferences.sun.ac.za/index.php/SAIIENeXXXt/SAIIENeXXXt/paper/viewFile/4299/611 (accessed on 3 June 2021).
  33. Alam, T. Estimatation of Chemical Oxygen Demand in Wastewater Using UV-VIS Spectroscopy; Simon Fraser University: Burnaby, BC, Canada, 2015. [Google Scholar]
  34. Mafanya, L.; Kallon, D.V.V.; Simelane, S.P. Chemical Analysisi of AMD Properties Based on Factorial Method. Open Innov. 2019, 399–403. [Google Scholar]
  35. Rambabu, K.; Banat, F.; Pham, Q.M.; Ho, S.H.; Ren, N.Q.; Show, P.L. Biological Remediation of Acid Mine Drainage: Review of Past Trends and Current Outlook. Environ. Sci. Ecotechnol. 2020, 2, 100024. Available online: https://www.researchgate.net/publication/340030074_Biological_Remediation_of_Acid_Mine_Drainage_Review_of_Past_Trends_and_Current_Outlook (accessed on 3 June 2021).
  36. Widdel, F. Microbiology and Ecology of Sulphate- and Sulphur-Reducing Bacteria; Wiley: New York, NY, USA, 1988; pp. 456–486. [Google Scholar]
  37. Widdel, F.; Bak, F. Gram-Negative Mesophilic Sulfate-Reducing Bacteria. In The Prokaryotes, 2nd ed.; Springer: New Year, NY, USA, 1992; pp. 3352–3378. [Google Scholar]
  38. Sánchez, E.; Borja, R.; Travieso, L.; Martın, A.; Colmenarejo, M.F. Effect of organic loading rate on the stability, operational parameters and performance of a secondary upflow anaerobic sludge bed reactor treating piggery waste. Bioresour. Technol. 2005, 3, 335–344. [Google Scholar] [CrossRef]
  39. Wang, L.H.; Wang, Q.; Cai, W.; Sun, X. Influence of mixing proportion on the solid-state anaerobic co-digestion of distiller’s grains and food waste. Biosyst. Eng. 2012, 112, 130–137. [Google Scholar] [CrossRef]
  40. Gilbert, O.; de Pablo, J.; Cortina, J.L.; Ayora, C. Chemical characterization of natural organic substrates for biological mitigation of acid mine drainage. Water Res. 2004, 38, 4186–4196. [Google Scholar] [CrossRef] [PubMed]
  41. Ganidi, N.; Tyrrel, S.; Cartmell, E. Anaerobic digestion foaming causes-a review. Bioresour. Technol. 2009, 100, 5546–5554. [Google Scholar] [CrossRef] [Green Version]
  42. Pilarska, A.A. Anaerobic Co-Digestion of Waste Wafers from Confectionery Production with Sewage Sludge. Pol. J. Environ. Stud. 2018, 27, 237–245. [Google Scholar] [CrossRef]
Figure 1. Overflow weir—AMD collection point.
Sustainability 13 06529 g001
Figure 2. Pre-treatment process schematic layout.
Sustainability 13 06529 g002
Figure 3. Settling of precipitants from pre-treated AMD.
Sustainability 13 06529 g003
Figure 4. Schematic layout of experimental fixed bed pervious concrete anaerobic bioreactor.
Sustainability 13 06529 g004
Figure 5. Loading of the seed sludge into the bioreactor.
Sustainability 13 06529 g005
Figure 6. pH results at increased SO4 loading rates.
Sustainability 13 06529 g006
Figure 7. Alkalinity and VFA results.
Sustainability 13 06529 g007
Figure 8. COD vs. SO4 results.
Sustainability 13 06529 g008
Figure 9. Relationship between COD and VFAs.
Sustainability 13 06529 g009
Figure 10. COD and SO4 reduction rates.
Sustainability 13 06529 g010
Figure 11. SO4 reduction vs. VFA to alkalinity ratio.
Sustainability 13 06529 g011
Figure 12. Phase contrast and bright field microscopic images—(a) Open floc structure (1000× magnification), (b) gram negative reaction of type 0041 (1000× magnification), (c) gram positive reaction of Microthrix parvicella. (1000× magnification), (d) gram negative reaction of type 1863 (1000× magnification).
Sustainability 13 06529 g012
Table 1. Raw AMD determinands.
DeterminandConcentrationUnits
Sulphate (SO4)2232mg/L
Total Suspended Solids (TSS)<3mg/L
Calcium (Ca)568mg/L
Sodium (Na)228mg/L
Ferrous Iron (Fe2+)40,783µg/L
Manganese (Mn)11,124µg/L
Magnesium (Mg)402mg/L
Aluminium (Al)76,587µg/L
Potassium (K)7.59mg/L
Copper (Cu)1.02µg/L
Zinc (Zn)84µg/L
Boron (B)51µg/L
Nickel (Ni)54µg/L
Lead (Pb)3.05µg/L
pH2.7-
Turbidity0.9NTU
Table 2. Pervious concrete mix designs and porosity.
Cube
Description
Mix Proportion (dry)—Kg per m3% ExtenderPorosity
CEM 1Fly AshSilica Fume9.5 mm Granite13.2 mm GraniteOptima 175Water
Fixed Bed AD152147-14681.356012.1%33.2%
Pre-treatment1971891462-1.757512.1%21.5%
Table 3. Operational protocol—sulphate and glucose loading rate.
Ramp-Up Cycle NumberExperiment Duration (Hours)AMD Ramp-Up Volume (ml)SO4 Loading Rate (kgSO4/m3/day)Glucose Addition (mg)Glucose Loading Rate (kg/m3/day)Glucose to SO4 Loading Ratio
10300.01550001.2282.63
24-----
248450.02220000.4922.14
72-----
3962000.09810,0002.4424.91
120-----
41444000.19660001.477.474
168-----
51927000.34360001.474.271
216-----
624012000.58980001.752.549
264-----
728814000.68760001.472.491
312-----
336-----
836020070.78570001.712.18
384-----
940824001.10460001.191.076
432-----
456-----
480-----
Table 4. Raw and pre-treated AMD determinands.
AMD SourceSO4
(mg/L)
Ca
(mg/L)
Na
(mg/L)
Fe
(mg/L)
Mn
(mg/L)
Mg
(mg/L)
Al
(mg/L)
K
(mg/L)
pHTurbidity
(NTU)
Raw AMD223256822840.78311.12440276.5877.592.70.9
Pre-treated AMD2007621188<0.112.231013.232.94.3<1
Publisher’s Note: MDPI stays neutral with regard to jurisdictional claims in published maps and institutional affiliations.

