1. Introduction
The COVID-19 pandemic had a pronounced impact on transport activity globally, either as a direct consequence of mobility restrictions or as a result of lower levels of economic and social activity. A return to a post-pandemic “normality”—once the virus and the disease are under control—will probably permit a recovery of personal mobility to levels broadly comparable to the past. Nevertheless, the pandemic also triggered changes in transport user behaviour and tilted the balance of business models for transport operators. The emerging structural changes in transport supply and demand may raise challenges for the future evolution and sustainability of the transport system.
Traffic and transport operations are a reflection of economic and social activity [
1]. The high correlation between economic indicators and transport activity is well documented, but their causal link should not be taken for granted. Different trajectories as regards the speed and shape of recovery on the economic side may lead to diverse paths in the recovery of specific transport markets. A fast (“V shaped”) recovery would probably minimize the relative impact for most transport modes, while a slow (“L shaped”) recovery could lead to important shifts in supply and demand. Even if the economy recovers to the same level of economic output, structural economic changes brought on by the pandemic may result in different pictures as regards transport activity (e.g., an increase or decrease in the share of services—and especially tourism—for a specific area, either as a policy choice or as the result of global trends).
The pandemic crisis is already considered as one of the greatest shocks in the last 60 years, strong enough to modify future needs and social values. Several of the changes in personal priorities may persist in time, even after the eventual recovery. On one hand, social distancing has accelerated the adoption of technological solutions that help avoid transport. Teleworking, video-conferencing, and other remote collaboration methods have long been seen as potential solutions for reducing transport demand. The extensive adoption of such solutions by a large share of enterprises during the crisis will probably result in an increased share of employers and employees continuing to use them once the confinement measures are over. On the other hand, the increase in e-shopping during the crisis—as a response to limitations in retailing, risk aversion, and social distancing—is also expected to be sustained in the future. Either as employees or as consumers, many individuals will limit trips that can be avoided through technology, or simply because they would consider them unnecessary.
Regardless of how soon the COVID-19 threat is over, the uncertainty concerning the possibility of new waves of the virus or other pandemics will remain in the near future and will probably lead to a higher risk aversion towards transport and travel. Apart from decreasing the trip frequency at an individual level, the user preferences concerning transport modes and trip distances will also possibly change. Public transport is especially vulnerable to the changing trends in society and technology [
2]. Emerging mobility technology and business models already threatened the role of public transport demand by shifting users to ride-hailing services, shared-mobility applications, and micromobility solutions (electric bicycles, e-scooters, etc.). In a post-pandemic situation, it is possible that a part of the population will avoid public transport due to disease transmission concerns and opt for more individualistic forms of mobility. Such behaviour can shift demand back to private cars, biking (conventional or electric), micromobility, and even walking. However, this will probably favour own vehicles as opposed to shared-mobility options. “Sharing economy” services such as ride hailing, ride sharing, and other emerging MaaS (Mobility as a Service) applications are, therefore, expected to face important viability problems as a result of the loss of income during the confinement period and the decreased demand afterwards.
The main question that we address in this article is how passenger transport can evolve given the challenges of the post-pandemic recovery. We analyse the main factors that can influence future supply and demand and explore how they may affect trip generation, distribution, and modal split. We combine several conventional and innovative data sources with a detailed strategic transport model in order to present quantitative estimates under various scenarios.
The work presented here focuses on the European Union (EU), but most of the issues and trends discussed are relevant at global level.
The structure of the rest of the article is as follows.
Section 2 describes the background for this work, based on a review of the—still sparse but rapidly growing—literature on a wide range of issues related to the pandemic and transport.
Section 3 presents the materials and methods used for the analysis, consisting of new sources of data and tailored models. The results are summarized and discussed in
Section 4. The conclusions—from a policy perspective—are presented in
Section 5.
2. Background
Given the obvious dramatic consequences from a public health perspective, a wide array of policy measures and personal behavioural patterns were adopted in order to limit the evolution of the COVID-19 pandemic. Mobility restrictions were one of the main non-pharmaceutical interventions introduced at various levels—from local to national—and varying timeframes throughout the world. Limiting mobility had a direct impact on transport activity, with a drastic decline of passenger volumes for all transport modes [
3].
Social distancing, either forced by restrictions or as a personal choice to avoid risks, increased the share of telework or e-learning and reduced the number of public activities and events [
4]. In most European countries, the pandemic led to a significant decrease in mobility, expressed as a lower number of trips per day and shorter distances per trip [
5,
6,
7]. The modified mobility patterns also affected the modal split. Walking and cycling increased their share of trips—while public transport saw ridership plummet—even without mobility restrictions or stay-at-home guidelines [
8]. Passenger car traffic initially decreased by 60% to 90% (in March–April 2020). With mobility restrictions gradually relaxing, car use eventually increased its share in total trips and total distance [
9,
10,
11].
Railways suffered the multifaceted impact of decreased commuting at local level, travel restrictions at inter-regional level, an overall drop in tourism demand, as well as a general avoidance of public transport means. In addition, capacity constraints were imposed on trains in order to meet social distancing rules [
12]. From a public transport operator’s point of view, it is challenging to balance the decreasing levels of ridership during and after the pandemic with a schedule and capacity that meets the new (and probably very volatile) patterns of demand [
13]. An additional challenge for public transport and shared-mobility applications is that users expect higher health and safety standards but with fares and prices remaining at pre-COVID levels [
14]. The combination of the two challenges is already raising concerns as regards the viability of public transport systems [
15]. Longer-distance trips faced even stricter restrictions. Air transport was the most affected transport subsector, with more than 90% of programmed flights in the European Union cancelled in April 2020, and total activity still—in April 2021—below 50% with respect to normal levels. A sign of the criticality of the situation in aviation is that governments provided ample financial support to their national airlines in practically every country across the world [
16].
Apart from the mobility restrictions and the slowdown of economic and social activity, the pandemic brought behavioural changes that may have a longer-term impact on transport and mobility.
Teleworking became the norm for a large share of jobholders, especially in services. While it was easier to implement in countries and sectors with a high level of digital preparedness and with pre-existing facilities in favour of teleworking, the technological catch-up and cultural adaptation was fast, so much so that teleworking and telecommuting can be seen as potentially standard options for work in the future. However, even where most conditions for remote work are available, several surveys indicate that a large part of employees would still consider that physical presence at least a few days a month or a week should be maintained [
17]. Moreover, one has to take into account that the main driver behind the extensive adoption of teleworking was to protect the health and safety of employees while ensuring that the productive activities continued, in other words a temporary patch rather than a systematic change [
18]. Since organizational readiness and willingness differ significantly among sectors and specific enterprises, the uptake and potential continuity of teleworking can vary significantly [
19]. Nevertheless, a considerable number of jobs may still allow a certain flexibility in the future, in situations where both the employers and employees appreciate the benefits.
E-learning, the technology-enabled solution that allowed the continuity of educational activities, was equally widespread but is probably a less viable option in the long term [
20]. Education at all levels witnessed a rapid digital transformation during the pandemic but also encountered several cultural, social, and performance barriers that probably prevent its long-term substitution by online alternatives [
21]. While the educational community appears to have accepted e-learning as an option during the pandemic, most students, teachers, and professors would prefer to return to a predominantly physical presence when the crisis is over [
22,
23]. A post-pandemic normality would probably see a return of primary, secondary, and most parts of post-secondary education to their pre-existing patterns. It is possible that some fully online programmes—mainly at the university and graduate level—become more widespread after the experience gained during the pandemic, but the impact on daily mobility patterns would probably be marginal.
Online shopping was already a widely adopted practice but also registered significant growth during the pandemic. The main reasons appear to be the unavailability of options for physical shopping, in the areas where retail activities were restricted, and a fear-induced avoidance of physical purchases when online alternatives were available. There is a generational effect present in the frequency and share of an individual’s choices, with younger generations already being frequent online shoppers [
24]. The pandemic probably accelerated the uptake by consumers who did not use e-commerce before and who in the future continue considering it as an option. It can be argued, however, that the main driver for online shopping during the pandemic was necessity and not preference. Once the situation returns to normal, consumers will probably revert to mostly physical (“brick and mortar”) retail activities, which appear to form part of wider social and entertainment activities.
Active transport (walking and cycling) became a more frequent choice, and a part of this trend may be maintained post pandemic [
6,
9]. To a large extent, active transport replaced other means, especially public transport, as a form of social distancing but also benefited from the shift in mobility patterns during the pandemic. Fewer trips to work, school, or the shops led to more trips for exercise, recreation, or simply psychological well-being. One can expect a relative decline in active transport activity once all other mobility options and destinations are again available, but it is likely that a share of users who discovered walking or cycling during the pandemic continue considering them as their main transport mode. In addition, given the environmental and health benefits, local authorities are expected to promote active transport in the future and build on the current momentum [
25].
The biggest unknown though is how the psychological aspects of individual behaviour will evolve. The pandemic induced a generalized risk aversion, with a significant part of the population avoiding certain social and business interactions or not strictly necessary trips. While the perception of risk remains, people may continue avoiding crowds, face-to-face meetings, or business trips. From the transport point of view, videoconferencing will probably remain as a major—if not main—option for meetings, decreasing significantly the demand for transport for business purposes. Tourism to far-flung destinations may lose attractiveness in favour of places closer to home, in case another global emergency appears. The choice of trip distance, frequency, and mode depends on age, income, gender, and profession (among many other factors) [
26], but recent surveys suggest that a significant part of the population will remain cautious [
27,
28]. It should be noted, however, that risk aversion is highly correlated with the perceived severity of the pandemic situation [
29]. It is probably reasonable to assume that personal precautions will relax with time. A rebound effect is also possible: the accumulated unsatisfied demand for social interactions and travel may lead to increased mobility levels when people feel free to move again.
3. Materials and Methods
We explore the potential evolution of mobility patterns after the pandemic using a combination of an extensive travel survey and a strategic transport model at the European level. The association of socioeconomic and demographic factors with individual transport activity captured by the survey allows the fine-tuning of the model to reflect the extent of the impact of changing user choices after the pandemic.
3.1. EU Travel Survey
The EU Travel Survey is a CAWI (Computer-Aided Web Interview), large-scale survey, which contains 26,500 responses across the EU [
30]. We used the most recent wave available—that of year 2018. The goal of the survey was to identify the factors that influence user choices for transport and mobility in terms of transport mode, trip distance, frequency, and purpose, as well as preferences as regards new technologies, teleworking, and online shopping. A representative sample of 1000 respondents in each EU Member State was chosen (with the exception of the three smallest, where 500 respondents were selected: Cyprus, Malta, and Luxembourg). The sample was segmented within each country according to the main socioeconomic groups: age, gender, employment status, and education level. The selection of respondents used quotas for each group in order to ensure that the stratification of the dataset reflects the relative frequency of each group in the population of each EU Member State. Furthermore, at least for larger countries, the sample selection also considered the region of residence. The data collected by the survey allow the comparison of mobility choices between different segments of the population. Since it provides a wide enough sample to evaluate the correlation between each respondent’s choices and the other variables in the questionnaire, the resulting dataset serves as a basis for the estimation of model parameters and compensates for the lack of detailed statistics on travel behaviour that would be useful for the analysis presented here.
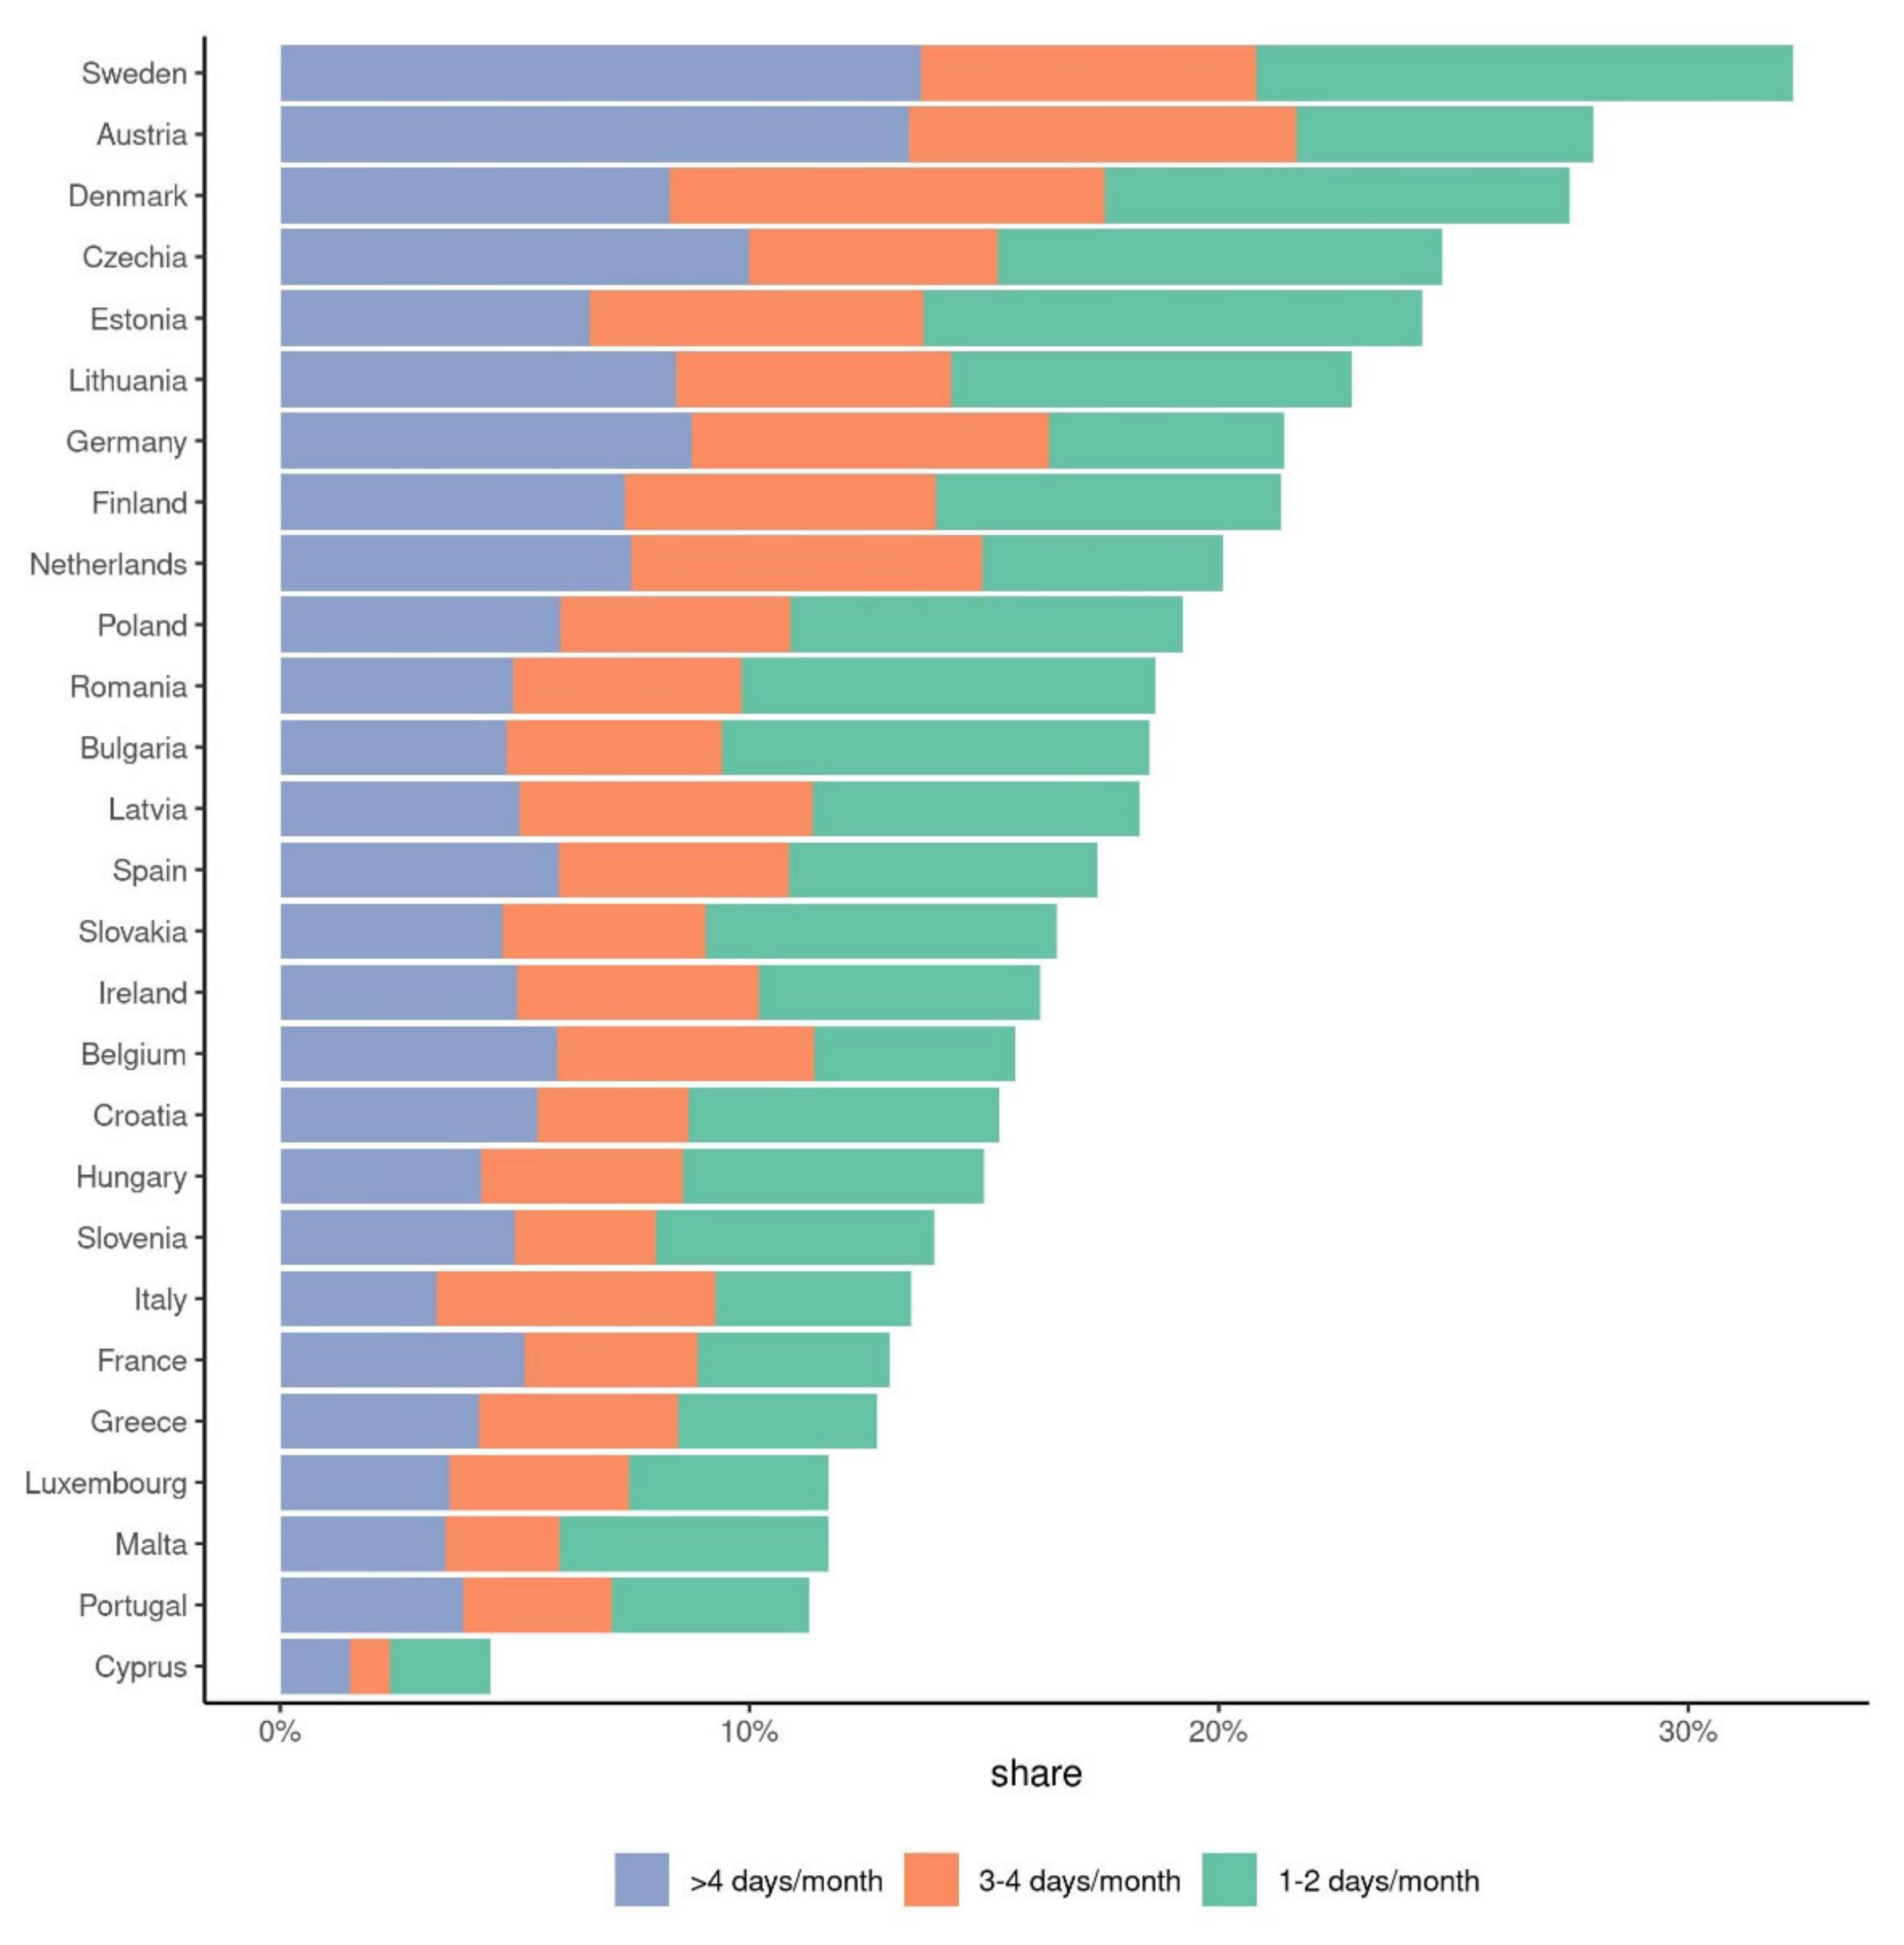
The dataset provides useful insights in relation to the challenges identified in
Section 2 and
Section 3. For example, the disparity of the frequency of teleworking across EU Member States is revealing (
Figure 1). In Sweden and Austria, teleworking appears to be a quite extended practice, with more than 10% of respondents working remotely at least one day per week and 25–30% at least occasionally. On the other extreme, teleworking is marginal in Cyprus and quite limited in Portugal, Malta, and Luxembourg. The latter is surprising, given the high share of the services sector in the country’s economy, and can be attributed to the lack of legislative provisions and the fiscal complications involved (both of which have been addressed by new measures in 2020–2021). The overall picture suggests that several factors come into play: structure of the economy, cultural aspects, digital preparedness, urbanization levels, and regional development, among others.
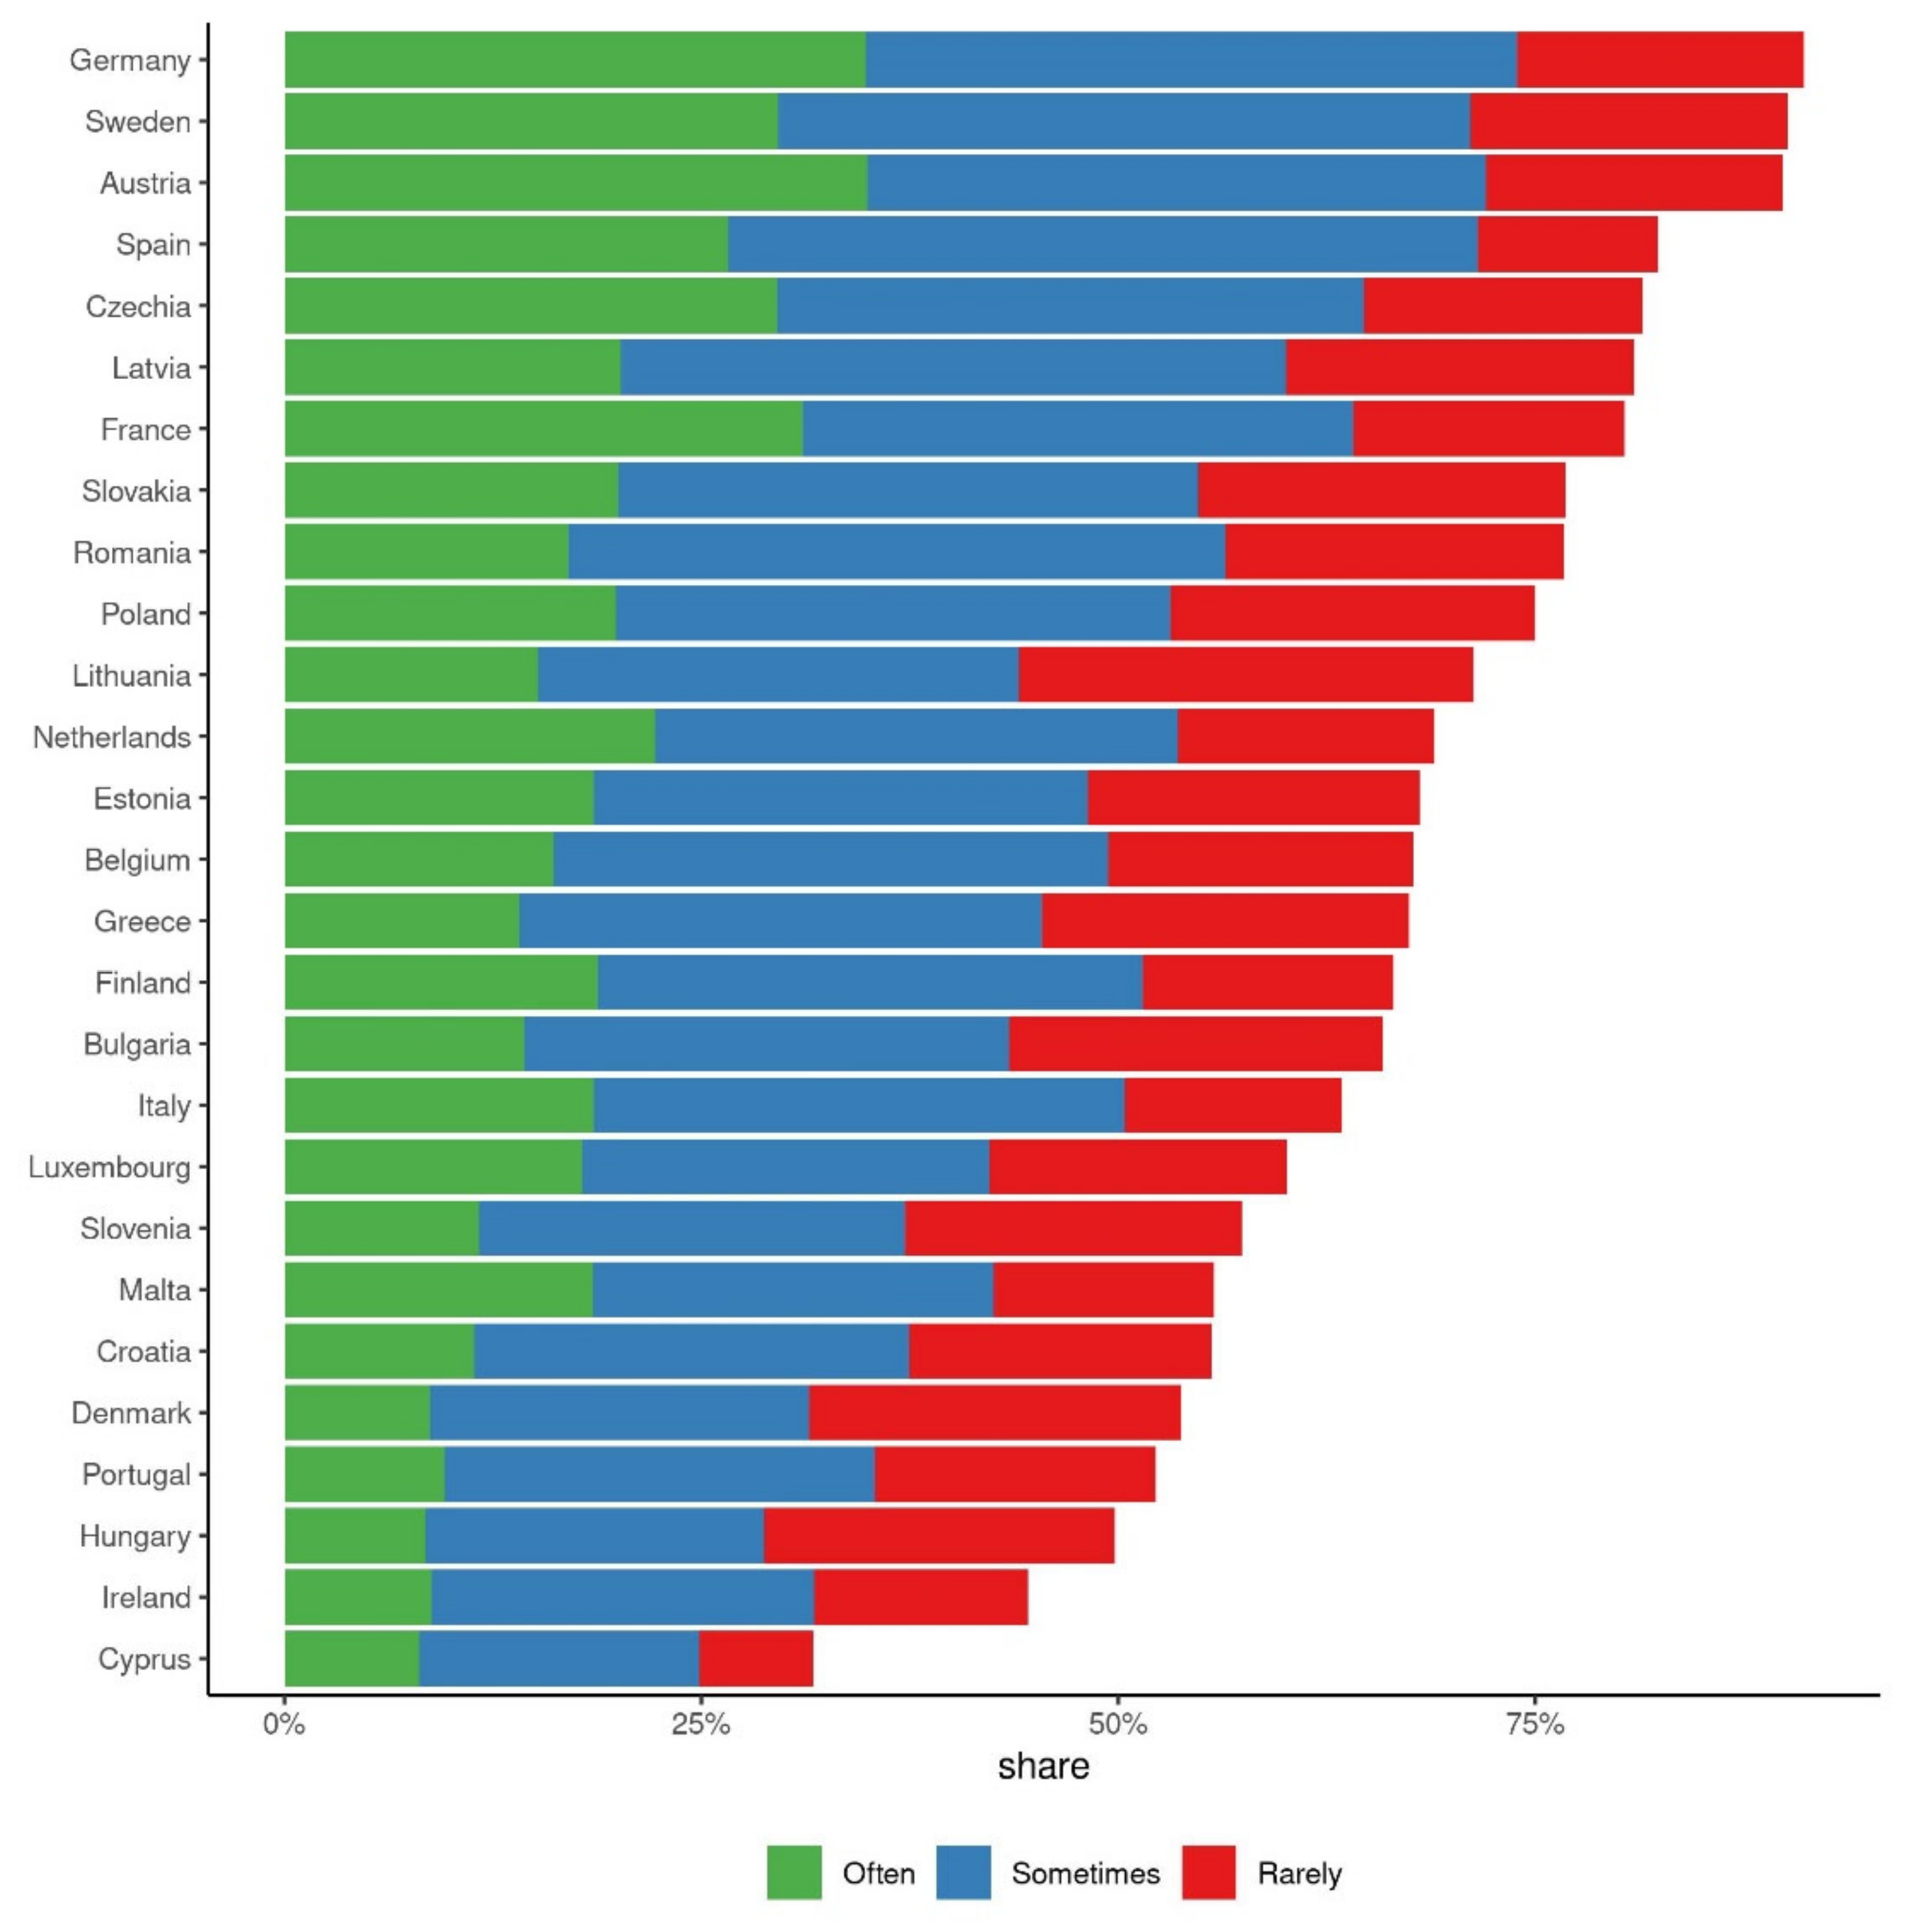
Country-level differences exist—but not as acutely—also in the example of the frequency of online shopping (
Figure 2). While at least 50% of respondents use e-commerce at least occasionally in the majority of EU Member States, some of the smaller countries appear to have less-developed markets or habits that would allow a more widespread adoption. It is noteworthy though that already in 2018 online shopping was rather established, and it is not surprising that it quickly extended to cover the needs as an alternative to physical shopping during the pandemic.
A more detailed frequency analysis of the main survey variables used in this work is available in
Table A1 (
Appendix A).
3.2. TRIMODE Model
The TRIMODE transport model [
31] is based on the classic four-step approach: trip generation, trip distribution, modal split, and network assignment. The first main outcome of this model is the estimation of full Origin–Destination trip matrices, by mode of transport, for the different demand segments at regional level. The network assignment module distributes the passenger flows over the transport network in order to calculate transport activity (pkm) as well as travel distance, time, and costs associated with the trip routes (including, in the case of collective modes, in-vehicle travel times, ticket fares, transfer penalties, etc.).
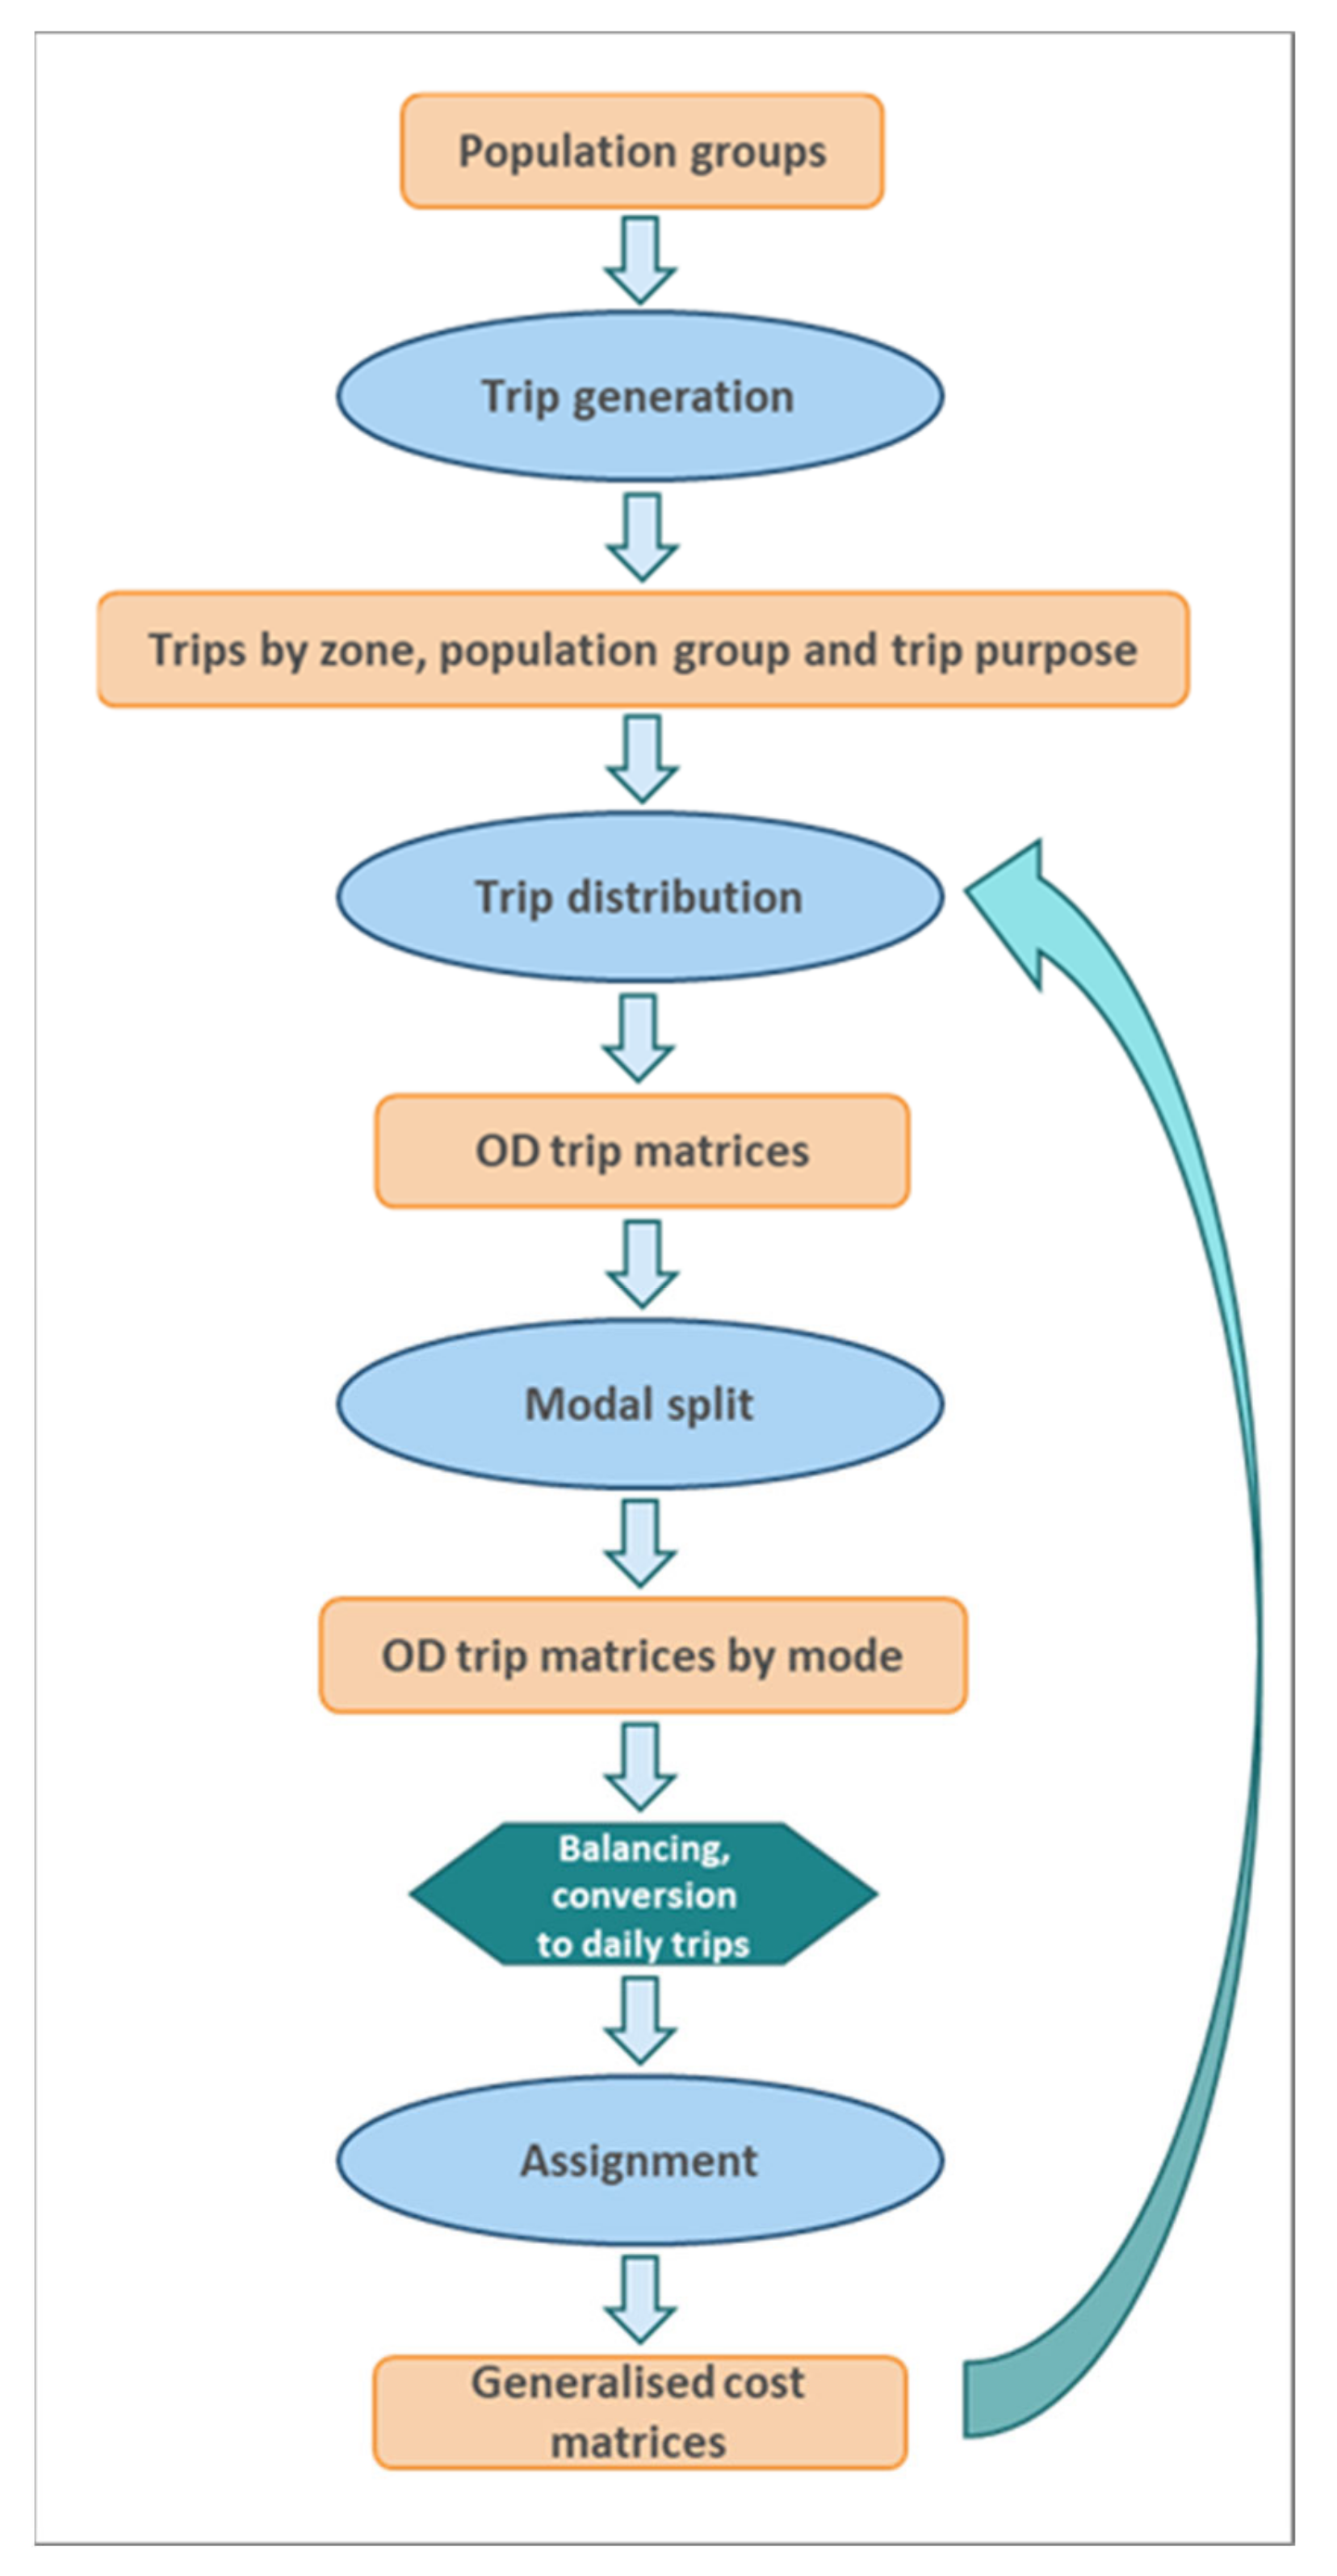
The model was calibrated on observed passenger activity with the objective of matching the country-level statistics at country level across the EU (Statistical Pocketbook) for the base year (2010) and the validation year (2015). The wide geographical coverage of TRIMODE and the limited spatial disaggregation of available statistics at the EU level determine the scope of the zone system, based on NUTS 3 with further detail in selected zones. The estimation of passenger transport demand is based on exogenous assumptions on demographic trends (e.g., population, age distribution) as well as input data estimated endogenously in other components of TRIMODE such as the distribution of population, jobs, and economic activity by zone, overall income trend, or transport cost evolution. Based on these assumptions, the model can produce projections of transport activity for the future, with different time steps and horizons. The flowchart of the main transport module of TRIMODE is shown in
Figure 3.
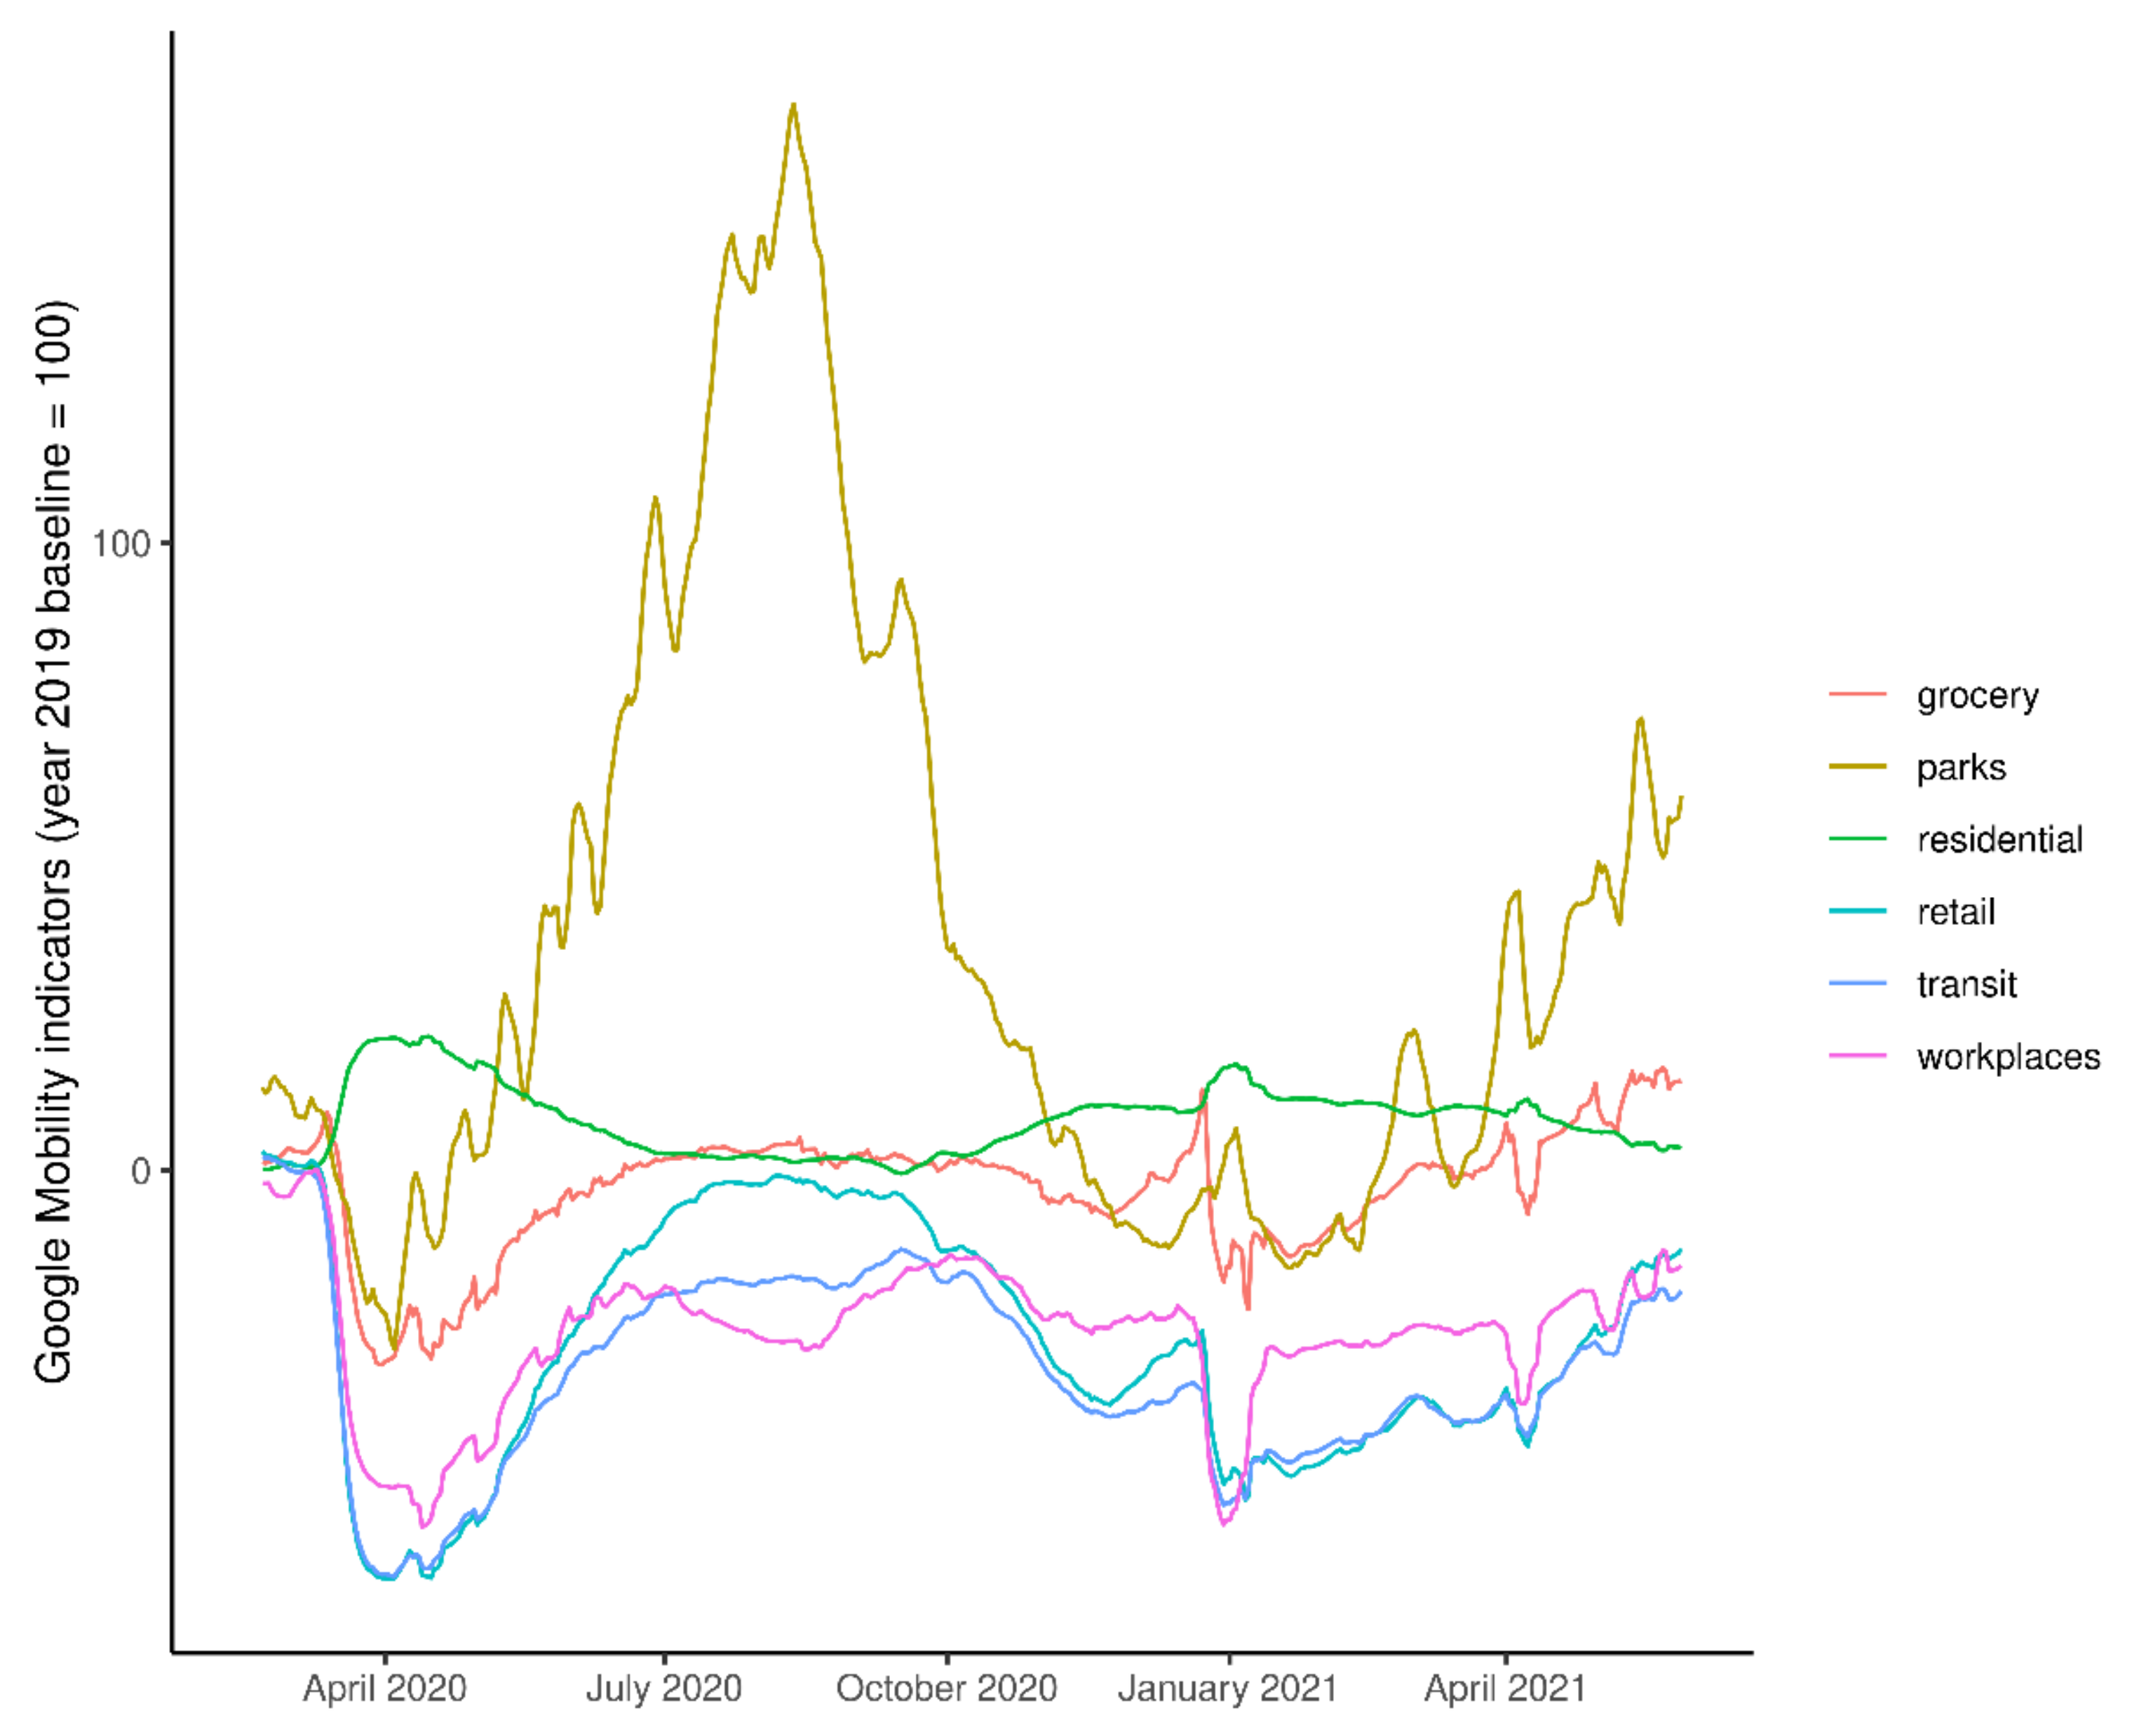
For the work presented here, we adapted the TRIMODE model by introducing updated trip matrices that allow the reproduction of historical transport activity data for the period for which aggregate statistics are available (years 2016 to 2019). For the year 2020, we now-casted transport activity levels by mode and zone using a variety of sources that allow a comparison between 2019 and 2020. These include Apple (Cupertino, CA, USA) [
32] and Google (Mountain View, CA, USA) [
33] mobility indicators, as well as detailed mobile phone indicators at the NUTS 3 level that cover most of the EU [
34]. The indicators (
Figure A1 and
Figure A2 in
Appendix A) permit the disaggregation of mobility trends by trip purpose and mode and, subsequently, allow the model to reflect changes in user behaviour, especially as regards work-related trips. For air transport, real data on activity were extracted from the SABRE Market Intelligence database [
35].
The model projections for future years (2022 to 2030) use modified parameters and assumptions that simulate the potential behavioural changes discussed in
Section 1 and
Section 2. The main updated inputs to TRIMODE are summarized in
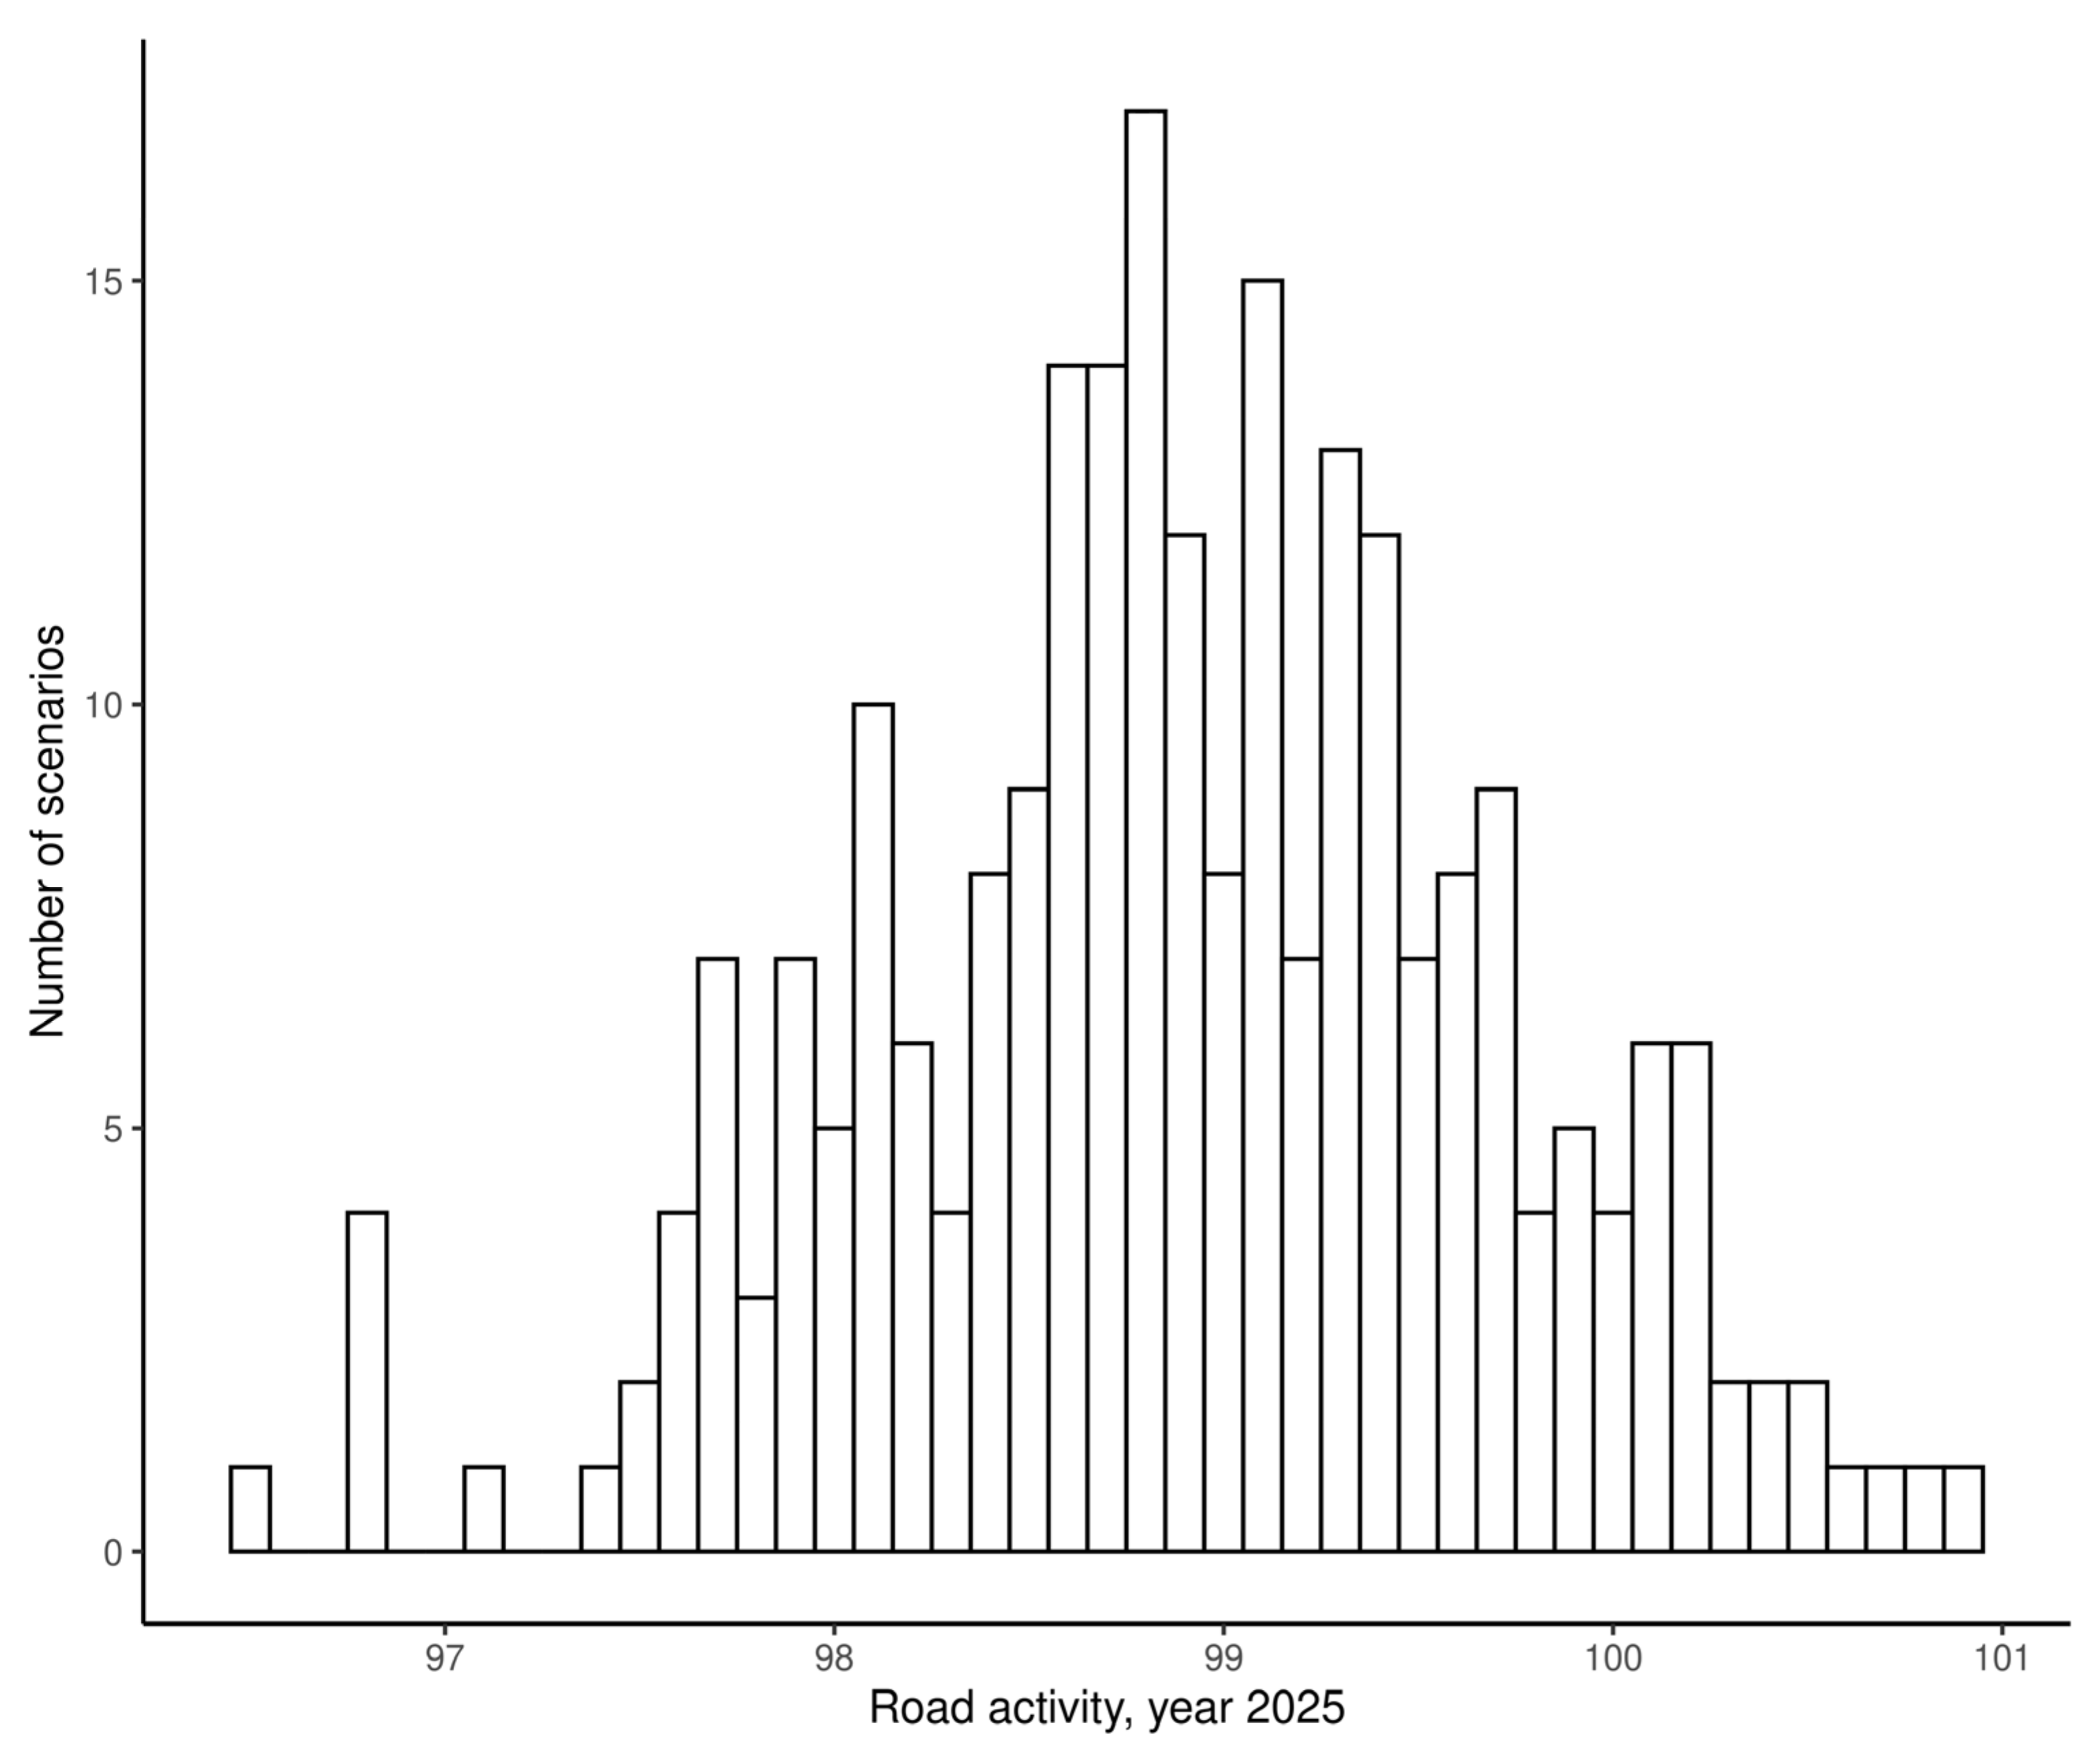
Table 1. The range of values refers to year 2022 (in comparison with the 2019 values) under the assumption that the pandemic will practically be over by the end of 2021. Depending on the aspect modelled, each parameter follows a distinct gradual recovery trend after 2023. The impact of the assumptions for each parameter on the model results is directly proportional to the variance in the distribution of the values selected. As a consequence, the share of the population that will telework in the future is a main determinant of surface transport activity and modal share. The demand and preferences for business and tourism are critical factors for primarily aviation but can also have rebound effects on the other modes.
Figure A3 (
Appendix A) provides an example of the sensitivity of the model to different parameter values.
4. Results
We simulated the potential post-pandemic evolution of transport activity in the EU with TRIMODE, using the midrange of each assumption and parameter described in
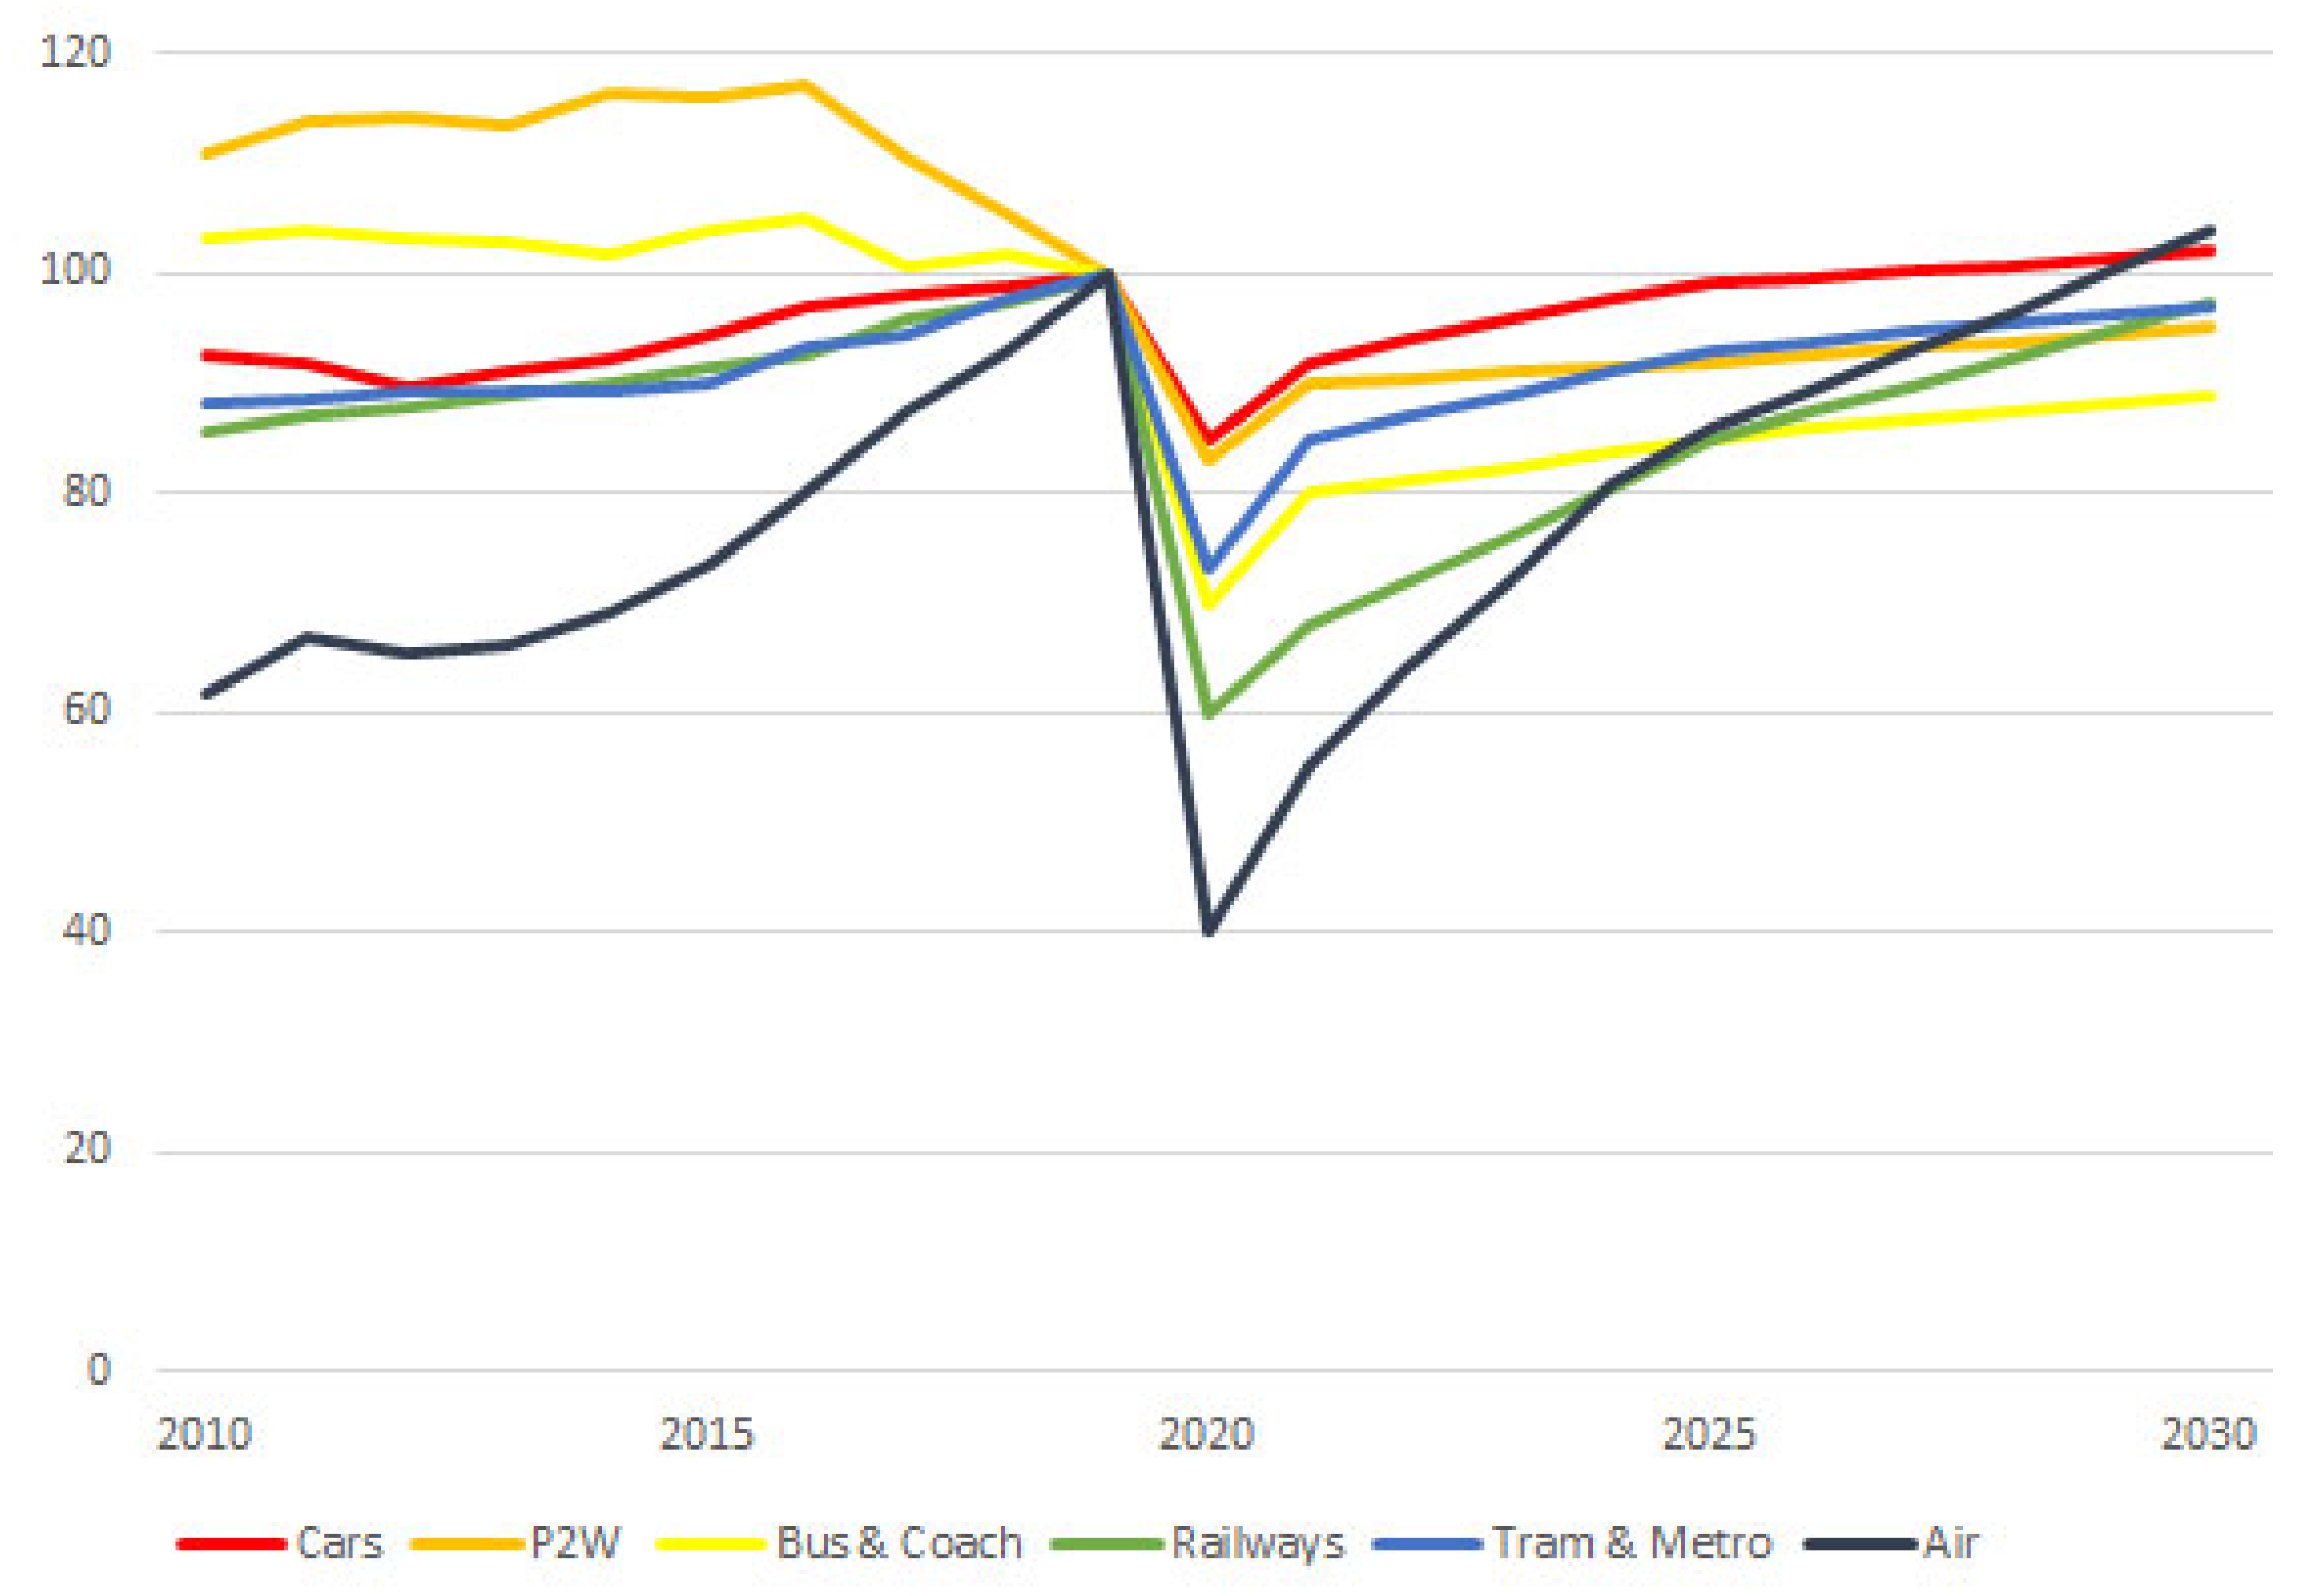
Table 1. The resulting projections describe a scenario of a gradual recovery of activity for each mode (
Figure 4). Being the direct outcome of economic and social activity, transport and mobility should normally rebound in line with the speed of recovery back to normality. Four major forces influence the future trajectory of recovery for each mode:
Mobility restrictions: stay-at-home rules, limitations in international, inter-regional, or even interurban trips were the main cause of transport activity during most of 2020 and 2021, especially for long-distance travel. Assuming that the pandemic will be practically under control by the end of 2021 or early 2022, we can expect that no such restrictions will be in place afterwards.
Economic activity: the recession that in most EU Member States started in the second trimester of 2020 was the second factor that limited transport demand. According to the European Economic Forecast projections used here as input [
36], Gross Domestic Product (GDP) levels will return to the 2019 levels by year 2024.
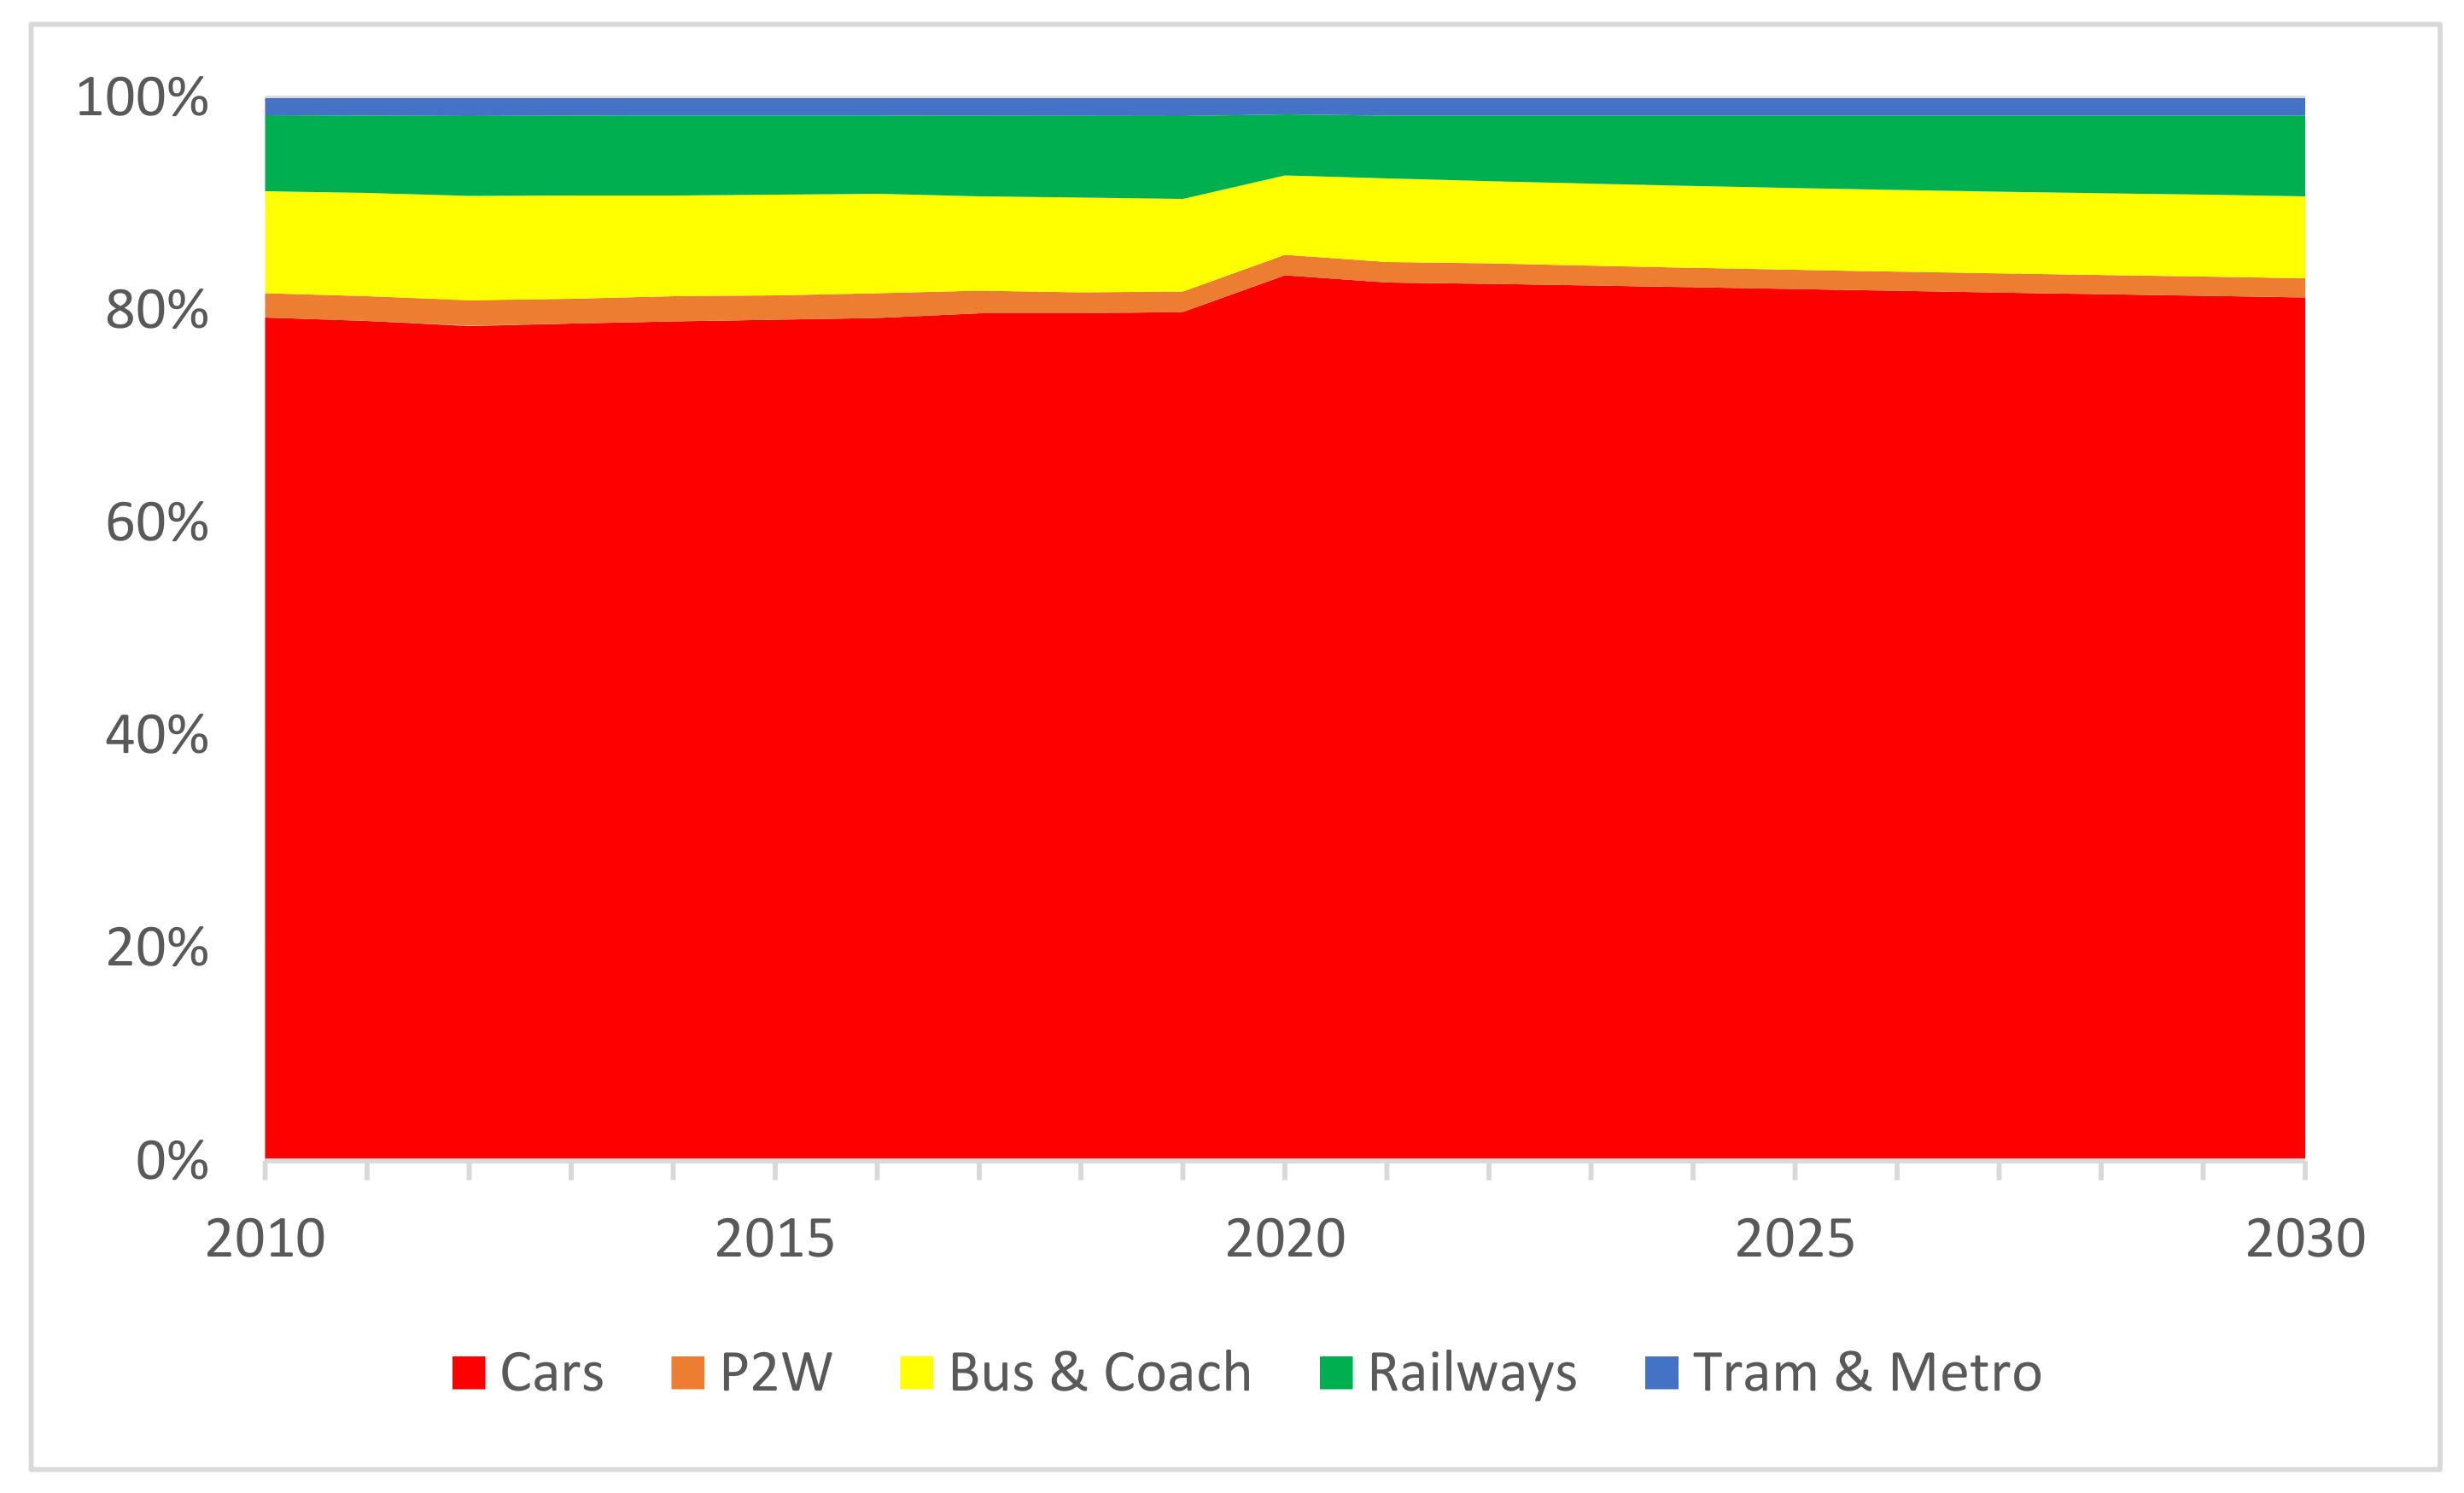
Underlying trends in modal preferences: the data from 2010 to 2019 display diverging tendencies in modal activity. Car use had not apparently reached its peak yet and was continuing its growth. Air transport was fast growing and—during the pandemic—the mode that was hit the most. Railways, metro, and tram maintained a steady growth, while busses and coaches and, especially, powered two-wheeled vehicles (P2W) appeared to be losing their appeal. We can expect that these general trends, in principle, continue after the pandemic. The difference though will lie on the speed of recovery of supply and demand for each mode.
Post-pandemic behavioural changes: the changes in user lifestyles brought by the pandemic can still influence the evolution of demand in the medium term, after the main restriction- and recession-related impacts have been absorbed. The new patterns—discussed in the previous sections—can hold back the full recovery of transport activity in the short term but will probably have a limited impact in the medium term. They can, however, affect the relative share of public and private modes of transport for longer. New work patterns and (short-term) risk avoidance can move users away from public transport, increasing car ownership and use. They can also contribute to people moving out of city centres, to larger and more comfortable residences where private means of transport are more commonly used. Walking, cycling, and electric/micromobility may also benefit, but their share in terms of total activity (i.e., in terms of passenger * kms) will not increase significantly due to their short average trip distances.
Focussing on surface transport, the model projections suggest a reinforcement of the dominant position of cars—in terms of modal shares—in the EU as a result of the pandemic (
Figure 5). Car passenger activity represented almost 80% of total (motorized, surface) transport activity in the EU, maintaining a rather constant share throughout the 2010–2019 period. We estimate that this share increased by almost 4 percentage points in 2020, the equivalent of 200 billion passenger * kms, a considerable quantity that defies transport policy objectives at EU level and in most Member States. Even though the shift to cars appears to be a short-term reaction to the situation during the pandemic, the medium-term challenges for public transport may impede a fast rebalancing of modal shares.
Addressing these challenges from the transport policy perspective would require a combination of short- and long-term actions. In the short-term, ensuring that transport operators are able to survive the pandemic and the ensuing transition to higher demand levels entails—in many cases—the provision of financial support.
The high capital costs of airlines and airports made the viability of several actors in the immediate future questionable. The outlook for aviation in the next 3–4 years is also full of uncertainties since air travel will be greatly affected by a decrease in demand for tourism and business. The risk of being stranded in a foreign destination, the perceived sense of exposure to diseases when travelling in airplanes or through airports, the inconvenience caused by additional airport controls that will be possibly implemented, and the substitution of business meetings with telematic solutions are among the factors that will limit future growth. In addition, in the context of a potential economic slowdown, overall demand would decrease even further, making the prospects of the sector even more pessimistic. Several countries—within and outside the EU—are already aiding their national carriers and airports, potentially raising issues of unfair competition and distorting the landscape in the global air transport market, but also ensuring connectivity and indirect support to other sensitive sectors of the economy such as tourism.
High-speed and conventional rail face—to a certain extent—similar challenges. Trips in the 400 to 1000 km distance band though will probably not be affected as much as the longer-distance trips by air, and rail may benefit from the substitution effect of trips not realized by air. However, trips that require indirect connections through intermediate stations or combinations of more than one transport mode are likely to be less attractive to travellers. A major risk for railways is that decreased levels of demand may lead to operators reducing capacity in order to save costs. Lower frequencies or fewer serviced stations, however, can further weaken demand and increase the financial pressure on the supply side. For shorter distances, public transport will also have to adapt to lower ridership levels and will require additional financial support in order to maintain its attractiveness for users.
In addition to the demand-side challenges, limitations to the number and density of passengers and personnel in vehicles, vessels, and aircraft (and stations, ports, and airports) can be expected, at least for the first months of the gradual return to normality. Such measures will be necessary in order to minimize the potential spread of future waves of infectious diseases and—at least as important—to provide a sense of security to users. The drawbacks, however, would be the cost increase and service limitations for transport operators and the added inconvenience for transport users.
From a longer-term perspective, it is important to ensure sufficient investment in transport infrastructure, equipment, and services, which can affect future supply. Public budgets are being channelled towards the post-pandemic crisis mitigation, and the private sector may be facing liquidity problems, in both cases, limiting the amounts available for transport-related investments. The construction of transport infrastructure and the technology-led innovation in vehicle manufacturing are two sectors with a large economic impact in the EU that may strongly be affected by a financial crisis. In addition, lack of funding or risk aversion may limit the prospects of innovation in a number of emerging technologies and applications in transport. These include the start-up ecosystem of new mobility options and business models or high-uncertainty concepts such as the hyper-loop. The impacts on clean, connected, or autonomous vehicles would be mixed and depend on a combination of many factors. While significant progress has been made in the last decade, ensuring public policy support, private sector investment, and user acceptance in the current situation and in the short-to-mid term can be challenging.
Numerous studies have demonstrated the critical role of public policy—at all levels—in influencing the evolution of the transport sector through strategic objectives and regulation [
37,
38]. At the EU level, this is evident by the impact that the climate change and air quality policies have had on transport policy from the national to the local level, with repercussions ranging from vehicle technology to urban traffic management. How EU policy priorities will be re-orientated as a response to the post-pandemic challenges will to a large extent shape how the transport sector will evolve. At local policy level, it can be an opportunity to promote micromobility and clean transport modes to improve the environmental quality but also support innovation. In this context, the European Green Deal [
39] priorities for mobility are compatible with a post-pandemic strategy for the transport manufacturing and service sectors and can be used as an opportunity to influence the future development of the transport sector. Guiding the support for transport operations towards technologies and business models that meet those priorities is an option that can deliver longer-term benefits. The need to stimulate innovation in transport and mobility applications and services will probably increase due to the post-pandemic uncertainty. There is a risk of a decrease in both private and public investment in transport innovation due to priorities shifting to health issues or funds being limited. The improvement of transport governance and the development of innovative mobility solutions with the engagement of citizens will be crucial to ensure that the future of transport is cleaner and more equitable than its car-centred present.
5. Discussion and Conclusions
The disruptions caused by the COVID-19 pandemic will leave their mark on transport and mobility for much longer than the duration of the emergency. Transport activity will probably rebound once restriction measures are removed and economic activity gradually recovers. Nevertheless, the rate of recovery will vary across transport modes and EU Member States and will depend to a large extent on the speed of economic growth, the cost of the measures to support it, and the changes in the supply and demand of transport services as a result of the direct and indirect impacts of the pandemic. It is still early to draw a clear picture of the full impacts and the repercussions on the economy and transport activity will probably still be visible at least 3 years after the crisis.
In the work presented here, we explored the potential types and direction of the changes in demand as a repercussion of the crisis caused by the pandemic. The impact on transport and mobility depends on who/where/when/how/for how long will change mobility patterns. There is obviously a high level of uncertainty as regards how the post-pandemic society and economy will evolve. Neither the duration nor the intensity of behavioural changes can be forecasted with confidence, let alone be accurately evaluated in terms of their impacts on mobility. We have identified though certain trends in data and applied assumptions based on the scientific literature that can indicate a range of possible developments that are highly relevant for transport policy.
On the demand side, we can expect a short-term reduction in the number of trips, average trip distance, and use of public transport. Risk aversion and self-imposed social distancing may result in modifications of the current trends in personal mobility and user preferences. In the medium term, the recovery trend will also depend on how the supply side adapts during the transition back to normality. A possible economic slowdown can further complicate supply of transport and mobility services, as well as investment and innovation in the sector.
The response to the COVID-19 pandemic and the recovery path in its aftermath can influence the evolution of the various factors and make the need for improved governance and innovativeness even more urgent. Several transport operators have lost a significant part of their income since mid-March 2020, raising worries about their financial stability and their capacity to recover their services. Several operators, especially in air transport, will potentially require direct or indirect state support in order to maintain a level playing field while also ensuring the competitive position of EU operators at an international level. Public transport, railways, and aviation are particularly vulnerable to the impacts of changes in user choices, worsening economic conditions, and tightening public budgets. State Aid rules will probably need to be updated and potentially take criteria such as preserving connectivity or minimum service into account.
The projected trends in transport activity per mode raise worries as regards all three sustainability dimensions. On the economic dimension, a slow rebound for aviation, railways, and public transport can threaten the viability of services and connections, with additional indirect impacts on economic activity that depends on transport connectivity, especially tourism. Lower supply, fewer services, and possibly higher costs for public transport would affect equity since a considerable share of the population does not have the option of using other transport options. In addition, the increased car dependency will obviously signify a regression in terms of environmental sustainability. Public policy priorities in the aftermath of the pandemic would need to address these challenges and adopt measures that can sustain the shift to active travel; support public transport, railways, and aviation; and stimulate innovation in transport technologies and services.


